
Introducing broadband: Investment conditions, regulatory challenges and quality issues
Upload
trinhkhuongCategory
view
217download
2
ITU Regional Office for Asia and the Pacific
ITU Asia-Pacific CoE Training
Broadband Quality of Service - End User Experience
Session 6: Key Performance Indicators: Role and Decision Making
27-30 October, 2015 Bangkok, Thailand

• Objective: The session will detail the various key performance indicators used by operators and regulators in arriving at service level agreements and end user QoS monitoring

3
• Mobile KPIs – centric to equipment / infrastructure – aggregation of proprietary network counters – not standardized
• ITU-T Documents on Mobile QoS – Recommendation E.803
• Quality of service parameters for supporting service aspects – Recommendation E.804
• QoS Aspects for Popular Services in Mobile Networks – Supplement 9 to E.800 series of Recommendations
• Guidelines on Regulatory Aspects of QoS • Other ITU-T Recommendations on QoS cover
– Aspects of Terminal requirements – Aspects of end-to-end quality – Aspects of user perceptions

4
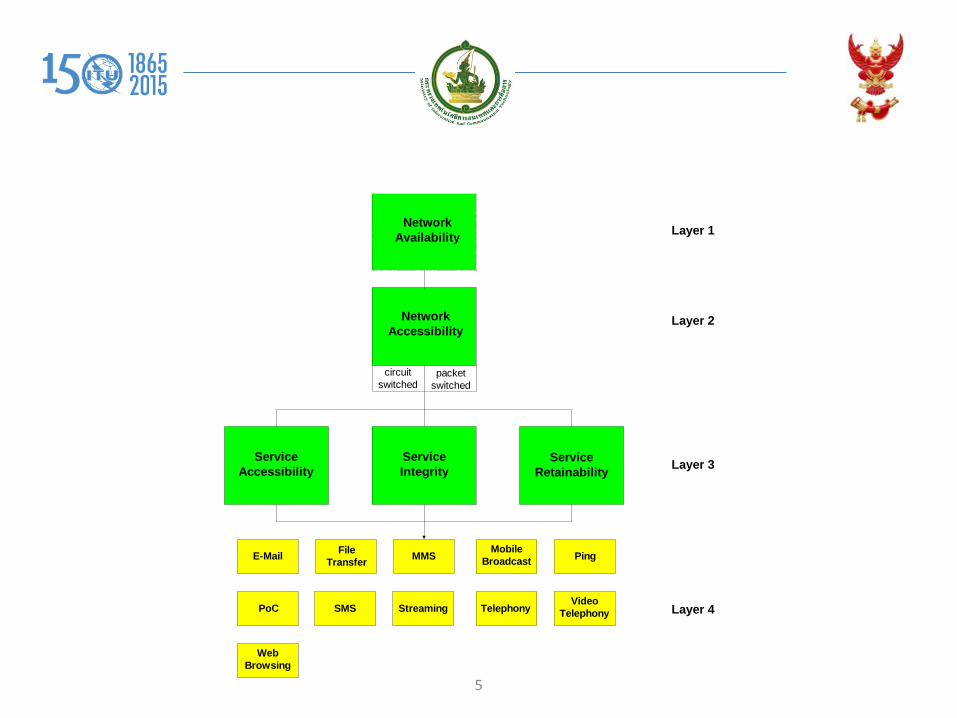
• QoS model for mobile has four layers. • First layer is the Network Availability
– defines QoS rather from the viewpoint of the service provider than the service user
• Second layer is the Network Access – from user's point of view basic requirement for all the other QoS
aspects and parameters • Third layer contains other QoS aspects
– Service Access, Service Integrity & Service Retainability • Different services are located in the fourth layer
– Their outcome are the QoS parameters as perceived by the user
5
NetworkAccessibility
circuitswitched
packetswitched
ServiceAccessibility
ServiceIntegrity
ServiceRetainability
TelephonySMS
PingFileTransfer MMS
NetworkAvailability
VideoTelephony
WebBrowsing
StreamingPoC
MobileBroadcast
Layer 2
Layer 3
Layer 4
Layer 1

6
• If we follow the layered approach – focussing on events that can be perceived by
the user – focussing on most relevant services in the
market
Telephony SMS MMS
Video Telephony Video Streaming Web Browsing

7
• Layer 1 • Radio Network Unavailability [%] • Layer 2 • Network Selection and Registration Failure
Ratio [%]
8
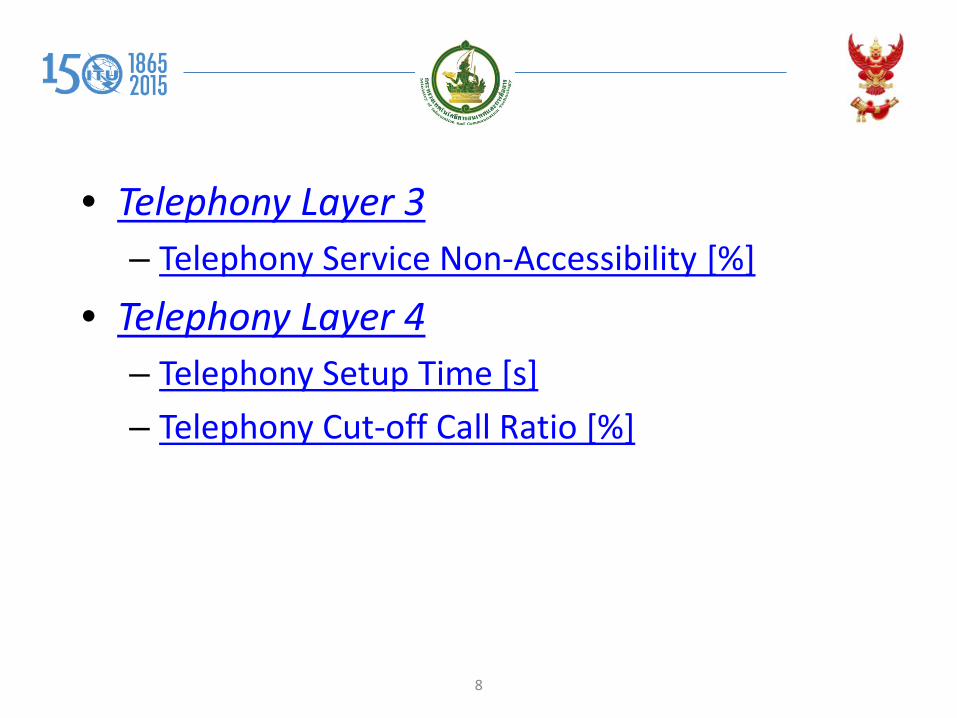
• Telephony Layer 3 – Telephony Service Non-Accessibility [%]
• Telephony Layer 4 – Telephony Setup Time [s] – Telephony Cut-off Call Ratio [%]
9
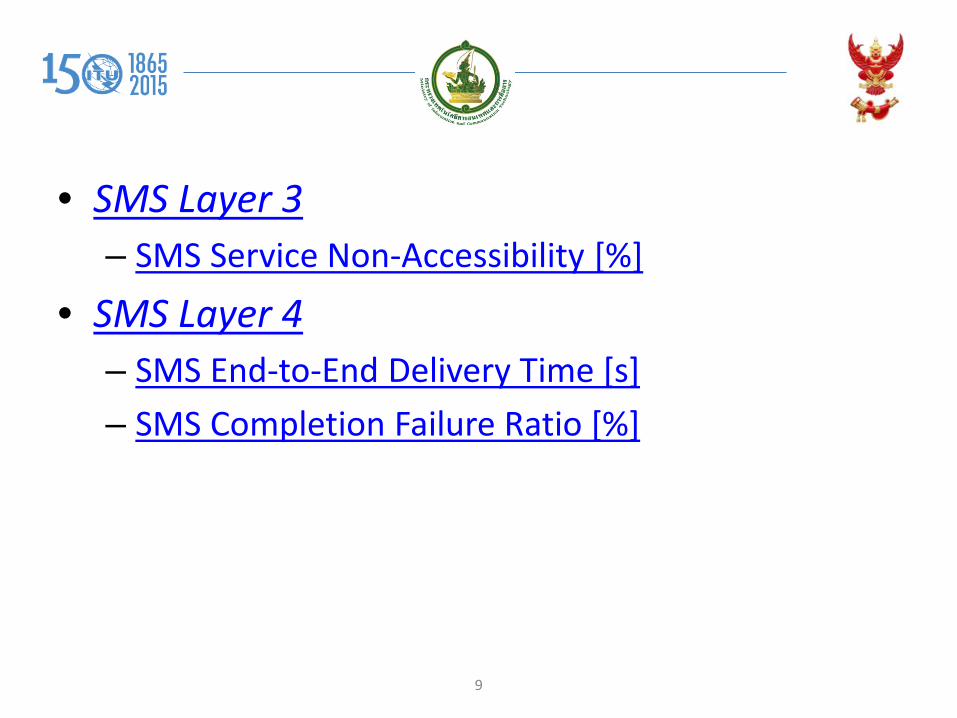
• SMS Layer 3 – SMS Service Non-Accessibility [%]
• SMS Layer 4 – SMS End-to-End Delivery Time [s] – SMS Completion Failure Ratio [%]

10
• MMS Layer 3 – MMS Send Failure Ratio [%]
• MMS Layer 4 – End-to-End Delivery Time [s] – MMS End-to-End Failure Ratio [%]

11
• Video Telephony Layer 3 – VT Service Non-Accessibility [%]
• Video Telephony Layer 4 – VT Audio/Video Setup Time [s] – VT Cut-off Call Ratio [%]

12
• Streaming Video Layer 3 – Streaming Service Non-Accessibility [%]
• Layer 4: – Streaming Service Access Time [s] – Streaming Reproduction Cut-off Ratio [%]

13
• Web Browsing (HTTP) Layer 3 – HTTP Service Non-Accessibility [%]
• Web Browsing (HTTP) Layer 4 – HTTP Setup Time [s] – HTTP Session Failure Ratio [%] – HTTP Data Transfer Cut-off Ratio [%]

14
• This approach would make us end up with > 20 QoS parameter – All relate to user perceptional events – But this is just end-to-end parameters – Many more parameters defined for events related
to network segments, hand-over etc.

15
Test Scenarios • Test scenarios need to distinguish the following
principal user cases – User-to-user services (typically telephony) – Store-and-forward services (e.g. SMS) – Information services (e.g. accessing the internet or
FTP download) – Push services (sender initiated transfer)

16
Considerations on trigger points • It can be assumed that
– any feasible test equipment will contain some kind of communication terminal (UE) which may be a special type (e.g. a Trace Phone)
– or a standard UE • Also, it can be assumed that each such device will provide
information from different communication layers – from Application Layer (close to the user interface) – down to lower layers, e.g. operating-system events, TCP/IP layer, or Layer
3 signalling information, which is used as trigger points for QOS PARAMETERS processing
– Typically AT commands can be used in majority of cases • Action is typically triggered
– by some emulated user action – causing some action on the air interface
17
• Process of event propagation is deterministic – allowing for kind of mapping between layers – associated with communication and processing delay in each stage.
• Choice of the layer for trigger point information retrieval – determines the view expressed in a QOS PARAMETER – choosing lower-level events ( Layer 3) gives more network-centric view – events on higher levels to produce views more user-related – for same QoS PARAMETER source layer for events used as trigger points should be the same
• In benchmarking, for all all networks under test – use same type of UE, and QOS PARAMETERS – use trigger points from the same layer.
• Changing the source layer for a given trigger point – changes in QOS PARAMETERS should be expected – calibration measurements required
• to assess influence on QOS PARAMETERS both quantitatively and qualitatively.

18
Telephony Measurements in the Network • Transaction definition and transaction types
– The basic transaction for telephony testing is equivalent to a single call to a counterpart extension. It is assumed that the call partner is typically a fixed-network type extension to avoid uncertainties related to a second mobile connection.
– Type is either Mobile Originated (MO) or Mobile Terminated (MT).
– It is assumed that once a connection has been established, for further measurements it does not matter which side has triggered it. Therefore, the audio data flow parameter will not be logically linked to the call type.

19
• Content quality – Content quality assessment data generated at
receiving end – For downlink content data storage is
straightforward – For uplink content, at some point in time results
have to be integrated – For assessing content quality of complete
transmitted speech samples, at least the following methods are possible:
20
• Content quality (ctd.) – Real-time assessment
• streaming mode • speech quality assessment algorithm determines MOS-
LQO real time – Offline assessment
• content first recorded • being processed later
– Data processing must ensure that only valid content quality data is processed
• inside the "connection active" time window
21
• Verification of usable two-way connection • Only calls with a valid two-way end-to-end
information connection shall be considered for content quality assessment (valid calls).
• Non-valid calls treated like dropped calls – with indicator for this particular cause

22
Statistics – Presentation of Results • Effect of different sample sizes in a measurement campaign
– based on the Pearson-Clopper formulas for calculation of confidence intervals
– valid in a generic way and even for small sample sizes – for higher sample numbers, the calculation of confidence intervals based
on the approximation of a normal distribution can be applied – Three different graphs are depicted: Sample sizes in the range:
• between 100 and 1 100 samples; • between 1 100 and 2 100 samples; and • between 1 000 and 11 000 samples.

23
0 20 40 60 80 100
05
1015
2025
30
Estimated rate in percent
Wid
th o
f con
fiden
ce in
terv
al in
per
cent
x
xx
xx xxx xxxx xxx xxx xxx xxx xxx xxx xxx xxx xxx xxxx xxx x
xx
x
x+
++
++++++++++++++++++++++++++++++++++++++++++++++
+
+oo
oooooooooooooooooooooooooooooooooooooooooooooooo
oxx
xxx xxx xxxx xxx xxx xxx xxx xxx xxx xxx xxx xxx xxxx xxx xxxx
x++++++++++++++++++++++++++++++++++++++++++++++++++
+
ox+ox+
100 Samples300 Samples500 Samples700 Samples900 Samples1100 Samples
0 20 40 60 80 100
01
23
45
67
Estimated rate in percent
Wid
th o
f con
fiden
ce in
terv
al in
per
cen
x
x
x
xx
xx
xx
xxx xxx xxx xxx xxx xxx xxx xxx xxx xxx xx
xx
xx
xx
x
x
x
x+
+
+
++
++
++
++++++++++++++++++++++++++++++++
++
++
++
+
+
+
+o
o
o
oo
oo
oo
oooooooooooooooooooooooooooooooooo
oo
oo
o
o
o
ox
x
xx
xx
xx
xxxx xxx xxx xxx xxx xxx xxx xxx xxx xxx xxxxx
xx
xx
x
x
x+
+
++
++
++
++++++++++++++++++++++++++++++++++++
++
++
+
+
+
ox+ox+
1100 Samples1300 Samples1500 Samples1700 Samples1900 Samples2100 Samples
0 20 40 60 80 100
02
46
810
Estimated rate in percent
Wid
th o
f con
fiden
ce in
terv
al in
per
cent
x
xx
xx xxx xxxx xxx xxx xxx xxx xxx xxx xxx xxx xxx xxxx xxx x
xx
x
x+
++
++++++++++++++++++++++++++++++++++++++++++++++
+
+0
000000000000000000000000000000000000000000000000
0
0xx
xxx xxx xxxx xxx xxx xxx xxx xxx xxx xxx xxx xxx xxxx xxx xxxx
x++++++++++++++++++++++++++++++++++++++++++++++++++
+
ox+ox+
1000 Samples3000 Samples5000 Samples7000 Samples9000 Samples11000 Samples

24
• Which pieces of information should be given to the reader when generating a test report ? – When quantile values are used, it should be kept in
mind that the computation of quantiles separates a low percentage of outlier data from the remaining data. This means:
• If lower values represent a better outcome from the customer's perspective, a small percentage containing the highest values could be separated by calculating a 95 %-quantile or a 90 %-quantile. This is the case for example for duration values.
25
• If higher values represent a better outcome from the customer's perspective, a small percentage containing the lowest values could be separated by calculating a 5 %-quantile or a 10 %-quantile. This is the case for example for throughput values.
• Related to content quality, the appropriate quantile computation orientates itself on the scale of the determined test results. In practice, some algorithms define a value of 0 on a scale from 0 to 5 as the best quality whereas others define the value of 5 as the highest possible quality

26
KPIs based on Network Counters • Vendor specific = network internal KPIs
– different strategies • how to count network events • which events are included in which counter(s)
• Requires knowledge of specific system – specialists with detailed system knowledge – testing the counters
• documentation may be faulty • approach to counter change with system update
• Mobile operators have challenges with this – most operator live in a multi vendor environment – counters from different vendors cannot be directly
compared – requires continous attention and a strategy

27
KPIs from Users' Perspective = KQIs
• Key Quality Indicators (KQIs) = external indicators – can be assessed in the Field
• For Monitoring, Regulation etc. – a subset can be selected
• applicable across all vendors & operators • not limited to mobile, but also good for broadband

28
KPIs versus KQIs • Sometimes confused
– KPIs = internal indicators • part of network performance • based on network counters • essential for operation, maintenance, business model • could be reported, audited etc. • however, meaningless when out of context
– KQIs = external indicators • basis for QoS assessment as perceived by the user • vendor independant • operator independant • ideal to compare different operators on a statistical basis • cannot be reported from the system itself • requires some kind of field testing, drive, walk etc.

29
...towards a new Recommendation
• From best practice of Project Self Measurement (PSM)...
• ... to a standardized benchmarking platform – employing the operational equipment of the
service provider – thus assessing quality from a true user perspective

30
• Offer of new services requires – new KPIs – QoS measurements – benchmarking methods
• In order to ensure the quality of new services – comparability of test results – reference benchmarking methods – background traffic load profiles
• are needed for – the spectrum of potential applications – including all access technologies – operational equipment used by the operator under test

31
Potential Applications • analogue (a/b) • ISDN • VoIP (including SIP trunking) • High-speed internet • Website benchmarking • IPTV • UMTS • VoLTE • ViLTE • ...

32
• Relevant for a real-world environment – Encompassing a mix of technologies
• This approach ensures that service quality is evaluated from a customers' point of view – All system components involved in a real end-to-end
connection are incorporated into the test – ...

33
Multiplay and Benchmarking Platform
• Can be distributed – across a larger region or – across an entire country
• Could include several server systems including: – business intelligence platform – data warehouse – management system – system for evaluating of media (e.g. video, audio and
voice) quality – ...

34
35
Simultaneous transmission of Voice and Data
• Realistic user related scenarios – uploads, downloads or use of IPTV in parallel to
• voice connections • adaptive video streaming
– sophisticated measurement of the media quality

36
• single voice channel test consists of the following parts: – through connection quality test – listening speech quality test – DTMF test

37
Through Connection Quality test
• The through connection quality test starts with a listening speech quality test from B to A after the connection is established.
• For the analysis of the initial listening speech quality after through connection has been established the method according to Recommendation ITU-T P.863 in SWB mode based on only two sentences (one female voice and one male voice) is used. For this purpose a male voice ("Four hours of steady work faced us") and a female voice ("The hogs were fed chopped corn and garbage") were selected from the test sentences provided in Recommendation ITU-T P.501, Annex C
38
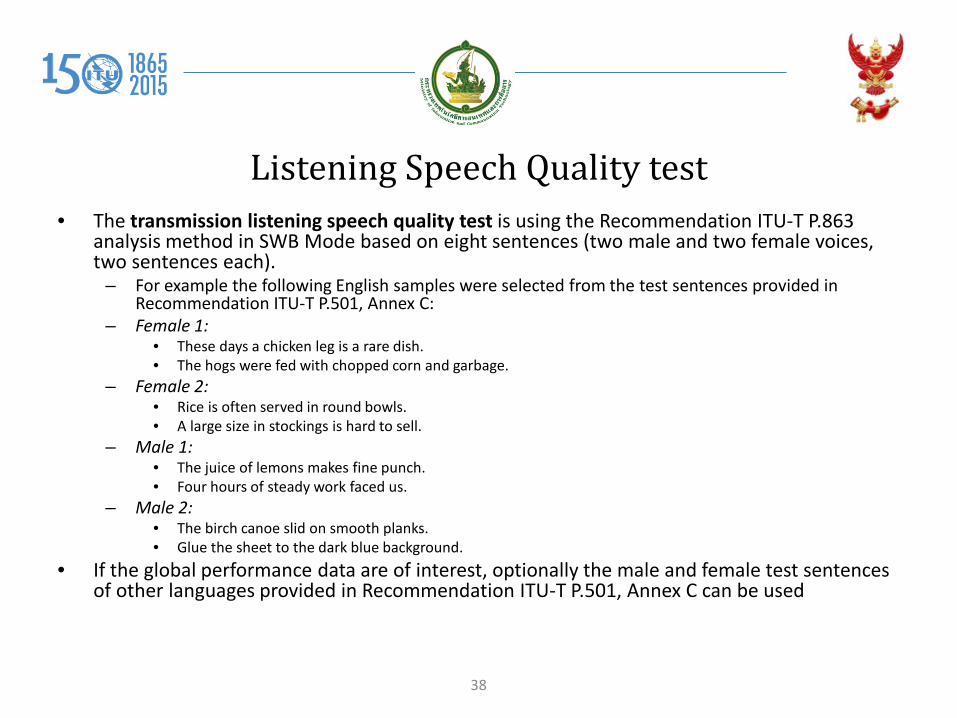
Listening Speech Quality test • The transmission listening speech quality test is using the Recommendation ITU-T P.863
analysis method in SWB Mode based on eight sentences (two male and two female voices, two sentences each).
– For example the following English samples were selected from the test sentences provided in Recommendation ITU-T P.501, Annex C:
– Female 1: • These days a chicken leg is a rare dish. • The hogs were fed with chopped corn and garbage.
– Female 2: • Rice is often served in round bowls. • A large size in stockings is hard to sell.
– Male 1: • The juice of lemons makes fine punch. • Four hours of steady work faced us.
– Male 2: • The birch canoe slid on smooth planks. • Glue the sheet to the dark blue background.
• If the global performance data are of interest, optionally the male and female test sentences of other languages provided in Recommendation ITU-T P.501, Annex C can be used
39
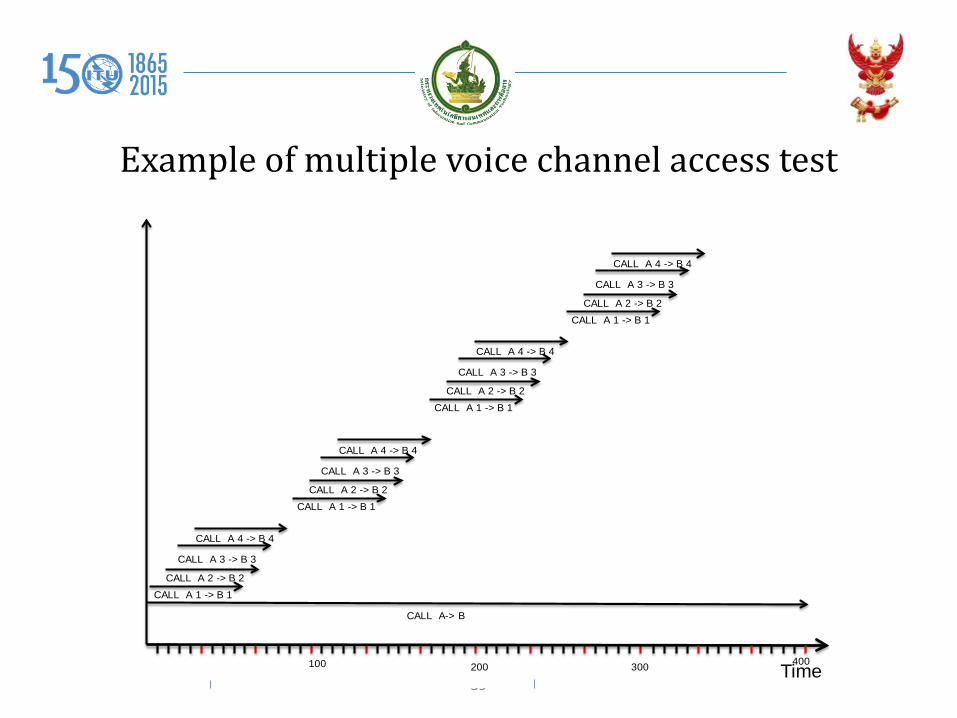
Example of multiple voice channel access test
Time
CALL A 1 -> B 1 CALL A 2 -> B 2
CALL A 3 -> B 3
CALL A 4 -> B 4
100
CALL A-> B
200 300 400
CALL A 1 -> B 1 CALL A 2 -> B 2
CALL A 3 -> B 3
CALL A 4 -> B 4
CALL A 1 -> B 1 CALL A 2 -> B 2
CALL A 3 -> B 3
CALL A 4 -> B 4
CALL A 1 -> B 1 CALL A 2 -> B 2
CALL A 3 -> B 3
CALL A 4 -> B 4
40
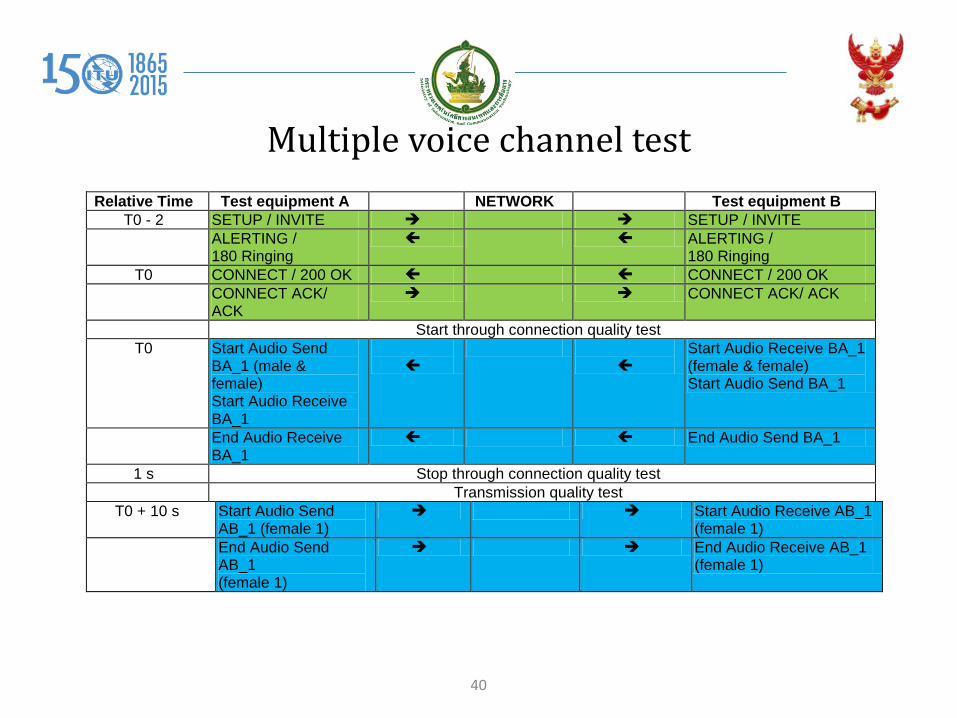
Multiple voice channel test Relative Time Test equipment A NETWORK Test equipment B
T0 - 2 SETUP / INVITE SETUP / INVITE ALERTING /
180 Ringing ALERTING /
180 Ringing T0 CONNECT / 200 OK CONNECT / 200 OK
CONNECT ACK/ ACK
CONNECT ACK/ ACK
Start through connection quality test T0 Start Audio Send
BA_1 (male & female) Start Audio Receive BA_1
Start Audio Receive BA_1 (female & female) Start Audio Send BA_1
End Audio Receive BA_1
End Audio Send BA_1
1 s Stop through connection quality test Transmission quality test
T0 + 10 s Start Audio Send AB_1 (female 1)
Start Audio Receive AB_1 (female 1)
End Audio Send AB_1 (female 1)
End Audio Receive AB_1 (female 1)
41
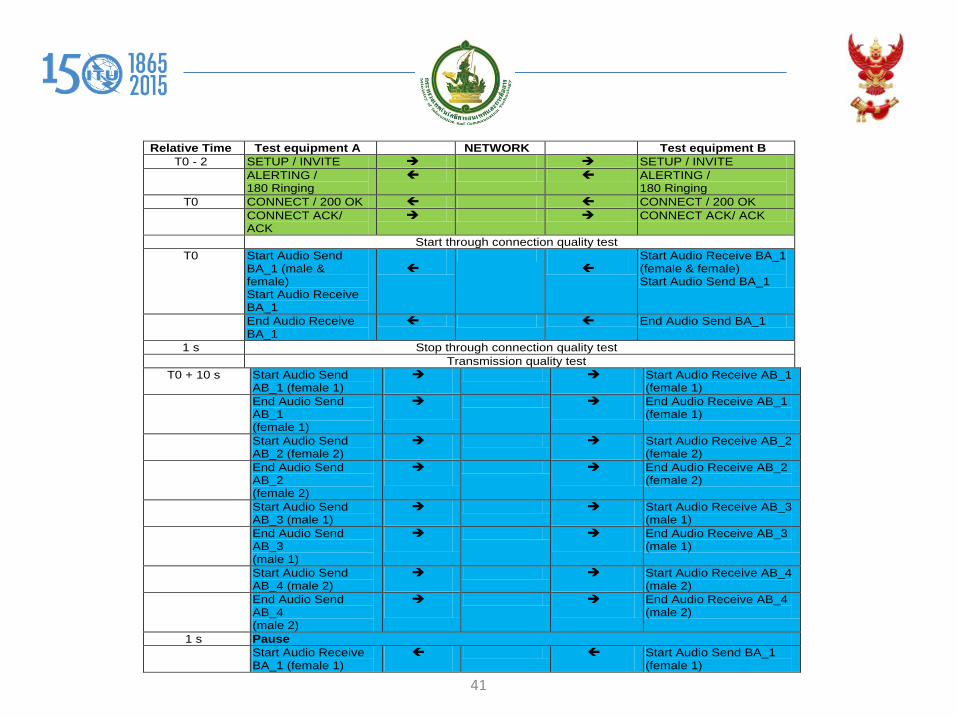
Relative Time Test equipment A NETWORK Test equipment B T0 - 2 SETUP / INVITE SETUP / INVITE
ALERTING / 180 Ringing
ALERTING / 180 Ringing
T0 CONNECT / 200 OK CONNECT / 200 OK CONNECT ACK/
ACK CONNECT ACK/ ACK
Start through connection quality test T0 Start Audio Send
BA_1 (male & female) Start Audio Receive BA_1
Start Audio Receive BA_1 (female & female) Start Audio Send BA_1
End Audio Receive BA_1
End Audio Send BA_1
1 s Stop through connection quality test Transmission quality test
T0 + 10 s Start Audio Send AB_1 (female 1)
Start Audio Receive AB_1 (female 1)
End Audio Send AB_1 (female 1)
End Audio Receive AB_1 (female 1)
Start Audio Send AB_2 (female 2)
Start Audio Receive AB_2 (female 2)
End Audio Send AB_2 (female 2)
End Audio Receive AB_2 (female 2)
Start Audio Send AB_3 (male 1)
Start Audio Receive AB_3 (male 1)
End Audio Send AB_3 (male 1)
End Audio Receive AB_3 (male 1)
Start Audio Send AB_4 (male 2)
Start Audio Receive AB_4 (male 2)
End Audio Send AB_4 (male 2)
End Audio Receive AB_4 (male 2)
1 s Pause Start Audio Receive
BA_1 (female 1) Start Audio Send BA_1
(female 1)

42
Early media listening speech quality
• Early media refers to media (e.g. audio and video) which are exchanged before a particular session is accepted by the called user (in terms of the signalling). Within a dialogue, early media occurs from the moment the initial INVITE is sent until the User Agent Server (UAS) generates a final response. It may be unidirectional or bidirectional, and can be generated by the caller, the called party, or both. Typical examples of early media generated by the called party are ringing tone and announcements (e.g. queuing status). Early media generated by the caller typically consists of voice commands or dual tone multi-frequency (DTMF) tones to drive interactive voice response (IVR) systems.

43
Early media SIP overview
INVITE
Session Progress 183
PRACK
EARLY MEDIA
200 OK
Media
44
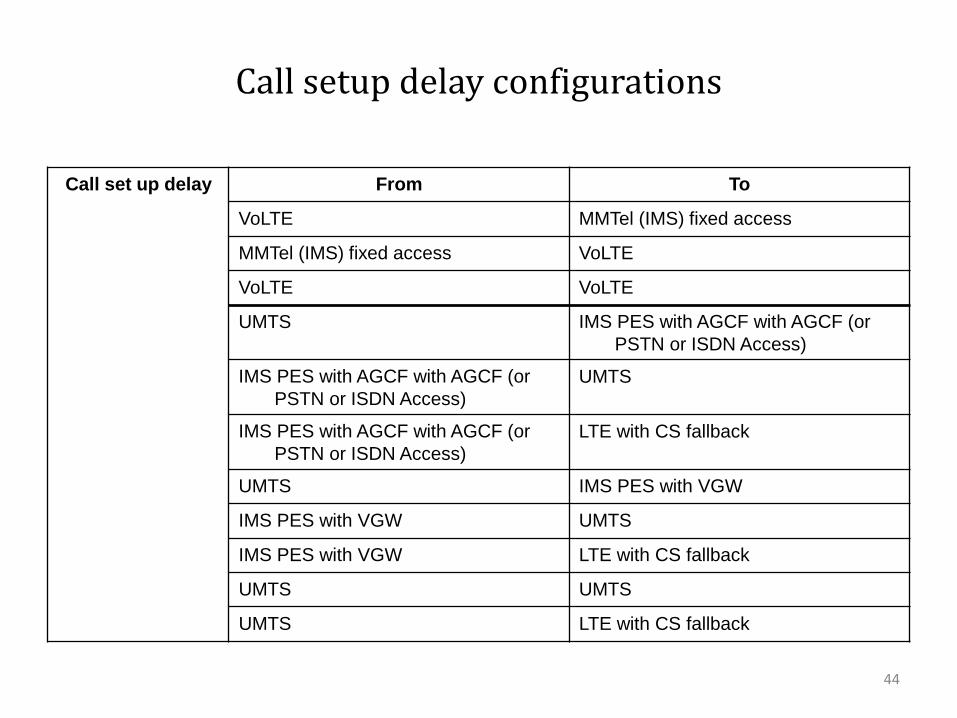
Call setup delay configurations
Call set up delay From To
VoLTE MMTel (IMS) fixed access
MMTel (IMS) fixed access VoLTE
VoLTE VoLTE
UMTS IMS PES with AGCF with AGCF (or PSTN or ISDN Access)
IMS PES with AGCF with AGCF (or PSTN or ISDN Access)
UMTS
IMS PES with AGCF with AGCF (or PSTN or ISDN Access)
LTE with CS fallback
UMTS IMS PES with VGW
IMS PES with VGW UMTS
IMS PES with VGW LTE with CS fallback
UMTS UMTS
UMTS LTE with CS fallback
45
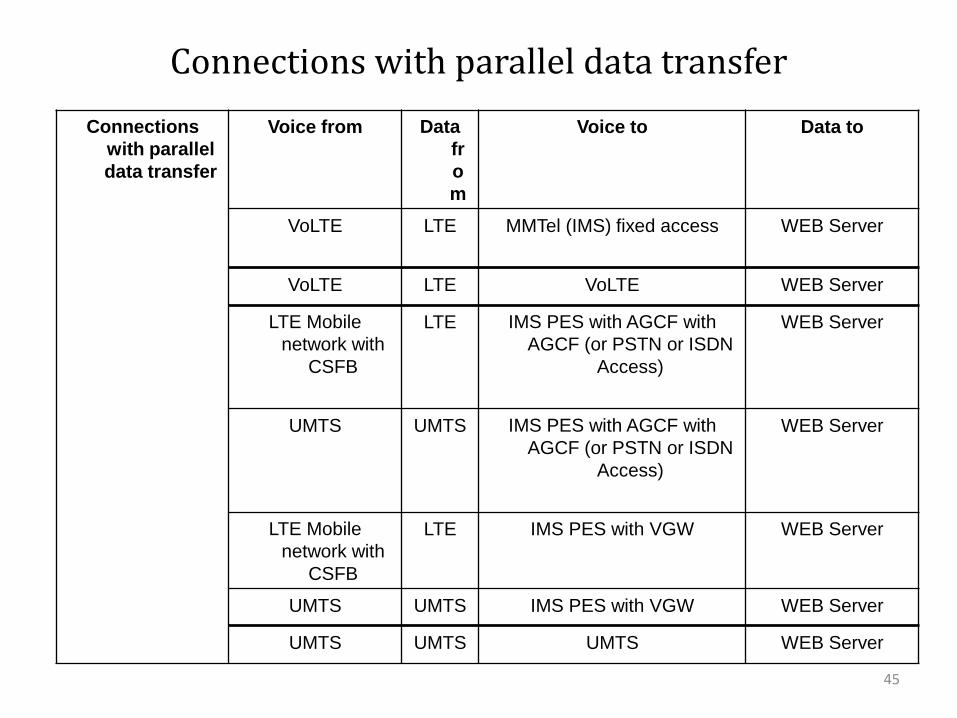
Connections with parallel data transfer Connections
with parallel data transfer
Voice from Data from
Voice to Data to
VoLTE LTE MMTel (IMS) fixed access WEB Server
VoLTE LTE VoLTE WEB Server
LTE Mobile network with
CSFB
LTE IMS PES with AGCF with AGCF (or PSTN or ISDN
Access)
WEB Server
UMTS UMTS IMS PES with AGCF with AGCF (or PSTN or ISDN
Access)
WEB Server
LTE Mobile network with
CSFB
LTE IMS PES with VGW WEB Server
UMTS UMTS IMS PES with VGW WEB Server
UMTS UMTS UMTS WEB Server
46
...under Construction • Gaming • Adaptive video streaming • IPTV • High speed internet • Multithreaded broadband test • ...

47
Current ITU proposed approach

48
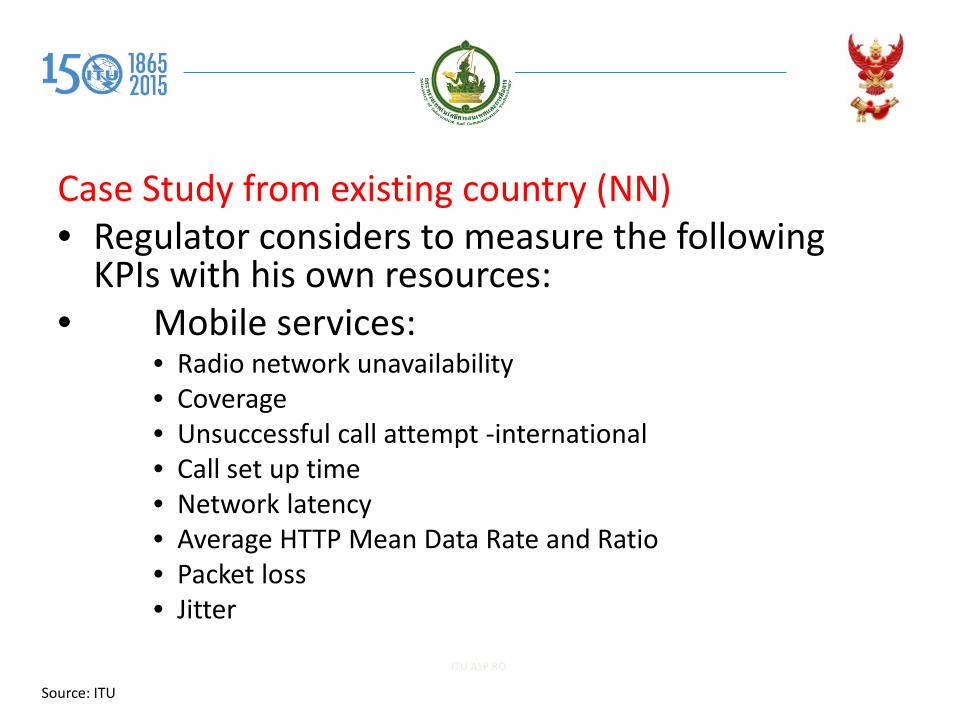
Case Study from existing country (NN) • Regulator considers to measure the following
KPIs with his own resources: • Mobile services:
• Radio network unavailability • Coverage • Unsuccessful call attempt -international • Call set up time • Network latency • Average HTTP Mean Data Rate and Ratio • Packet loss • Jitter
49 ITU ASP RO
Source: ITU
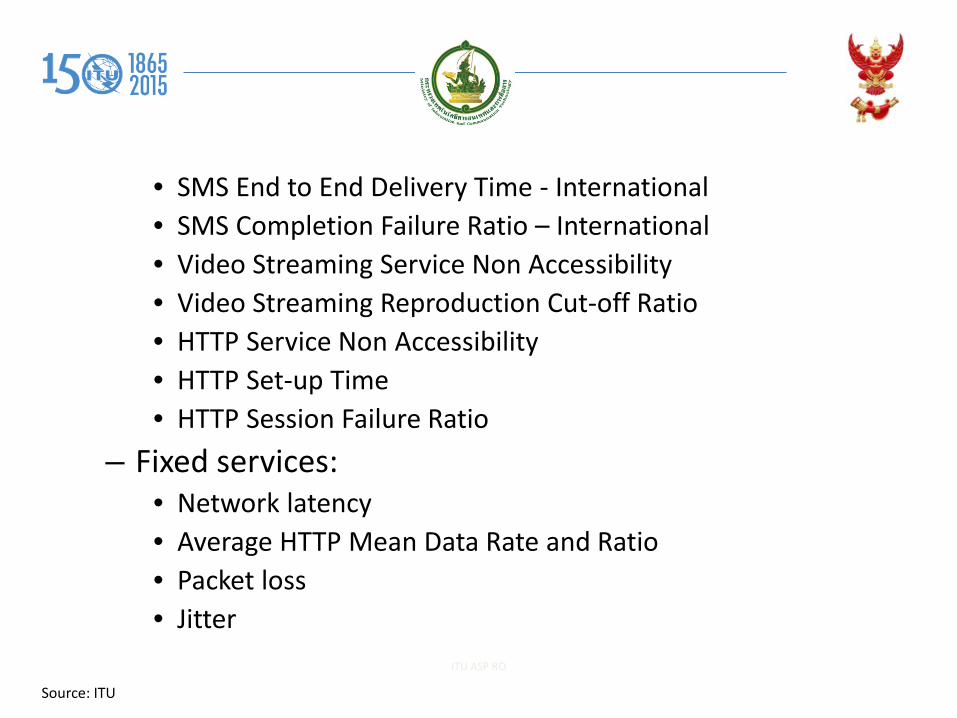
• SMS End to End Delivery Time - International • SMS Completion Failure Ratio – International • Video Streaming Service Non Accessibility • Video Streaming Reproduction Cut-off Ratio • HTTP Service Non Accessibility • HTTP Set-up Time • HTTP Session Failure Ratio
– Fixed services: • Network latency • Average HTTP Mean Data Rate and Ratio • Packet loss • Jitter
50 ITU ASP RO
Source: ITU
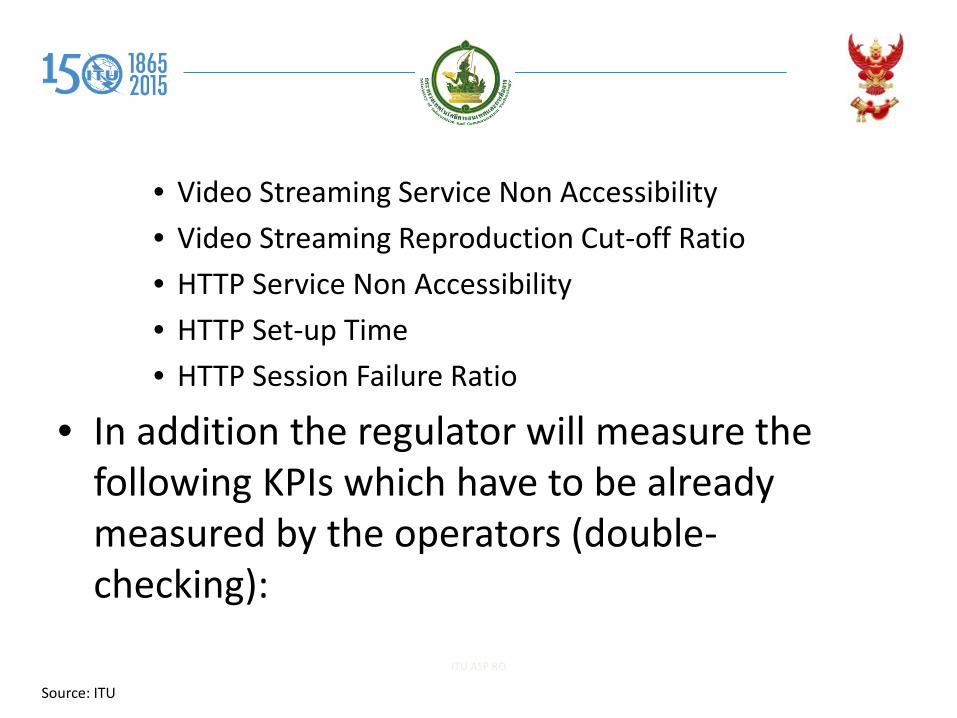
• Video Streaming Service Non Accessibility • Video Streaming Reproduction Cut-off Ratio • HTTP Service Non Accessibility • HTTP Set-up Time • HTTP Session Failure Ratio
• In addition the regulator will measure the following KPIs which have to be already measured by the operators (double-checking):
51 ITU ASP RO
Source: ITU
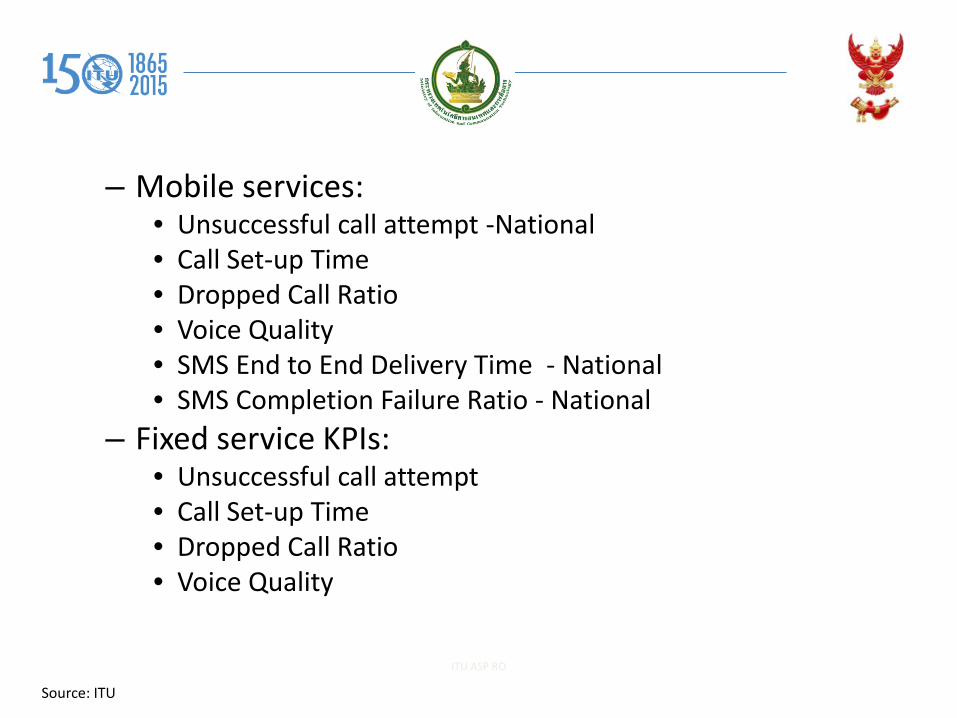
– Mobile services: • Unsuccessful call attempt -National • Call Set-up Time • Dropped Call Ratio • Voice Quality • SMS End to End Delivery Time - National • SMS Completion Failure Ratio - National
– Fixed service KPIs: • Unsuccessful call attempt • Call Set-up Time • Dropped Call Ratio • Voice Quality
52
ITU ASP RO
Source: ITU
53
Types of measurements • OECD report categorises the types of clients
that initiate each performance test at the end-user side and examines their characteristics: – End-user Application Measurement (EAM) – End-user Device Measurement (EDM) – Project Self Measurement (PSM) and – PSM by Internet Service Provider (PSM-ISP)

54
Official measurement projects in OECD area
• “Mobile” is Yes • if any indicator is provided in publicised data to show
performance of Internet access by a mobile access technology (LTE/3G/Wi-Fi…)
• which can be used in motion. Measurements can be undertaken at fixed points.
• Categories of metrics are as follows: • DATA, also referred to as Internet speed, is amount of data
transferred within a certain time such as a second between a client and a server; DNSR is DNS response time; WEB is length of time to load an webpage from a certain major website to a client; LT is latency; JT is jitter; PL is packet loss

55
Countryor organization
Client type
Mobile Purposes Measured metrics Geographical and topological location of
Number of clients
Austria EAM Yes Consumer protection, Competition enhancement,Network development (information on network quality),Net neutrality (planned)
DATA,LT,JT,PL (DNSR and WEB areplanned)
Immediate proximity to the Vienna Internet exchange (VIX)
Approx. 27 000 clients, 300 000 tests, (current value, on- going measurements)
Chile PSM-ISP YesQuality of services indicators
DATA, DNSR and Aggregation rate. (parameters informed by operators, not necessarily verified by SUBTEL)
Depending on ISP(Example: domestic on-net and off- net servers as well as an US server, statistics reported for each)
Depending on ISP
France PSM Yes
Verification of license obligations, consumer protection, competition enhancement, network development
Voice quality, SMS, MMS, data rates (DL and UL), web surfing, video service quality
off-net (dedicated to the study) for data rate measurement
Measures in 2000 different locations (for a total of about20.000 tests for each operator)

56
Countryor organization
Client type
Mobile Purposes Measured metrics Geographical and topological location of
Number of clients
Germany
EAMand PSM
Yes for PSM
Consumer protection Net neutrality
Platform measurement: DATA, DNSR, WEB, LT, HTTP response timeEnd user measurement: DATA
Off net with a direct connection to domestic points of interchange between the networks of different operators
Approx. 550 thousands end- users and 26 points of platform measurement
Greece EAM No
Consumer protection Competition enhancement, Net neutrality
DATA, LT, JT, PL, ISP's restriction on certain services such as P2P and video streaming
Nearest available M-Lab server
Approx. 10000 users
Italy
PSMand EAM(fixed), PSM(mobile)
Yes
Consumer protection.The results can be used as evidence in cases where promised speed is not realized and thus the user wishes to exercise the right of withdrawal of contract
DATA, LT, PL, error rate. Only for mobile: WEB, web failure rate, JT
Domestic points of interchange between the networks of different operators (Rome and Milan)
Fixed: 21 points for PSM, 25 535 end user software downloads for EAMMobile: 1013 points in 20 cities
57
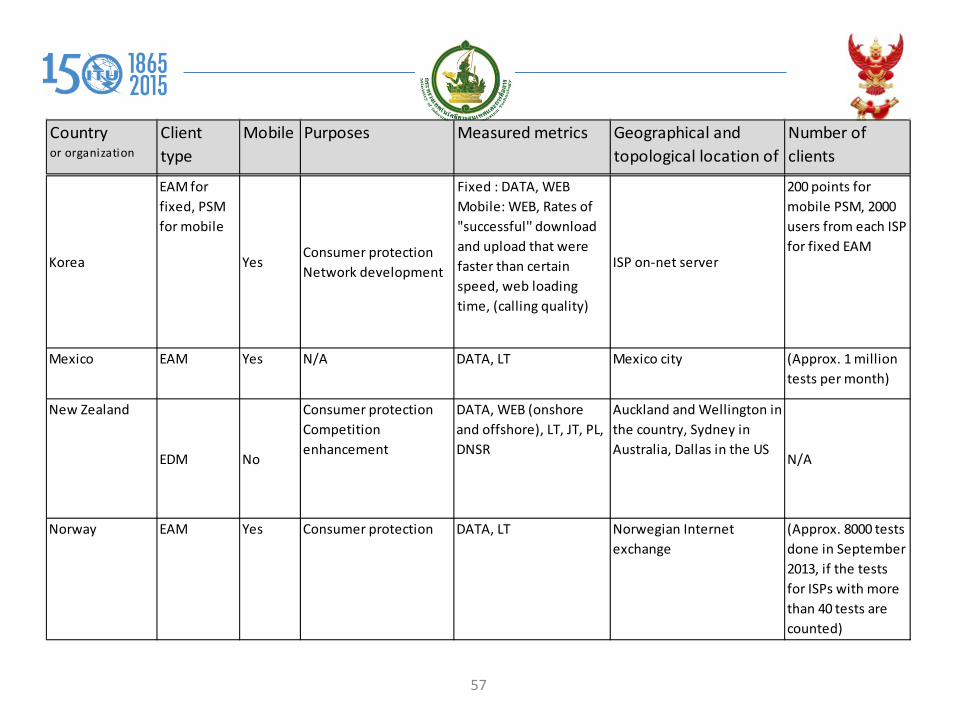
Countryor organization
Client type
Mobile Purposes Measured metrics Geographical and topological location of
Number of clients
Korea
EAM for fixed, PSM for mobile
YesConsumer protection Network development
Fixed : DATA, WEBMobile: WEB, Rates of "successful'' download and upload that were faster than certain speed, web loading time, (calling quality)
ISP on-net server
200 points for mobile PSM, 2000 users from each ISP for fixed EAM
Mexico EAM Yes N/A DATA, LT Mexico city (Approx. 1 million tests per month)
New Zealand
EDM No
Consumer protection Competition enhancement
DATA, WEB (onshore and offshore), LT, JT, PL, DNSR
Auckland and Wellington in the country, Sydney in Australia, Dallas in the US
N/A
Norway EAM Yes Consumer protection DATA, LT Norwegian Internet exchange
(Approx. 8000 tests done in September 2013, if the tests for ISPs with more than 40 tests are counted)
58
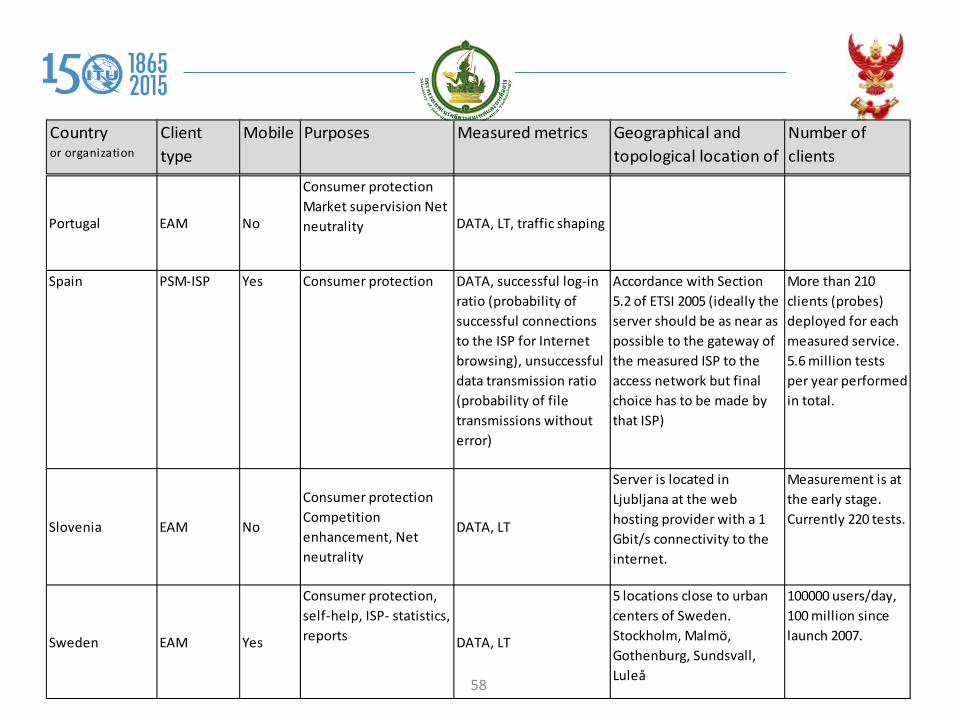
Countryor organization
Client type
Mobile Purposes Measured metrics Geographical and topological location of
Number of clients
Portugal EAM No
Consumer protection Market supervision Net neutrality DATA, LT, traffic shaping
Spain PSM-ISP Yes Consumer protection DATA, successful log-in ratio (probability of successful connections to the ISP for Internet browsing), unsuccessful data transmission ratio (probability of file transmissions without error)
Accordance with Section 5.2 of ETSI 2005 (ideally the server should be as near as possible to the gateway of the measured ISP to the access network but final choice has to be made by that ISP)
More than 210 clients (probes) deployed for each measured service. 5.6 million tests per year performed in total.
Slovenia EAM No
Consumer protection Competition enhancement, Net neutrality
DATA, LT
Server is located in Ljubljana at the web hosting provider with a 1 Gbit/s connectivity to the internet.
Measurement is at the early stage. Currently 220 tests.
Sweden EAM Yes
Consumer protection, self-help, ISP- statistics, reports DATA, LT
5 locations close to urban centers of Sweden. Stockholm, Malmö, Gothenburg, Sundsvall, Luleå
100000 users/day, 100 million since launch 2007.
59
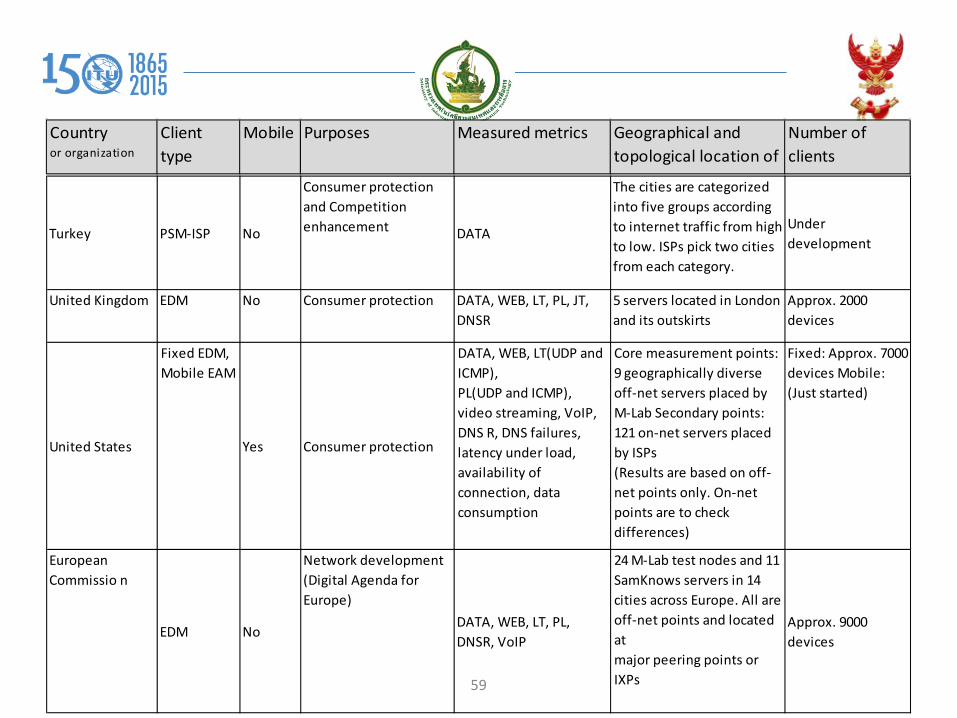
Countryor organization
Client type
Mobile Purposes Measured metrics Geographical and topological location of
Number of clients
Turkey PSM-ISP No
Consumer protection and Competition enhancement DATA
The cities are categorized into five groups according to internet traffic from high to low. ISPs pick two cities from each category.
Under development
United Kingdom EDM No Consumer protection DATA, WEB, LT, PL, JT, DNSR
5 servers located in London and its outskirts
Approx. 2000 devices
United States
Fixed EDM,Mobile EAM
Yes Consumer protection
DATA, WEB, LT(UDP and ICMP),PL(UDP and ICMP), video streaming, VoIP, DNS R, DNS failures, latency under load, availability of connection, data consumption
Core measurement points: 9 geographically diverse off-net servers placed by M-Lab Secondary points: 121 on-net servers placed by ISPs(Results are based on off-net points only. On-net points are to check differences)
Fixed: Approx. 7000 devices Mobile: (Just started)
European Commissio n
EDM No
Network development (Digital Agenda for Europe)
DATA, WEB, LT, PL, DNSR, VoIP
24 M-Lab test nodes and 11 SamKnows servers in 14 cities across Europe. All are off-net points and located atmajor peering points or IXPs
Approx. 9000 devices
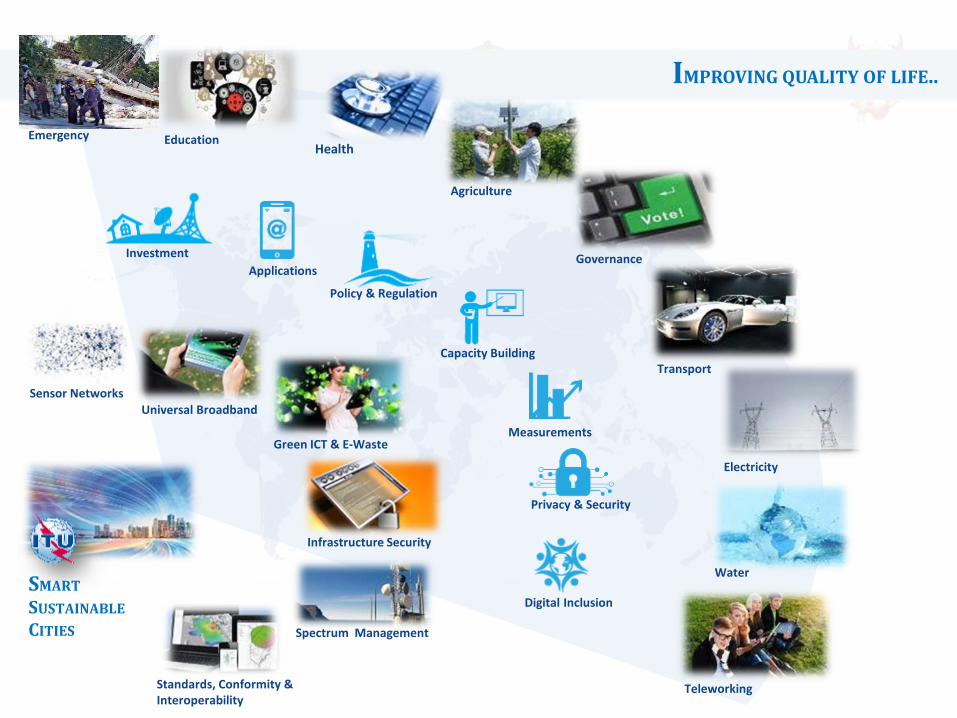
Universal Broadband
Infrastructure Security
Emergency
Sensor Networks
C&I
Health
Agriculture
Governance
Spectrum Management
Standards, Conformity & Interoperability
Digital Inclusion SMART SUSTAINABLE CITIES
Green ICT & E-Waste
Education
Transport Capacity Building
Electricity
Water
Teleworking
Measurements
Privacy & Security
Policy & Regulation
Applications Investment
IMPROVING QUALITY OF LIFE..