Israel Turkey Syria Lebanon Jordan Egypt - W-SMART€¢Winter Vs. summer operating scenarios...
24
Transcript of Israel Turkey Syria Lebanon Jordan Egypt - W-SMART€¢Winter Vs. summer operating scenarios...


0
10
20
30
40
50
60
70
80
Israel Turkey Syria Lebanon Jordan Egypt
Population1900 1950 2007
* In Millions of people
0.7
10.8
2.2
14
21
74
2.2
19.9
3.2 0.5
3.9 1.5 0.3
5.7
0.5
10
20
73.4
Population has grown 8 fold
Standard living Growth
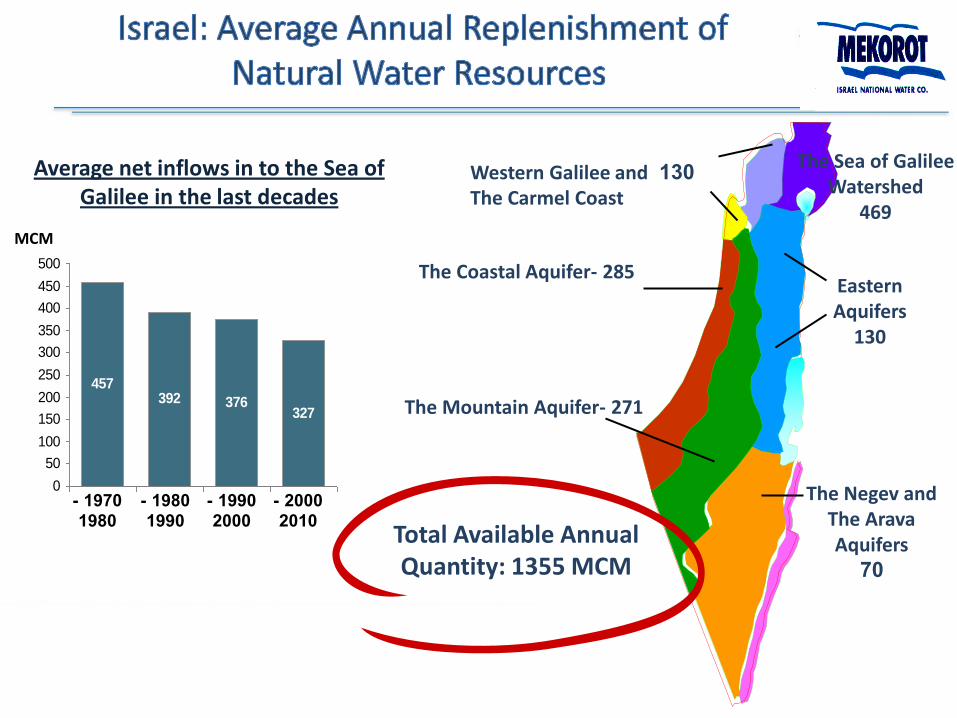
Total Available Annual Quantity: 1355 MCM
MCM
130 Western Galilee and The Carmel Coast
The Coastal Aquifer- 285
The Sea of Galilee Watershed
469
Eastern Aquifers
130
The Negev and The Arava Aquifers
70
291
457392 376
327
0
50
100
150
200
250
300
350
400
450
500
1970 -
1980 1980 -
1990 1990 -
2000 2000 -
2010
Average net inflows in to the Sea of Galilee in the last decades
The Mountain Aquifer- 271

1200
1400
1600
1800
2000
2200
20
06
20
07
20
08
20
09
20
10
20
11
20
12
20
13
20
14
20
15
20
16
20
17
20
18
20
19
20
20
20
21
20
22
20
23
20
24
20
25
Renewable water resources
Potable water demand Higher consumption with less
available water…
4
MCM

Main water resources
MCM) )2008 Main water resources
MCM) )2013
SEA OF GALILEE
267
YARTA”N
249
COAST
118
NORTH
92
DESALINATION
142
DESALINATION
550
SEA OF GALILEE
140
YARTA”N
58
COAST
40
NORTH
53

In 2008, deficit exists across most of Israel ..most disappear by 2020
2008 net production of fresh water by sub-plant
Expected net production of fresh water by sub-plant in 2020
516
542
514
511
531
203
251 206 208
202 201 211
216
223
243
457 430
431
407
406
453
536 544
504
404
402
434
221 209 210
405
431 Surplus (>1MCM)
Balanced
Deficit (<-5MCM)
516
542
514
511
531
203
251 206 208
202 201 211
216
223
243
457 430
431
407
406
453
536 544
504
404
402
434
221 209 210
405
431
Note: 2020 assumes desalination plants in Shomrat, Hadera, Soreq, Ashdod, Palmachim and Ashkelon; Scenario assumes same production from Natural resources as in 2008, for comparison Source: Mekorot and water Authority 2008 actual production and consumption; Mekorot's initial 2020 fresh water demand forecast
Clear need for national transmission
to move water from
North to South

• operational reservoirs • pumping stations • pipes • water quality monitoring facilities
Seawater desalination plants require additions to existing water supply system:
Connection of the Hadera seawater desalination plant (2009)
New facilities enable efficient transfer of water from the Coastal area to the
Eastern part of the country

ימים 7
כנר ת
ימים 3
-98%
שעות 3 0
2
3
1
7 ימים
אשכו ל
שעות 12
Source: Mekorot
Abrupt changes in direction of flow in the WSS and higher
pressures in the Coastal lines
Shorter response time requires advanced real-time water supply system operation
Due to insufficient operational storage, reservoir cycle is 20
times shorter (Tel-Aviv region)
Insufficient operational Storage Shorter response time
Multiple water inputs : changes in flow direction
The Eshcol reservoir: 5-day storage cycle
Desalination plants: 6 hours storage cycle
Aviv-travel to Tel-to-Time
7 Days
0
2
3
1
7
3 Days
7 Days
Eskhol site
12 hours
3 hours
Sorek Plant
Askhelon Plant
The Sea of Galilee

• “take or pay” arrangement: Mekorot is obliged to take desalinated water supplied at constant hourly flows, every day, throughout the year; • energy costs: available operational storage is small relatively to inflows so that variable tariffs of energy cannot be completely utilized; • coordination: a greater need for frequent inter-regional water transfer and for an “integrated” approach to operation of the water supply system; • Mekorot’s responsibility to supply water in case of desalination failure implies high maintenance costs for facilities that will be rarely used at full capacity.

• Optimal planning of the WSS operation by simulation
of various operating scenarios.
• Real-time optimization: large amounts of real-time
data (hydraulic & water quality parameters) used as
input to on-line optimization models.
• 8 control rooms supervised by
the Central Coordination Room
from the headquarters.

1. An integrated approach to operation of the Water Supply System
– an example
2. A simulation-optimization model of the Israel National Water
Carrier aimed at:
• Evaluation of infrastructure development scenarios
• Optimal planning of daily operation of the NWC

“The 3rd line to "Negev
The wastewater from the central part of Israel
is collected and treated by activated sludge
and by infiltration into the sandy Coastal
Aquifer.
“The 3rd line to Negev”:
Supply of reclaimed water for the use in
agriculture.
14
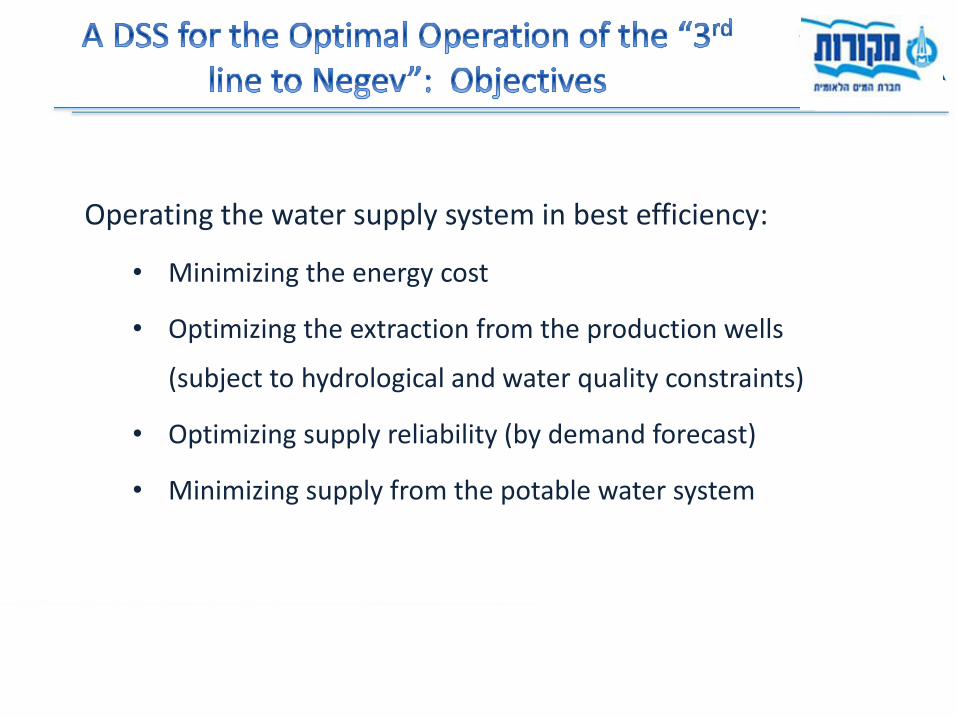
Operating the water supply system in best efficiency:
• Minimizing the energy cost
• Optimizing the extraction from the production wells
(subject to hydrological and water quality constraints)
• Optimizing supply reliability (by demand forecast)
• Minimizing supply from the potable water system

• The water supply system should be considered as an integrated system;
• System operation is based on yearly, monthly, daily and hourly planning;
• Accessibility and transparency of
operational data and decisions;
• Operational decisions reflect
changes in operational conditions;
• Overall coordination by a “main
user”.
DSS Controller
16

17
• Savings in annual energy costs: ~ 20%
• Energy-efficient use of pumping facilities (specific energy
values lower for 7 to 25 % per facility)
• Efficient utilization of the available storage and of the
variable energy tariffs
• Hydrologically optimal pumping from the Aquifer
• Better Service
• Optimal integration of valuable fresh water
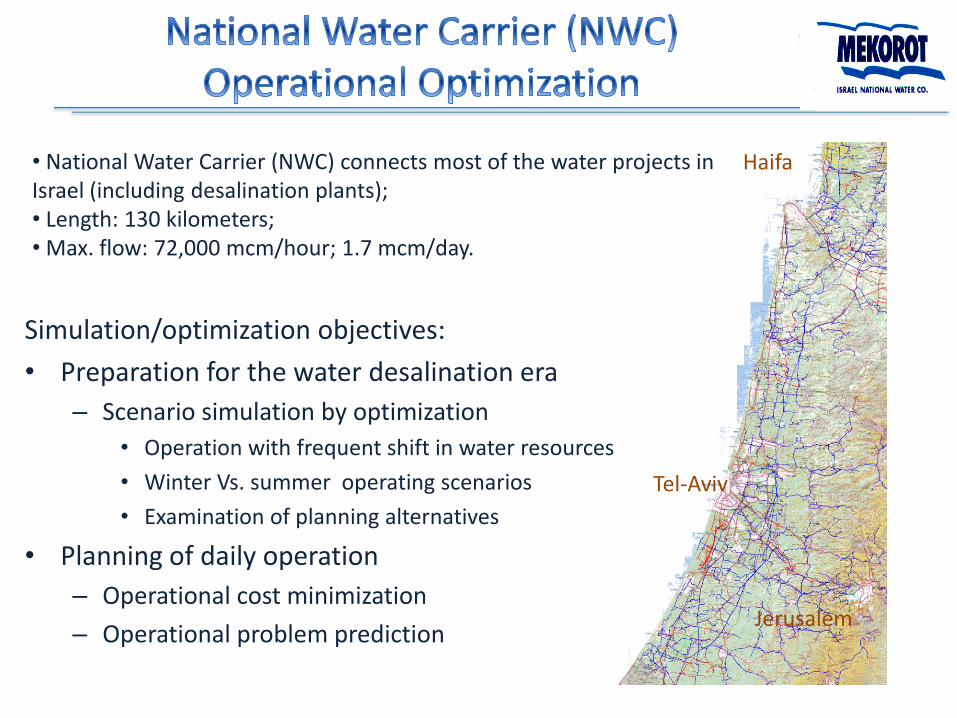
Simulation/optimization objectives:
• Preparation for the water desalination era
– Scenario simulation by optimization
• Operation with frequent shift in water resources
• Winter Vs. summer operating scenarios
• Examination of planning alternatives
• Planning of daily operation
– Operational cost minimization
– Operational problem prediction
Haifa
Jerusalem
Tel-Aviv
• National Water Carrier (NWC) connects most of the water projects in Israel (including desalination plants); • Length: 130 kilometers; • Max. flow: 72,000 mcm/hour; 1.7 mcm/day.

Simplified Hydraulic
model
Hadera Des. Plant: 150 MCM/Year
Sorek, Palmahim, Ashdod Des. Plants: 340 MCM/Year
Ashkelon Des. Plant: 130 MCM/Year
Tel-Aviv
Jerusalem
Southern Israel
Northern Israel
The model enables evaluation of : • proposed changes and developments in the actual WSS • various operating scenarios

• large investments in additions to existing water supply system • adaptive and flexible operational rules that can assure:
• high water supply reliability for various operational conditions • minimum operational costs • sustainable use of natural water resources
By year 2020, Israel will supply 750 mcm of desalinated seawater. Introduction of large quantities of the water from a new source imposes two major requirements:
Simulation and optimization models and Decision Support Systems enable: • evaluation of various proposed infrastructure development projects • optimal real-time operation of complex water supply systems

Complex water supply systems should be operated while
balancing the requirements of the system as a whole with the
local operating conditions:
• Data transparency and accessibility to all involved
operating teams
• Efficient coordination of several control rooms by a single
“system operator”
• Application of simulation and optimization models as
Decision Support Systems
s

THE REAL CHALLENGE = PEOPLE
Human factor Elements:
• Resistance to changes in the organization
• Resistance to more transparency and control
• Increase “human operators” willingness and trust in
(proven) mathematical models (education and re-
definition of job requirements)
• Adjust performance measures to the overall-system
objectives

1. Including National Carrier and 5.4Bn NIS invested in the central region to receive the desalinated water Source: Mekorot 10-years investment plan, GWI 2010
• Access to the Sea and technological capabilities enable water-transfer between Israel and its neighbors.
• International community funds the Red
Sea-Dead Sea water project which implies high energy costs and is not likely to be finished in the near future.
• Higher water availability is likely to invoke
more determination in preserving natural water resources .
Sea-water desalination, as a solution to water scarcity, provides :opportunities for regional cooperation


![French Mandate of Syria and Lebanon · French Mandate of Syria and Lebanon 2 Today part of Syria Lebanon Turkey Officially the French Mandate for Syria and the Lebanon[1] (also known](https://static.fdocuments.in/doc/165x107/5e7b0dacdb8331038e0c4e5d/french-mandate-of-syria-and-lebanon-french-mandate-of-syria-and-lebanon-2-today.jpg)