ISO 9000 and ISO 14000 ISO 14000 standards: an international diffusion model · 2009-04-07 · ISO...
25
ISO 9000 and ISO 14000 standards: an international diffusion model Frederic Marimon Viadiu Facultad de Ciencias Econo ´micas y Sociales, Universitat Internacional de Catalunya, Barcelona, Spain Martı ´ Casadesu ´s Fa Departament d’Organitzacio ´, Gestio ´ Empresarial i Desenvolupament de Producte, Universitat de Girona, Girona, Spain, and In ˜aki Heras Saizarbitoria Departamento de Organizacio ´n de Empresas, E.U.E. Empresariales, Universidad del Paı ´s Vasco, San Sebastia ´n, Spain Abstract Purpose – In an economic environment characterized in recent years by globalization and the integration of economic processes, standardization in management systems has had a high growth. In this context, there has been a remarkable increase in certain standards, or norms, issued by international organizations. Among these standards, two main groups stand out, both issued by the International Organization for Standardization (ISO): one for quality management systems – the family of ISO 9000 standards – and the other for environmental management systems – the ISO 14000 standards. This paper aims to analyze the world wide diffusion process of these two standards, using data provided by the ISO itself. Design/methodology/approach – The methodology proposed is developed in four separate phases. The first two analyze the diffusion model over time with a model based on the logistic curve proposed by Franceschini et al. The next two phases analyze whether the diffusion process has proceeded in a relatively homogeneous way in the different sectors of activity. In order to do that, the use of indices of concentration and instability has been carried out. Findings – The conclusion is that the diffusion of both standards is very similar – in general and in terms of the different sectors. This result coincides with certain hypotheses formulated in the theoretical literature. Originality/value – This is the first paper where it can be demonstrated that, world-wide, both the ISO 14000 and the ISO 9000 standards have followed very similar patterns of diffusion in their expansion. Keywords ISO 9000 series, Diffusion, Quality management, Standardization, Management techniques Paper type Research paper 1. Introduction In recent years, there has been major growth in standards issued by organizations involved in standardization in the field of economic activities. This surge in The current issue and full text archive of this journal is available at www.emeraldinsight.com/0144-3577.htm This paper was written as part of a research project titled “Impact of Quality Management on Spanish Companies” (SEC2003-06634) financed by the Ministry of Science and Technology within the aid programme for R þ D projects. ISO 9000 and ISO 14000 standards 141 International Journal of Operations & Production Management Vol. 26 No. 2, 2006 pp. 141-165 q Emerald Group Publishing Limited 0144-3577 DOI 10.1108/01443570610641648
Transcript of ISO 9000 and ISO 14000 ISO 14000 standards: an international diffusion model · 2009-04-07 · ISO...
ISO 9000 and ISO 14000standards: an international
diffusion modelFrederic Marimon Viadiu
Facultad de Ciencias Economicas y Sociales, Universitat Internacional deCatalunya, Barcelona, Spain
Martı Casadesus FaDepartament d’Organitzacio, Gestio Empresarial i Desenvolupament de
Producte, Universitat de Girona, Girona, Spain, and
Inaki Heras SaizarbitoriaDepartamento de Organizacion de Empresas, E.U.E. Empresariales,
Universidad del Paıs Vasco, San Sebastian, Spain
Abstract
Purpose – In an economic environment characterized in recent years by globalization and theintegration of economic processes, standardization in management systems has had a high growth. Inthis context, there has been a remarkable increase in certain standards, or norms, issued byinternational organizations. Among these standards, two main groups stand out, both issued by theInternational Organization for Standardization (ISO): one for quality management systems – thefamily of ISO 9000 standards – and the other for environmental management systems – the ISO 14000standards. This paper aims to analyze the world wide diffusion process of these two standards, usingdata provided by the ISO itself.
Design/methodology/approach – The methodology proposed is developed in four separatephases. The first two analyze the diffusion model over time with a model based on the logistic curveproposed by Franceschini et al. The next two phases analyze whether the diffusion process hasproceeded in a relatively homogeneous way in the different sectors of activity. In order to do that, theuse of indices of concentration and instability has been carried out.
Findings – The conclusion is that the diffusion of both standards is very similar – in general and interms of the different sectors. This result coincides with certain hypotheses formulated in thetheoretical literature.
Originality/value – This is the first paper where it can be demonstrated that, world-wide, both theISO 14000 and the ISO 9000 standards have followed very similar patterns of diffusion in theirexpansion.
Keywords ISO 9000 series, Diffusion, Quality management, Standardization, Management techniques
Paper type Research paper
1. IntroductionIn recent years, there has been major growth in standards issued by organizationsinvolved in standardization in the field of economic activities. This surge in
The current issue and full text archive of this journal is available at
www.emeraldinsight.com/0144-3577.htm
This paper was written as part of a research project titled “Impact of Quality Management onSpanish Companies” (SEC2003-06634) financed by the Ministry of Science and Technologywithin the aid programme for R þ D projects.
ISO 9000 andISO 14000standards
141
International Journal of Operations &Production Management
Vol. 26 No. 2, 2006pp. 141-165
q Emerald Group Publishing Limited0144-3577
DOI 10.1108/01443570610641648

standardization has been due, to a great extent, to the marked process of globalizationand economic integration experienced in western economies throughout the two lastdecades (Mendel, 2001).
Standardization may be defined, generically, as an activity aimed at organizingapplications and operations, which repeatedly take place in areas of industry,technology, science and the economy. Standardization was first conceived, at thebeginning of the twentieth century, as a means to limit the uneconomical diversity ofcomponents, parts and supplies in order to favor their interchangeability, which in turnwould facilitate mass production and the repair and maintenance of products andservices (Dale, 2002). At present, there is a large number of international and nationalstandards whose aim is to order and to systematize, among other things, theimplementation of business management systems in relation to a wide variety offunctions and operations, such as quality improvement (ISO 9000, QS 9000, EAQF,VDA, etc.), environmental impact (ISO 14000 and EMAS), occupational safety (OHSAS18001), corporate social responsibility (SA 8000, AA 1000 or the ISO CSR or UNE165010 projects), Research, Development and Innovation (RDI) activities (theexperimental standard UNE 166000 EX) and activities related to management ofhuman resources (the Investors in People standard). All of these standards have verysimilar methodologies, which include creation, structure and implementationprocesses, plus verification by a third party. By far the most successful, in terms ofdiffusion, are two groups of standards issued by the International Organization forStandardization (ISO): the ISO 9000 series of standards, related to the implementationof quality assurance systems, and the ISO 14000 series, related to the implementationof environmental management systems.
The paper examines how the diffusion of management standards takes place.Specifically, we analyze the diffusion of the ISO 9000 and the ISO 14000 standards andthe parallels between the two processes. We investigate whether it occurs in ananalogous way in individual countries and in different sectors of economic activity,and we propose an empirical diffusion model. This model is initially based on aprevious research (Franceschini et al., 2004) on ISO 9000 certifications.
Consequently, this paper has two objectives. First, it will examine whether thediffusion of the ISO 9000 and the ISO 14000 standards occurs in an analogous way overtime. Secondly, it will analyze whether the diffusion phenomenon is parallel throughdifferent sectors of economic activity.
2. The diffusion of ISO 9000 and ISO 14000: review of the literature2.1 The diffusion of ISO 9000 and ISO 14000It is widely accepted that the ISO 9000 series of standards are the most popularreference model for setting up quality assurance systems in organizations. Thesestandards, based on the BS 5750 series developed in 1979 by the British StandardsInstitution (BSI) in the United Kingdom, were first established in 1987, but their worldwide success was a result of the revision carried out in 1994. The results of the mostrecent revision (2000) remain to be seen.
The ISO 9000 standard does not attempt to measure the quality of the products orservices of companies, i.e. they make no reference to achieving a certain objective orresult. They are, instead, standards, which establish the need to systematize and toformalize company tasks with the objective of producing products, or services that
IJOPM26,2
142

meet customer demands. In other words, they are a management tool based on thesystematization and formalization of tasks in order to obtain uniformity in the productand to conform to the specifications established by the customer (Anderson et al., 1999).
On the other hand, the ISO 14000 standard, published in 1996, establishes areference model for implementing environmental management systems in companies.These systems can be defined as the part of a company’s global management whichencompasses the organizational structure, the planning activities, the responsibilities,practices, procedures, processes and resources required to elaborate, apply, review andmaintain the environmental policy of the company. The structure and philosophy ofISO 14000 is very similar to ISO 9000. It is not designed to measure the environmentalimpact of the companies that implement it, but rather to be a set of standards thatestablish how to systematize and formalize the procedures related to the processes ofenvironmental impact in the company. In fact, during the elaboration of the ISO 14000standard, the committee that created it, the ISO’s technical committee 207 (ISO/TC207),quickly realized that for the standard to be widely accepted it had to be compatiblewith ISO 9000. That is why, as Poksinska et al. (2003) demonstrate, the implementationof ISO 9000 clearly facilitated the subsequent implementation of ISO 14000.
The ISO 14000 standard is not a standard of objectives or results, but of procedures.In addition, as Corbett and Kirsch (1999) state, ISO 14000 focuses on many aspectsother than the environmental ones, and, therefore, should not be thought of as designedsolely for a certain type of company with a high environmental impact, but as astandard that can be applied to most organizations.
Although there are major similarities between both standards, each series has itsown particular elements to distinguish it from the other. It is noteworthy, for example,that the ISO 14000 standard does include, although rather weakly and ambiguously, areference to meeting certain environmental objectives, since it establishes thatcompanies will have to commit themselves to meeting the basic standards andenvironmental regulations of their respective countries. In addition, ISO 14000 takesinto consideration other stakeholders that ISO 9000 does not.
There is currently a great deal of academic controversy about the integration ofmanagement systems (Beechner and Koch, 1997; Karapetrovic and Willborn, 1998,among others). In this case it mainly concerns systems of environmental managementand quality, since the integration of each is often confused with the simple fusion of thedocumentation of both systems. There is no doubt that the similarities between bothstandards – in terms of the design, the language, the structure and the methodology ofcertification – facilitates this integration, but such integration must be carried out notonly to cut costs, but also to improve efficiency (Karapetrovic and Willborn, 1998).
In terms of the diffusion of the two standards, it is well known that they have beenvery successful, particularly the ISO 9000 standard. The latest data provided byISO (ISO, 2003) indicates that in December of 2002 there were already 561,747certifications in 159 countries with ISO 9000-certified companies around the world.When the ISO 14000 standard was published, there were already 127,349 ISO 9000certifications. Like ISO 9000, ISO 14000 has also spread throughout the world, although,so far, not with as much success. The latest available data, also from December of 2002(ISO, 2003), indicates that there were 49,462 certifications in a total of 118 countries.
Having said that, just how has this diffusion come about? Do they follow analogousmodels? If both standards follow parallel paths, could they be extrapolated to other,
ISO 9000 andISO 14000standards
143

subsequent standards? These are the main issues raised in this work, since in theliterature only the diffusion of the ISO 9000 standard has received much attention.
In its early stages, ISO 9000 began to spread around the world from EuropeanUnion countries, specifically from the United Kingdom, where these standardsoriginated. In 1996, more than 62 percent of certificates in the world were found in theEU (of which more than 50 percent had been issued in the United Kingdom and thenumber of certificates issued in Austria and the Netherlands was also very highcompared to other EU countries). This may have been due, to a large extent, to the factthat various administrations and European institutions very actively supported theuse of ISO 9000 in working towards harmonization in the European Union (Peach,2002). The ISO 14000 standard, on the other hand, did not spread in the same waybecause the factors that stimulated and promoted its propagation were different, as hasbeen analyzed in the literature (Corbett and Kirsch, 2001; Nakamura et al., 2001; Pan,2003; Poksinska et al., 2003). An analysis of the density of ISO 9000 and ISO 14000certificates in European Union countries during 2002 is presented in Table I, an indexof our own design that measures the relationship between the percentage of certificatesin each country with respect to the European total and each country’s percentagecontribution to the European GDP[1].
The results obtained are shown graphically in Figure 1, which clearly shows howlittle a relationship there is between the two. It is clear, for example, that the Nordiccountries have a low intensity of ISO 9000 certifications and, yet, have among thehighest intensities of ISO 14000 certifications. In short, just as Corbett and Kirsch(2001) have pointed out, there are countries that lead the way in movements such asthese and in Europe the Nordic countries (which are historically the mostenvironmentally proactive) have assumed this role and head the ranking incertifications of this type. In contrast, ISO 14000 certification is noticeably lessimportant in the United Kingdom, despite it being the historical world leader inISO 9000 certifications.
Country Gross domesticproduct (GDP)
ISO 9000certificates
Intensity inISO 9000
ISO 14000certificates
Intensity inISO 14000
Austria 207,038 4,000 0.71 429 0.89Belgium 247,469 4,670 0.69 264 0.46Denmark 173,889 2,163 0.46 711 1.76Finland 131,145 1,870 0.52 750 2.46France 1,416,877 20,919 0.54 1,467 0.44Germany 2,030,000 41,629 0.75 3,700 0.78Greece 123,122 2,325 0.69 89 0.31Ireland 102,910 3,700 1.32 289 1.21Italy 1,164,767 48,109 1.51 2,153 0.79Luxembourg 20,815 108 0.19 17 0.35Netherlands 402,599 12,745 1.16 1,073 1.14Portugal 115,042 2,474 0.79 137 0.51Spain 609,319 17,749 1.07 3,228 2.28Sweden 260,120 4,652 0.65 2,730 4.5UK 1,559,392 66,760 1.57 2,917 0.8
Source: Elaborated form ISO surveys and EUROSTAT information
Table I.Intensity in ISO 9000 andISO 14000 certificates inthe Europe Union (2002)
IJOPM26,2
144
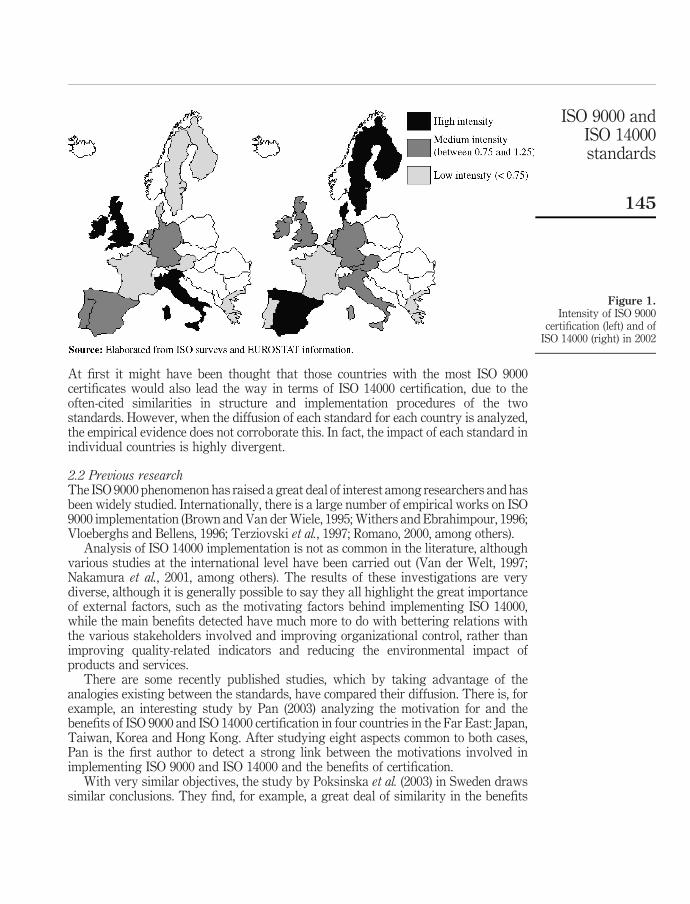
At first it might have been thought that those countries with the most ISO 9000certificates would also lead the way in terms of ISO 14000 certification, due to theoften-cited similarities in structure and implementation procedures of the twostandards. However, when the diffusion of each standard for each country is analyzed,the empirical evidence does not corroborate this. In fact, the impact of each standard inindividual countries is highly divergent.
2.2 Previous researchThe ISO 9000 phenomenon has raised a great deal of interest among researchers and hasbeen widely studied. Internationally, there is a large number of empirical works on ISO9000 implementation (Brown and Van derWiele, 1995; Withers and Ebrahimpour, 1996;Vloeberghs and Bellens, 1996; Terziovski et al., 1997; Romano, 2000, among others).
Analysis of ISO 14000 implementation is not as common in the literature, althoughvarious studies at the international level have been carried out (Van der Welt, 1997;Nakamura et al., 2001, among others). The results of these investigations are verydiverse, although it is generally possible to say they all highlight the great importanceof external factors, such as the motivating factors behind implementing ISO 14000,while the main benefits detected have much more to do with bettering relations withthe various stakeholders involved and improving organizational control, rather thanimproving quality-related indicators and reducing the environmental impact ofproducts and services.
There are some recently published studies, which by taking advantage of theanalogies existing between the standards, have compared their diffusion. There is, forexample, an interesting study by Pan (2003) analyzing the motivation for and thebenefits of ISO 9000 and ISO 14000 certification in four countries in the Far East: Japan,Taiwan, Korea and Hong Kong. After studying eight aspects common to both cases,Pan is the first author to detect a strong link between the motivations involved inimplementing ISO 9000 and ISO 14000 and the benefits of certification.
With very similar objectives, the study by Poksinska et al. (2003) in Sweden drawssimilar conclusions. They find, for example, a great deal of similarity in the benefits
Figure 1.Intensity of ISO 9000
certification (left) and ofISO 14000 (right) in 2002
ISO 9000 andISO 14000standards
145
obtained by applying each standard. This is explained by the fact that theimprovements in organizational efficiency and control brought about by ISO 14000 aremore important benefits for the organization than any actual improvements inenvironmental performance.
Literature referring to the diffusion of these standards is very scarce. This is not thecase with studies of the diffusion of various other management tools and systems,which is a subject that has received great interest on the part of academics fromvarious fields (the summary by Roger (1995) is very interesting in this respect). Inparticular, there have been many investigations into the diffusion of technologicalinnovations which could also be applied in some form to administrative innovations, asindicated by Teece (1980), who established that analytical models of the diffusion oftechnological innovations are not limited to tangible products. It can be deduced fromthese studies that, broadly speaking, the cumulative adoption of innovations over timefollows an S-shaped or sigmoid curve, reflecting the fact that few members of a socialsystem actually adopt an innovation during the first stages, but as time goes on therate of adoption of the innovation rises until the process approaches its saturationpoint, whereupon the growth rate begins to fall. Stoneman (1995) points out that thismodel is usually a good explanation of the phenomena of diffusion in the field of newtechnologies. This is the evidence found in the literature that led to the idea of applyinga similar model to the present case.
For the specific case of management standards, as we have said, the literature isscarce. Recently, two works have appeared which provide a descriptive analysis of thediffusion process of the ISO 9000 standard over time. On the one hand, Saraiva andDuarte (2003) present the first research aimed at predicting how ISO 9000 certificationwill develop around the world in the future. From an index calculated according to thenumber of ISO 9000 certificates per inhabitant (using a simple regression model), theyidentify the leading countries and analyze how the saturation level is close to beingachieved. At the same time, they forecast the development of ISO 9000 certificationbetween 2002 and 2006. Similarly, a second investigation carried out by Franceschiniet al. (2004) analyzes in greater detail some of the areas examined by Saraiva andDuarte (2003). Thus, using a modified logistics curve for a fixed population, they firstapproach the idea of ISO 9000 diffusion in six European countries, detecting what thesaturation levels are for each country, i.e. the maximum number of companies in eachcountry that will undergo certification. Although the analysis was only exploratory, itis very interesting to observe how well the model adjusts to the real data in all theanalyzed countries, which makes it, without doubt, a good starting point for thepresent study.
Nevertheless, as far as this study is concerned, the studies carried out by Corbett onthe diffusion of the ISO 9000 and ISO 14000 standards are of greater interest. Althoughthey all deal with the mechanisms of diffusion rather than to actual diffusion over time,a first study (Corbett and Kirsch, 1999) established that the number of a country’s ISO14000 certificates is very positively related to the number of ISO 9000 certificates and,to a lesser degree, to the level of environmentalization (measured by the number ofenvironmental treaties signed) and the level of exports of the country. In contrast, it isindependent of the country’s level of development. The results obtained in thisinvestigation were later corroborated in Corbett and Kirsch (2001), not only from theanalyses of the existing data they had used previously, but also from the impressions
IJOPM26,2
146
received during visits to several ISO 14000-registered companies around the world(Corbett and Kirsch, 2000). It must be remembered, however, that this study, whileinteresting, is of a static nature and does not analyze the development of the twostandards over time. Vastag (2003) further analyzed the resulting data, concluding thatonly the number of ISO 9000 certificates and the degree of environmentalization of thecountry are related to the total number of ISO 14000 certificates.
Subsequently, Corbett (2003) analyzed the forces that explain the diffusion of thesestandards, basing his study on the Bass diffusion model (Bass, 1969), and showing howit is carried out through the supply chain. His model explains that ISO 9000certification basically began in Europe and spread from there to other countriesbecause the European companies put pressure on their suppliers to seek certification.It also appears from this study that companies exporting goods or services to a certainregion simultaneously import management practices to their company as well as totheir whole area of influence (Corbett, 2003).
We believe these studies are interesting not only because of their capacity todescribe and predict the actual process of diffusion of these international standards,but also because they offer certain empirical evidence as to whether or not there is ananalogy between the process of diffusion of these standards and the diffusion ofinnovations in general. We believe there may be a link between these studies andothers of a theoretical and empirical nature, already becoming traditional in the field ofbusiness management and organization and dealing in particular with the influence offashionable practices in business management. Abrahamson (1991, 1996) are the twostudies that stand out in this respect.
3. Methodology used for studying the diffusionThree hypotheses will be contrasted to address the two objectives proposed (Table II).The two first are related to the first objective whereas the last one is related to thesecond.
H1a. The diffusion pattern of the ISO 9000 and ISO 14000 standards on a globalscale follows a logistic curve.
H1b. The diffusion pattern of the ISO 14000 standard applied to an individualcountry follows a logistic curve (as does the ISO 9000).
H2. The evolution of both standards, ISO 9000 and ISO 14000, through differenteconomic activity sectors has been similar.
The methodology proposed is developed in four separate phases. The first two analyzethe diffusion model over time, the first objective of this research, in Section 4 of thispaper, while the other two analyze the sectors involved, the second objective, inSection 5.
It must be remembered that the focus of this paper is not on explaining why thesestandards are diffused, but rather on how they diffuse, in the sense of how fast andhow extensively. We are more interested in analyzing the diffusion rates and theevolution of the quantity of certificates than in the reasons for the diffusion. Althoughstress is placed on quantitative aspects, we will also attempt to explain the differentgrowth rates for each norm.
ISO 9000 andISO 14000standards
147

The first stage of our investigation will begin by analyzing, on a world wide scale, ifthe model based on the logistic curve, proposed by Franceschini et al. (2004), can onlybe adapted to explain the evolution of ISO 9000 certifications, or whether similarmodels can also be used to analyze the evolution of ISO 14000 certifications.Similar behavior would indicate that the diffusions of standards follow, in principle,similar parameters, although a certain temporal mismatch has already been detected.
In the second stage, we will investigate whether these models can be used solely interms of data gathered at the world wide level, or whether they can also be adapted toeach individual country involved, as Franceschini et al. (2004) showed for differentEuropean countries. To do this, bearing in mind the difficulty involved in analyzing allthe countries involved, four countries were selected for analysis: Spain, because it is theauthors’ country of origin, as well as the third country in the world ranking of absolutegrowth during 2002, with 1,164 new ISO 14000 certifications; the United Kingdom,because it is a country with a strong tradition of ISO 9000 certification; the USA,because of recent strong growth in both standards, and its potential for veryconsiderable growth due to its economic power; and finally, Japan, because of itsspectacular growth, making it currently one of the world leaders in ISO 14000certifications. It should be pointed out that the case of Japan is rather special sincemany Japanese companies, not without reason, believed at first that their own qualitymanagement practices were superior to those applied in the countries that wereISO 9000 pioneers and that certification would, therefore, be a step backwards.
Objectives Hypothesis Phases Statistical techniques
The diffusion of the ISO9000 and the ISO 14000standards occurs in ananalogous way overtime
H1a. The diffusionpattern of the ISO 9000and ISO 14000standards on a globalscale follows a logisticcurve
1. The diffusion patternof both (ISO 9000 andISO 14000 standards) ina world wide scalefollows the logisticcurve
Logistic curveregression
H1b. The diffusionpattern of the ISO 14000standard applied to anindividual countryfollows a logistic curve(as does the ISO 9000)
2. The diffusion patternof ISO 14000 applied toan individual countryfollows a logistic curve
Logistic curveregression
The diffusionphenomenon is parallelthrough differentsectors of economicactivity
H2. The evolution ofboth standards, ISO9000 and ISO 14000,through differenteconomic activitysectors has been similar
3. The evolution of bothstandards, through eacheconomic activitysector, has been similarover time
Evolution of HerfindhalindexEvolution of Instabilityindex
4. The share ofcertifications of eacheconomic activity sectoris similar in both norms,comparing equivalentinstants of maturity ofeach standard
Wilcoxon text appliedin equivalent momentsof maturity
Table II.Objectives, hypothesis,phases and statisticaltechniques of the research
IJOPM26,2
148
Nevertheless, due to the demands of their European customers in 1990s, Japanesecompanies subsequently began to seek ISO 9000 certification. This led to completelydifferent behavior with respect to ISO 14000 from the very beginning (Corbett andKirsch, 1999).
Thirdly, it would also be interesting to find out whether the diffusion process hasproceeded in a relatively homogenous way in the different sectors of activity or if, onthe contrary, certification has clearly occurred more quickly in certain ones. Given thatit is practically impossible to analyze all the sectors in all the countries involved,an analysis has been carried out using indices of concentration and instability. Theconcentration index will show whether or not a large number of certifications aregrouped together in just a few sectors of economic activity, whereas the instabilityindex will give us an idea of the capacity of each sector to maintain its relative positionwithin the ranking.
Finally, the fourth stage aims to check if there is any relationship between sectorscertified according to one standard or the other by carrying out an analysis ofnon-parametric resistance. We want to contrast whether the leading sectors inimplementing the ISO 9000 standard have also been pioneers in the implementation ofISO 14000. Verifying that the sectors involved are very similar would provide morearguments in favor of the similarity of diffusion of the two standards, as well as of thepossible future standards.
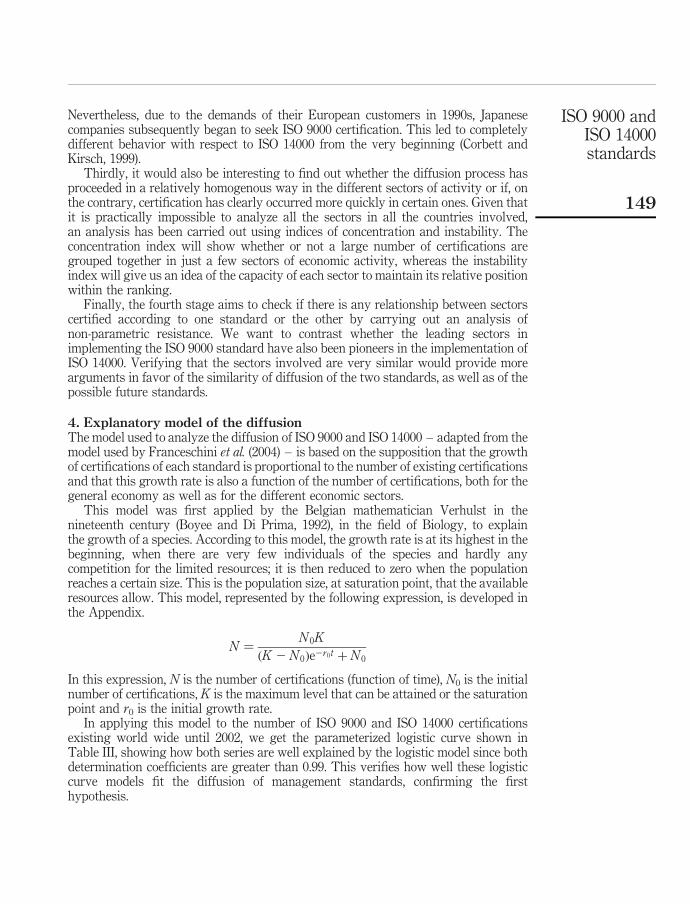
4. Explanatory model of the diffusionThe model used to analyze the diffusion of ISO 9000 and ISO 14000 – adapted from themodel used by Franceschini et al. (2004) – is based on the supposition that the growthof certifications of each standard is proportional to the number of existing certificationsand that this growth rate is also a function of the number of certifications, both for thegeneral economy as well as for the different economic sectors.
This model was first applied by the Belgian mathematician Verhulst in thenineteenth century (Boyee and Di Prima, 1992), in the field of Biology, to explainthe growth of a species. According to this model, the growth rate is at its highest in thebeginning, when there are very few individuals of the species and hardly anycompetition for the limited resources; it is then reduced to zero when the populationreaches a certain size. This is the population size, at saturation point, that the availableresources allow. This model, represented by the following expression, is developed inthe Appendix.
N ¼N 0K
ðK 2 N 0Þe2r0t þ N 0
In this expression, N is the number of certifications (function of time), N0 is the initialnumber of certifications, K is the maximum level that can be attained or the saturationpoint and r0 is the initial growth rate.
In applying this model to the number of ISO 9000 and ISO 14000 certificationsexisting world wide until 2002, we get the parameterized logistic curve shown inTable III, showing how both series are well explained by the logistic model since bothdetermination coefficients are greater than 0.99. This verifies how well these logisticcurve models fit the diffusion of management standards, confirming the firsthypothesis.
ISO 9000 andISO 14000standards
149

Asymptotic95
percent
confidence
interval
DF
Estim
ate
Sum
ofsquares
Asymptoticstd.
error
Mean2
Low
erUpper
ISO9000
certificatesworld
wideregressiona,b
Dep
enden
tva
riabl
e:IS
O9000
wor
ldw
ide
cert
ifica
tes
Sou
rce
Regression
31,038,195,251,858
346,065,083,953
Residual
8905,463,045.266
113,182,880.658
UncorrectedTotal
111,039,100,714,903
(corrected
total)
10337,015,670,695
R2¼
12
Residual
SS/Corrected
SS¼
0.99731
Para
met
erN0
43,102.8528
4,201.0725
33,415.1622
52,790.5434
K817,539.0186
67,398.7551
662,117.2107
972,960.8266
r 00.3693
0.02372
0.3146
0.4240
ISO14000certificatesworld
widea
Dep
enden
tva
riabl
e:IS
O14000
wor
ldw
ide
cert
ifica
tes
Sou
rce
Regression
34,603,582,247.41
1,534,527,415.80
Residual
81,969,654.5888
393,930.9178
UncorrectedTotal
54,605,551,902.00
(corrected
total)
72,249,209,301.50
R2¼
12
Residual
SS/Corrected
SS¼
0.9991
Para
met
erN0
1,013.1052
150.5268
626.1636
1,400.0467
K77,416.9573
5,922.3611
62,193.0435
92,640.8711
r 00.6999
0.03719
0.6043
0.7955
Notes:aDataareof
Decem
ber
31of
each
year;
bDatarelatedto
years
1993
and1994
havebeeninterpolated
Table III.Statistics of thecertificates ISO 9000 andISO 14000 regressionsapplying of the logisticcurve
IJOPM26,2
150
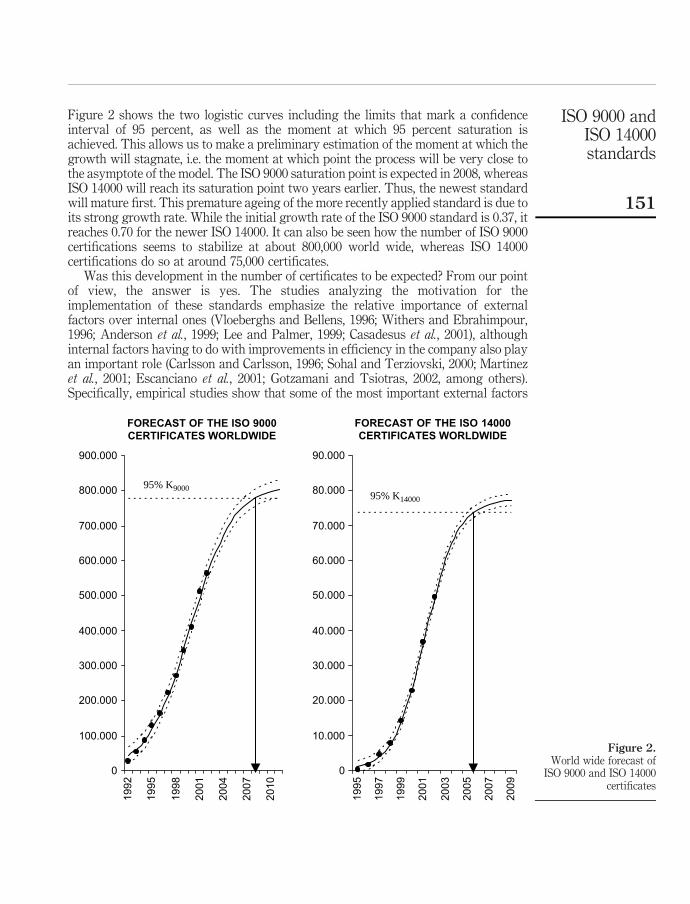
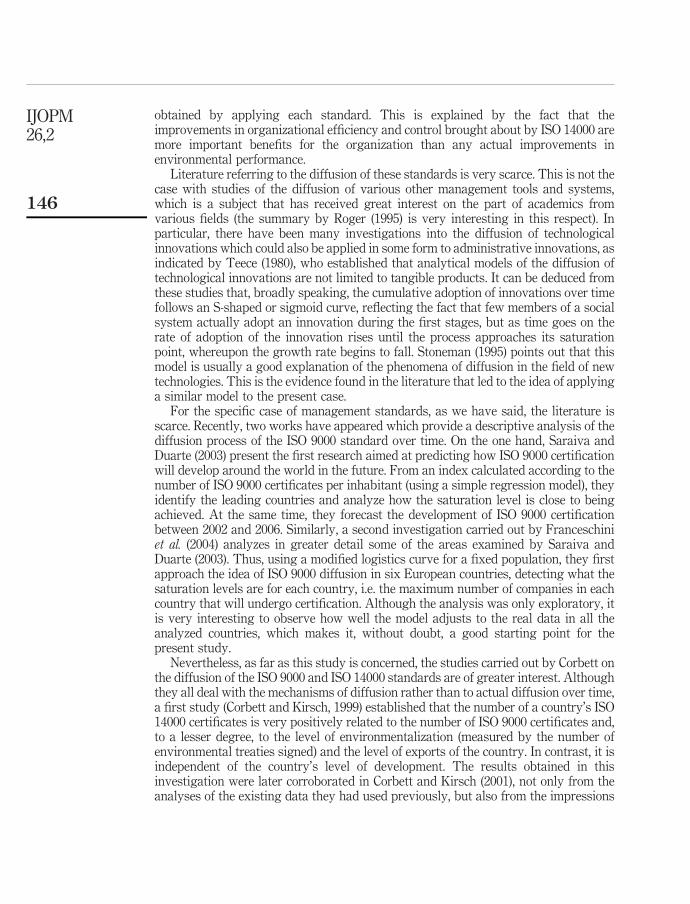
Figure 2 shows the two logistic curves including the limits that mark a confidenceinterval of 95 percent, as well as the moment at which 95 percent saturation isachieved. This allows us to make a preliminary estimation of the moment at which thegrowth will stagnate, i.e. the moment at which point the process will be very close tothe asymptote of the model. The ISO 9000 saturation point is expected in 2008, whereasISO 14000 will reach its saturation point two years earlier. Thus, the newest standardwill mature first. This premature ageing of the more recently applied standard is due toits strong growth rate. While the initial growth rate of the ISO 9000 standard is 0.37, itreaches 0.70 for the newer ISO 14000. It can also be seen how the number of ISO 9000certifications seems to stabilize at about 800,000 world wide, whereas ISO 14000certifications do so at around 75,000 certificates.
Was this development in the number of certificates to be expected? From our pointof view, the answer is yes. The studies analyzing the motivation for theimplementation of these standards emphasize the relative importance of externalfactors over internal ones (Vloeberghs and Bellens, 1996; Withers and Ebrahimpour,1996; Anderson et al., 1999; Lee and Palmer, 1999; Casadesus et al., 2001), althoughinternal factors having to do with improvements in efficiency in the company also playan important role (Carlsson and Carlsson, 1996; Sohal and Terziovski, 2000; Martınezet al., 2001; Escanciano et al., 2001; Gotzamani and Tsiotras, 2002, among others).Specifically, empirical studies show that some of the most important external factors
Figure 2.World wide forecast of
ISO 9000 and ISO 14000certificates
FORECAST OF THE ISO 9000CERTIFICATES WORLDWIDE
0
100.000
200.000
300.000
400.000
500.000
600.000
700.000
800.000
900.000
1992
1995
1998
2001
2004
2007
2010
95% K9000
FORECAST OF THE ISO 14000CERTIFICATES WORLDWIDE
0
10.000
20.000
30.000
40.000
50.000
60.000
70.000
80.000
90.000
1995
1997
1999
2001
2003
2005
2007
2009
95% K14000
ISO 9000 andISO 14000standards
151

concern customer demands, as well as the desire of companies to stand out from thecrowd by having the certificate (Meegan and Taylor, 1997; Jones et al., 1997; Lipovatzet al., 1999; Casadesus et al., 2001, among others). These factors, along with activepromotion by governments and other bodies promoting the adoption of this type ofinnovation (business consultants, foundations, associations, etc.), have led toexponential growth in the number of certificates (Marimon et al., 2002). However, atsome time, fewer and fewer companies show any interest in obtaining certificationbecause, for example, the perceived competitive advantage of having the certificatediminishes. The economic/financial analogy seems clear: the value of the certificate isinversely proportional to the number of certificates in circulation. In short, there is aclear decrease in the number of certifications and a gradual tendency towards asaturation point.
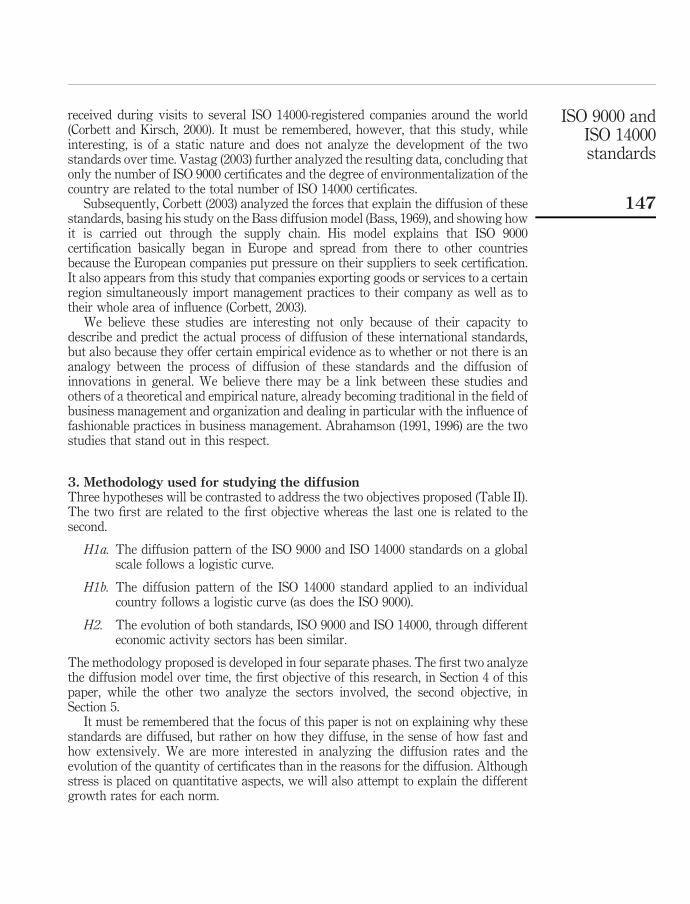
Figure 3 shows the development of both phenomena side-by-side. The black pointscorrespond to known historical data, while the white points are estimated from thelogistic models of each series. At the beginning the growth of ISO 9000 is relativelystrong (these are years in which ISO 9000 is already very popular and spreadingquickly), whereas ISO 14000 is still relatively unknown. From the year 2000 andforecasted until 2006, ISO 14000 grows more quickly. The following years arerepresented with superimposed points, indicating that the level of maturation of bothstandards has been reached: their growth comes to a standstill.
As was mentioned in the methodology section, a second phase of the study consistsof analyzing how these models can adapt not only to the aggregated data, but also tothe data for each individual country implementing the ISO 9000, as demonstrated byFranceschini et al. (2004) for different European countries. To do so, the logistic modelwas adjusted to the ISO 14000 certifications in the four countries we decided to analyze.The resulting models are shown in Table IV, in which it can be seen how well thetheoretical models fit. On the other hand, Franceschini et al. (2004) affirm that ISO 9000certifications in an individual country also fit the logistic curve, so the secondhypothesis is confirmed.
Figure 4 shows the data gathered in graphical form, showing how Spain will arriveat the threshold of 95 percent of its potential towards the end of 2004. However, in
Figure 3.Evolution of ISO 9000 andISO 14000 world widecertificates
Forecasted
Observed
0
10,000
20,000
30,000
40,000
50,000
60,000
70,000
80,000
0 200,000 400,000 600,000 800,000ISO 9000 CERTIFICATES WORLDWIDE
ISO
140
00 C
ERTI
FICA
TES
WO
RLDW
IDE
19951996
19971998
19992000
2001
2002
20032004
20052006 2011
IJOPM26,2
152

Table IV.Regression results
obtained by the logisticmodel for ISO 14000certificates in Spain,Japan, UK and USA
ISO 9000 andISO 14000standards
153
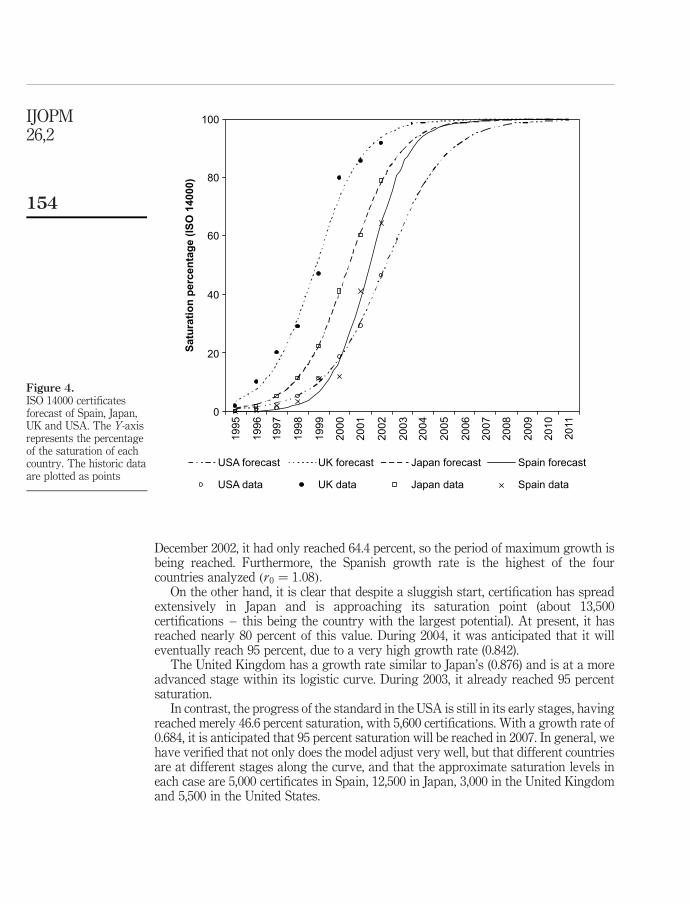
December 2002, it had only reached 64.4 percent, so the period of maximum growth isbeing reached. Furthermore, the Spanish growth rate is the highest of the fourcountries analyzed ðr0 ¼ 1:08Þ:
On the other hand, it is clear that despite a sluggish start, certification has spreadextensively in Japan and is approaching its saturation point (about 13,500certifications – this being the country with the largest potential). At present, it hasreached nearly 80 percent of this value. During 2004, it was anticipated that it willeventually reach 95 percent, due to a very high growth rate (0.842).
The United Kingdom has a growth rate similar to Japan’s (0.876) and is at a moreadvanced stage within its logistic curve. During 2003, it already reached 95 percentsaturation.
In contrast, the progress of the standard in the USA is still in its early stages, havingreached merely 46.6 percent saturation, with 5,600 certifications. With a growth rate of0.684, it is anticipated that 95 percent saturation will be reached in 2007. In general, wehave verified that not only does the model adjust very well, but that different countriesare at different stages along the curve, and that the approximate saturation levels ineach case are 5,000 certificates in Spain, 12,500 in Japan, 3,000 in the United Kingdomand 5,500 in the United States.
Figure 4.ISO 14000 certificatesforecast of Spain, Japan,UK and USA. The Y-axisrepresents the percentageof the saturation of eachcountry. The historic dataare plotted as points
0
20
40
60
80
100
1995
1996
1997
1998
1999
2000
2001
2002
2003
2004
2005
2006
2007
2008
2009
2010
2011
Satu
ratio
n pe
rcen
tage
(ISO
140
00)
USA forecast UK forecast Japan forecast Spain forecast
USA data UK data Japan data Spain data
IJOPM26,2
154
Finally, in order to get a more detailed answer, it was considered opportune toanalyze whether it was possible to adjust the intensity indicators of ISO 14000certifications to another logistic curve, following the same pattern as before. Weanalyzed, in particular, how the logistic curve adjusts to a variable constructed as aquotient between the number of certifications and the Gross National Product atconstant prices and, in addition, to a quotient of the number of certifications withrespect to the number of inhabitants as carried out by Saraiva and Duarte (2003). Theadjustment obtained in both cases is also very good, but not as good as the oneobtained directly from the number of certifications, which is why we have preferred touse those described previously.
5. Analysis of the diffusion of the standard among sectors of activityFollowing the methodology proposed, the third phase of the investigation consists ofan analysis of the diffusion of the ISO 9000 and ISO 14000 standards through theprincipal sectors of economic activity. To this end, we carried out a complementaryanalysis using commonly used indicators to find out the degree of competition that thecompanies maintain in a certain market, i.e. indicators of the degree of concentrationand the level of instability in these sectors. The degree of concentration refers to themarket share of the leading companies, whereas the level of stability analyzes therelative situation of each company, over time, in this market. Both concepts are appliedto the presence of companies from each sector of economic activity among the totalnumber of certifications. In other words, the same tools as before are applied, butbearing in mind that, in this case, the elements competing in the market forcertifications are the sectors, not the companies.
First of all, we studied the level of concentration of each standard. Is it true that justa few sectors of activity represent a high percentage of the number of certifications? Or,on the contrary, can we say that all the sectors have a similar number of certifications?Greer (1992) and Cabral (1997) maintain that a useful means of analyzing theconcentration is the Herfindahl index, designed originally to measure the concentrationof market share held by particular suppliers in a market and defined as:
H ¼Xn
i¼1
s2i
where si is the quota of sector i, and n is the number of sectors. The value of H variesbetween 1/n (minimum concentration) and 1 (maximum concentration). In our case, theminimum level is 0.026 (1/39). There are other indexes to evaluate the concentrationeffect, but compared to them, this is one that has better consistency properties(Jacquemin, 1987).
Secondly, we analyzed the instability of the ranking of sectors for each standard. Itis possible that the concentration index will remain stable over time, despite therebeing a continuous rotation of sectors heading the ranking for each standard. Cabral(1997) states that one of the most commonly used measures to calibrate this effect is theindex of instability, defined as:
I ¼1
2
Xn
i¼1
jsi2 2 si1j
ISO 9000 andISO 14000standards
155

where si1 and si2 are the quotas of sector i during periods 1 and 2. The index rangesfrom zero (minimum instability) to one (maximum instability). The value I ¼ 0 relatesto a situation in which all the sectors keep their share, while the value I ¼ 1corresponds to a situation in which all the sectors competing in the initial period areout of the market in the second period.
Figure 5 shows the development of the Herfindahl index, applied world wide to bothstandards. It shows how the ISO 9000 series has remained at a stable level ofconcentration during recent years, while ISO 14000 has also moved towards the samelevel of concentration. These values are much closer to the minimum concentrationvalue than to the upper limit. Thus, we can verify that the level of concentration foreach standard is similar and low.
Figure 6 shows the development of the instability indices for both standards. It canbe seen, first of all, that the tendency of both standards is towards lower levels ofinstability; that is to say, both are maturing with time, and the leading sectors for eachstandard maintain their positions with little variation. Secondly, it shows that ISO 9000is more stable than ISO 14000. This was expected, given the time lag between thecreation of each standard.
The analysis of these two indices shows that there is a high degree of similaritybetween the diffusion of each standard. On a world wide scale, each has a similar levelof concentration, looking at how each sector of activity is represented, and both showthe same tendency towards greater stability.
In addition, in order to find out whether the different sectors of activity arerepresented similarly in terms of the percentage of ISO 9000 and ISO 14000certifications, the Wilcoxon statistical test was applied. This is, in fact, the fourth and
Figure 5.Evolution of Herfindahlindex of ISO 9000 and ISO14000, applied to the worldwide certificates byeconomic activity sector
0
0.05
0.1
0.15
1998 1999 2000 2001 2002
ISO 9000 ISO 14000
Figure 6.Evolution of Instabilityindex of ISO 9000 and ISO14000, applied to the worldwide certificates byeconomic activity sector
0
0.05
0.1
0.15
0.2
1999 2000 2001 2002ISO 9000 ISO 14000
IJOPM26,2
156
final phase of the investigation. To do this, the variables that express the number ofISO 9000 and ISO 14000 certifications in each of the 39 sectors world wide in 2002 werestandardized. The Wilcoxon rank-sum test analyzes the 39 differences between thestandardized value for the ISO 14000 series and that of the ISO 9000 series. At asignificance level of 0.05, the test does not permit a rejection of the null hypothesis thatthe differences of the pairs of values are centered at zero. Using the analogy mentionedpreviously, we can, therefore, say that the degree to which each sector is represented, orits market share, is similar for each standard (Table V).
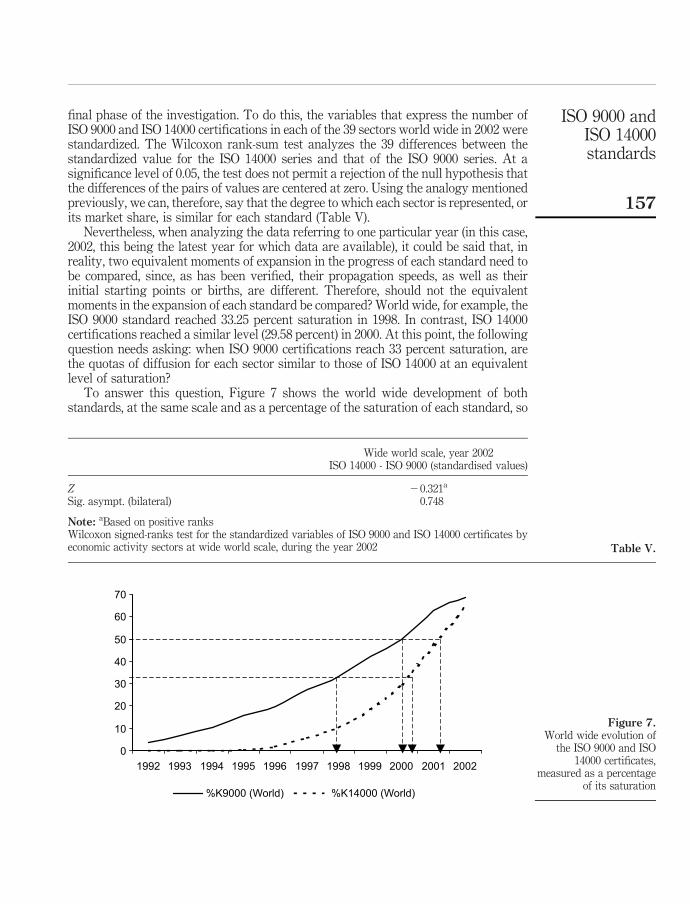
Nevertheless, when analyzing the data referring to one particular year (in this case,2002, this being the latest year for which data are available), it could be said that, inreality, two equivalent moments of expansion in the progress of each standard need tobe compared, since, as has been verified, their propagation speeds, as well as theirinitial starting points or births, are different. Therefore, should not the equivalentmoments in the expansion of each standard be compared? World wide, for example, theISO 9000 standard reached 33.25 percent saturation in 1998. In contrast, ISO 14000certifications reached a similar level (29.58 percent) in 2000. At this point, the followingquestion needs asking: when ISO 9000 certifications reach 33 percent saturation, arethe quotas of diffusion for each sector similar to those of ISO 14000 at an equivalentlevel of saturation?
To answer this question, Figure 7 shows the world wide development of bothstandards, at the same scale and as a percentage of the saturation of each standard, so
Wide world scale, year 2002ISO 14000 - ISO 9000 (standardised values)
Z 20.321a
Sig. asympt. (bilateral) 0.748
Note: aBased on positive ranksWilcoxon signed-ranks test for the standardized variables of ISO 9000 and ISO 14000 certificates byeconomic activity sectors at wide world scale, during the year 2002 Table V.
Figure 7.World wide evolution of
the ISO 9000 and ISO14000 certificates,
measured as a percentageof its saturation
0
10
20
30
40
50
60
70
1992 1993 1994 1995 1996 1997 1998 1999 2000 2001 2002
%K9000 (World) %K14000 (World)
ISO 9000 andISO 14000standards
157
that the equivalent moments in the development of each can be compared. Thus, wecan see that the number of ISO 9000 certifications reached 33 percent saturation in1998, while the ISO 14000 standard approached this level in 2000. It can also be seenthat ISO 9000 certifications reached 50 percent of their maximum level in 2000,whereas ISO 14000 certifications reached 50 percent in 2001.
Subsequently, we carried out the Wilcoxon test for the standardized variables of thenumber of ISO 9000 and ISO 14000 certifications, both by sectors, at two specificmoments:
(1) when the levels of certification of each standard were close to 33 percent of theirrespective saturation points; and
(2) when they reached 50 percent saturation.
In both cases, p-values are greater than 0.05, which does not allow rejection of the nullhypothesis and means the market share for each sector for both standards is similar. Itcan, therefore, be said that the sectors holding leading positions in the ranking of ISO9000 certifications at a given moment also occupy the leading positions in the rankingof ISO 14000 certifications at an equivalent moment and, in addition, they have similarquotas.
At this point, it is seen that the analysis carried out previously is highly pertinent. Infact, even when the situations for both standards are compared in one particular year(2002 in this case), the comparison is valid because, at that time, both standards hadvery similar levels of saturation: ISO 9000 at 69 percent and ISO 14000 at 64 percent.
This analysis was also carried out for the four countries that were studied in moredetail although, in these cases, other moments of equivalent level of progress needdefining in order to find various years with similar levels of development. To give anexample, ISO 9000 certifications reached 22.99 percent saturation in Japan in 1999. Bycoincidence, ISO 14000 certifications reached a similar level (22.40 percent) in the sameyear. In this case, therefore, the progress of each variable in 1999 should be compared.As a result of such analysis, it can be concluded that the diffusion of the two set ofstandards has taken place through the same sectors in the countries analyzed, althoughwith different rates of propagation.
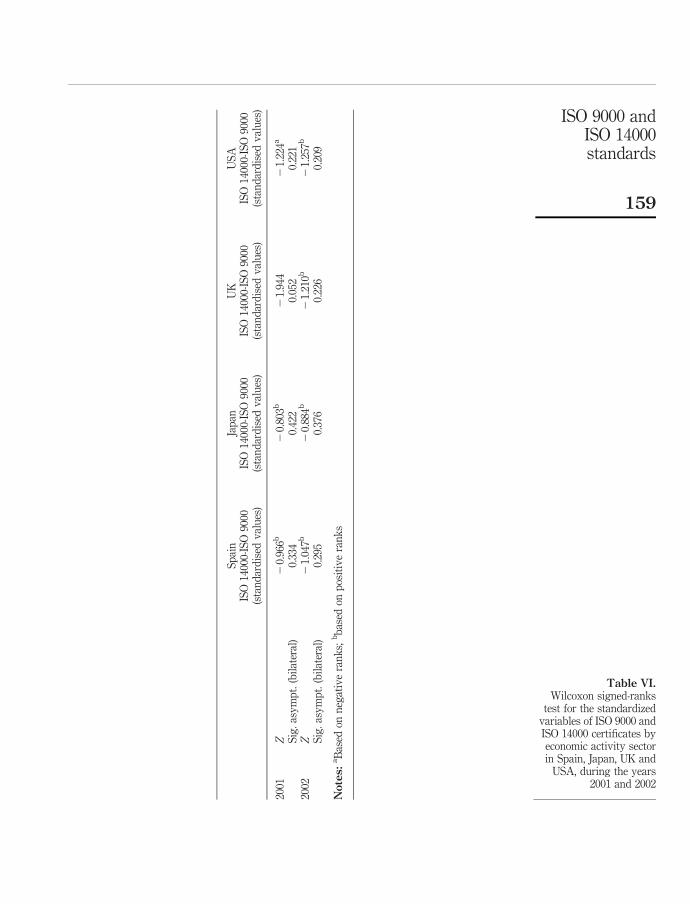
As has been said, both standards are currently at similar stages of development,which allows us, when studying the last two years, to carry out a Wilcoxoncomparative analysis, using data for each set of standards corresponding to the sameyear. Table VI shows the results for each of the four countries for the last two years.The market share of each sector for each standard is similar. Specifically, although thestatistics are not as robust as those shown in Table V (which analyzes the situationworld wide), they are sufficiently reliable to say that the quotas reached by eachstandard are similar, when compared directly to the situation during the same year.
After analysis of the evolution of Herfindahl and instability indexes, and theWilcoxon tests on the rankings of both standards comparing equivalent maturitymoments, we conclude that the third and last hypothesis formulated is accepted aswell: the evolution of both standards, throughout the economic activity sectors, hasbeen similar.
Finally, to reinforce this analysis, Figure 8 shows the development of the rankingsof the five leading sectors for each standard, world wide. It shows that there are foursectors that coincide in the two lists.
IJOPM26,2
158
Spain
ISO14000-ISO9000
(standardised
values)
Japan
ISO14000-ISO9000
(standardised
values)
UK
ISO14000-ISO9000
(standardised
values)
USA
ISO14000-ISO9000
(standardised
values)
2001
Z20.966b
20.803b
21.944
21.224a
Sig.asympt.(bilateral)
0.334
0.422
0.052
0.221
2002
Z21.047b
20.884b
21.210b
21.257b
Sig.asympt.(bilateral)
0.295
0.376
0.226
0.209
Notes:aBased
onnegativeranks;
bbased
onpositiveranks
Table VI.Wilcoxon signed-ranks
test for the standardizedvariables of ISO 9000 andISO 14000 certificates byeconomic activity sectorin Spain, Japan, UK andUSA, during the years
2001 and 2002
ISO 9000 andISO 14000standards
159
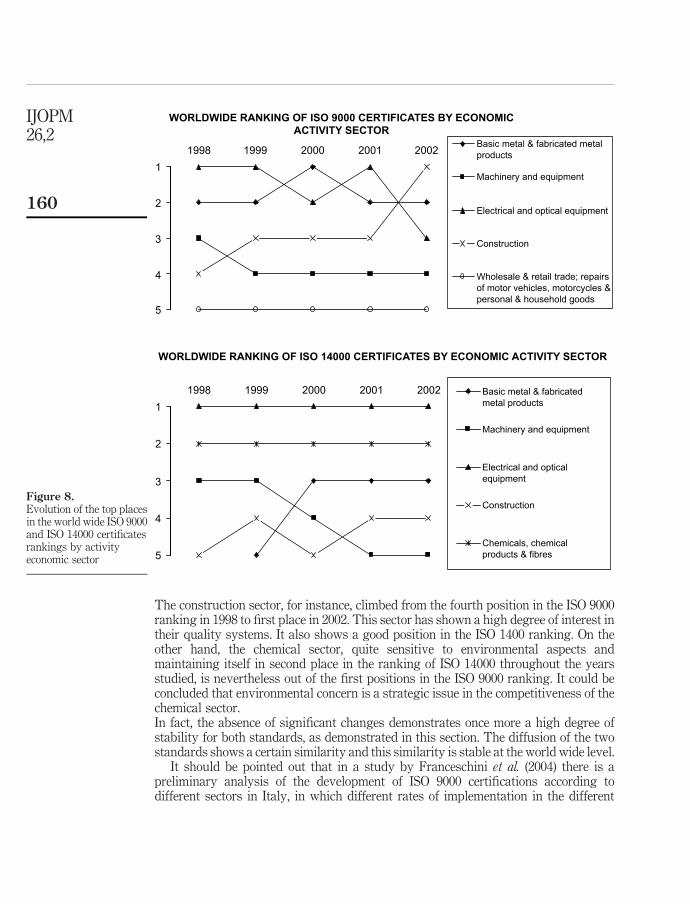
The construction sector, for instance, climbed from the fourth position in the ISO 9000ranking in 1998 to first place in 2002. This sector has shown a high degree of interest intheir quality systems. It also shows a good position in the ISO 1400 ranking. On theother hand, the chemical sector, quite sensitive to environmental aspects andmaintaining itself in second place in the ranking of ISO 14000 throughout the yearsstudied, is nevertheless out of the first positions in the ISO 9000 ranking. It could beconcluded that environmental concern is a strategic issue in the competitiveness of thechemical sector.In fact, the absence of significant changes demonstrates once more a high degree ofstability for both standards, as demonstrated in this section. The diffusion of the twostandards shows a certain similarity and this similarity is stable at the world wide level.
It should be pointed out that in a study by Franceschini et al. (2004) there is apreliminary analysis of the development of ISO 9000 certifications according todifferent sectors in Italy, in which different rates of implementation in the different
Figure 8.Evolution of the top placesin the world wide ISO 9000and ISO 14000 certificatesrankings by activityeconomic sector
WORLDWIDE RANKING OF ISO 9000 CERTIFICATES BY ECONOMICACTIVITY SECTOR
1
2
3
4
5
1998 1999 2000 2001 2002 Basic metal & fabricated metalproducts
Machinery and equipment
Electrical and optical equipment
Construction
Wholesale & retail trade; repairsof motor vehicles, motorcycles &personal & household goods
WORLDWIDE RANKING OF ISO 14000 CERTIFICATES BY ECONOMIC ACTIVITY SECTOR
1
2
3
4
5
1998 1999 2000 2001 2002 Basic metal & fabricatedmetal products
Machinery and equipment
Electrical and opticalequipment
Construction
Chemicals, chemicalproducts & fibres
IJOPM26,2
160
sectors were detected. Thus, although certain stability was found in the pioneeringsectors, the growth rate of certifications between sectors was highly uneven, leading toa forecast of short-term changes, exactly the opposite of what we found in ourinvestigation.
6. ConclusionsPan (2003) and Poksinska et al. (2003) had already demonstrated that many of thereasons why companies seek certification and the benefits obtained from certificationare the same for both the ISO 9000 and the ISO 14000, despite it being evident that theobjectives of each series of standards are completely different. However, in terms ofdiffusion, it was unknown until now whether or not the two standards followed thesame parameters.
It should be pointed out that the available data were incomplete, especially for ISO14000, which is one of the limitations of the study. Nevertheless, we believe that themethodology presented can be generalized across a broad variety of contexts.
In this paper, it has been demonstrated that, world wide, the expansion of both theISO 14000 and ISO 9000 standards have followed very similar patterns of diffusion.The ISO 9000 standard, much more popular and older, is at 68.7 percent of itssaturation point and will presumably reach it towards 2007. The ISO 14000 standard,which began to be implemented some years later, is spreading at a much greater speed,although with the same pattern of growth: the pattern established by the logistic curve.For this reason, it has currently reached nearly the same relative level as ISO 9000 andis forecasted, according to the model proposed here, to reach 95 percent saturation in2006.
According to the model proposed, both standards have currently reached animportant moment in their maturity: about two-thirds of their limit. Also, when weanalyze the presence of these standards in the different economic sectors, more signs oftheir maturity are to be seen. On one hand, both are developing towards smaller indicesof concentration and, on the other, there are fewer and fewer fluctuations in the sectors’positions in the rankings of certifications (the rates of instability for both standards tendtowards smaller values). From the analysis of individual countries, we also observedthat in the United States there is still a long way to go before the ISO 14000 standardbegins to fully mature, with an index of saturation currently at only 50 percent.
Furthermore, we can conclude from this study that both standards spread in similarways among the economic sectors: those sectors that were leaders or pioneers in theintroduction of the ISO 9000 standard, have played similar galvanizing roles in the caseof the ISO 14000 standard. We can, therefore, confirm the hypothesis establishedby some authors, according to whom the unprecedented surge in the progress ofthe ISO 9000 standard has been an important factor in explaining the surge in theISO 14000 standard (Mendel, 2001), a hypothesis already partly confirmed by a studyof a more general nature by Corbett and Kirsch (2001).
Regarding the limitations of this type of analysis of prediction basedon mathematical models, it should be said that they are studies based solely onendogenous factors of growth and that, therefore, they have important limitations,such as not taking into consideration the development of exogenous factors to theactual process of growth of the standards, which may include, for example, aradical division or change in tendencies at a particular moment during its progress.
ISO 9000 andISO 14000standards
161
Among other external factors that could be mentioned are new government policiesactively promoting implementation and certification in a particular country via grantsand incentives, the issuing of a new version of some of the standards (as has been thecase with ISO 9000), or successful entry into the market of another standard orsubstitute model.
Another important event that could not have been analyzed is the impact of the newrelease of the ISO 9000 standard, ISO 9001:2000, published at the end of the year 2000.We need more time to calibrate this effect.
Nevertheless, we believe that the results of this investigation may be relevant tothose institutions and organizations involved with this type of certification:accreditation organizations, certifying bodies as well as the business consultantsspecializing in the implementation of these systems.
On the other hand, we also consider these empirical conclusions to be of interestfrom a strictly academic point of view, particularly for the line of research analyzingthe diffusion and adoption of ideas, models, systems and tools of businessmanagement. We have demonstrated that these management tools spread following alogistic or S-shaped curve and that, in addition, they follow very similar parameters inall the cases analyzed. The question arises, however, as to why? Does this evidenceconfirm the theory of management fashions? Can this model be applied generally to theprocess of diffusion of other management standards, or to other types of organizationaland management innovations? Can the diffusion of management innovations becompared to product diffusion in line with the well-known service life cycle? And whydo certain members of a social system adopt innovations before others? In short, in ourview, the empirical statements gathered in this paper will lead to new questions andhypotheses that should provide further study of interest in the future.
Note
1. The formula used to calculate the densities of the ISO 9000 standard for a country in ageographic zone is:
IntensityISO 9000country ¼
Certificates ISO 9000country=GDPcountry
Certificates ISO 9000zone=GDPzone
There are analogous formulas for ISO 14000 densities.There is no doubt that it would be even more interesting to calculate this density, not inrelation to the GDP but, for example, in relation to the number of industrial plants orcompanies in each country. However, such data are too difficult to obtain and so the GDPwas chosen as the indicator.
References
Abrahamson, E. (1991), “Managerial fads and fashions: the diffusion and refection ofinnovations”, Academy of Management Review, Vol. 16 No. 3, pp. 586-612.
Abrahamson, E. (1996), “Management fashion”, Academy of Management Review, Vol. 21 No. 1,pp. 254-85.
Anderson, S.W., Daly, J.D. and Johnson, M.F. (1999), “Why firms seek ISO 9000 certification:regulatory compliance or competitive advantage?”, Production & OperationsManagement, Vol. 8 No. 1, pp. 28-43.
IJOPM26,2
162
Bass, F.M. (1969), “A new product growth model for consumer durables”, Management Science,Vol. 15 No. 5, pp. 215-27.
Beechner, A.B. and Koch, J.E. (1997), “Integrating ISO 9001 and ISO 14001”, Quality Progress,Vol. 30 No. 2, pp. 33-6.
Boyee, W. and Di Prima, R. (1992), Elementary Differential Equations, 5th ed., Wiley, New York,NY.
Brown, A. and Van der Wiele, T. (1995), “Industry experience with ISO 9000”, Asia PacificJournal of Quality Management, Vol. 4 No. 2, pp. 8-17.
Cabral, L. (1997), Economıa Industrial, 1st ed., McGraw-Hill, Madrid.
Carlsson, M. and Carlsson, D. (1996), “Experiences of implementing ISO 9000 in Swedishindustry”, International Journal of Quality & Reliability Management, Vol. 13 No. 7,pp. 36-47.
Casadesus, M., Gimenez, G. and Heras, I. (2001), “Benefits of ISO 9000 implementation in Spanishindustry”, European Business Review, Vol. 13 No. 6, pp. 327-36.
Corbett, C.J. (2003), “Global diffusion of ISO 9000 certification through supply chains”, availableat: http://personal.anderson.ucla.edu/charles.corbett/papers/02-001.pdf (accessedDecember 12, 2004).
Corbett, C.J. and Kirsch, D.A. (1999), “The linkage between ISO 9000 and ISO 14000 standards: aninternational study”, working paper, Center for International Business Education &Research, UCLA Anderson School of Management, Los Angeles, CA.
Corbett, C.J. and Kirsch, D.A. (2000), “ISO 14000: an agnostic’s report from the front line”,ISO 9000 þ ISO 14000 News, No. 2, pp. 4-17.
Corbett, C.J. and Kirsch, D.A. (2001), “International diffusion of ISO 14000 certification”,Production & Operations Management, Vol. 10 No. 3, pp. 327-42.
Dale, B.G. (2002), Managing Quality, 3rd ed., Blackwell Publishing, Oxford.
Escanciano, C., Fernandez, E. and Vazquez, C. (2001), “ISO 9000 certification and qualitymanagement in Spain: results of a national survey”, The TQM Magazine, Vol. 13 No. 3,pp. 192-200.
Franceschini, F., Galetto, M. and Gianni, G. (2004), “A new forecasting model for the diffusion ofISO 9000 standard certifications in European countries”, International Journal of Quality &Reliability Management, Vol. 21 No. 1, pp. 32-50.
Gotzamani, K.D. and Tsiotras, G.D. (2002), “The true motives behind ISO 9000 certification: theireffect on the overall certification benefits and long term contribution towards TQM”,International Journal of Quality & Reliability Management, Vol. 19 No. 2, pp. 151-69.
Greer, D.F. (1992), Industrial Organization and Public Policy, 3rd ed., Macmillan PublishingCompany, New York, NY.
ISO (2003), The ISO Survey of ISO 9000 and ISO 14000 Certifications: 12th Cycle, ISO, Geneva.
Jacquemin, A. (1987), The New Industrial Organization: Market Forces and Strategic Behavior,1st ed., The MIT Press, Cambridge, MA.
Jones, R., Arndt, G. and Kustin, R. (1997), “ISO 9000 amongst Australian companies: impact oftime and reasons for seeking certification on perceptions of benefits received”,International Journal of Quality & Reliability Management, Vol. 14 No. 7, pp. 650-60.
Karapetrovic, S. andWillborn, W. (1998), “Integration of quality and environmental managementsystems”, The TQM Magazine, Vol. 10 No. 3, pp. 204-13.
Lee, K.S. and Palmer, E. (1999), “An empirical examination of ISO 9000-registered companies inNew Zealand”, Total Quality Management, Vol. 10 No. 6, pp. 887-99.
ISO 9000 andISO 14000standards
163

Lipovatz, D., Stenos, F. and Vaka, A. (1999), “Implementation of ISO 9000 quality systems inGreek enterprises”, International Journal of Quality & Reliability Management, Vol. 16No. 6, pp. 534-51.
Marimon, F., Casadesus, M. and Heras, I. (2002), “Do quality consultants offer a quality service?”,Total Quality Management, Vol. 13 No. 6, pp. 797-811.
Martınez, C., Balbastre, F. and Escrig, A.B. (2001), “La evaluacion en el marco de la gestion de lacalidad: un analisis en funcion del enfoque utilizado”, Revista Europea de Direccion yEconomıa de la Empresa, Vol. 10 No. 1, pp. 37-54.
Meegan, S.T. and Taylor, W.A. (1997), “Factors influencing a successful transition from ISO 9000to TQM: the influence of understanding and motivation”, International Journal of Quality& Reliability Management, Vol. 14 No. 2, pp. 100-17.
Mendel, P.J. (2001), “International standardization and global governance: the spread of qualityand environmental management standards”, in Hoffman, A. and Ventresca, M. (Eds),Organizations, Policy and the Natural Environment: Institutional and StrategicPerspectives, 1st ed., Stanford University Press, Stanford, CA.
Nakamura, M., Takahashi, T. and Vertinsky, I. (2001), “Why Japanese firms choose to certify: astudy of managerial responses to environmental issues”, Journal of EnvironmentalEconomics & Management, Vol. 42 No. 1, pp. 23-52.
Pan, J. (2003), “A comparative study on motivation for and experience with ISO 9000 and ISO14000 certification among far Eastern countries”, Industrial Management & Data Systems,Vol. 103 Nos 8/9, pp. 564-78.
Peach, R. (2002), The ISO 9000 Handbook, 4th ed., QSU Publishing Company, Virginia, VA.
Poksinska, B., Dahlgaard, J.J. and Eklund, J.A.E. (2003), “Implementing ISO 14000 in Sweden:motives, benefits and comparisons with ISO 9000”, International Journal of Quality &Reliability Management, Vol. 20 No. 5, pp. 585-606.
Roger, E. (1995), The Diffusion of Innovation, 2nd ed., Free Press, New York, NY.
Romano, P. (2000), “ISO 9000: what is its impact on performance?”, Quality Management Journal,Vol. 7 No. 3, pp. 38-56.
Saraiva, P.M. and Duarte, B. (2003), “ISO 9000: some statistical results for a world widephenomenon”, Total Quality Management & Business Excellence, Vol. 14 No. 10,pp. 1169-78.
Sohal, A.S. and Terziovski, M. (2000), “TQM in Australian manufacturing: factors critical tosuccess”, International Journal of Quality & Reliability Management, Vol. 17 No. 2,pp. 158-68.
Stoneman, P. (1995), Handbook of the Economics of Innovation and Technological Change, 1st ed.,Blackwell Handbooks in Economics, Oxford.
Teece, D. (1980), “The diffusion of an administrative innovation”, Management Science, Vol. 26No. 5, pp. 464-70.
Terziovski, M., Samson, D. and Dow, D. (1997), “The business value of quality managementsystems certification. Evidence from Australia and New Zealand”, Journal of OperationsManagement, Vol. 15 No. 1, pp. 1-18.
Van der Welt, D. (1997), “Case study of ISO 14000: a new business guide for global environmentalprotection”, Environmental Quality Management, pp. 1-19.
Vastag, G. (2003), “Revisiting ISO 14000: A new “look” at the drivers of certification”, workingpaper, Indiana University.
Vloeberghs, D. and Bellens, J. (1996), “Implementing the ISO 9000 standards”, Quality Progress,Vol. 29 No. 6, pp. 43-8.
IJOPM26,2
164

Withers, B.E. and Ebrahimpour, M. (1996), “An examination of ISO 9000 registration practices ofAmerican, German and Japanese firms operating in the USA”, International Journal ofQuality & Reliability Management, Vol. 13 No. 7, pp. 8-22.
Appendix. Logistic curve
The logistic model describes the development of a population which grows with a net growthrate r (Boyee and Di Prima, 1992). It was introduced by Pierre Verhulst (1938) to describephenomena related to the growth of the biomass of species:
dN
dt¼ rN ð1Þ
From the initial size (N0), the population grows at a rate r, which also depends on the size of thepopulation, according to the following expression:
r ¼ r0 12N
K
� �ð2Þ
The population experiences a maximum growth rate (r0) when the size of the population is closeto zero. K is the saturation size. When the population reaches this size, it stops growing. In thisway, growth can be expressed as:
dN
dt¼ r0 12
N
K
� �N ¼ r0N 2
r0
KN 2 ð3Þ
This is a Bernoulli differential equation, whose solution is:
N ¼N 0K
ðK 2 N 0Þe2r0t þ N 0
ð4Þ
The phenomenon related to the growth of the biomass of species requires the condition N 0 – 0:Obviously, when the norms were published the number of certifications was zero. However, webelieve that it is not wrong to apply this model in our case, because we analyze the evolution ofcertifications from the 31 December of the year in which the norm was published, so the initialnumber was not zero, although it was very low.
Corresponding authorMartı Casadesus Fa can be contacted at: [email protected]
ISO 9000 andISO 14000standards
165
To purchase reprints of this article please e-mail: [email protected] visit our web site for further details: www.emeraldinsight.com/reprints