Ireland's Greenhouse Gases Emissions Projections - EPA · PDF fileIreland’s Greenhouse...
17
EPA 2017 GHG Emission Projections Report April 2017 Ireland’s Greenhouse Gas Emission Projections 2016-2035 April 2017
Transcript of Ireland's Greenhouse Gases Emissions Projections - EPA · PDF fileIreland’s Greenhouse...

EPA 2017 GHG Emission Projections Report April 2017
Ireland’s Greenhouse Gas Emission Projections
2016-2035
April 2017

EPA 2017 GHG Emission Projections Report April 2017
Overview of Ireland’s Greenhouse Gas Emission Projections
This report provides an assessment of Ireland’s progress towards achieving its emission reduction targets set down under the EU Effort Sharing Decision (Decision No 406/2009/EC) for the years 2013-2020 and a longer term assessment based on current projections.
Ireland’s 2020 target is to achieve a 20% reduction of non-Emission Trading Scheme (non-ETS) sector emissions (i.e. agriculture, transport, the built environment, waste and non-energy intensive industry) on 2005 levels with annual limits set for each year over the period 2013-2020.
The EPA has produced two scenarios in preparing greenhouse gas emission projections; a With Existing Measures scenario and a With Additional Measures scenario.
For 2017 projections, the With Additional Measures scenario takes into account an expected shortfall in achieving full energy efficiency targets and renewable targets for electricity, transport and heat as set out in the National Energy Efficiency Action Plan and National Renewable Energy Action Plan.
To assess progress towards achieving reduction targets out to 2020 the EPA is using legislative limits (for the period 2013-2016) and estimated annual limits (for the period 2017-2020) which will possibly be included in a European Commission proposal that takes into account methodological changes underpinning greenhouse gas emission inventories.
For 2020 it is estimated that non-ETS sector emissions are projected to be 4% - 6% below 2005 levels by 2020. This compares to the target of 20% below 2005 levels by 2020.
To determine compliance under the Effort Sharing Decision, any overachievement of the binding emission limit in a particular year (in the period 2013 to 2020) can be banked and used towards compliance in a future year. Under both scenarios Ireland is expected to exceed the annual limit in 2016.
Under the With Existing Measures scenario, Ireland is projected to cumulatively exceed its obligations by 13.7 Mt of CO2eq over the period 2013-2020. Under the With Additional Measures scenario, Ireland is projected to cumulatively exceed its obligations by 11.5 Mt of CO2eq over the period 2013-2020. This takes into account the overachievement of the annual limits in the period 2013-2015 which is banked and used in the years 2016-2020. Using this mechanism Ireland is projected to cumulatively exceed its obligations in 2019.
Agriculture and transport dominate non-ETS sector emissions; emission trends from these sectors will be key determinants in terms of meeting targets with both projected to increase in the period to 2020.
There will be new obligations (as yet undefined) for the years 2021-2030. Based on current emission projections, it is estimated that by 2030 total non-ETS emissions will be 1%-3% below 2005 levels. The estimates of greenhouse gas emissions to 2035 assume a continuation of the effect of policies and measures that are in place in 2020.

EPA 2017 GHG Emission Projections Report April 2017
Page 1 of 15
1. Introduction The Environmental Protection Agency (EPA) produces greenhouse gas emission projections on an annual basis for all sectors of the economy in collaboration with relevant State and other bodies. These projections are compiled to meet EU reporting obligations (Monitoring Mechanism Regulation No 525/20131) and also to inform national policy development. These projections update those published in March 20162 by the EPA. Much of the discussion in this document focuses on emissions up to 2020 and Ireland’s projected compliance under the EU 2020 targets. The document also provides information on the EU and national policy position context and emission projections beyond 2020. 2. Approach Greenhouse gas emissions were projected to 20353 using two scenarios: a With Existing Measures scenario and a With Additional Measures scenario. The With Existing Measures scenario assumes that no additional policies and measures, beyond those already in place by the end of 2015 (latest national greenhouse gas emission inventory), are implemented. The With Additional Measures scenario assumes implementation of the With Existing Measures scenario in addition to, based on current progress, further implementation of Government renewable and energy efficiency targets for 2020, as set out in the National Renewable Energy Action Plan (NREAP) and the National Energy Efficiency Action Plan (NEEAP). For 2017 projections, the With Additional Measures scenario takes into account an expected shortfall in achieving full energy efficiency targets and renewable energy targets for electricity, transport and heat as set out in the NEEAP and NREAP. 2017 greenhouse gas emission projections were prepared with data provided by a number of key data providers including:
Energy Forecasts provided by the Sustainable Energy Authority of Ireland in March 2017
Agricultural forecasts provided by Teagasc in December 2015 Energy forecasts were prepared by SEAI in conjunction with the Economic and Social Research Institute (ESRI) and University College Cork. The ESRI use macro-economic projections which are produced using the COSMO model4. The baseline projections and underlying assumptions are described in Chapter 1 of “Ireland’s Economic Outlook: Perspectives and Policy Challenges”, published on 5th December 20165. Projections on the global economic environment, including oil prices, as based in simulations using the NiGEM model (National Institute Global Econometric Model6) maintained by the National Institute of Economic and Social Research7.
1 Regulation (EU) No 525/2013 of the European Parliament and of the Council of 21 May 2013 on a mechanism for
monitoring and reporting greenhouse gas emissions and for reporting other information at national and Union level relevant to climate change and repealing Decision No. 280/2004/EC 2 http://www.epa.ie/pubs/reports/air/airemissions/irelandsgreenhousegasemissionsto2020anupdate.html
3 For 2017 reporting the Monitoring Mechanism Regulation (Regulation (EU)) No. 525/2013) requires Member States to
report greenhouse gas emission projections out to 2035 4 https://www.esri.ie/projects/modelling-the-irish-economy/
5 http://www.esri.ie/pubs/EO1.pdf
6 https://nimodel.niesr.ac.uk/
7 http://www.niesr.ac.uk/

EPA 2017 GHG Emission Projections Report April 2017
Page 2 of 15
Projections from the COSMO model were used to produce projections of the energy demand equation time series variables (i.e. demand equations by fuel and sector). The integration of energy demand into the COSMO model is work that is due to be undertaken in 2017. For the With Additional Measures scenario, the determination of expected progress in the implementation of NREAP and NEEAP targets out to 2020 was coordinated by SEAI and is reflected in the energy forecasts output as provided to the EPA in March 2017. Forecasted activity data for the agriculture sector (animal numbers, crop areas and fertiliser use) is the same data provided by Teagasc in December 2015 in advance of the preparation of 2016 emission projections. This dataset includes the proposed national herd, crop areas and fertilizer use to meet the overarching objectives of Food Wise 20258. There are anticipated to be changes to the Effort Sharing annual limits and 2020 targets for Member States, including Ireland, as a result of changes to reporting guidelines and methodologies which were adopted in relation to compiling greenhouse gas emission inventories. Box 1 details these changes and how the EPA is dealing with these anticipated changes to the limits in the presentation of these projections. The EPA also prepares emission projections for the land use and land use change and forestry sector (LULUCF) however the impact of forest sinks is not included in this compliance assessment. This is in line with EU accounting rules which do not allow the use of forest sinks to meet EU 2020 targets. Member States can, however, achieve compliance through a number of other mechanisms which are set out in the EU Effort Sharing Decision (Decision No 406/2009/EC). These include borrowing a quantity of its annual emission allocation i.e. limit from the following year, use of transfers from other Member States and the limited use of international credits from project activities as long as certain criteria are met. The key macroeconomic assumptions and a more detailed description of the two scenarios are provided in Appendices I-III.
8 Food Wise 2025. A 10-year vision for Irish agri-industry. Department of Agriculture, Food and the Marine, 2015.
https://www.agriculture.gov.ie/foodwise2025/
Box 1. New methodologies and UNFCCC reporting guidelines – Impacts on EU Effort Sharing Annual Limits and 2020 Targets
In accordance with Article 27 of the Monitoring Mechanism Regulation (Regulation (EU) 525/2013) the European Commission was required to examine the impact of the use of the 2006 IPCC Guidelines for National Greenhouse Gas Inventories and significant changes brought about by the UNFCCC methodologies by December 2016. For this year’s projections, the EPA is using legislative limits (for the period 2013-2016) and estimated annual limits (for the period 2017-2020) which will possibly be included in a European Commission proposal (following the above Article 27 review) that takes into account methodological changes underpinning greenhouse gas emission inventories. These estimates are provided to give an indication of how Ireland is likely to perform relative to amended EU targets and are subject to a Commission proposal being finalised and adopted.

EPA 2017 GHG Emission Projections Report April 2017
Page 3 of 15
3. Projected performance relative to EU 2020 Targets The EU’s Effort Sharing Decision (Decision No 406/2009/EC) set 2020 targets for EU Member States including Ireland. These targets cover greenhouse gas emissions from sectors that are not included in the EU Emissions Trading Scheme. For Ireland these sectors cover agriculture, transport, built environment (residential, commercial/institutional), waste and non-energy intensive industry – collectively referred to as non-ETS sector emissions – and Ireland’s target is to achieve a 20% reduction by 2020 on 2005 levels. In addition, there are annual emission limits for the period 2013-2020 to ensure a gradual move towards the 2020 target. Any overachievement of the binding emission limit in a particular year can be banked and used towards compliance in a future year. Figure 1 shows projected emission levels for non-ETS sector emissions under the With Existing Measures and With Additional Measures scenarios. In addition, it shows the annual compliance/non-compliance in relation to the annual emission limits.
Figure 1. With Existing Measures and With Additional Measures greenhouse gas emissions projections and comparison with the reduction pathway required between 2013 and 2020
The main findings from the projections published in this report are:
Ireland’s non-ETS sector emissions are projected to be 4% - 6% below 2005 levels by 2020.
Agriculture and transport dominate non-ETS sector emissions accounting for approximately 74% of emissions in 2020 under the With Additional Measures scenario as shown in Figure 2 below. Emission trends from these sectors will be key determinants in terms of meeting targets.
0
5
10
15
20
25
30
35
40
45
50
2013 2014 2015 2016 2017 2018 2019 2020
Mt
CO
2eq
WM Non-ETS Emissions WAM Non-ETS Emissions Annual Limits

EPA 2017 GHG Emission Projections Report April 2017
Page 4 of 15
o Agriculture emissions are projected to increase by 4% to 5% by 2020 from current levels. This reflects the impact of Food Wise 2025. Fertiliser use efficiency gains are assumed under the With Additional Measures scenario.
o Transport emissions are projected to show strong growth over the period to 2020 with 10% to 12% increase on 2015 levels. This reflects the strong economic growth forecasted over the next period.
Figure 2 presents the percentage share of non-ETS greenhouse gas emissions emissions by sector in 2020 under the With Additional Measures scenario.
Figure 2. Projected sectoral share of non-ETS greenhouse gas emissions in 2020 for the With Additional Measures scenario
To determine compliance under the Effort Sharing Decision (Decision No 406/2009/EC), any overachievement of the binding emission limit in a particular year can be banked and used towards compliance in a future year. Under both scenarios Ireland is projected to exceed its annual limit in 2016. The overachievement in relation to annual limits over the period 2013-2015 can be used towards compliance.
Using the above mechanism Ireland is projected to cumulatively exceed its obligations by 13.7 Mt of CO2eq over the period 2013-2020 under the With Existing Measures scenario. Under the With Additional Measures scenario, Ireland is projected to cumulatively exceed its obligations by 11.5 Mt of CO2eq over the period 2013-2020. Figure 3 shows the projected cumulative distance to target over the period 2013-2020. Using this mechanism Ireland is projected to cumulatively exceed its obligations in 2019.
Energy 1%
Agriculture 45%
Transport 29%
Industry and Commercial
9%
Residential 14%
Other combustion
1%
Waste 1%

EPA 2017 GHG Emission Projections Report April 2017
Page 5 of 15
Figure 3. Projected cumulative distance to target for Ireland’s Non-ETS emissions 2013 to 2020
4. Sectoral Emissions to 2020 Sectoral emissions in this section of the report are presented in a classification which is largely consistent with the greenhouse gas emissions inventory categories as published in November 20169 (see also Appendix 3 for further explanation of the categories). A detailed data file on emissions from these sectors out to 2035 is available10. Figure 4 presents the percentage share of total emissions by sector in 2020 under the With Additional Measures scenario.
9 http://www.epa.ie/pubs/reports/air/airemissions/ghgemissions/
10 http://www.epa.ie/climate/emissionsinventoriesandprojections/nationalemissionsprojections/
-12
-10
-8
-6
-4
-2
0
2
4
6
8
10
12
14
16
2013 2014 2015 2016 2017 2018 2019 2020
Mt
CO
2eq
With Measures With Additional Measures

EPA 2017 GHG Emission Projections Report April 2017
Page 6 of 15
Figure 4. Projected sectoral share of total greenhouse gas emissions (includes ETS and non ETS emissions) in 2020 in the With Additional Measures scenario
Energy Industries
The majority of emissions from this sector are not covered by the EU Effort Sharing Decision (Decision No 406/2009/EC). This section covers public electricity and heat production, solid fuels and other energy industries, petroleum refining and fugitive emissions. The majority of emissions come from power generation.
Under the With Existing Measures scenario, total energy sector emissions are projected to decrease by 13% over the period 2015 – 2020 to 10.2 Mt CO2eq. Renewable electricity generation capacity is dominated by wind but also includes, for example, the operation of a second waste to energy incinerator (Poolbeg) and the continued development of landfill gas electricity generation.
Under the With Additional Measures scenario, total energy sector emissions are projected to decrease by 26% over the period 2015 – 2020 to 8.7 Mt CO2eq. it is assumed that for 2020 there is a 37.3 % share of renewable energy in electricity generation (falling short of the full 40% NREAP target) as a result of additional expansion in wind energy, biomass electricity generating capacity in addition to solar photo voltaics.
Residential
Under the With Existing Measures scenario, emissions from the residential sector are projected to increase by less than 2% to 6.1 Mt CO2eq between 2015 and 2020. The following measures are included in the With Existing Measures emission projection: SEAI’s Greener Homes Scheme, Warmer Homes Scheme, Better Energy Homes Scheme, Energy Supplier Obligation Scheme, Better Energy Communities Scheme, Energy Efficient Boiler Standard, 2002, 2008 and 2011 Building Regulations and the carbon tax on fuels introduced in 2010.
Energy Industries
15%
Residential 10%
Manufacturing Combustion
9%
Commercial and Public
Services 3% Transport
22%
Industrial Processes
4%
F-Gases 1%
Agriculture 35%
Waste 1%

EPA 2017 GHG Emission Projections Report April 2017
Page 7 of 15
Under the With Additional Measures scenario, emissions are projected to slightly increase by less than 0.5% between 2015 and 2020 to 6 Mt CO2eq. Additional measures in this scenario include an increase in renewables in heating and further energy efficiency measures to progress the achievement of the NEEAP target.
Manufacturing Combustion
Under the With Existing Measures emission projection, emissions from manufacturing combustion are projected to increase by 16.8 % between 2015 and 2020 while final energy demand is projected to increase by 19% over the same period. This scenario takes into account measures such as SEAI Large Industry Programme, Combined Heat and Power deployment, Renewable Heat Scheme and the Carbon Tax measure.
Under the With Additional Measures emission projection, emissions from industrial combustion are projected to increase by 13.3%. Additional measures in this scenario include an increase in renewables in heating and further energy efficiency measures to progress the achievement of the NEEAP target. The projected rate of thermal energy sourced from renewable sources is 9% (across the residential, commercial services and industrial sectors) by 2020 based on current forecasts. This falls short of the full NREAP RES-H 12% target.
Commercial and Public Services
Under the With Existing Measures scenario, emissions from the commercial and public services sector are projected to increase by 11% to 1.9 Mt Mt CO2eq between 2015 and 2020. The impact of the Accelerated Capital Allowance Scheme, Supports for Exemplar Energy Efficient Projects (SEEEP) and Energy Efficiency Retrofit Fund (EERF), SEAI energy agreements such as the Large Industry Network, Combined Heat and Power and supports for energy efficiency improvements are included in this scenario.
Under the With Additional Measures scenario, emissions from the commercial and public services sector are projected to decrease by 8.5% to 1.5 Mt Mt CO2eq between 2015 and 2020. Additional measures in this scenario include an increase in renewables in heating and further energy efficiency measures to progress the achievement of the NEEAP target. The projected rate of thermal energy sourced from renewable sources is 9% (across the residential, commercial services and industrial sectors) by 2020 based on current forecasts.
Transport
Under the With Existing Measures scenario, transport emissions are projected to increase by 12% over the period 2015 – 2020 to 13.2 Mt CO2eq. The With Existing Measures scenario includes:
o the impact of VRT and motor tax changes (introduced in 2008), public transport efficiencies (e.g. integrated ticketing) and the carbon tax imposed on fuels since 2010
o improvements to the fuel economy of private cars o a RES-T of 5.5% of transport energy demand is in place by 2020 which is supported
by the Biofuel Obligation Scheme 201011.
11
http://www.dccae.gov.ie/energy/en-ie/Renewable-Energy/Pages/Biofuels.aspx

EPA 2017 GHG Emission Projections Report April 2017
Page 8 of 15
Under the With Additional Measures scenario, transport emissions are projected to increase by 10% over the period 2015 – 2020 to 13 Mt CO2eq. In this scenario, it is assumed that:
o a RES-T of 8% of total transport fuel demand is in place by 2020. This is underpinned by further roll out of the Biofuels Obligation Scheme and the further uptake of electric vehicles (10,000 electric vehicles deployed by 2020). This falls short of the full NREAP RES-T 10 % target.
Industrial Processes
Process emission projections were developed for industrial processes, the majority of which come from cement and lime industries. Other sources in this category include non-energy products from fuels and solvent use and other product manufacture. Projected emissions from the cement industries are estimated using projected GDP data. Only one projected scenario was developed for these sectors based on available data.
Process emissions from industrial processes are projected to increase by 17% from 1.9 Mt of CO2eq in 2015 to 2.3 Mt of CO2eq in 2020 under both the With Existing Measures and With Additional Measures scenarios.
Fluorinated Gases (F-Gases)
Only one F-gas emission projection outlook is developed based on available data. The relevant source of fluorinated gas emissions in Ireland is production, use and disposal of equipment containing these fluids (e.g. refrigerators, mobile air conditioning systems, metered dose inhalers and electrical switch-gear).
Fluorinated-gas emissions are projected to decrease by 19.8 % to 915.6 Gg CO2eq between 2015 and 2020. The savings associated with the impact of Directive 2006/40/EC12 are included in this scenario.
Agriculture
Agriculture sector emissions arise from enteric fermentation, manure management and nitrogen & urea application to soils, combustion from agriculture/forestry/fishing. For agriculture emission projections, two scenarios or outlooks for the future are estimated both of which assume achievement of Food Wise 202513. The difference between the two scenarios is less than 1% and is attributable to the inclusion of nitrogen fertilizer use efficiencies in the With Additional Measures scenario. The data underpinning the projections include forecasted animal numbers, crop areas and projected nitrogen fertiliser application to soils supplied by Teagasc in December 2015.
Total emissions from agriculture are projected to increase by 5% over the period 2015 – 2020 to 20.8 Mt CO2eq under the With Existing Measures scenario. The dairy cow herd is projected to increase by 7% on 2015 levels while the beef herd is projected to slightly decrease by less than 0.5% by 2020. Nitrogen fertiliser use is projected to increase by 21% on 2015 levels by 2020 under the With Existing Measures scenario and 12% under the With Additional Measures scenario.
12
Directive 2006/40/EC Relating to emissions from air-conditioning systems in motor vehicles and amending Council Directive 70/15/EEC 13
https://www.agriculture.gov.ie/foodwise2025/

EPA 2017 GHG Emission Projections Report April 2017
Page 9 of 15
Waste
There is one scenario for greenhouse gas emissions from the waste sector based on available data. The waste sector includes landfill, incineration and open burning of waste, mechanical & biological treatment and wastewater treatment.
The scenario assumes a continued requirement for landfill as a disposal option for residual waste14. Under this scenario it is also assumed that the total municipal solid waste generated increases in line with GNP growth. Ireland has met all Landfill Directive targets for diversion of biodegradable municipal waste (BMW) from landfill to date.
For the waste sector, greenhouse gas emissions are projected to decrease by 36% by 2020 on 2015 levels which are primarily attributable to methane emissions from landfill reducing significantly. This is underpinned by increased recovery (including recycling and energy recovery) of waste materials and adherence to Food Waste Regulations which reduces the organic content of landfilled waste and thus its greenhouse gas production potential.
It is also assumed that methane capture at landfills increases from the current level of 63% of total methane generated in 2015 to 75% in 2020.
5. Policy context for greenhouse gas emission reductions beyond 2020 European: 2030 framework for climate and energy policies
EU leaders agreed a 2030 policy framework in October 2014 that will see a domestic EU greenhouse gas reduction target of at least 40% compared to 1990. To achieve the overall 40% target, the sectors covered by the EU emissions trading system (EU ETS) would have to reduce their emissions by 43% compared to 2005. Emissions from sectors outside the EU ETS would need to be cut by 30% below the 2005 level. This will need to be translated into Member State targets. A new Effort Sharing Regulation which will set out targets for each Member State out to 2030 is currently being developed. 2030 targets for Ireland have not yet been finalised. National: National Policy Position and Climate Action and Low Carbon Development Act 2015
Ireland’s National Policy Position on Climate change15 sets out a low-carbon roadmapping process that will be guided by a long-term vision of low-carbon transition based on:
an aggregate reduction in carbon dioxide (CO2) emissions of at least 80% (compared to 1990 levels) by 2050 across the electricity generation, built environment and transport sectors;
in parallel, an approach to carbon neutrality in the agriculture and land-use sector, including forestry, which does not compromise capacity for sustainable food production.
The Climate Action and Low Carbon Development Act 2015 sets out the national objective of transitioning to a low carbon, climate resilient and environmentally sustainable economy in the period up to and including the year 2050.
14
Residual waste is defined as the fraction of collected waste remaining after a treatment or diversion step which generally requires further treatment or disposal 15
http://www.housing.gov.ie/sites/default/files/migrated-files/en/Publications/Environment/Atmosphere/FileDownLoad%2C37827%2Cen.pdf

EPA 2017 GHG Emission Projections Report April 2017
Page 10 of 15
The Act provides for the preparation, and approval by the Government, of five-yearly National Low Carbon Transition and Mitigation Plans (or “National Mitigation Plans”) which will set out how Ireland’s national greenhouse gas emissions are to be reduced. In particular, each successive National Mitigation Plan will specify the policy measures that will be required to be adopted by each relevant Minister of the Government to reduce greenhouse gas emissions in their sectors and to enable a whole-of-Government approach towards achieving the national transition objective. Ireland’s first National Mitigation Plan is currently being prepared by the Government and will be published later in 2017. Projected Greenhouse Gas Emissions to 2035
Based on current emission projections, it is estimated that by 203016 total non-ETS emissions will be 1%-3% below 2005 levels. The estimates of greenhouse gas emissions to 2035 assume a continuation of the effect of policies and measures that are in place in 2020. It is recognised that this is a conservative outlook; however, these figures are published to illustrate how emissions might look into the longer-term in the absence of any additional policies and measures. The trend in emission levels under both the With Existing Measures and the With Additional Measures scenarios are presented for the non-ETS sectors in Figure 5 and also includes the required target pathway to Irelands 2020 target as a reference.
Figure 5. With Existing Measures and With Additional Measures greenhouse gas emissions projections for the non-ETS sectors to 2035
Figure 6 presents the percentage share of Non ETS emissions by sector in 2030 under the With Additional Measures scenario.
16
2030 is referenced here as there will be a new EU Effort Sharing Decision which will include targets out to 2030 (targets have not yet been finalised)
0
10
20
30
40
50
60
2013 2014 2015 2016 2017 2018 2019 2020 2021 2022 2023 2024 2025 2026 2027 2028 2029 2030 2031 2032 2033 2034 2035
Mt
CO
2eq
WM Non-ETS Emissions WAM Non-ETS Emissions 2013-2020 Annual Limits

EPA 2017 GHG Emission Projections Report April 2017
Page 11 of 15
Figure 6. Projected sectoral share of non-ETS greenhouse gas emissions in 2030 for the With Additional Measures scenario
6. Summary of Sectoral emissions beyond 2020
Over the period 2020 to 2035, emissions from the Energy Industries sector (mainly power generation (ETS sector emissions)) are projected to increase by 42% to 14.5 Mt CO2 eq under the With Existing Measures Scenario. Under the With Additional Measures scenario the replacement of coal fired electricity generation with natural gas in 2025 is included. Under this scenario, emissions from the energy industries sector are projected to increase by 34% between 2020 and 2035 which is mainly a result of the increase in energy used in electricity generation over this period.
Under the With Existing Measures scenario final Residential energy demand in 2035 is projected to be 22.3% above that in 2020, with an associated increase in emissions over the period by 5%. Under the With Additional Measures scenario, in 2035, residential sector emissions are projected to be at slightly higher than projected emission levels in 2020.
In 2035 emissions from Manufacturing Combustion are projected to be 16.8% higher than in 2020 under both scenarios. Final energy demand increases by approximately 22% over the same period.
Under the With Existing Measures scenario, it is projected that emissions from the Commercial and Public services sector will increase by 24% between 2020 and 2035 with energy demand increasing by 42% over the same period. Between 2020 and 2035 emissions are projected to increase by 19.6% under the With Additional Measures scenario.
Under With Existing Measures Transport emissions are projected to increase by 11.3% between 2020 and 2035, the main driver being a projected increase of 11% in diesel. With respect to With Additional Measures scenario emissions are projected to increase by 11.3% between 2020 and 2035. The RES-T share of 8% for 2020 is largely maintained out to 2035.
Emissions from Industrial Processes are projected to grow by 44.5% between 2020 and 2035 to 3.3 Mt CO2 eq under both scenarios.
Energy 1%
Agriculture 43%
Transport 32%
Industry and Commercial
9%
Residential 13%
Other combustion
1%
Waste 1%
EPA 2017 GHG Emission Projections Report April 2017
Page 12 of 15
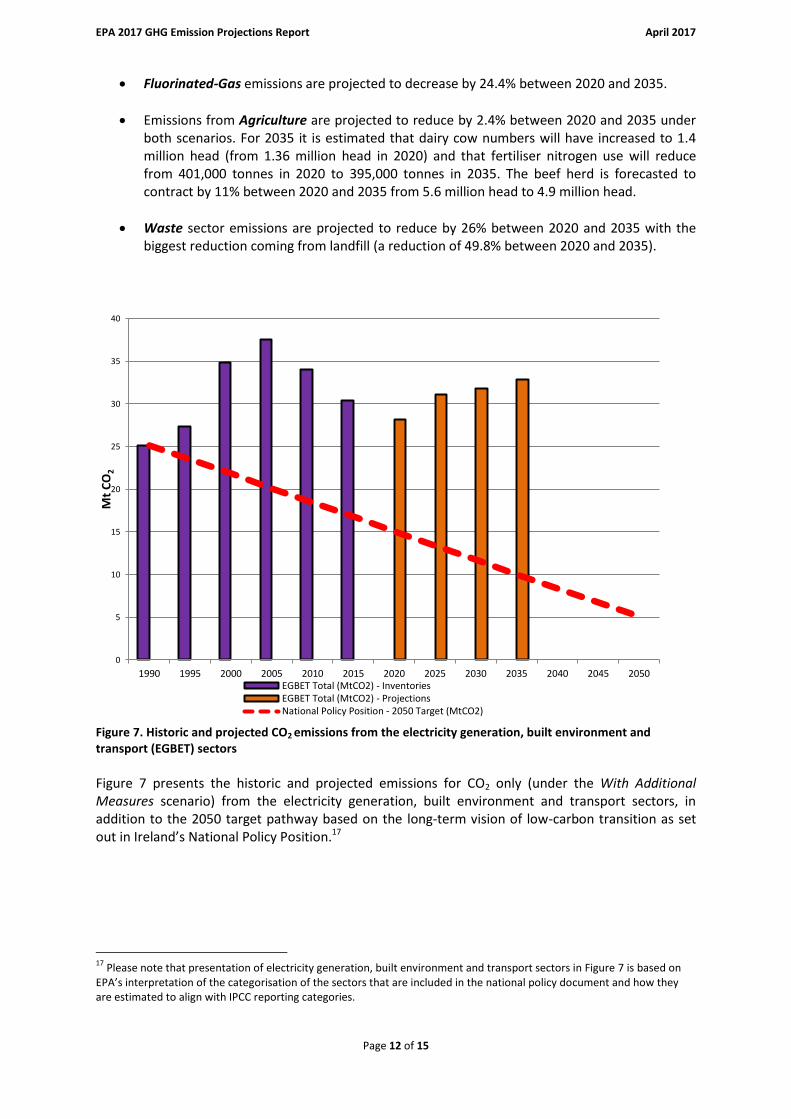
Fluorinated-Gas emissions are projected to decrease by 24.4% between 2020 and 2035.
Emissions from Agriculture are projected to reduce by 2.4% between 2020 and 2035 under both scenarios. For 2035 it is estimated that dairy cow numbers will have increased to 1.4 million head (from 1.36 million head in 2020) and that fertiliser nitrogen use will reduce from 401,000 tonnes in 2020 to 395,000 tonnes in 2035. The beef herd is forecasted to contract by 11% between 2020 and 2035 from 5.6 million head to 4.9 million head.
Waste sector emissions are projected to reduce by 26% between 2020 and 2035 with the biggest reduction coming from landfill (a reduction of 49.8% between 2020 and 2035).
Figure 7. Historic and projected CO2 emissions from the electricity generation, built environment and transport (EGBET) sectors
Figure 7 presents the historic and projected emissions for CO2 only (under the With Additional Measures scenario) from the electricity generation, built environment and transport sectors, in addition to the 2050 target pathway based on the long-term vision of low-carbon transition as set out in Ireland’s National Policy Position.17
17
Please note that presentation of electricity generation, built environment and transport sectors in Figure 7 is based on EPA’s interpretation of the categorisation of the sectors that are included in the national policy document and how they are estimated to align with IPCC reporting categories.
0
5
10
15
20
25
30
35
40
1990 1995 2000 2005 2010 2015 2020 2025 2030 2035 2040 2045 2050
Mt
CO
2
EGBET Total (MtCO2) - InventoriesEGBET Total (MtCO2) - ProjectionsNational Policy Position - 2050 Target (MtCO2)

EPA 2017 GHG Emission Projections Report April 2017
Page 13 of 15
Appendix I Underlying Assumptions The following are key underlying data underpinning this year’s greenhouse gas emission projections:
Energy-related emissions projections are based on energy forecasts provided to the EPA by Sustainable Energy Authority of Ireland (SEAI) in March 2017
The energy forecasts are based on a set of macroeconomic assumptions from the Economic and Social Research Institute
Agriculture emissions projections are based on data from Teagasc’s FAPRI-Ireland model which were provided to the EPA in December 2015. The FAPRI-Ireland model is a dynamic, partial equilibrium model which is linked both to the FAPRI-EU and world modelling systems.
A key assumption underpinning the agriculture emissions projections is that the Food Wise 2025 targets will be met.
Table 1.1 outlines the key macroeconomic assumptions that underpin the current projections. Table 1.1 Key macroeconomic assumptions underlying the projections
2016 – 2020 2021-2025 2026-2030 2031-2035
Average Annual % Growth Rate
GDP +3.74% +3.24% +2.59% +2.59%
GNP +3.42% +3.32% +1.97% +1.97%
Personal Consumption +2.97% +2.57% +1.11% +1.11%
2016 2020 2025 2030
Housing Stock (‘000) 1,967 2,018 2,112 2,206
Population (‘000) 4,674 4,834 5,027 5,209
EUETS: Carbon €2013/tCO2 9 15 22.5 33.5
Carbon tax €2013/tCO2 18.3 15 22.5 33.5
Coal $2013/boe 9.8 9.9 11.6 10.6
Oil $2013/boe 40.5 56.8 62.8 69.4
Gas $2013/boe 27.0 20.4 24.6 27.3
Peat €/MWh 25 25 25 25

EPA 2017 GHG Emission Projections Report April 2017
Page 14 of 15
Appendix II Description of emissions scenarios Two emissions projections scenarios are presented which show two potential outlooks to 2035 depending on policy development and implementation. These are called
With Existing Measures
With Additional Measures
The With Existing Measures scenario is based primarily on SEAI’s Baseline energy forecast which incorporates the anticipated impact of policies and measures that were in place (and legislatively provided for) by end of 2015.
The With Additional Measures scenario is based on SEAI’s NEEAP/NREAP energy forecast (which includes existing and planned policies and measures) however this year’s energy forecast has been risk adjusted to reflect current progress and the trajectory towards achieving 2020 targets. This includes an expected shortfall in achieving full renewable energy targets. In this regard, by 2020, the With Additional Measures scenario assumes Ireland will have achieved:
37.3% renewable electricity (RES-E) share (full target is 40%)
9% renewable heat (RES-H) share (full target is 12%)
8% renewable transport (RES-T) share (full target is 10%) In terms of the overall 16% Renewable Energy Share (RES) target in 2020, it is expected that 13.2% will be achieved by 2020 based on current progress. In terms of energy efficiency, approximately 81% of the total NEEAP 2020 energy efficiency savings are expected to be achieved in 2020 based on current progress. The difference between the With Existing Measures and With Additional Measures scenario shows the impact of additional policies and measures and renewables penetration which are assumed to further progress the implementation of targets set out in the NEEAP and NREAP based on current progress. Table 2.1. shows the sectors where the additional measures are assumed to be implemented (under the With Additional Measures scenario) and the associated savings or CO2eq reduction associated with the implementation of those measures (e.g. increased rate of thermal energy from renewable sources across the residential, commercial services) Table 2.1. CO2eq savings from additional policies and measures by sector
CO2eq, Gg 2020 2030
Energy – (mainly in EU-ETS) 1,531 2,357
Industry 157 169
Services 338 415
Residential 73 271
Transport 206 231
Agriculture 156 156
Total 2,461 3,599

EPA 2017 GHG Emission Projections Report April 2017
Page 15 of 15
Appendix III
Units: 1 Mt = 1,000 kilotonnes (kt) = 1000 gigagram (Gg) CO2 Equivalent: greenhouse gases other than CO2 (i.e. methane, nitrous oxide and so-called F-gases) may be converted to CO2 equivalent using their global warming potentials. F-gases: These gases comprise HFCs (Hydrofluorocarbons), PFCs (Perfluorocarbons), SF6 (Sulphur Hexafluoride) and NF3 (Nitrogen Trifluoride). They are much more potent than the naturally occurring greenhouse gas emissions (carbon dioxide, methane and nitrous oxide).
Ireland’s Greenhouse Gas Sectors: include the following sectors for analysis:
1. Energy Industries (electricity generation, waste to energy incineration, oil refining, briquetting manufacture and fugitive emissions)
2. Residential (combustion for domestic space and hot water heating) 3. Manufacturing Combustion (combustion for Manufacturing industries in ETS and non-ETS) 4. Commercial and Public Services (combustion for Commercial and Public Services space and hot
water heating) 5. Transport (combustion of fuel used in road, rail, navigation, domestic aviation and pipeline gas
transport) 6. Industrial Processes (process emissions from mineral, chemical, metal industries, non-energy
products and solvents) 7. F-Gases (gases used in refrigeration, air conditioning and semiconductor manufacture) 8. Agriculture (emissions from fertiliser application, ruminant digestion, manure management,
agricultural soils and fuel used in agriculture/forestry/fishing) 9. Waste (emissions from solid waste disposal on land, solid waste treatment (composting),
wastewater treatment, waste incineration and open burning of waste).
Table 3.2. Historical and projected emissions for the non-ETS and ETS sectors (Mt CO2eq) for With Existing Measures and With Additional Measures scenarios
Non-ETS sector ETS sector Total
H
isto
rica
l
2005 47.45 22.44 69.98
2006 47.50 21.71 69.31
2007 47.19 21.25 68.54
2008 47.44 20.38 67.88
2009 2010 2011 2012 2015
44.97 44.29 41.76 41.23 43.04
17.22 17.36 15.78 16.89 16.83
62.24 61.69 57.56 58.12 59.87
With Existing Measures Scenario
P
roje
cte
d
2016 44.42 16.48 60.91 2020 45.64 15.91 61.56 2025 47.74 17.65 65.39 2030 2035
47.14 47.31
19.35 21.90
66.49 69.21
With Additional Measures Scenario
2016 2020 2025 2030 2035
44.31 44.83
46.78 46.04 46.04
16.40 14.26 15.48 16.84 18.79
60.72 59.09 62.27 62.89 64.84
Note: Numbers may not sum exactly due to rounding