Reduced Greenhouse Gas Emission - FCRN
97
Transcript of Reduced Greenhouse Gas Emission - FCRN
Reduced Greenhouse Gas Emission
and Improved Governance in China’s
National Biogas-Household Program
- A Case Study of Datong Municipality, Shanxi Province -
Jia, Xiaodong
Berlin
12th of February 2009
Submitted in partial fulfilment of the requirements for the ‚Degree of
Master of Science’ at the University of Technology, Berlin

Statement of authenticity of material
This thesis contains no material which has been accepted for the
award of any other degree or diploma in any institution and to the
best of my knowledge and belief, the research contains no material
previously published or written by another person, except where
due reference has been made in the text of the thesis.
Signed
Jia,Xiaodong
Berlin, February 12th 2009
1
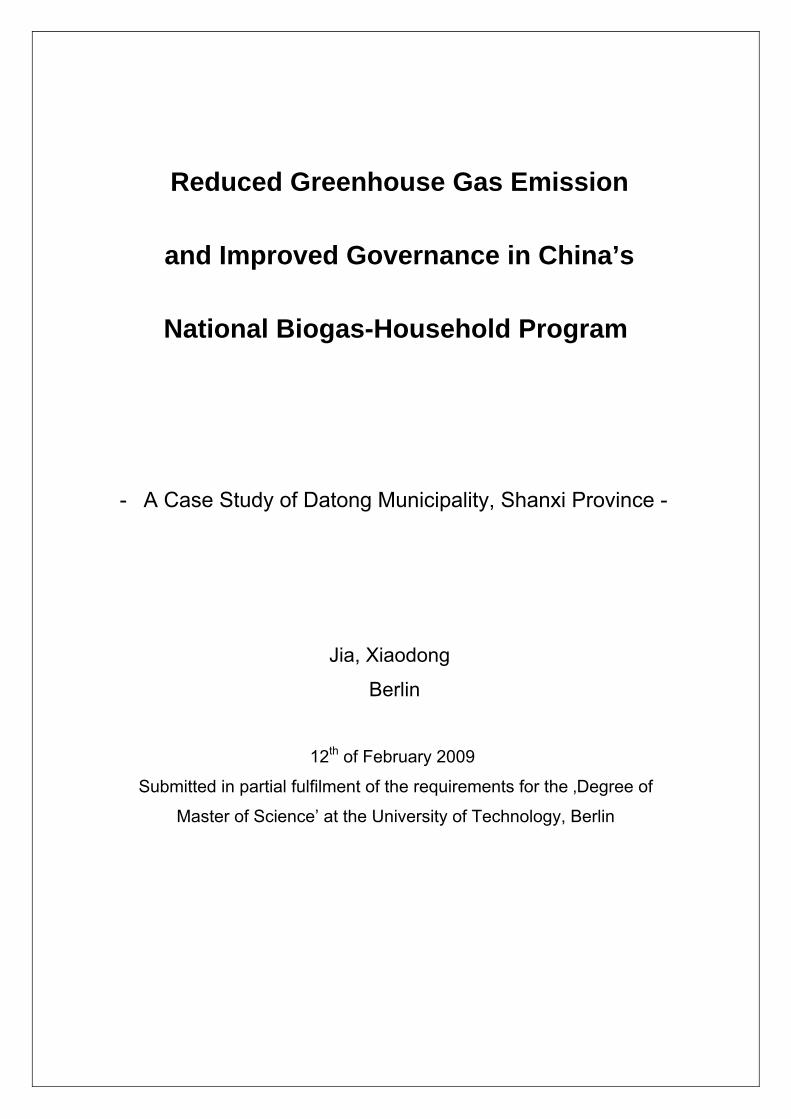
Contents
Preface ....................................................................................................................... 1
Abbreviations ............................................................................................................ 2
Glossary ..................................................................................................................... 3
Abstract...................................................................................................................... 4
1 Introduction ................................................................................................... 6
1.1 The Greenhouse Effect and Global Climate Change ................................. 6
1.2 Greenhouse Gases Emission ....................................................................... 8
1.3 Current Situation of the GHG Emissions in China ..................................... 9
1.4 Biogas Production: State of the Art .......................................................... 10
1.4.1 Biogas Production: Basics ......................................................................... 10
1.4.2 The Structure of a Biogas Digester ........................................................... 11
1.4.3 Status of the Biogas Use World Wide ....................................................... 12
2 Biogas-Household Program in Datong ..................................................... 14
2.1 National Setting ........................................................................................... 14
2.1.1 History of Biogas Use in China .................................................................. 14
2.1.2 The National Biogas-household Program ................................................. 15
2.1.3 The Economic, Ecologic and Social Values of BHP .................................. 16
2.2 Profile of Datong Municipality .................................................................... 19
2.3 Biogas-Household Program in Datong ..................................................... 21
2.3.1 Forms of the Applications .......................................................................... 22
2.3.2 Financing ................................................................................................... 24
2
2.3.3 Technical Support Measures ..................................................................... 25
2.3.4 Monitoring and Evaluation ......................................................................... 25
2.4 The Survey Sample: Datong Xian .............................................................. 25
3 State of Research ........................................................................................ 29
4 Methodology ................................................................................................ 31
4.1 Carbon Flow Map of BHP ........................................................................... 31
4.2 Estimation of GHG Emission Reduction ................................................... 33
4.3 Evaluation of Governance .......................................................................... 35
4.4 Data Collection ............................................................................................ 35
4.5 Survey Design ............................................................................................. 36
5 Results and Analysis .................................................................................. 38
5.1 GHG Emission Reduction ........................................................................... 38
5.1.1 Emission Reduction by Large Biogas Plants ............................................. 38
5.1.2 Emission Reduction by Efficiency-improved Biomass Stoves ................... 39
5.1.3 Emission Reduction by Individual Biogas Use .......................................... 39
5.1.4 The Total Emission Reduction in 2007 ...................................................... 41
5.2 Energy Flow of BHP in Datong in 2007 ..................................................... 41
5.2.1 Energy Input .............................................................................................. 41
5.2.2 Energy Output ........................................................................................... 43
5.2.3 Energy Flow Map ...................................................................................... 44
5.3 The Attitudes towards Governance ........................................................... 45
5.3.1 The Meaning of Governance in China ....................................................... 46
5.3.2 Awareness & Information Sector ............................................................... 47
5.3.3 Financial & Economic Sector .................................................................... 48
5.3.4 Technological Sector ................................................................................. 50
3
5.3.5 Institutional & Political Sector .................................................................... 51
5.4 Cost-efficiency Analysis of Governance ................................................... 52
5.4.1 Group Analysis .......................................................................................... 53
5.4.2 Correlation Analysis .................................................................................. 54
6 Conclusion and Outlook ............................................................................. 56
References ............................................................................................................... 61
Annex 1: Multiples .................................................................................................. 67
Annex 2: Calculation Sheet .................................................................................... 68
Annex 3: Questionnaire .......................................................................................... 83
Annex 4: Information of Interviewees ................................................................... 85
Annex 5: Schedule of the thesis ............................................................................ 88
List of Charts ........................................................................................................... 89
List of Tables ........................................................................................................... 90
List of Pictures ........................................................................................................ 91

1
Preface
In the last five months, my world consisted of my internship and the work on this
thesis. It was a busy and fruitful, boring and colourful season. I appreciated to spend
my life in this way, which guides me further in future.
Although there is a really long list with names of the people who had helped me, I still
try my best to indicate it, because I can’t finish the thesis in absence of their help. I
would like to thank my supervisor Prof. Dr. Johannes Kuechler. His powerful
supervision and careful correction are the guarantee of a high-quality thesis. Mrs. Dr.
Vera Susanne Rotter gave me lots of positive suggestions in the field of energy and
emissions. Mrs. Dr. Bettina Hamann, our program coordinator, dedicates herself to
the program. Thanks for all she did for me and for the master program.
Furthermore, I would like to thank the GreenStream Network for the internship and
my job in future. Ms. Laura Lahti, Mr. Christian Saul and Mr. Norbert Heidelmann
impressed me deeply by their professional performance in the field of Clean
Development Mechanism (CDM) and renewable energy. Their help strongly
supported my internship and the thesis, and my whole career.
Last but not least, I am deeply obliged to my parents, whoes strong support made
the local interviews possible. Mrs. Wang, Xiuqin and Mr. Huo, Rushan, working in the
local government of Datong, provided plentiful information about the Biogas-
household program. Ms. Tian Ruimiao and Mr. Li Jun were excellent information
transporters between me and my information sources. My warmest thanks to all of
them.
“Education is a progressive discovery of our ignorance.”
- Will Duran (1885-1981), American historian-
I am just on the way!
Jia, Xiaodong
2
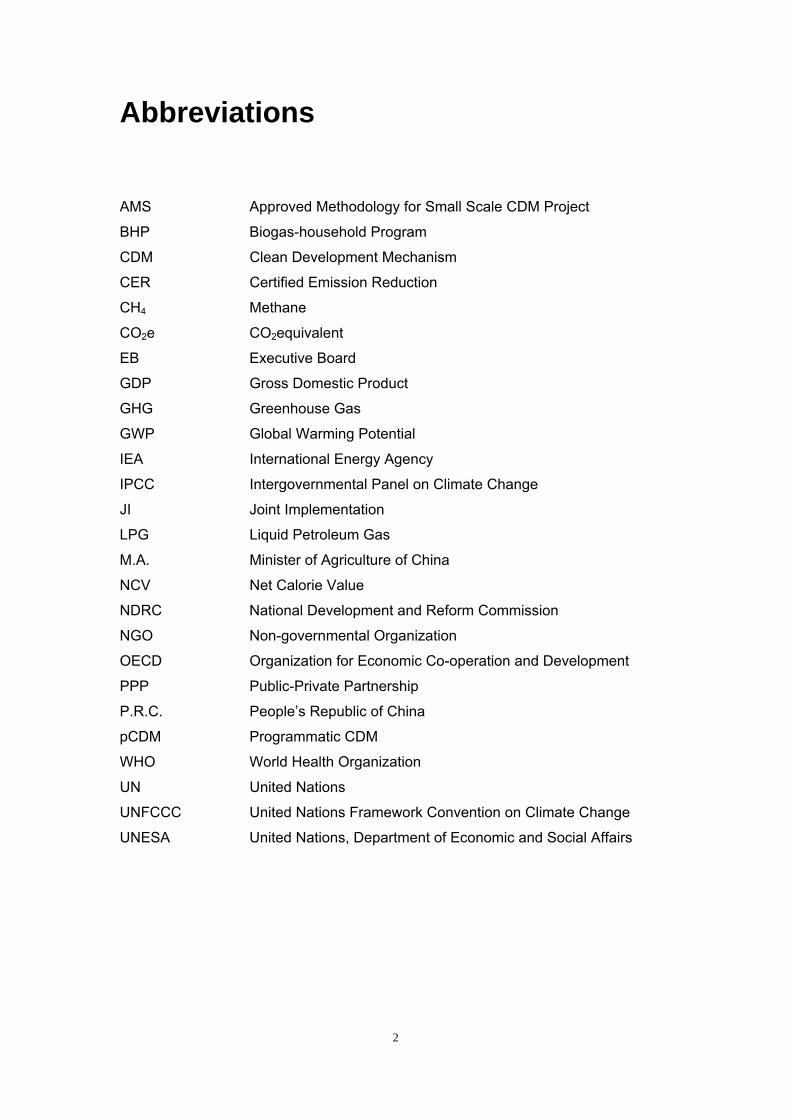
Abbreviations
AMS Approved Methodology for Small Scale CDM Project
BHP Biogas-household Program
CDM Clean Development Mechanism
CER Certified Emission Reduction
CH4 Methane
CO2e CO2equivalent
EB Executive Board
GDP Gross Domestic Product
GHG Greenhouse Gas
GWP Global Warming Potential
IEA International Energy Agency
IPCC Intergovernmental Panel on Climate Change
JI Joint Implementation
LPG Liquid Petroleum Gas
M.A. Minister of Agriculture of China
NCV Net Calorie Value
NDRC National Development and Reform Commission
NGO Non-governmental Organization
OECD Organization for Economic Co-operation and Development
PPP Public-Private Partnership
P.R.C. People’s Republic of China
pCDM Programmatic CDM
WHO World Health Organization
UN United Nations
UNFCCC United Nations Framework Convention on Climate Change
UNESA United Nations, Department of Economic and Social Affairs

3
Glossary
Baseline Emission 基准排放量
Biogas-household Program 新农村沼气工程
Biomass Stove 生物质炉
CDM 清洁发展机制
Climate Change 气候变化
Cun 村
Datong Municipality 大同市
Datong Xian 大同县
GHG Emission Reduction 温室气体减排量
Governance 政府管理
Greenhouse Effect 温室效应
Greenhouse Gas 温室气体
Individual Biogas Digester 户用沼气池
Kyoto Protocol 京都议定书
Large-scale Biogas Plant 大型沼气项目
National Development and Reform Commission 国家发展与改革委员会
National action plan against Climate Change of China 中国应对气候变化国家方案
New Rural in China 新农村建设
Policies and Actions for Addressing Climate Change 中国应对气候变化的政策与行动
Project Emission 项目排放量
Shanxi Province 山西省
Service Station 技术服务站
Xian 县
Xiang 乡

4
Abstract
Since 2001, the Ministry of Agriculture of China is implementing the national Biogas-
household Program (BHP), with the aim to save energy, protect the environment and
improve the life quality of farmers. In the first period (2001-2005), the Central
Government invested approximately EUR 353,27 mil1, benefiting 3,57 mil households
and 120 biogas plants on large or medium livestock farms. In the second phase
(2006-2010), the program is implemented on a wider scale and with national budget
of EUR 13,17 billion. The target for 2010 is that there will be 4.700 large-scale biogas
installations, attached to almost 40% of China’s large livestock farms. Additional to
that, there will be 41,18 mil individual bio-digesters, operated by 17,5% of the rural
families in China.
The program is expected to have a great positive influence on the reduction of
greenhouse gas (GHG) emissions. At the same time, it creates huge ecological and
economic benefits which have already been studied in detail. However the GHG
emission reduction effect of the program has not yet been estimated and evaluated
systematically. This thesis aims determine this positive effect, taking Datong
Municipality as a case study.
In accordance with methodologies approved by United Nations Framework
Convention on Climate Change (UNFCCC) for different GHG emissions sources and
data collected by the author, GHG emission reduction by the BHP in Datong
Municipality was determined to be approximately 270,000 tCO2 equivalent in 2007.
The emission reduction consists of three categories: large scale biogas projects,
improved-efficiency biomass stoves and individual biogas digesters. The amount of
the GHG reduction in 2010 is expected to be 1,041 mil tCO2e. It equals the GHG
emission of 2 fossil fuel power stations working one year with each capacity of 60
MW. It also equals the GHG emission by the combustion of 0,525 mil tones of brown
coal briquettes. It is also equivalent to the annual carbon-sink capacity of 236 km2 of
eucalyptus plantation.
Notable is that the decentralized GHG emission control measures could make a
great positive influence on the environment in rural area.
1 Exchange Rate: 10 Renminbi = 1 EURO in 2007
5
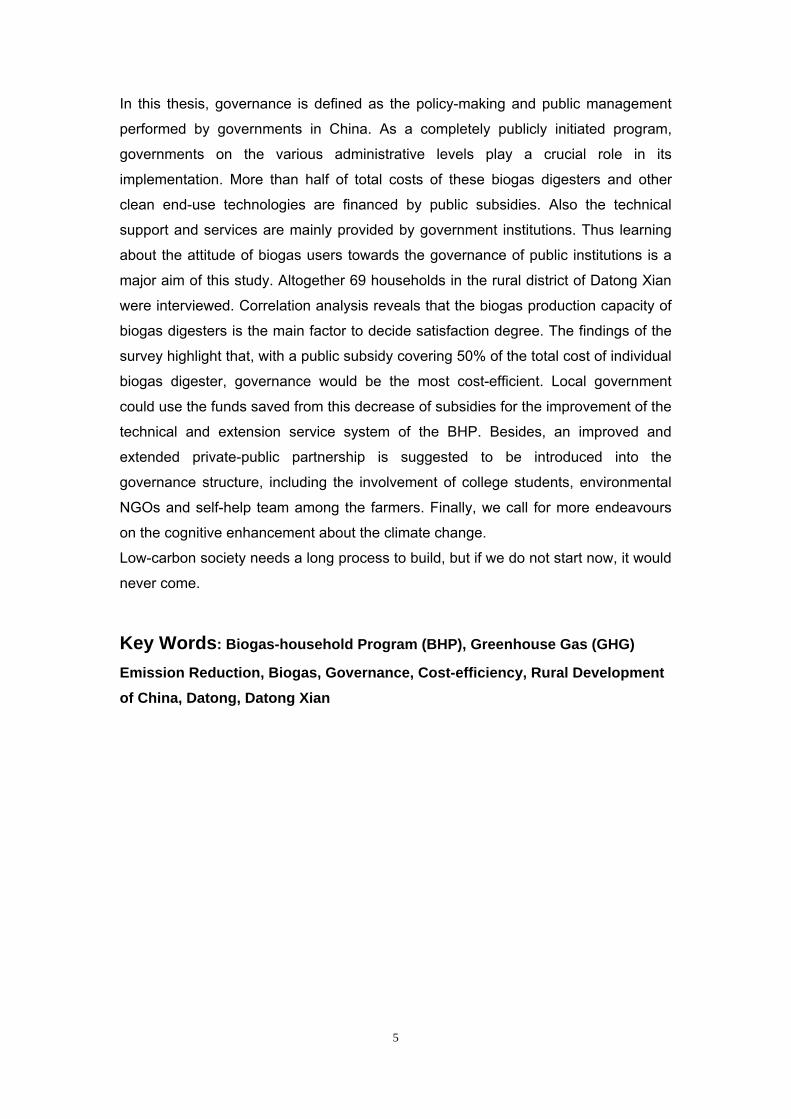
In this thesis, governance is defined as the policy-making and public management
performed by governments in China. As a completely publicly initiated program,
governments on the various administrative levels play a crucial role in its
implementation. More than half of total costs of these biogas digesters and other
clean end-use technologies are financed by public subsidies. Also the technical
support and services are mainly provided by government institutions. Thus learning
about the attitude of biogas users towards the governance of public institutions is a
major aim of this study. Altogether 69 households in the rural district of Datong Xian
were interviewed. Correlation analysis reveals that the biogas production capacity of
biogas digesters is the main factor to decide satisfaction degree. The findings of the
survey highlight that, with a public subsidy covering 50% of the total cost of individual
biogas digester, governance would be the most cost-efficient. Local government
could use the funds saved from this decrease of subsidies for the improvement of the
technical and extension service system of the BHP. Besides, an improved and
extended private-public partnership is suggested to be introduced into the
governance structure, including the involvement of college students, environmental
NGOs and self-help team among the farmers. Finally, we call for more endeavours
on the cognitive enhancement about the climate change.
Low-carbon society needs a long process to build, but if we do not start now, it would
never come.
Key Words: Biogas-household Program (BHP), Greenhouse Gas (GHG)
Emission Reduction, Biogas, Governance, Cost-efficiency, Rural Development of China, Datong, Datong Xian
6
1 Introduction
This chapter will provide some background information about the global climate
change, GHG emissions as well as the biogas produce.
1.1 The Greenhouse Effect and Global Climate Change
As the Intergovernmental Panel on Climate Change (IPCC) published the report
“Climate Change 2007” (IPCC 2007) the “greenhouse effect” and the “global climate
change” became two of the most popular key words in the world. What is the
greenhouse effect and what is meant by climate change? How do they happen?
The greenhouse effect was discovered by Joseph Fourier in 1824 and first
investigated quantitatively by Svante Arrhenius in 1896 (Held and Soden, 2000,
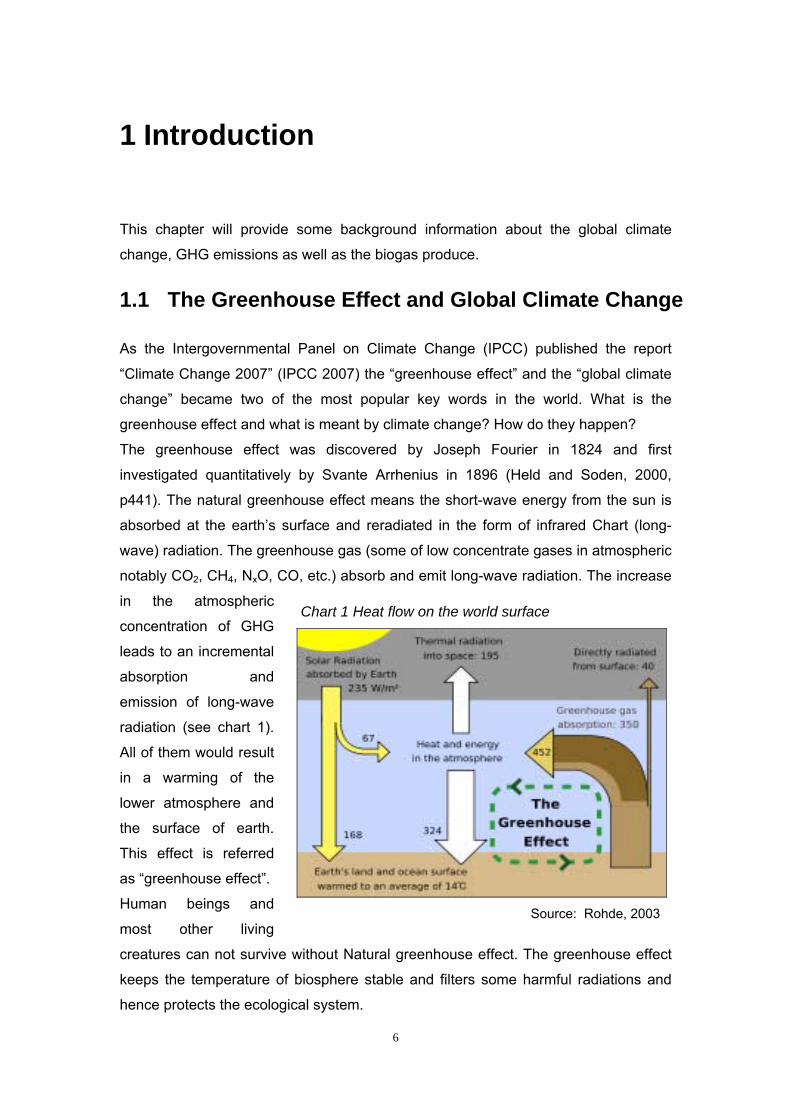
p441). The natural greenhouse effect means the short-wave energy from the sun is
absorbed at the earth’s surface and reradiated in the form of infrared Chart (long-
wave) radiation. The greenhouse gas (some of low concentrate gases in atmospheric
notably CO2, CH4, NxO, CO, etc.) absorb and emit long-wave radiation. The increase
in the atmospheric
concentration of GHG
leads to an incremental
absorption and
emission of long-wave
radiation (see chart 1).
All of them would result
in a warming of the
lower atmosphere and
the surface of earth.
This effect is referred
as “greenhouse effect”.
Human beings and
most other living
creatures can not survive without Natural greenhouse effect. The greenhouse effect
keeps the temperature of biosphere stable and filters some harmful radiations and
hence protects the ecological system.
Chart 1 Heat flow on the world surface
Source: Rohde, 2003
7
Due to anthropological influence the greenhouse effect has been enhanced leading
to exacerbated climate change. Some of the effects of climate change are clear,
others still uncertain. The climate change includes temperature change in global
scale, sea level rise, precipitation change and the increase of extreme weather
events (IPCC, 2008, p30).
Eleven of the twelve years (1995-2006) rank among the twelve warmest years in the
instrumental record keeping of the global surface temperature (since 1850). The 100-
year (1906-2005) linear trend of 0.74 °C (varying from 0.56 to 0.92°C) is larger than
the corresponding trend of 0.6 °C (from 0.4 to 0.8]°C (1901-2000). The linear
warming trend for the 50 years (1956-2005) of 0.13 [0.10 to 0.16]°C per decade is
nearly twice that for the 100 years from 1906 to 2005. The temperature increase
presented here is an average for the globe and it is greater at higher northern
latitudes. Average Arctic temperatures have increased at almost twice the global
average rate in the past 100 years. Land regions have warmed faster than the
oceans. (IPCC 2008, p30).
Global average sea level rose at an average rate of 1.8 mm (from 1.3 to 2.3 mm) per
year over the period from1961 to 2003 and at an average rate of about 3.1 mm per
year (from 2.4 to 3.8 mm per year) from 1993 to 2003. Since 1993 thermal expansion
of the oceans has contributed about 57% of the sum of the estimated individual
contributions to the sea level rise, with decreases in glaciers and ice caps
contributing about 28% and losses from the polar ice sheets contributing the
remainder. (IPCC, 2008, p30).
Over the last century, also the precipitation trend has changed significantly in North
America and Russia (Groisman and Easterling, 1994, p109-113), the Asia and Africa
(Petit-Maire, 1994, p3-15) as well as Central Europe (Lapin, 1994, p162-170). These
areas are being attacked by drought, flooding, water crisis that are caused by the
change of precipitation in the global scale. Some extreme weather events have
changed in frequency and/or intensity over the last 50 years. Since 1970, the tropical
cyclones have increased obviously in intensity. Furthermore heat waves have
affected human beings around the world. El-Nino effect and Tidal Wave have
became also more common and in larger scale (IPCC 2008, p30).
China is suffering as heavily as other countries from the global climate change. From
1908 to 2007, the average surface temperature has increased 1.1 °C. The year 2007
was the warmest year in the instrumental record keeping in China (since 1951). In
the last 30 years, the sea level of China’s offing rose 90 mm. Furthermore the
precipitation has changed significantly in China. Flooding takes place more
8
frequently in south of China, but the middle part of China is always suffered by the
heat wave and drought. (NDRC, 2008, p2).
1.2 Greenhouse Gases Emission
The driver of greenhouse effect and global climate change mainly is the GHG
emission. Groups of scientists (IPCC as the leader) are working on the calculation of
GHG emission to show us how the GHG discharge is getting stronger and stronger,
and what the change is year by year. The sources of GHG are both natural and
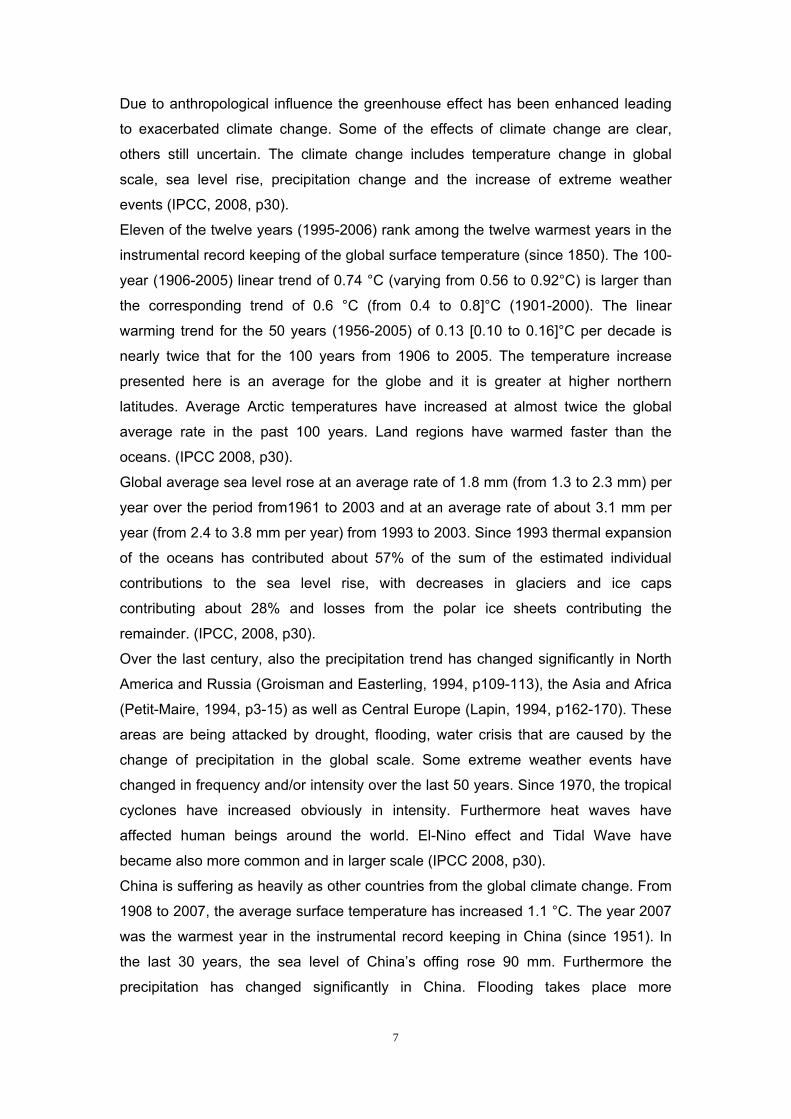
human related. Since the industrialization, human activities emitted more and more
GHG with an increase of 70% between 1970 and 2004 (IPCC, 2008, p36) and an
increase of 25% between 1990 and 2004 (Netherlands Environmental Assessment
Agency, 2006), all of which destroy the pervious carbon balance heavily (see Chart
2).
The amounts of emission between different kinds of GHG and their sources are
obviously different. Carbon dioxide (CO2) is responsible for about 60% of the
greenhouse effect to the increased atmospheric concentrations of GHG, when
considered over 100 years of emission. (International Energy Agency, 1991, p15).
The annual emission has grown between 1970 and 2004 by about 80% from 21 to 38
GT, and represented 77% of total anthropogenic GHG emissions in 2004 (IPCC,
2008, p36).
Methane (CH4)’s concentration in the atmosphere has been growing at 1% per year
during recent years. Methane could absorb infrared radiation much more strongly
(20-30 times) than CO2. The global atmospheric concentration of CH4 has increased
from a pre-industrial value of about 715ppb to 1732ppb in the early 1990s, and was
1774ppb in 2005. (IEA, 1991, p17).
The other pollutants, NOx and CO, do not directly influent greenhouse effect, but act
indirectly by affecting the concentrations of other greenhouse gases in the
atmosphere (International Energy Agency, 1991, p18-20).
9
1.3 Current Situation of the GHG Emissions in China
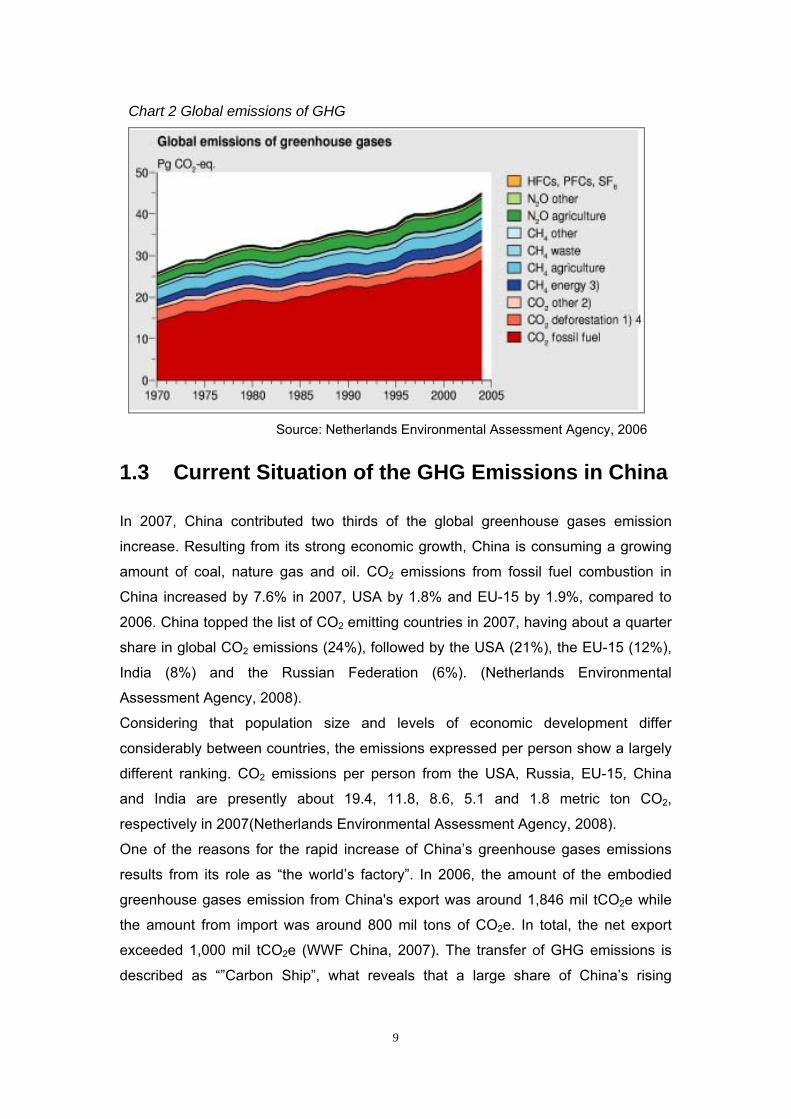
In 2007, China contributed two thirds of the global greenhouse gases emission
increase. Resulting from its strong economic growth, China is consuming a growing
amount of coal, nature gas and oil. CO2 emissions from fossil fuel combustion in
China increased by 7.6% in 2007, USA by 1.8% and EU-15 by 1.9%, compared to
2006. China topped the list of CO2 emitting countries in 2007, having about a quarter
share in global CO2 emissions (24%), followed by the USA (21%), the EU-15 (12%),
India (8%) and the Russian Federation (6%). (Netherlands Environmental
Assessment Agency, 2008).
Considering that population size and levels of economic development differ
considerably between countries, the emissions expressed per person show a largely
different ranking. CO2 emissions per person from the USA, Russia, EU-15, China
and India are presently about 19.4, 11.8, 8.6, 5.1 and 1.8 metric ton CO2,
respectively in 2007(Netherlands Environmental Assessment Agency, 2008).
One of the reasons for the rapid increase of China’s greenhouse gases emissions
results from its role as “the world’s factory”. In 2006, the amount of the embodied
greenhouse gases emission from China's export was around 1,846 mil tCO2e while
the amount from import was around 800 mil tons of CO2e. In total, the net export
exceeded 1,000 mil tCO2e (WWF China, 2007). The transfer of GHG emissions is
described as “”Carbon Ship”, what reveals that a large share of China’s rising
Chart 2 Global emissions of GHG
Source: Netherlands Environmental Assessment Agency, 2006
10
emissions is due to the dependence of the rest of the world on exports from China
(New Economic Foundation, 2007, p10).
Although the per capita GHG emissions are still rather low and a big part of it is used
to exports, China does have a huge pressure and responsibility to control her GHG
emissions.
In May.30, 2007, “National action plan against climate change(中国应对气候变化国家
方案)” was issued by Central government of China. The plan was submitted by
National Development and Reform Commission (NDRC), who is China’s highest
climate policy-making body. In this plan (NDRC, 2007, p27-29)2, overall targets for
2010 are given:
- “Reduction of the GHG emission (via decrease of the energy consumption per
GNP by 20% below the level of 2005, increase of the fraction of renewable
energy in the total energy consumption to 10%; reuse of 1 mil m³ coalmine
methane, and control of N2O emissions at the level of 2005, etc.)
- Improvement of the ability to response Climate change
- Enhancement of the research and technology referring Climate change
- Enhancement of public awareness and governance about Climate change and
environmental protection”
A notable point is that there is not mandatory request to reduce GHG emission.
The latest national guiding document is the white paper of China’s Policies and
Actions for Addressing Climate Change(中国应对气候变化的政策与行动), issued by
central government in Oct. 29 2008 (NDRC, 2008, p27-29).
1.4 Biogas Production: State of the Art
1.4.1 Biogas Production: Basics
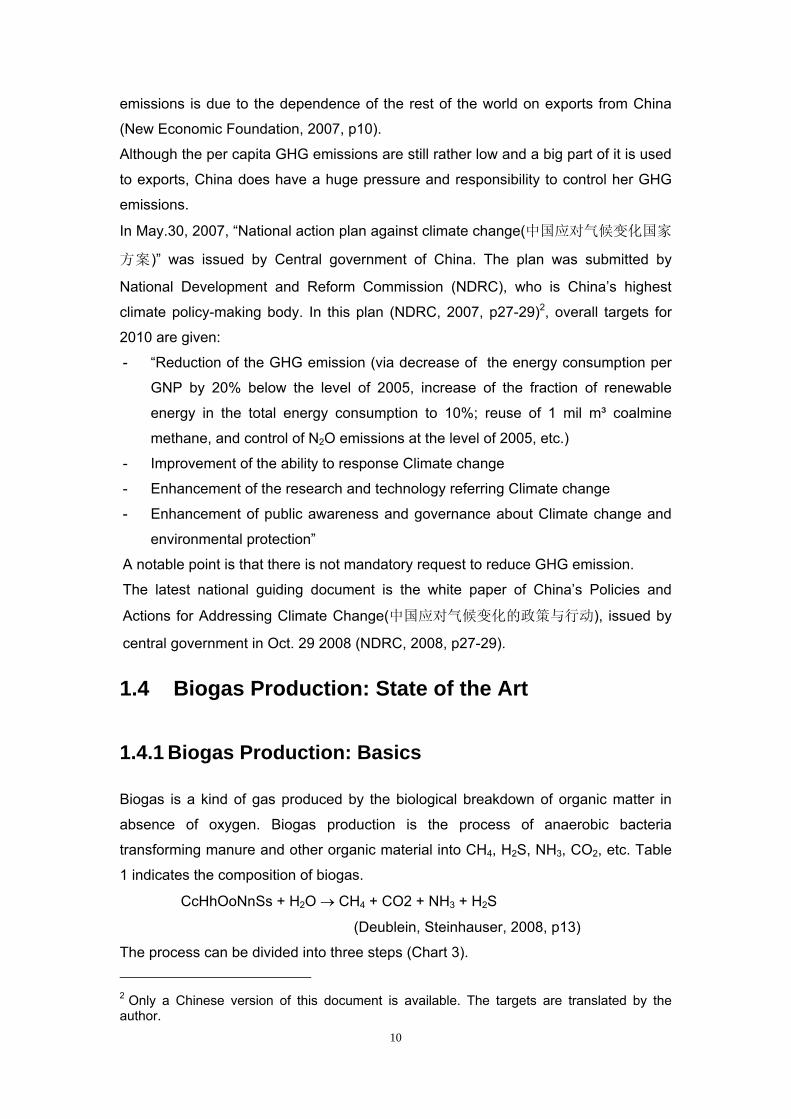
Biogas is a kind of gas produced by the biological breakdown of organic matter in
absence of oxygen. Biogas production is the process of anaerobic bacteria
transforming manure and other organic material into CH4, H2S, NH3, CO2, etc. Table
1 indicates the composition of biogas.
CcHhOoNnSs + H2O → CH4 + CO2 + NH3 + H2S
(Deublein, Steinhauser, 2008, p13)
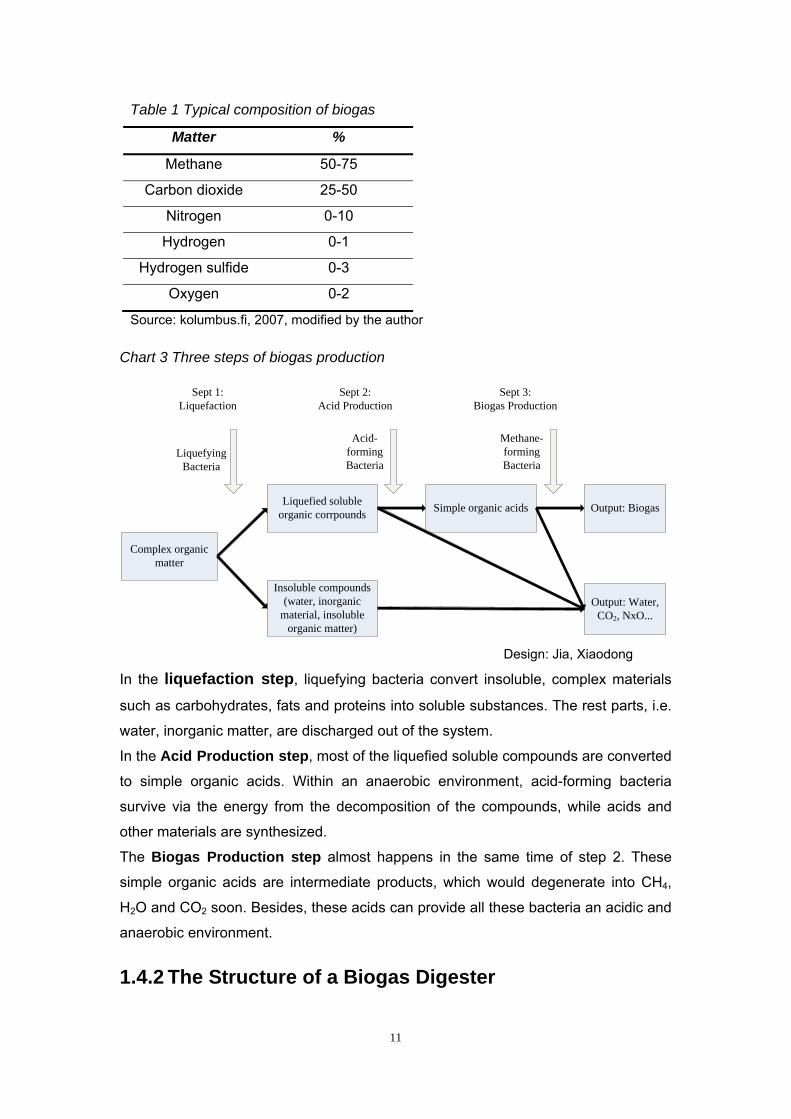
The process can be divided into three steps (Chart 3). 2 Only a Chinese version of this document is available. The targets are translated by the author.
11
Chart 3 Three steps of biogas production
Complex organic matter
Insoluble compounds (water, inorganic
material, insoluble organic matter)
Liquefied soluble organic corrpounds Simple organic acids
Sept 3: Biogas Production
Sept 2: Acid Production
Sept 1: Liquefaction
Liquefying Bacteria
Acid-forming Bacteria
Methane-forming Bacteria
Output: Biogas
Output: Water, CO2, NxO...
Design: Jia, Xiaodong
In the liquefaction step, liquefying bacteria convert insoluble, complex materials
such as carbohydrates, fats and proteins into soluble substances. The rest parts, i.e.
water, inorganic matter, are discharged out of the system.
In the Acid Production step, most of the liquefied soluble compounds are converted
to simple organic acids. Within an anaerobic environment, acid-forming bacteria
survive via the energy from the decomposition of the compounds, while acids and
other materials are synthesized.
The Biogas Production step almost happens in the same time of step 2. These
simple organic acids are intermediate products, which would degenerate into CH4,
H2O and CO2 soon. Besides, these acids can provide all these bacteria an acidic and
anaerobic environment.
1.4.2 The Structure of a Biogas Digester
Table 1 Typical composition of biogas
Matter %
Methane 50-75
Carbon dioxide 25-50
Nitrogen 0-10
Hydrogen 0-1
Hydrogen sulfide 0-3
Oxygen 0-2
Source: kolumbus.fi, 2007, modified by the author

12
There is evidence that biogas was used to heat bath water in Assyria during 10 BC;
and the first digestion plant to produce biogas from wastes was built in a leper colony
in Bombay, India in 1859. (Li & Ho, 2000, p34).
Nowadays, biogas is a full-fledged technology and could be applied in different
situations and scales. In China, serial of construction codes and regulations have
been launched by Ministry of Agriculture (M.A.China, 1987, 2002). Some key
difficulties are being researched, e.g. performance in cold weather (Gao, et al. 2007,
p35-36), high-efficient bacteria that would short the production process (Zhou, et al.,
2007, p761-764).
The working principle of a simple biogas digester is described in Chart 4: as more
and more biogas is produced, the water level in slurry would decline and in overflow
tank would ascend. The slurry is the reaction container of biogas production. Its top
space works as the storage tank for biogas. Whilst the biogas is flared, the air
pressure in slurry will decrease and the water will be extracted from the overflow tank.
The function of the overflow tank is to adjust and moderate the pressure balance.
1.4.3 Status of the Biogas Use World Wide
In the 1940ies, Germany started to use agricultural products to produce biogas. In
1970s, the demand for biogas increased, driven by the oil crisis. In 1990s, biogas
became more and more popular in Europe for two reasons: the profitability of using
power derived of biogas and the recycling management based on the principle of
waste avoidance. (Deublein and Steinhauser, 2008, p30).
The USA is the biggest electricity generator via biogas with 4.9 TWh in 2001. The
United Kingdom is the biggest one in Europe with 2.9 TWh in 2001. Germany
Chart 4 Basic Form of Biogas Digester
Source: Li & Ho, 2000, p34

13
produced nearly 2.0 TWh in 2001 (IEA, 2004, p70). As the development of
technologies, mechanical-biological treatment, dry-anaerobic digester, central
computer control system and the electricity generator with biogas turbine are applied
in biogas plants more and more. Nowadays, even, agriculture residues, biomass,
organic domestic waste can be applied in developing countries for biogas production,
with positive impacts on the environment.
In the developing countries, the biogas production is limited by the lack of suitable
technologies and financial ability. So the capacity and efficiency is smaller and lower.
Most of biogas plants or digesters consume manure, rather than other organic waste.
However, the biogas is still considered as an excellent solution of energy crisis and
manure pollution. Since 1970s, Asian countries such as India, The Philippines,
Thailand, Indonesia, etc, have solved the technical problems, e.g. carbon/nitrogen
ratio, operation in winter3 (Barnett et al, 1978, p97-109). Nowadays, Asian countries
are paying more attention to the biogas issue as an important alternative renewable
energy source. Nepal has 145000 biogas plants for a population of about 20 mil
financed by the World Bank. In Vietnam, 18,000 biogas digesters were built by the
year 2005 and another 150,000 would be constructed by 2010. As the two biggest
developing counties, China and India have bigger programs. India is running 2.5 mil
biogas digesters. Depending on the substances, the plants generate 3-10 m3 biogas
per day, enough to feed an common family in rural area (Deublein, Steinhauser,
2008, p35).
3 Till now, the performance of biogas plant in cold weather is still a difficulty in world-wide, especially for individual biogas digesters. In large-scale biogas plants, a heating system is always designed to keep a stable temperature inside the plant via flaring some biogas.

14
2 Biogas-Household Program in Datong
2.1 National Setting
2.1.1 History of Biogas Use in China
China is one of the pioneering countries for the use of biogas. Three historical stages
of biogas application could be distinguished:
Introductory Stage – Early 20th century By the end of the nineteenth century, simple biogas digesters had appeared in the
coastal areas of southern China. In 1920, Luo, Guorui invented and built an 8 m3
biogas tank and established the Santou Guorui Biogas Co.,Ltd. In 1935, Chinese
Guorui Biogas Digester Practical Lecture Notes were published, representing the first
monograph on biogas in China and also in the world. (Deublein, Steinhauser, 2008,
p13)
First nation-wide introduction Stage – 1970ies The second stage of biogas use occurred between 1970 and 1990, when the
Chinese government considered biogas application as an effective and rational use
of natural resources in rural areas. Around 1970ies, about 6 mil biogas plants were
set up in China for energy, environmental protection and improvement in hygiene
(Deublein, Steinhauser, 2008, p30; Li, 2008, p2). A considerable amount of
international researches on the program reflected the world-wide attention given to
these Chinese efforts (Van Buren, 1976; McGarry, Stainforth, 1978; GTZ, 1981). The
Chinese biogas technology was so successful in that period that the “China dome”
bio-reactor became a formal construction standard and a model for the use of biogas
in developing countries.
Mass promulgation of improved technologies – 1990ies until present The third wave started in 1990ies as a part of eighth national five-year plan with the
application of the latest research results (Deublein, Steinhauser, 2008, p35; Li, 2008,
p3). New concepts have also been developed in this period, e.g. “A pit with three
15
reconstructions”, “4 in 1” (livestock-biogas-vegetable-modern greenhouse) and
“Livestock-Biogas-Fruits”. By the end of 2000, there were 9.8 mil household
digesters throughout China and 55% of them conducted integrated utilization (Li,
2008, p3). In the 10th national five-year plan, the BHP was implemented in the
national scale.
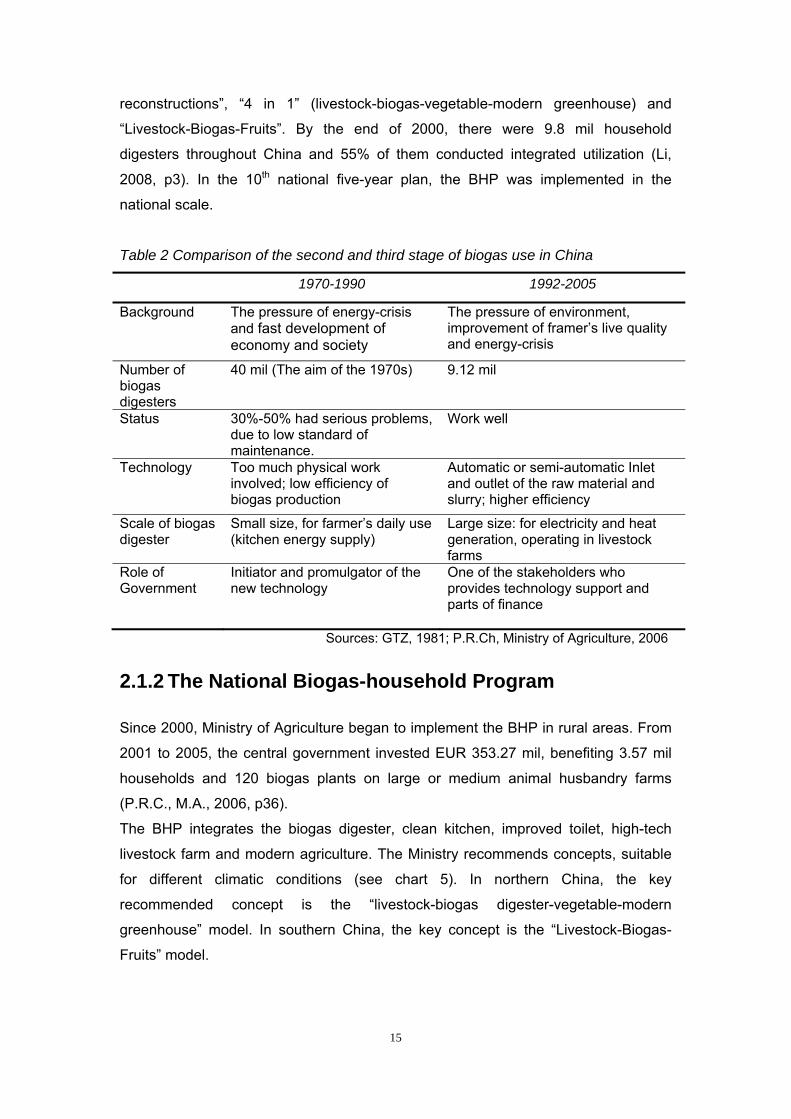
Table 2 Comparison of the second and third stage of biogas use in China
1970-1990 1992-2005
Background The pressure of energy-crisis and fast development of economy and society
The pressure of environment, improvement of framer’s live quality and energy-crisis
Number of biogas digesters
40 mil (The aim of the 1970s) 9.12 mil
Status 30%-50% had serious problems, due to low standard of maintenance.
Work well
Technology Too much physical work involved; low efficiency of biogas production
Automatic or semi-automatic Inlet and outlet of the raw material and slurry; higher efficiency
Scale of biogas digester
Small size, for farmer’s daily use(kitchen energy supply)
Large size: for electricity and heat generation, operating in livestock farms
Role of Government
Initiator and promulgator of the new technology
One of the stakeholders who provides technology support and parts of finance
Sources: GTZ, 1981; P.R.Ch, Ministry of Agriculture, 2006
2.1.2 The National Biogas-household Program
Since 2000, Ministry of Agriculture began to implement the BHP in rural areas. From
2001 to 2005, the central government invested EUR 353.27 mil, benefiting 3.57 mil
households and 120 biogas plants on large or medium animal husbandry farms
(P.R.C., M.A., 2006, p36).
The BHP integrates the biogas digester, clean kitchen, improved toilet, high-tech
livestock farm and modern agriculture. The Ministry recommends concepts, suitable
for different climatic conditions (see chart 5). In northern China, the key
recommended concept is the “livestock-biogas digester-vegetable-modern
greenhouse” model. In southern China, the key concept is the “Livestock-Biogas-
Fruits” model.

16
The construction cost of
Biogas digester is 300-
350 EUR, 80-120 EUR
of which would be
subsidized by the Fund
of National BHP (P.R.C.,
M.A., 2006, p30).
In the second phase
(2006-2010) of the BHP,
the central government
invests EUR 13.17
billion for up to 4000
large scale biogas
projects and 23.18 mil
individual biogas
digesters. Until 2010,
there will be 4700 large
scale biogas projects in
operation covering 39%
of all large livestock
farms. Besides, there
will be 41.18 mil
individual biogas
digesters, supporting
approx. 17% of all rural
households in China.
2.1.3 The Economic, Ecologic and Social Values of BHP
The BHP helps farmers to save energy, i.e. coal and fuel wood. One digester of 8 m3
could help a three-member family to save ca. 600 kg coal annually (P.R.C., M.A.,
2006, p8). Besides, lots of residents cook or heat with fuel wood, the poorer the
worse. The survey data suggest that an average household could save 1.5-2 t of fuel
wood annually by the use of biogas.
The BHP would also improve the land quality and reduce the costs of agriculture
production. Farmers could fertilize with the liquid and rest of biomass instead of 20%
of fertilizer and pesticides. At the same time, the agriculture also is stimulated by the
Chart 5 Models of Biogas-household program in China
Source: Li, 2007, p3
17
organic liquid fertilizer and compost. An investigation in Southern China states, that
the production of rice and wheat would increase 10%-12.5% with the use of bio-
sludge (Van Buren, 1976, p16).
The program is expected to control the non-point pollution on air and water body in
rural area. The low combustion efficiency of the traditional stove causes not only the
waste of fuel, but also brings lots of air pollutant, e.g. CO, N2O, etc. The methane
emission from the disposal of manure and domestic waste is a harmful gas whose
global warming potential (GWP) is 21 times of CO2. In rural area of China, the lack of
waste disposal and sanitation leads to heavy water pollution. The livestock manure
and human excreta so far have not been treated safely. Manure, excreta and leaches
from solid waste indiscriminately discharged on land do not only bring pollution to
water body and underground water, but may also be the cause for a large variety of
infectious diseases. The worse issue is that the rural area is always located in the
upstream of the urban area.
The BHP is expected to greatly reduce the occurrence of mosquitoes and flies, and
reduce alimentary canal diseases (P.R.C., M.A., 2006, p10). During the anaerobic
process, most of pathogens and germs would be killed. The reduction of the parasite
eggs in the processed fecal liquid is up to 98% (McGarry, Stainforth, 1978, p71).
Besides, the program will enhance better kitchens with clean biogas and a more
efficient stove, thus greatly improve the life quality of farmers.
In addition, BHP can improve the women’s life quality in rural area, because they are
normally in charge of cooking in poor and smoky kitchens with low-efficiency stoves.
However, the initiative of BHP is to solve the bottleneck of energy supply in rural
areas which is directly relevant to the farmers’ life quality. One household-use
digester can save some 0.5T coal annually which costs about 30 EUR 4. Further
economic benefits are the output increase of agriculture and the expense saving
resulting from the use of bio-sludge as a substitute of synthetic fertilizer. It is
estimated that 50 EUR could be saved directly by BHP for each family5. Moreover,
one medium biogas plant can is expected to produce annually 550,000 m3 biogas
equalling up to 850 tones coals. These two parts could save 28.2 mil tones of coals
each year when the 2006-2010 national BHP finishes (P.R.C., M.A., 2006, p8).
The program plays a crucial role in the development of urban and rural of China.
Facing the fast urbanization and immigration of China (see chart 6), a well inner- 4 The price of coal is changing in a range of 30-80 EUR /T in China. 5 The use of biogas depends on the lifestyle of the habitants and local geographic conditions. Taking Datong Xian as example, because of its cool weather and abundance of local coal resources, farmers use comparatively more coal per capital than other area. Thus, the introduction of biogas use could also save more coal.

18
function relationship between urban and rural is expected by government. Mao
Zhedong, the first president of P.R.China, had summarised top-10 relationships in
China. The relationship between urban and rural is one of them.
Chart 6 Percentage of urban population in World-wide and China (1950-2050)
Data Source: UNESA, World Urbanization Prospect Database, 2007
19
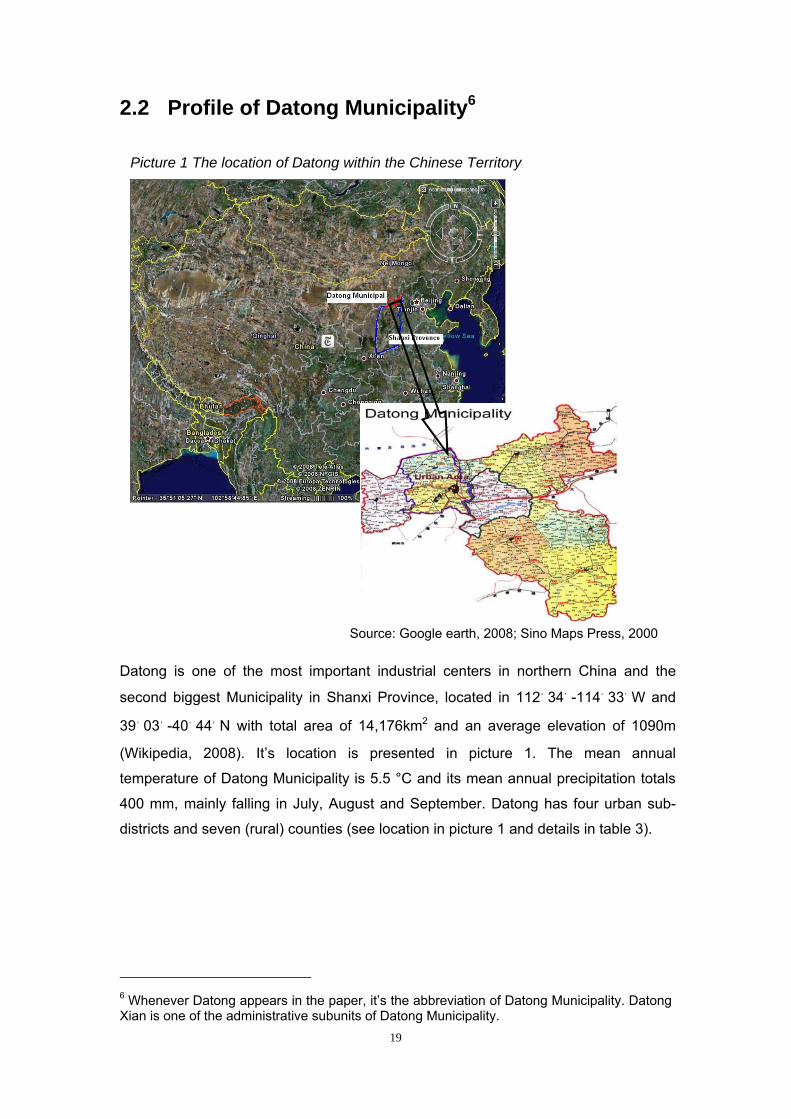
2.2 Profile of Datong Municipality6
Datong is one of the most important industrial centers in northern China and the
second biggest Municipality in Shanxi Province, located in 112。34,-114。33,W and
39。03,-40。44,N with total area of 14,176km2 and an average elevation of 1090m
(Wikipedia, 2008). It’s location is presented in picture 1. The mean annual
temperature of Datong Municipality is 5.5 °C and its mean annual precipitation totals
400 mm, mainly falling in July, August and September. Datong has four urban sub-
districts and seven (rural) counties (see location in picture 1 and details in table 3).
6 Whenever Datong appears in the paper, it’s the abbreviation of Datong Municipality. Datong Xian is one of the administrative subunits of Datong Municipality.
Picture 1 The location of Datong within the Chinese Territory
Source: Google earth, 2008; Sino Maps Press, 2000
20
Table 3 Datong Municipality: Administrative Sub-Units
Name Area (km2) Approx. Population
Central Urban District (城区)*The location of local government of Datong
46 580,000
Mining District (矿区) 62 440,000
District Nanjiao (南郊区) 966 280,000
District Xinrong (新荣区) 1,006 110,000
Yanggao Xian (阳高县) 1,678 290,000
Tianzhen Xian (天镇县) 1,635 210,000
Guangling Xian (广灵县) 1,283 180,000
Lingqiu Xian (灵丘县) 2,720 230,000
Hunyan Xian (浑源县) 1,965 350,000
Zuoyun Xian (左云县) 1,314 140,000
Datong Xian (大同县) 1,503 170,000
Source: Wikipedia, 2008; Datong Municipality’s Bureau of Statistics, 2001-2005
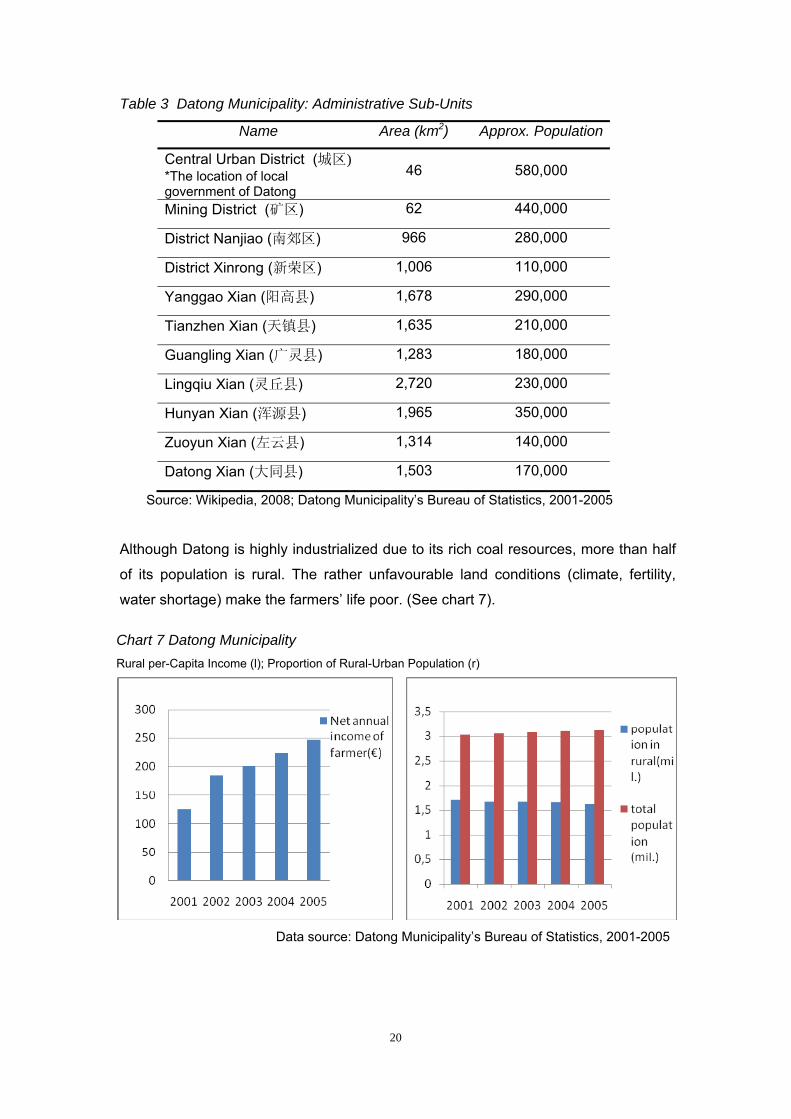
Although Datong is highly industrialized due to its rich coal resources, more than half
of its population is rural. The rather unfavourable land conditions (climate, fertility,
water shortage) make the farmers’ life poor. (See chart 7).
Chart 7 Datong Municipality Rural per-Capita Income (l); Proportion of Rural-Urban Population (r)
Data source: Datong Municipality’s Bureau of Statistics, 2001-2005
21
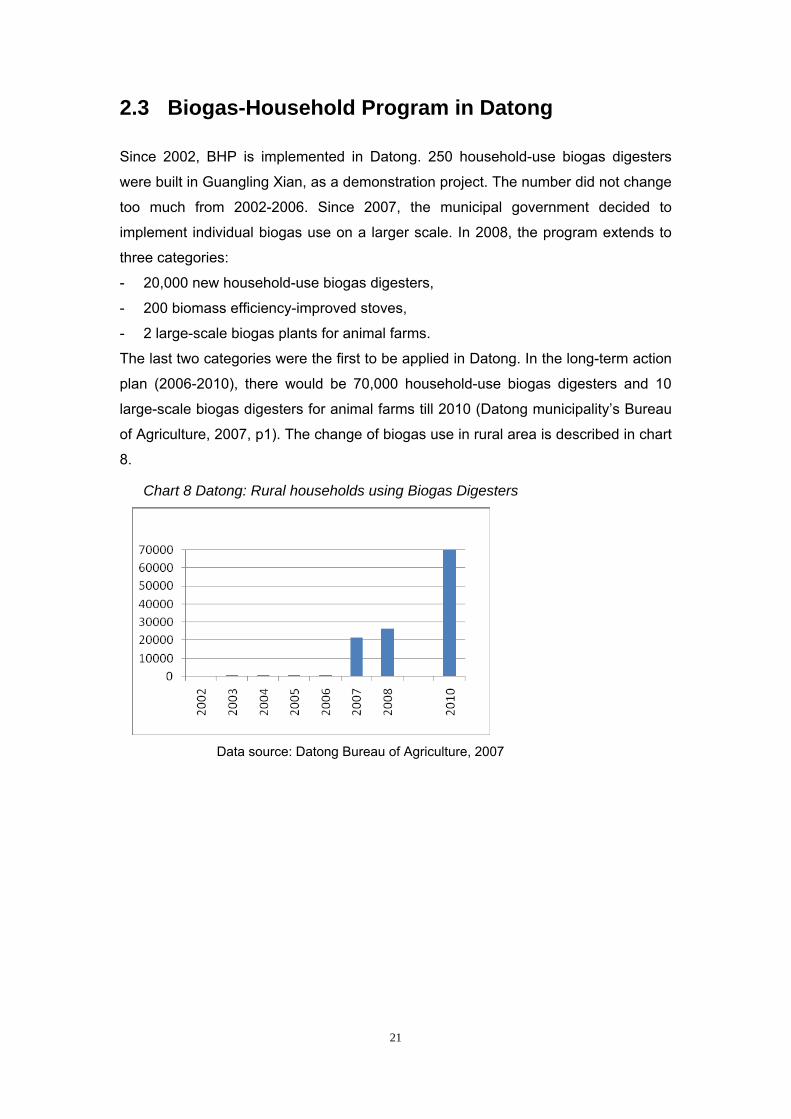
2.3 Biogas-Household Program in Datong
Since 2002, BHP is implemented in Datong. 250 household-use biogas digesters
were built in Guangling Xian, as a demonstration project. The number did not change
too much from 2002-2006. Since 2007, the municipal government decided to
implement individual biogas use on a larger scale. In 2008, the program extends to
three categories:
- 20,000 new household-use biogas digesters,
- 200 biomass efficiency-improved stoves,
- 2 large-scale biogas plants for animal farms.
The last two categories were the first to be applied in Datong. In the long-term action
plan (2006-2010), there would be 70,000 household-use biogas digesters and 10
large-scale biogas digesters for animal farms till 2010 (Datong municipality’s Bureau
of Agriculture, 2007, p1). The change of biogas use in rural area is described in chart
8.
Chart 8 Datong: Rural households using Biogas Digesters
Data source: Datong Bureau of Agriculture, 2007

22
2.3.1 Forms of the Applications
As stated above, there are three categories of application in the BHP till 2008, i.e.
Biogas plants, Biomass efficiency-improved stoves, and Individual biogas digesters.
All of them will be described below:
Large-scale biogas plant Till the end of 2007, two large-scale biogas plants were supported by BHP. One is
located in Jiye Swine Farm Co., Ltd, and another one in Yubao Dairy Co., Ltd. Jiye
Swine Farm raises 120,000 swine annually with a life time of 4.5 month. The biogas
project will install a biogas turbine generator (see picture 2) with capacity of 950 kWh.
Yubao Dairy Co., Ltd is one of the biggest local milk suppliers, with 2000 dairy cows.
The electricity-supply capacity of this biogas project is 400 kWh. The Project Design
Documents of them have been submitted in 2007. Hopefully, the construction could
start at March, 2009. The biogas projects in these two companies will consume the
animal manure and provide clean electricity generation as a substitute of the
traditional coal-fire electricity generation. In absence of the program, these manures
are disposed in open lagoons and release methane into atmosphere directly.
Photos: Wang, Xiuqin7
Biomass efficiency-improved stoves The biomass stoves (see picture 3) project is the latest demonstration project in 2007
under the framework of BHP. 200 households in Xietun, Beijingzao, of Datong
7 Mrs. Wang, Xiuqin is the chef of Agriculture Monitoring Station of Datong and one of the members of Joint Team to supervise and enhance the BHP in Datong. These photos are taken when she inspected and visited the biogas-technology provider.
Picture 2 Datong: large biogas project (left: biogas plant / right: biogas turbine generator)

23
Xian(大同县倍加皂乡谢屯村) have been selected. Half of them are provided with
improved biomass stoves for heating and cooking. The other half are provided with
improved biomass stoves for cooking. Traditionally the crop residues are burnt
untreated, which wastes biomass energy and releases polluted air into the rooms and
into the atmosphere. The aim of this project is to reuse the biomass resources in a
higher efficiency in order to save costs for fuel and reduce the burning of coal.
Household-use biogas digesters Till the end of 2007, 21,362 household-use biogas digesters had been installed in
Datong. 20,562 had been built in 2007 with a uniform standard (see picture 4). All are
constructed underground with brick concrete having a daily capacity of 8 m3 biogas.
The raw materials for these biogas digesters mainly are animal manure.
Picture 3 Improved efficiency biomass stoves (left: Improved biomass stoves for heating and cooking/right: Improved biomass stoves for cooking)
Photos: Jia, Xiaodong
Picture 4 Household-use biogas digesters ( left: buried biogas-digester / right: biogas stove)
Photos: Jia, Xiaodong

24
2.3.2 Financing
All three categories of this program, 2 large biogas plants in livestock farms, 200
improved biomass stoves, and 21362 individual use biogas digesters, are
implemented with financial subsidies and technical support. The biogas plant in Jiye
Swine Farm receives subsidy of EUR100,000 (35% of overall costs). The biogas
plant in Yubao Dairy Co., Ltd is financed with EUR40,000 (22% of total costs). 200
new biomass stoves are provided to farmers free of charge. The household-use
digesters are the most important constituent of the BHP and get finance of EUR
6.051 mil totally from different levels of government.
Chart 9 describes the basic financial sources of a digester with costs of EUR 300:
33.3% come from the Shanxi provincial budget, 8.3% from the municipal budget of
Datong. The financial support granted by the Xian level depends on the individual
revenue situation and the attention given to biogas production. However, none gives
less than 8,3% (EUR 25). Four of the 11 districts provide EUR 100 for each bio-
digester owner, which means that in this case the farmer receives renewable energy
free of charge. In the particular case of Datong Xian each household was only given
a support of EUR25 (Datong municipality’s Bureau of Agriculture, 2007, p6). Within
Datong Xian further financial support was also granted from the Xiang budget. Also
at this level, the support varies considerably, depending on the local economic
situation. Some rich Xiangs and Cuns provide the other half of the cost, by supplying
cement, bricks, or/and biogas stoves. Some poor Xiangs can’t afford any extra
expense.
Chart 9 Datong: Financial Sources for Digester* (Unit: EUR)
** Total cost of individual biogas digester is 300 EURO.
Data source: Datong Municipality’s Bureau of Agriculture, 2007; Personal investigation

25
2.3.3 Technical Support Measures
Governments play a very crucial role in the implementation of the BHP It is not only
the biggest financial supporter, but also provides all the technical services.
For technical support, a service network is just being installed in Datong. 2
independent service companies have registered successfully. 10 technical support
stations located in every Xian and sub-district (except the Central Urban District)8. 54
service stations are scattered in different Villages. Till the end of 2007, 784
technicians obtained career licenses which are awarded by the national
administration of agriculture.
Because of the limit of revenue, these technical support stations and service boxes
are always lack of cars, computers and some necessary tools.
2.3.4 Monitoring and Evaluation
At the beginning of the program design, governments have considered about the
monitoring and evaluation.
In the level of central government, monitoring and evaluation mainly focus on
accountability and efficiency of the national fund. 10% of Xians applying the fund will
be inspected on site randomly. A service hot-line is set, 0086-10-59191706. The
relevant regulations about the award and punishment are also set. (P.R.C., Ministry
of Agriculture, 1999, p8)
The local governments pay more attention on effectiveness and quality. “Shanxi
Provence’s regulations about the acceptance of BHP activities” indicates that, the
acceptance by Xiang’s governments should include the design material, subsidy
expense, operation, biogas generation, and environmental impact assessment. 30%
of the biogas users should be inspected on site randomly. the inspection will comply
with a evaluation system, in which all the aspects of the BHP will be given a mark in
the range of 1-5. (Shanxi’s Department of Agriculture, 2004, p1-4)
2.4 The Survey Sample: Datong Xian
As the survey sample, Datong Xian plays an important role in this thesis. The
confirmation of all parameters used for the calculation of GHG emission reduction by
individual biogas digesters was carried out and finished in Datong Xian by the author
8 District Cheng has been urbanized completely. There are no agriculture or farm activities.

26
and his team 9 . Beside, the survey about the user attitude towards the Biogas-
household program is carried out in here too.
From the economic and social point of view, Datong Xian is eligible to represent the
middle level among the 11 Xians and districts of Datong. It is a typical Xian in the
northern China located in 130。20,-113。35,W and 39。43,-40。16,N with an area of
1,503 km2. The mean annual temperature of Datong Xian is 6.4 °C and its mean
annual precipitation totals 300-450 mm, mainly in July, August and September. The
total population of Datong Xian is circa 170,000, 130,000 of which work in agriculture
activities. Agriculture is the economic backbone of Datong Xian. However, because of
the poor land qualities and difficult climatic situation, the net income per capita of
farmer is only 313.5 EUR in 2007 (Local government of Datong Xian, 2008).
Datong Xian has ten Xiangs which vary largely in terms of GDP and net income of
farmers (see chart 10 and chart 11). The net income of farmers is the main indicator
of the degree of wealth, which depends mainly on the given topographic and natural
situation in each specific locality. The Xiang which are located closer to High-speed
way/national motorway or closer to a river/reservoir normally have a better economic
situation (see chart 12).
9 The team members: Jia, Shiyuan, Liang, Shuzhen. The investigation got lots of help from Bureau of Agriculture of Datong Xian and local xiang governments..
Chart 10 Datong Xian: 11 Xiang’s GDP, 2007(Mil EUR)
Data source: Local government of Datong Xian, 2008
27
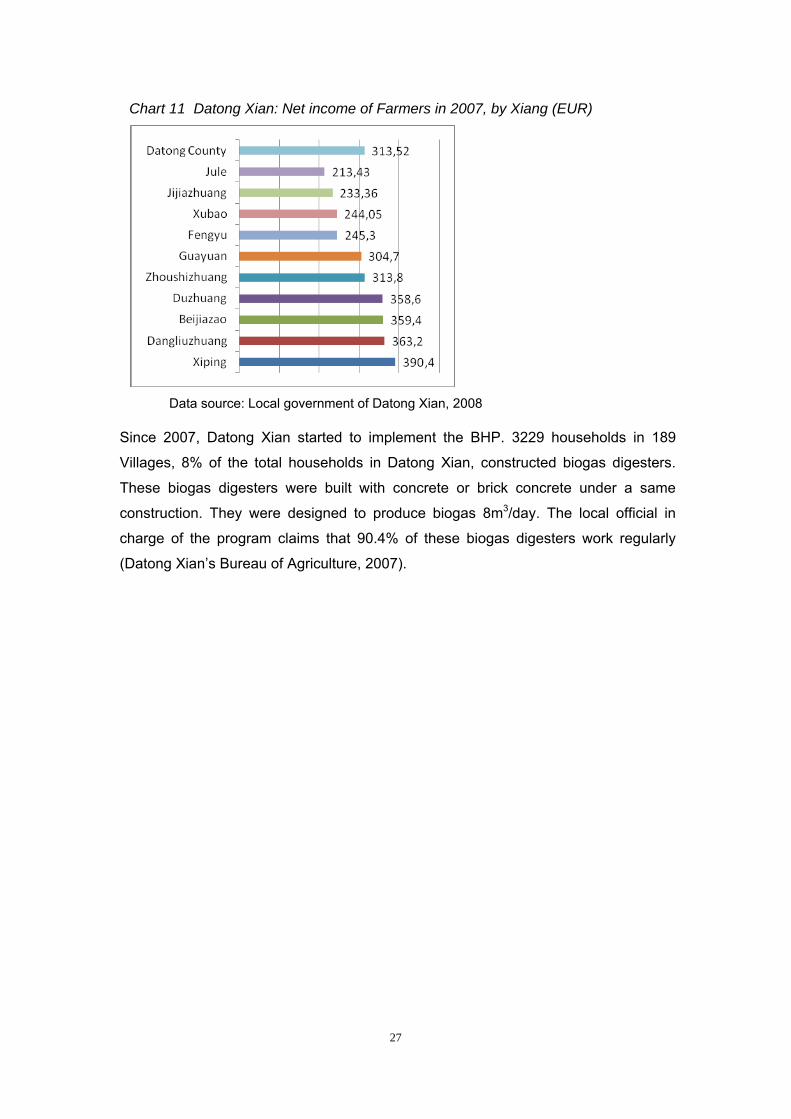
Since 2007, Datong Xian started to implement the BHP. 3229 households in 189
Villages, 8% of the total households in Datong Xian, constructed biogas digesters.
These biogas digesters were built with concrete or brick concrete under a same
construction. They were designed to produce biogas 8m3/day. The local official in
charge of the program claims that 90.4% of these biogas digesters work regularly
(Datong Xian’s Bureau of Agriculture, 2007).
Chart 11 Datong Xian: Net income of Farmers in 2007, by Xiang (EUR)
Data source: Local government of Datong Xian, 2008

28
Design by Jia,Xiaodong
Chart 12 Datong Xian: Distribution of biogas users in Xiangs in 2007

29
3 State of Research
All the biogas programs in different countries and different period started for the same
reason of the lack of the energy. But there is a meaningful value neglected in most
situations, which is that Biogas-household program would reduce the non-point
greenhouse gas emission and mitigate greenhouse effect.
In Dce.11, 1997, “Kyoto Protocol to the United National Framework Convention on
Climate Change” was launched. 156 countries have signed the agreement and
promise to reduce their GHG emission till 2005. To stimulate and help the ecological-
friendly projects, “Kyoto Protocol” arranges two mechanisms: CDM (Clean
Development Mechanism) and JI (Joint Implementation). CDM allows appendix I
countries to meet their emission reduction target by paying for the GHG emission
reduction from non-appendix I countries (mainly OEDC and some eastern European
countries). JI allows appendix I countries to meet their emission reduction target inter
the appendix I countries.
With compliance of “Kyoto Protocol” and IPCC (Intergovernmental Panel on Climate
Change) Guidelines for National GHG Inventories, series of methodologies are
developed to measure the amount of GHG emission reduction by one kind of project.
Some of them are relative with the different aspects of the biogas generation and use.
However, there are not available and systematic methodologies for the BHP or similar
program in a large scale.
“One of the most promising areas for future CDM activities is programmatic CDM
(pCDM), wherein the normal project-by-project approval process is aggregated into a
broader program including many individual activities” (UNEP Riso Centre, 2007, p1).
But the fact is that 2037 projects exist in the CDM project pipeline till June 11, 2007,
and only 21 projects with pCDM characteristics.
The reason is lack of systematic methods to calculate the GHG emission reduction by.
The most recently relative methodologies are Gold Standard Methodology for
Improved Cook-Stoves and Kitchen Regimes and Gold Standard Methodology for
small Scale Bio-digester (Gold Standard foundation, 2008). Unfortunately, there is not
application for these two methodologies.
One of similar project under CDM pipeline is the Biogas Support Program – Nepal.
This project aims to install a total of 200,000 small biogas digesters all over Nepal.
The finance support comes from international subsidy, Nepal government fund and

30
finance from CDM mechanism. Because of lack of relative methodologies, the project
developer only chooses these methodologies which are most easy to monitor and
comply. Finally, only the GHG emission reduction by the replacement of thermal
energy is calculated and monitored, in according with the small scale CDM
methodology I: Thermal Energy for the User with or without electricity generation.
(Ecosecurities, 2006)
The improved cooperate governance is a new concept in China. Effectiveness,
accountability, participation, etc, are introduced to Chinese mind, accompanying with
the open and reform of China. One example is that, the open bidding regulations in all
public relevant section are learned from the UN and Worldbank regulations, when
China apply their loads and subsidies.
There are various methods to evaluate the governance. Vertical comparison is used
to evaluate governance with data in a long period of time. The change and tendency
of these data can show the evolvement of governance. Almus (2003) set a database
on public start-up assistance activities (1990-1999) under the Deutsche Ausgleichs
Bank to evaluate its effect on these companies. Esposti (2002) evaluate the Italy’s
national agricultural research systems by the similar way with data from 1972 to 1991.
Ballesteros and Rico (2001) applied this method to evaluate the Spanish financing of
precompetitive research projects which was developed by firms in collaboration with
universities and public research organisms. Horizontal comparison is applied to
measure the governance inner-countries. One example is Mandl (2008) evaluate the
effectiveness of public spending in EU members. Similar case is Herrera and Pang
(2005) measured the effect of public spending in developing countries.
We could find out all these methods have two common characteristics: defined
indicators and statistic analysis.

31
4 Methodology
This chapter will introduce the methodology of the thesis, involving the carbon flows in
Biogas-household program, the estimation of the GHG emission reduction and survey
of the attitudes of the program holders.
4.1 Carbon Flow Map of BHP
The essence of Biogas-household program is a project of methane and other GHG
recovery. It changes the previous carbon flow into a low-carbon emission flow (see
chart 13).
In absence of BHP, there would several sources of GHG emissions in rural area in
China, above:
GHG emissions in animal manure management system
GHG emissions in human excreta management system
GHG emissions emitted from the Landfill of food waste and other waste
GHG emissions from fuel consume for the daily life
Non-CO2 GHG emissions from biomass burning

32
All of these GHG would be released into the atmosphere and become a part of the
global carbon circle. The carbon involved in the GHG would come back to the ground
through precipitation, or conversed through the photosynthesis and stored in
biomasses or fossil fuels. And then, human activity would emit the GHG through the
consumption of fuels or other ways. Part of the GHG would accumulate in the
atmosphere and form the greenhouse effect.
BHP is able to recover the GHG emissions through the biogas digesters. The biogas
produced by the BHP would be used for the cooking and lighting, in which process
only the CO2 would be emitted, rather than CH4 with a heavy negative impact on
climate.
Chart 13 The position of BHP within the general Carbon flow
33
4.2 Estimation of GHG Emission Reduction
IPCC (Intergovernmental Panel on Climate Change) has developed a systemic way
to estimate the GHG emissions from all sections (anthropogenic and natural). To
make the Clean Development Mechanism (CDM) accurate and comparable, United
Nations Framework Convention on Climate Change (UNFCCC) provides series of
approved methodologies fit for different project activities that could reduce the GHG
emissions.
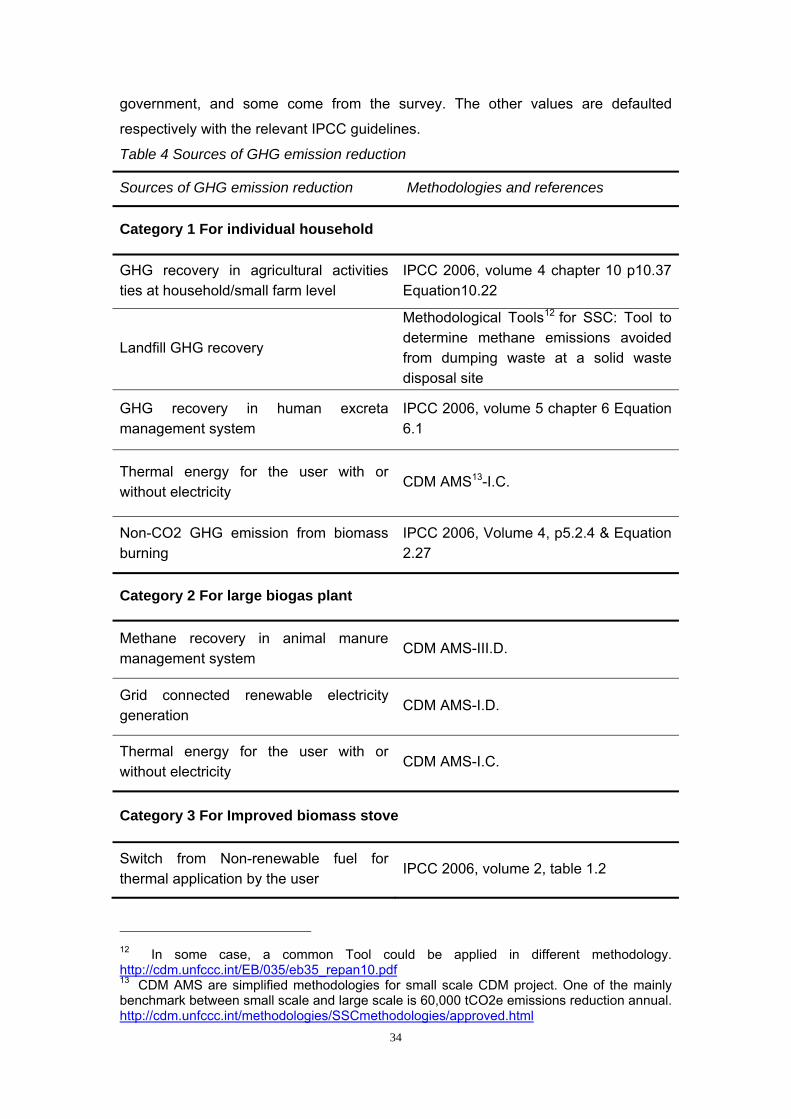
In 2007, Datong municipality decided to implement BHP in three forms: household-
use biogas digesters, large-scale biogas digesters for animal farms, and biomass
efficiency-improved stoves. Based on IPCC 2006 10 and CDM approved
methodologies11, the thesis classifies the sources of GHG emission reduction into
three categories. In addition, under each category, every possible source of GHG
emission reduction is indicated following the relevant IPCC guidelines or CDM
methodologies (see table 4).
Basically, the GHG emission reduction is the difference between baseline emission
and the combination of project emission and leakage emission. Baseline for a project
activity which is potential to reduce the GHG emissions is the scenario that
reasonably represents the anthropogenic GHG emissions that would occur in the
absence of the proposed project activity (UNFCCC, 2008, p10). In some case, the
proposed project would also cause GHG emissions, i.e. directly from fuel
consumption, indirectly from the use of electricity or vehicle. In addition, there would
probably be more than one source of baseline emission and/or project emission in
one project. Under the CDM framework, different approved methodologies are
proposed to calculate the GHG emission reduction for different kind of project. The
number of approved methodologies is increasing year by year, as people realize that
lots of projects have the potential to reduce their GHG emissions.
Annex 2 is a calculation model linked to an EXCEL calculation sheet. Formulas are
introduced in the back-ground of the EXCEL, following the chosen methodologies
and references in table 4. The missing data in Annex 2 (marked as 0 in red in the row
of “Value”) will be obtained in the process of data collection. Some of them are from
10 IPCC 2006 includes: volume 1 General guidance and reporting, volume 2 Energy, volume 3 Industrial processes and product use, volume 4 Agriculture, forestry and other land, volume 5 Waste. http://www.ipcc-nggip.iges.or.jp/public/2006gl/index.html 11 All CDM approved methodologies are listed in the website of UNFCCC: http://cdm.unfccc.int/methodologies/SSCmethodologies/index.html
34
government, and some come from the survey. The other values are defaulted
respectively with the relevant IPCC guidelines.
Table 4 Sources of GHG emission reduction
Sources of GHG emission reduction Methodologies and references
Category 1 For individual household
GHG recovery in agricultural activities ties at household/small farm level
IPCC 2006, volume 4 chapter 10 p10.37 Equation10.22
Landfill GHG recovery
Methodological Tools12 for SSC: Tool to determine methane emissions avoided from dumping waste at a solid waste disposal site
GHG recovery in human excreta management system
IPCC 2006, volume 5 chapter 6 Equation 6.1
Thermal energy for the user with or without electricity
CDM AMS13-I.C.
Non-CO2 GHG emission from biomass burning
IPCC 2006, Volume 4, p5.2.4 & Equation 2.27
Category 2 For large biogas plant
Methane recovery in animal manure management system
CDM AMS-III.D.
Grid connected renewable electricity generation
CDM AMS-I.D.
Thermal energy for the user with or without electricity
CDM AMS-I.C.
Category 3 For Improved biomass stove
Switch from Non-renewable fuel for thermal application by the user
IPCC 2006, volume 2, table 1.2
12 In some case, a common Tool could be applied in different methodology. http://cdm.unfccc.int/EB/035/eb35_repan10.pdf 13 CDM AMS are simplified methodologies for small scale CDM project. One of the mainly benchmark between small scale and large scale is 60,000 tCO2e emissions reduction annual. http://cdm.unfccc.int/methodologies/SSCmethodologies/approved.html

35
4.3 Evaluation of Governance
The governments at different level have allocated large funds to develop the BHP,
but the most important factor in the implementation of this program should be the
farmers, the individual program holders. Hence the thesis try find out the attitudes of
the program holders before evaluating them.
First, we need to define the indictors of this program which are related with the
attitudes of program holders. Based on a research in the field of promoting
renewable energy (Brouns, et al. 2007, p6-7), a sample survey should be designed to
collect attitudes about four main dimensions/barriers, including awareness &
information, finance & economic, technological, institutional & political.
In the sector of awareness & information, the questions about the degree of known
and understanding on the BHP and greenhouse effect are asked towards framers. In
the sector of financial & economic, the amount and forms of governmental subsidy,
the importance of these subsidies, and the way farmer access the rest part of the
cost are asked by the investigators. In the sector of technological, interviews
investigate the methods by which the farmers get the knowledge about the biogas
digester. In the sector of institutional & political, the farmers are required to evaluate
the BHP and the performance of governments and speak out their perspective.
Then, a descriptive statistics analysis would be introduced to summarize the answers
and evaluate the governance of BHP.
Finally, from the result of the evaluation and perspectives of program holders, the
thesis will bring forward proposals improving the governance and management
system for BHP.
4.4 Data Collection
The target of data collection is to obtain the missing data in the calculation model and
access the attitudes of program holders. It includes two sources, material from
government about the implication of the BHP and survey with the farmers who are
the program holders.
The data from the survey play a crucial role in the estimation of GHG emission
reduction by individual biogas digesters and the attitudes of program holders, and the
data from government are used for the estimation of GHG emission reduction by
large-scale biogas plants and biomass stoves. It is also is a useful supplement for all
relevant information. The framework of data collection would make sure the data are
authentic and representative.

36
From the Bureau of Agriculture of Datong, which is in charge of the implication of the
BHP, and other government departments, the basic statement of the BHP in Datong
and the information of the program holders could be obtained.
For the individual use of biogas digester and the attitudes towards the governance,
the survey is conducted.
4.5 Survey Design
Survey is chosen as the tool to collect the data and information, rather than census.
Because the sample survey is generally cheaper, faster and easier to control, despite
that there would be sampling error depending on sample size and the variability of
the characteristic of interest. The details describes blew:
- Survey objective: the survey is designed to collect the values of the relevant
parameter for the estimation of GHG emission reduction, and the attitude of these
farmers towards the program
- Target population: 3.229 bio-digester holders in Datong Xian (information about
interviewees in Annex 4)
- Survey population: a sample interval 3% of the target population, 97
householders scattered in different villages considering the economic state and
geographic situation.
Chart 14 Data collection procedure
Design by Jia,Xiaodong
37
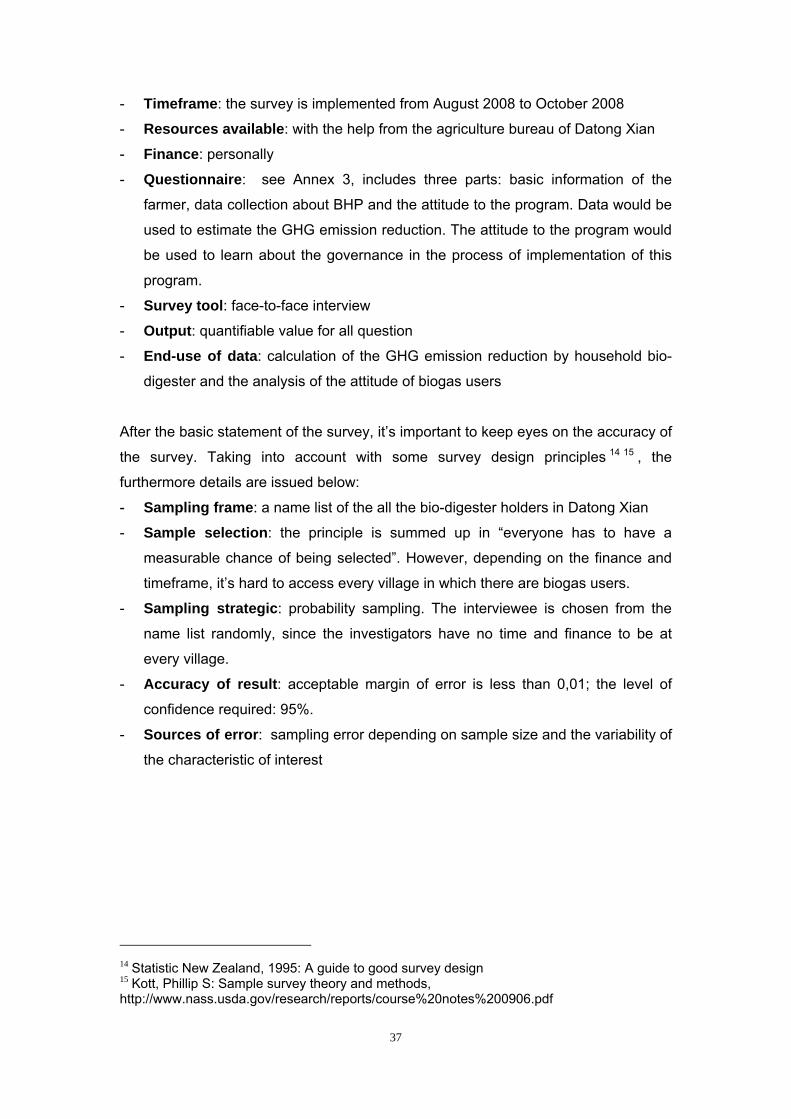
- Timeframe: the survey is implemented from August 2008 to October 2008
- Resources available: with the help from the agriculture bureau of Datong Xian
- Finance: personally
- Questionnaire: see Annex 3, includes three parts: basic information of the
farmer, data collection about BHP and the attitude to the program. Data would be
used to estimate the GHG emission reduction. The attitude to the program would
be used to learn about the governance in the process of implementation of this
program.
- Survey tool: face-to-face interview
- Output: quantifiable value for all question
- End-use of data: calculation of the GHG emission reduction by household bio-
digester and the analysis of the attitude of biogas users
After the basic statement of the survey, it’s important to keep eyes on the accuracy of
the survey. Taking into account with some survey design principles 14 15 , the
furthermore details are issued below:
- Sampling frame: a name list of the all the bio-digester holders in Datong Xian
- Sample selection: the principle is summed up in “everyone has to have a
measurable chance of being selected”. However, depending on the finance and
timeframe, it’s hard to access every village in which there are biogas users.
- Sampling strategic: probability sampling. The interviewee is chosen from the
name list randomly, since the investigators have no time and finance to be at
every village.
- Accuracy of result: acceptable margin of error is less than 0,01; the level of
confidence required: 95%.
- Sources of error: sampling error depending on sample size and the variability of
the characteristic of interest
14 Statistic New Zealand, 1995: A guide to good survey design 15 Kott, Phillip S: Sample survey theory and methods, http://www.nass.usda.gov/research/reports/course%20notes%200906.pdf
38
5 Results and Analysis
5.1 GHG Emission Reduction
In accordance with the calculation model and collected data, the GHG emission
reduction by the BHP in Datong are achieved by its three components: 2 large biogas
plants in livestock farms, 200 efficiency-improved biomass stoves, and 21.362
individual use biogas digesters.
During the process of data collection, it is found that some sources in table 3 do not
exist in currency, e.g. no thermal use in large biogas plants, no crop residues and
food waste consumed by individual biogas digesters. Consequentially, the GHG
emission reduction from these sources is excluded in the calculation, responding to
the real situation.
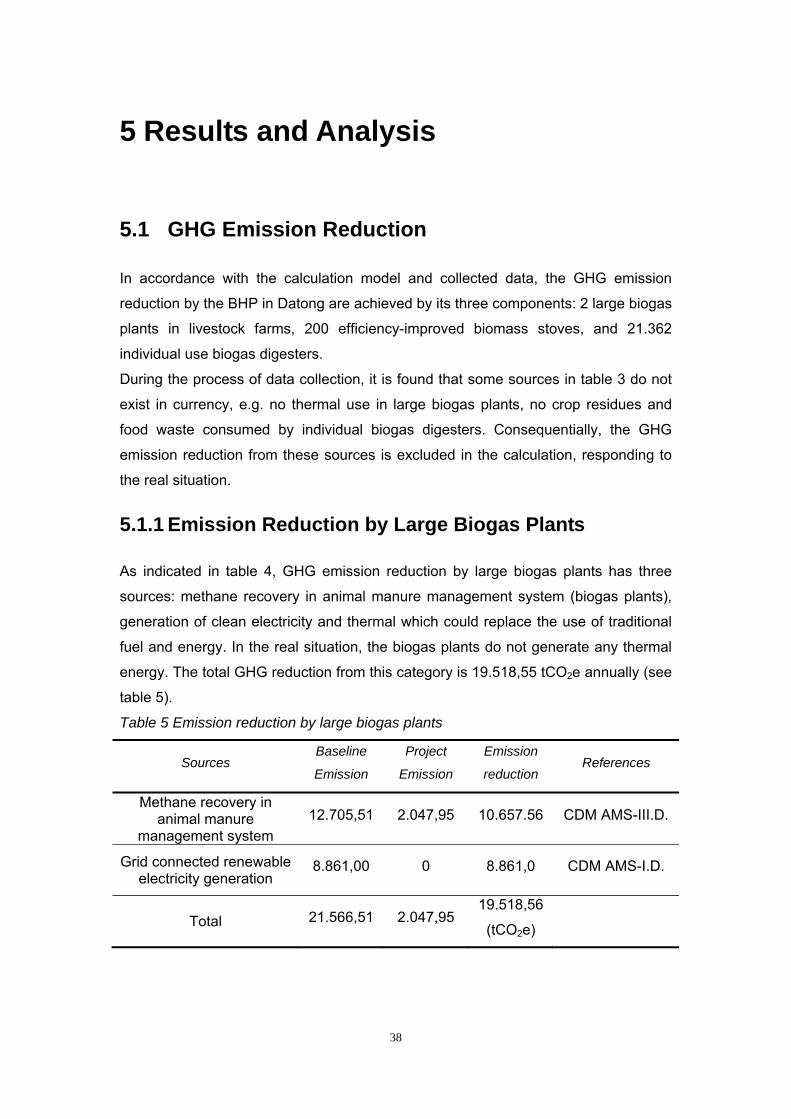
5.1.1 Emission Reduction by Large Biogas Plants
As indicated in table 4, GHG emission reduction by large biogas plants has three
sources: methane recovery in animal manure management system (biogas plants),
generation of clean electricity and thermal which could replace the use of traditional
fuel and energy. In the real situation, the biogas plants do not generate any thermal
energy. The total GHG reduction from this category is 19.518,55 tCO2e annually (see
table 5).
Table 5 Emission reduction by large biogas plants
Sources Baseline
Emission
Project
Emission
Emission
reduction References
Methane recovery in animal manure
management system 12.705,51 2.047,95 10.657.56 CDM AMS-III.D.
Grid connected renewable electricity generation
8.861,00 0 8.861,0 CDM AMS-I.D.
Total 21.566,51 2.047,95 19.518,56
(tCO2e)
39
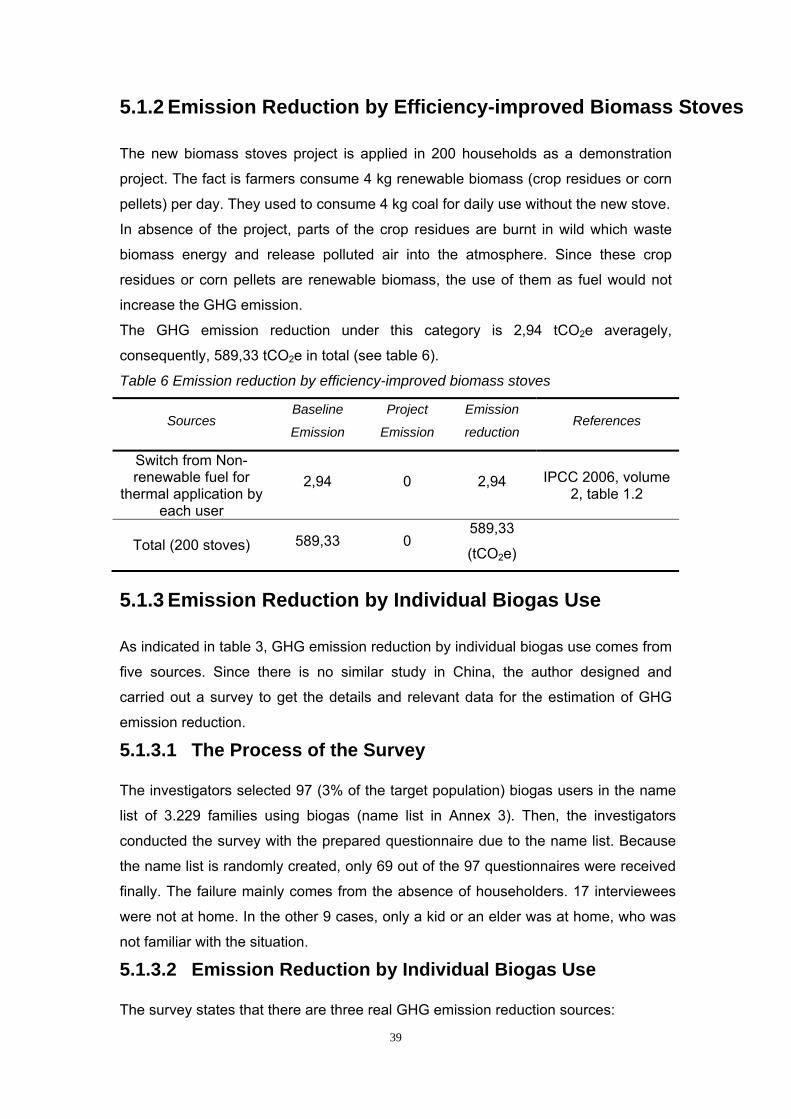
5.1.2 Emission Reduction by Efficiency-improved Biomass Stoves
The new biomass stoves project is applied in 200 households as a demonstration
project. The fact is farmers consume 4 kg renewable biomass (crop residues or corn
pellets) per day. They used to consume 4 kg coal for daily use without the new stove.
In absence of the project, parts of the crop residues are burnt in wild which waste
biomass energy and release polluted air into the atmosphere. Since these crop
residues or corn pellets are renewable biomass, the use of them as fuel would not
increase the GHG emission.
The GHG emission reduction under this category is 2,94 tCO2e averagely,
consequently, 589,33 tCO2e in total (see table 6).
Table 6 Emission reduction by efficiency-improved biomass stoves
Sources Baseline
Emission
Project
Emission
Emission
reduction References
Switch from Non-renewable fuel for
thermal application by each user
2,94 0 2,94 IPCC 2006, volume 2, table 1.2
Total (200 stoves) 589,33 0 589,33
(tCO2e)
5.1.3 Emission Reduction by Individual Biogas Use
As indicated in table 3, GHG emission reduction by individual biogas use comes from
five sources. Since there is no similar study in China, the author designed and
carried out a survey to get the details and relevant data for the estimation of GHG
emission reduction.
5.1.3.1 The Process of the Survey
The investigators selected 97 (3% of the target population) biogas users in the name
list of 3.229 families using biogas (name list in Annex 3). Then, the investigators
conducted the survey with the prepared questionnaire due to the name list. Because
the name list is randomly created, only 69 out of the 97 questionnaires were received
finally. The failure mainly comes from the absence of householders. 17 interviewees
were not at home. In the other 9 cases, only a kid or an elder was at home, who was
not familiar with the situation.
5.1.3.2 Emission Reduction by Individual Biogas Use
The survey states that there are three real GHG emission reduction sources:

40
- GHG recovery in agricultural activities ties at household/small farm level,
- GHG recovery from human excreta,
- Thermal energy for the user with or without electricity.
The other two sources listed in table 4 do not occur in the interviewed households.
The daily organic waste (kitchen/food waste, garden waste) is not consumed by the
biogas digester, so there is no GHG emission reduction from the CH4 recovery from
landfill. The crop residues are sold partly and the other part are burnt directly. No
crop residues are used in the biogas digester, so there is no the GHG emission
reduction from the avoidance of biomass burning.
The interviewees were selected randomly and scattered in all the 10 Xiangs of
Datong Xian. Their economic and geographic situation varies greatly. To control the
uncertainty, a correct factor is set as 0,9 for the estimation. Therefore, it’s acceptable
that the level of GHG emission reduction via biogas use in Datong Xian is eligible to
represent the situation of Datong.
The GHG emission reduction is 900,60 tCO2e by the 69 household, and the GHG
emission reduction per household is 13,05 tCO2e. Hence, the total annual GHG
emission reduction by individual biogas use in Datong is expected to be 250.937,91
tCO2e (see table 7).
Table 7 Emission reduction by individual biogas use
Sources Baseline Emission
Project Emission
Emission reduction
References
GHG recovery in agricultural activities
ties at household/small farm level
14,25 0 14,25 IPCC 2006,
volume 4 chapter 10 p10.37
Equation10.22
GHG recovery in human excreta
0,0116 0 0,01 IPCC 2006,
volume 5 chapter 6 Equation 6.1
Thermal energy for the user with or without
electricity 886,34 0 886,34 CDM AMS-I.C.
Survey sample (69 households)
900,60 0 900,60
Mean 13,05 13,05
Total (21362 households17)
250.937,91 0 250.937,91
(tCO2e)
16 Only one interviewee uses human excreta in his biogas digester. Author includes this part, because “A pit with three reconstructions” and “4 in 1” are getting more and more popular, in which the human excreta would be used in biogas digester. Nowadays, few farmers apply this, as the construction of these two biogas digester are expensive.

41
5.1.4 The Total Emission Reduction in 2007
The BHP in rural area has developed over the narrow concept of household biogas
use. Lots of new technologies are involved into the program to save energy and
improve the life quality of farmers now.
The three types of new technologies under the framework of the BHP have achieved
their goals in the perspective of economic and ecological development. It’s measured
that farmer have saved EUR 5,346 mil by the use of biogas digester annually
(Datong Municipality’s Bureau of Agriculture, 2007).
As the most important by-product of the BHP, the GHG emission reduction is totally
271.045,79 tCO2e in 2007 (see table 8).
Table 8 Total emission reduction in 2007
Category Baseline
Emission
Project
Emission
Emission
reduction
Large biogas plants 21.566,51 2.047,95 19.518,56
Efficiency-improvement biomass
stoves 589,33 0 589,33
Individual biogas use 250.937,91 0 250.937,9
Total 273.093,75 2.047,95 271.045,79
(tCO2e)
5.2 Energy Flow of BHP in Datong in 2007
In last section is the GHG emission reduction clarified. In this section, the energy flow
provides us with an overview of the program in the perspective of energy.
5.2.1 Energy Input
The energy inputs of the program are from animal manure and renewable biomass,
consumed by bio-digesters and biomass stoves. Therefore,
Einputs = Einput, manure + Einput, biomass 17 Till the end of 2007, 21362 households have biogas digester and use biogas in Datong.
42
Where,
Einputs = Energy inputs of the program (MJ/a)
Einput, manure = Energy inputs from animal manure (MJ/a)
Einput, biomass = Energy inputs from renewable biomass use in stoves (MJ/a)
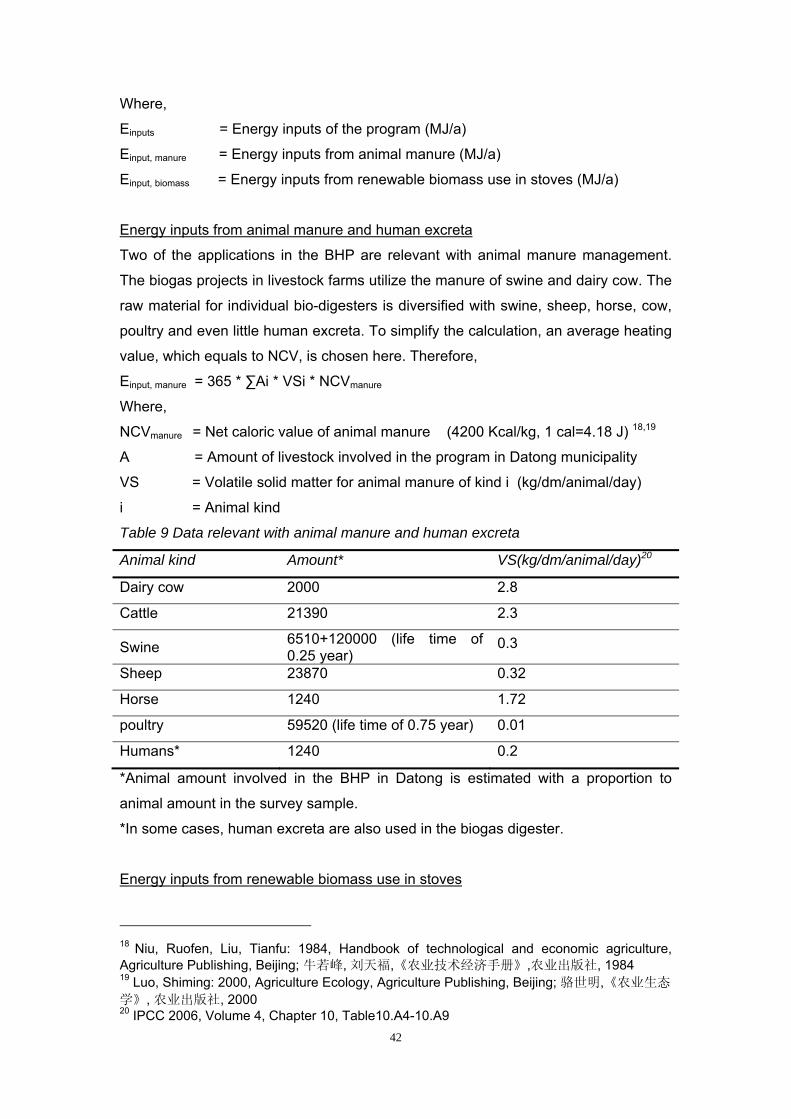
Energy inputs from animal manure and human excreta
Two of the applications in the BHP are relevant with animal manure management.
The biogas projects in livestock farms utilize the manure of swine and dairy cow. The
raw material for individual bio-digesters is diversified with swine, sheep, horse, cow,
poultry and even little human excreta. To simplify the calculation, an average heating
value, which equals to NCV, is chosen here. Therefore,
Einput, manure = 365 * ∑Ai * VSi * NCVmanure
Where,
NCVmanure = Net caloric value of animal manure (4200 Kcal/kg, 1 cal=4.18 J) 18,19
A = Amount of livestock involved in the program in Datong municipality
VS = Volatile solid matter for animal manure of kind i (kg/dm/animal/day)
i = Animal kind
Table 9 Data relevant with animal manure and human excreta
Animal kind Amount* VS(kg/dm/animal/day)20
Dairy cow 2000 2.8
Cattle 21390 2.3
Swine 6510+120000 (life time of 0.25 year)
0.3
Sheep 23870 0.32
Horse 1240 1.72
poultry 59520 (life time of 0.75 year) 0.01
Humans* 1240 0.2
*Animal amount involved in the BHP in Datong is estimated with a proportion to
animal amount in the survey sample.
*In some cases, human excreta are also used in the biogas digester.
Energy inputs from renewable biomass use in stoves
18 Niu, Ruofen, Liu, Tianfu: 1984, Handbook of technological and economic agriculture, Agriculture Publishing, Beijing; 牛若峰, 刘天福,《农业技术经济手册》,农业出版社, 1984 19 Luo, Shiming: 2000, Agriculture Ecology, Agriculture Publishing, Beijing; 骆世明,《农业生态
学》, 农业出版社, 2000 20 IPCC 2006, Volume 4, Chapter 10, Table10.A4-10.A9

43
In the pilot project of improved biomass stoves, renewable biomass (crop residues,
wood chips) is consumed. The relevant energy input is,
Einput, biomass = N * W * NCVbiomass
Where,
N = The number of the stove users (200)
W = Weight of biomass consumed by each stove annually (1460 kg/year)
NCVmanure = Net calorie value of solid biomass (11.6 MJ/kg)21
5.2.2 Energy Output
The energy output mainly goes to the domestic energy consumption with three forms.
The biogas produced by individual bio-digesters is used for the daily life of the
residence in rural area. The electricity generated by two biogas projects would be fed
into the gird. The biomass stoves provides thermal energy for cooking and heating
for the rural inhabitants. Therefore,
Eoutputs = Eoutput, biogas + Eoutput, elec. + Eoutput, thermal
Where,
Eoutputs = Energy outputs of the program (MJ/a)
Eoutput, biogas = Energy outputs from biogas (MJ/a)
Eoutput, elec. = Energy outputs from electricity generated by biogas project (MJ/a)
Eoutput, thermal = Energy outputs from thermal use of biomass stoves (MJ/a)
Energy outputs from biogas
It is the initial object to produce biogas as a substitute of fossil fuel in rural areas.
According with the survey results, the average amount of biogas production per
biogas digester is 4,268m3 annual. Therefore,
Eoutput, biogas = N * P * NCVbiogas
Where,
N = Number of household-use of bio-digesters (21362)
P = Annual biogas produce for one digester (4,268m3)
NCVbiogas = Heating value of biogas (58.500 Kcal/m3, 1 cal=4.18 J)22
Energy outputs from electricity
The biogas project located in the two livestock farms would generate electricity and
feed it into grid. Therefore, 21 IPCC 2006, Volume 2, Chapter 1, Table 1.2 22 IPCC 2006, Volume 2, Chapter 1, Table 1.2

44
Eoutput, elec. = P * h * f
Where,
P = Total capacity of the two biogas projects (1350 kW)
h = Working hours of the project annual (8232 hours, 24 hours*7days*49weeks)
f = factor (1 MWh=3.6 GJ)
Energy outputs from thermal use of biomass stoves
Although the application of biomass stoves is a pilot project, we also consider it into
the energy out. Compared with traditional stove, the efficiency of the improved
biomass stove increases from 30% to 90%. Therefore,
Eoutput, thermal = 0.9 * Einput,biomass
Where,
Einput, biomass = Energy inputs from renewable biomass use in stoves (MJ/a)
0.9 = Efficiency of the improved biomass stove
5.2.3 Energy Flow Map
This section complies with STAN tool developed by Institute for water quality,
Resources and Waste management of Vienna University of Technology.
Respectively with the calculation of input and output energy, we could draw a clear
energy flow map in Chart 15. The total input energy of the program is 590,8 TJ/a and
the output is 96,4 TJ/a. The energy exchange rate is 16,32%. Three flow roads are
involved in the map, which are the three applications of the program. The energy
exchange rate of individual bio-digester is 11,91%. The relevant rate of large scale
biogas project is 28,70%. The last, but the highest one is 90% for the biomass stoves.
A notable point is that all the input energy comes from renewable energy, which
would be wasted in absence of the program. The use of the renewable energy does
not only save the energy, but also reduces the GHG emission by the use of fossil fuel
and electricity.
However, there should be attention on the energy exchange efficiency, especially in
the application of the individual bio-digester. In some samples, the leakage of biogas
was obvious. The main reasons are the carelessness of the householder and the
lack of technical support.

45
5.3 The Attitudes towards Governance
One broad concept of governance is “the entirety of all co-existing modes of
collectively regulating social matter” (Mayntz, 2004, p7). Governance refers to all
modes of coordinating action in human society in the extended perspective (Risse
and Lehmkuhl, 2006, p66). Conceiving governance in this way, one can apply the
concept to states, organizations, firms and other social units. The definition of
governance is also given according with the different focus of attention. Derwent and
Jones (1996, p65) defined the governance as the relationship between shareholders
and their companies and the way in which shareholders act to encourage best
practice. Parkinson (1994, p59) focused the process of supervision and control
intended to ensure that company’s management acts in accordance with the
interests of shareholders. The definition is also re-recognized with the development
of the economic and the society. The empirical definition of governance focused on
the conflicts of interest between manager and owners, and now the owners have
been extended to a wide range of stakeholders (Weston, et al, 2004, p583).
Government at the various administrative levels is the initiator of the program. It also
is the biggest financial supporter and the technical services provider. One may
Chart 15 Energy flow map
Designed by Jia, Xiaodong

46
therefore expect a highly positive reputation of government among those supported
by the BHP.
5.3.1 The Meaning of Governance in China
In the context of this research governance is defined by the author as the policy-
making and public management by government. Governance and Administration are
both used to describe the governments’ activities in China23. Why is Governance
preferred in this thesis? Generally speaking, public management or public
administration, no matter in which political system, have the tendency to operate in a
top-down manner. The role of government in the BHP is the guider, rather than the
administrator. The success of the program relies on the quality of inter-action
between the stakeholders, i.e. governments, private companies, individuals. In
additions, the management in the BHP is eligible for the characteristics of the notion
of accountability, corporate profitability and social responsibility, abstracted by
Solomon (2007, p14-15) as governance in future. Maybe, the governance does not
work so well now. It is a hope that the governance could be improved to fit these
three characteristics.
According the classification of governance by Risse and Lehmkuhl (see table 10),
Chinese governance is a classic hierarchical (top-down) structure which is changing
gradually. The self-governance at the village (cun) level has already been achieved.
The original legal foundation for this can be traced to article 111 of the 1982
Constitution which provided for the establishment of village committees and specified
that the residents elect the chairman and members of each committee (Su and Yang,
2005, p125-157). From 1998, self-governance and election in the village level are
populated in the overall scale of China. With respect of actors involved, since the
reform and open of china in 1978, more and more private actors are introduced into
the economic field. Except some key industries, e.g. energy, nature resources,
military manufacture, China has marketized completely. Even some of public 23 In the English-version website of China’s central government, “Governance” and “Administration” are used synonymously (guanli) to describe the governments’ management and activities. http://sousuo.gov.cn/search?searchword=SEARCHVALUE%3D%24^~public*administration%24^~&sortfield=-Pubdate&channelid=6001&licensecode=2164260865.1232631035.1&outlinepage=%2Fgw_js%2Fen%2Fjs%2Fzn_outline.jsp&uc=0&detailpage=%2Fgw_js%2Fen%2Fdetail%2Fzn_detail.jsp&sep=%3B&fenlei=0&page=3&prepage=10&searchtype=1 http://sousuo.gov.cn/search?dc1=&dc2=&title=&content=&author=&keywords=governance&sortfield=-Pubdate&sub3=Search&channelid=6001&searchword=KEYWORDS%3D%24^~governance%24^~

47
services are provided by private sectors, e.g. water supply and waste water
treatment, solid waste treatment, public transportation, etc. Market-oriented economy
structure and urban governance system have been formed (Wu, 2001, p1071-1093).
Table 10 Modes of Governance
Actors involved Modes of Coordinating action
State actors State and non-state
actors Non-state actors
Hierarchical/ Vertical steering
Classic nation-state Supranational institutions/Jurisdiction
Delegation of public tasks to non-state actors or public contractors
Pre-state associations
Non-hierarchical/ Horizontal steering
International cooperation International regimes/organizations International negotiations
Public-private modes of cooperation partnership projects Indigenous collaboration Colonial regimes
Cooperation between non-state actors Private regimes (Religious) networks Colonial agencies
Sources: Risse and Lehmkuhl, 2006, p66
As a hierarchical governance system, the attitude of farmer towards the governance
in this program seems important and easy to be neglected. This sector analysis
these attitude through the interviews and try to find some valuable issues.
5.3.2 Awareness & Information Sector
Awareness is a very important hypothesis that could motivate and stimulate the
biogas user to tap the 100% potential. In the sector of awareness and information,
the author tries to find out the awareness about the use of biogas and clean energy.
Although the BHP is oriented by government to solve the energy problem,
environmental problem and health problem in rural area, farmers should be able to
get all the means of the program.
How would you evaluate the Biogas-household program?
About the satisfaction degree towards the BHP, 26% of interviewees feel satisfied
about this program. 54% evaluate this program basically satisfied and need some
improvement. In contrast, 10% interviewees feel disappointed about this program.
The rest part of 10% of respondents told the auditor that the project brings no change
for them. In most disappointed case, the reason is that the biogas digester can not
generate enough biogas, sometimes, even hard to start fire. A valuable point is that,
3 interviewees among 7 who are frustrated by the project got 100% finance from
governments for the digester.

48
How much do you know the Biogas-household program in China?
The BHP can not only bring economic benefit to farmers, but also great ecological
value. This question tries to find out how deep the farmers get known the program. A
assumption is that If the interviewees only know the use of biogas can save the use
of fuel and decrease the life cost, we supposed they know nothing about the program.
If they get known the program can bring the health and environmental value, we
believe they know a little about the program. The interviewees who know the
program could bring ecological benefit and mitigate the greenhouse effect are
considered as “know very well”. Finally, 10% of the interviewees know nothing about
the program. 74% know a little. The rest 16% know the program very well.
5.3.3 Financial & Economic Sector
In this sector, four questions are asked towards the farmers: the subsidy from
government and its form, and the importance of the government subsidy, the form of
the portion of self-finance.
How much did you get from governments as subsidy for the Biogas-household
program?

49
In according with different cuns, 35% of biogas digesters are provided free by
governments. 13% get finance of EUR 250 which could cover 83.3% of total cost.
15% get EUR 200 from governments. The smallest amount of finance is EUR150,
which can cover the half of the cost.
What are the constituent of the subsidy?
The forms of these subsidies are quite diversified. Normally, portfolios of subsidies
are provided with cash, construction material, stove and sometimes with technical
train. As the main form of subsidies, every respondent do get construction materials,
e.g. bricks and cements. In some rich cuns, cash or biogas stove are provided as a
supplementation. Only two of the farmers are chosen to take a train workshop. The
important issue is the biogas digester belonged to above two farmers can work with a
full capacity, which is scarce.
Is the subsidy important?
There are three options provided for this question. 66 of the interviewees think the
subsidy is very important, and the rest 3 respondents think the subsidy is “just better
than none”. Nobody considers the subsidy is not important. The 3 farmers who think
the subsidy is just better than nothing live in the richest Xiang of Datong Xian.
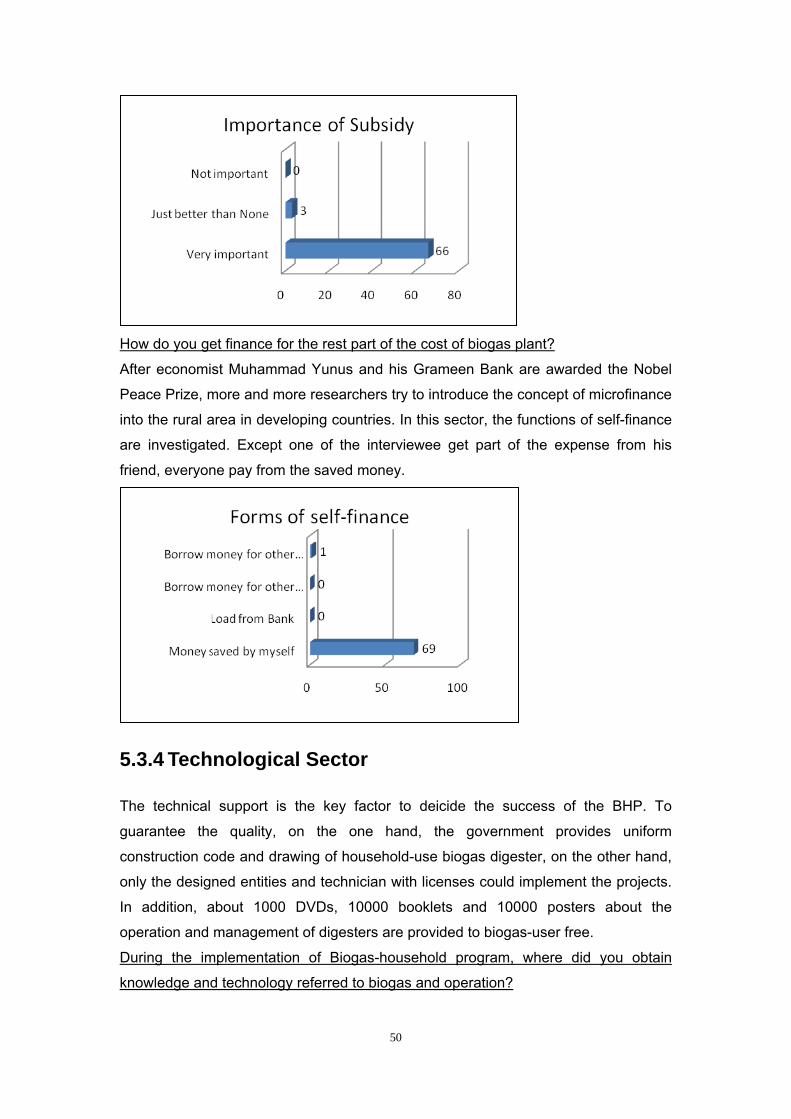
50
How do you get finance for the rest part of the cost of biogas plant?
After economist Muhammad Yunus and his Grameen Bank are awarded the Nobel
Peace Prize, more and more researchers try to introduce the concept of microfinance
into the rural area in developing countries. In this sector, the functions of self-finance
are investigated. Except one of the interviewee get part of the expense from his
friend, everyone pay from the saved money.
5.3.4 Technological Sector
The technical support is the key factor to deicide the success of the BHP. To
guarantee the quality, on the one hand, the government provides uniform
construction code and drawing of household-use biogas digester, on the other hand,
only the designed entities and technician with licenses could implement the projects.
In addition, about 1000 DVDs, 10000 booklets and 10000 posters about the
operation and management of digesters are provided to biogas-user free.
During the implementation of Biogas-household program, where did you obtain
knowledge and technology referred to biogas and operation?
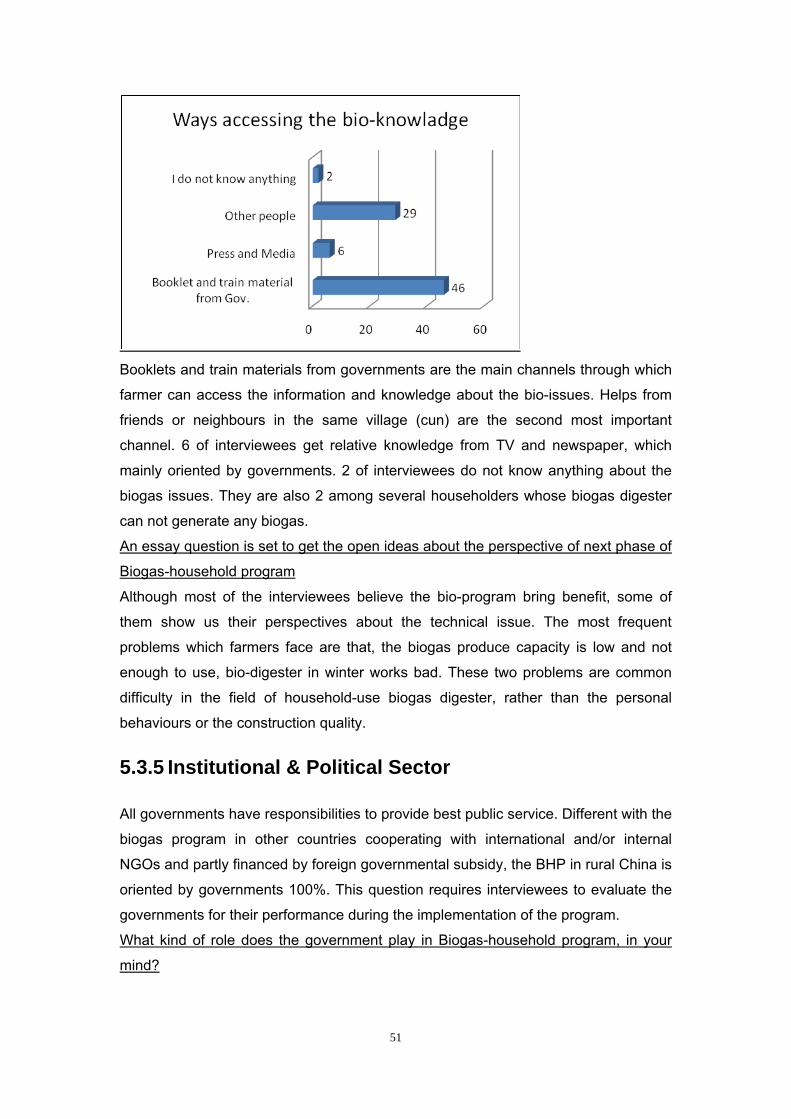
51
Booklets and train materials from governments are the main channels through which
farmer can access the information and knowledge about the bio-issues. Helps from
friends or neighbours in the same village (cun) are the second most important
channel. 6 of interviewees get relative knowledge from TV and newspaper, which
mainly oriented by governments. 2 of interviewees do not know anything about the
biogas issues. They are also 2 among several householders whose biogas digester
can not generate any biogas.
An essay question is set to get the open ideas about the perspective of next phase of
Biogas-household program
Although most of the interviewees believe the bio-program bring benefit, some of
them show us their perspectives about the technical issue. The most frequent
problems which farmers face are that, the biogas produce capacity is low and not
enough to use, bio-digester in winter works bad. These two problems are common
difficulty in the field of household-use biogas digester, rather than the personal
behaviours or the construction quality.
5.3.5 Institutional & Political Sector
All governments have responsibilities to provide best public service. Different with the
biogas program in other countries cooperating with international and/or internal
NGOs and partly financed by foreign governmental subsidy, the BHP in rural China is
oriented by governments 100%. This question requires interviewees to evaluate the
governments for their performance during the implementation of the program.
What kind of role does the government play in Biogas-household program, in your
mind?
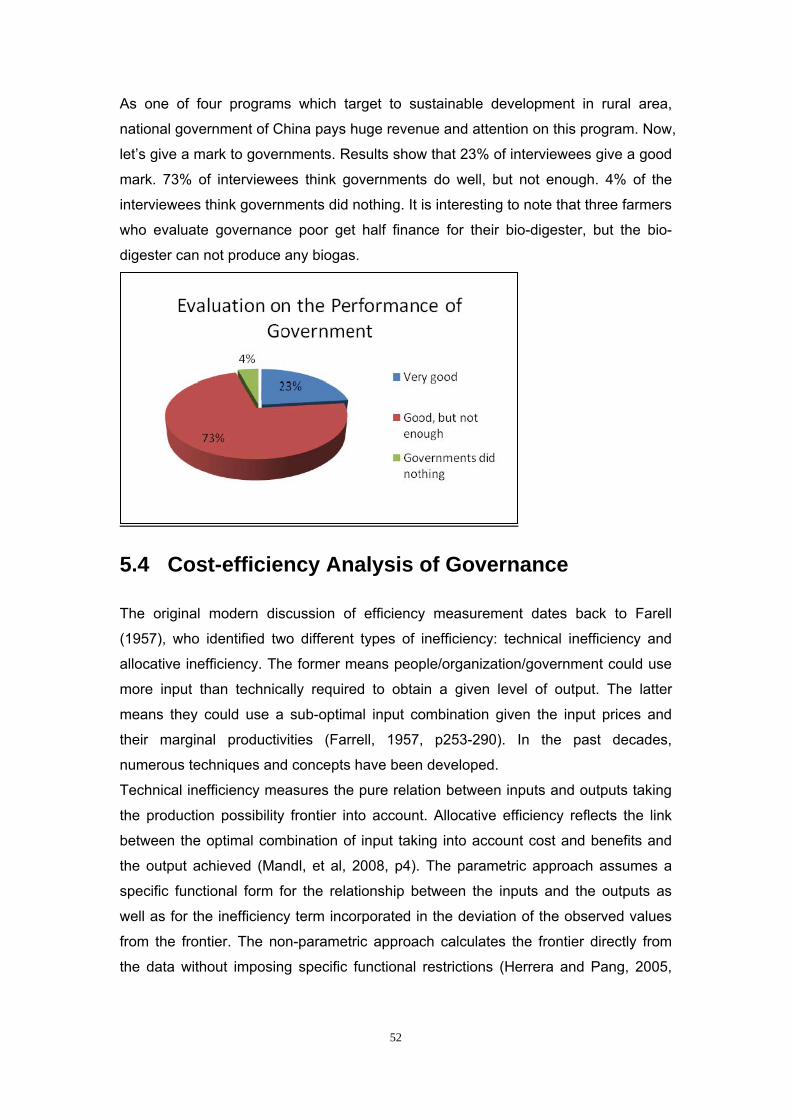
52
As one of four programs which target to sustainable development in rural area,
national government of China pays huge revenue and attention on this program. Now,
let’s give a mark to governments. Results show that 23% of interviewees give a good
mark. 73% of interviewees think governments do well, but not enough. 4% of the
interviewees think governments did nothing. It is interesting to note that three farmers
who evaluate governance poor get half finance for their bio-digester, but the bio-
digester can not produce any biogas.
5.4 Cost-efficiency Analysis of Governance
The original modern discussion of efficiency measurement dates back to Farell
(1957), who identified two different types of inefficiency: technical inefficiency and
allocative inefficiency. The former means people/organization/government could use
more input than technically required to obtain a given level of output. The latter
means they could use a sub-optimal input combination given the input prices and
their marginal productivities (Farrell, 1957, p253-290). In the past decades,
numerous techniques and concepts have been developed.
Technical inefficiency measures the pure relation between inputs and outputs taking
the production possibility frontier into account. Allocative efficiency reflects the link
between the optimal combination of input taking into account cost and benefits and
the output achieved (Mandl, et al, 2008, p4). The parametric approach assumes a
specific functional form for the relationship between the inputs and the outputs as
well as for the inefficiency term incorporated in the deviation of the observed values
from the frontier. The non-parametric approach calculates the frontier directly from
the data without imposing specific functional restrictions (Herrera and Pang, 2005,

53
p5). The respectively cases in table 11 presents the way in which different
approaches are applied.
Table 11 Applications of efficiency measurement
Technical inefficiency Allocative inefficiency
Parametric
(stochastic)
approach
WHO’s panel data (Greens,
2003)
The effectiveness of public
spending in EU members
( Mandl, 2008)
Non-parametric
(deterministic)
approach
The efficiency of public
spending in developing
countries (Herrera and
Pang, 2005)
Efficiency of disaggregate public
capital provision in Japan (Ihori,
2000)
Summarized by Jia,Xiaodong
This section arms to find out the most important indicator which relates with the
satisfaction degree of farmers. The satisfaction of the bio-digesters holders should be
the ultimate target of governance. At the same time, governance should take care
about the cost of implementation of the program, including the monetary cost and
other cost.
Till now, the government subsidy is spent in two functions, the direct subsidy to
farmers and firms who build these biogas facilities, and the indirect expense on the
technical support. The first one is the main expense. So we choose the amount of
subsidy towards each user, the biogas production and the satisfaction degree as
three variables to analysis the cost-efficiency of governance.
The analysis in this section applies the SPSS V11.5.
5.4.1 Group Analysis
As a preview of these three variables, we give a brief description of the data base in
table 12. Base on the different satisfy degree, the data base could be divided into 4
groups: satisfied, basically satisfied, no change to my life and disappointed. These
four different satisfaction degrees are set as 1, 0.75, 0.5, 0.25. A group analysis
shows that the interviewee who feel disappointed with the program have received
235,7 average as subsidy. But their bio-digester could only produce 0,86 m3 biogas.
The ground with the idea of no change has received EUR 232,8 average from
government. Their bio-digester production is poor too, 2 m3 biogas. The group
evaluating the program as basic satisfied gets average EUR 214,9 as subsidy. Their
bio-digester production is poor too, 4,93 m3 biogas. The group that feels satisfied

54
with the program can get 5,44 m3 biogas every day. They get finance of EUR 230,5
from government.
For the total sample, interviewees get subsidy of EUR 222,9 from government and
their bio-digesters could produce 4,35 m3 biogas averagely.
5.4.2 Correlation Analysis
Now, we analysis the correlations between satisfaction degree and the subsidy, and
the satisfaction degree and the biogas produce situation. The Bivariate analysis tool
is applied here.
5.4.2.1 Correlation between Satisfaction Degree and the
Amount of Subsidy
Based on the analysis result in table 13, the 2-tailed pearson correlatiors are both -
0,028 and P-value is 0,816. It means there is not any notable correlation between the
Table 12 Group analysis
Report
.8571 2357.1437 7
.00 1500.002.00 3000.00
10.1% 10.1%2.0000 2328.571
7 7.00 1500.00
4.00 3000.0010.1% 10.1%4.9324 2148.649
37 37.00 1500.00
7.00 3000.0053.6% 53.6%5.4444 2305.556
18 183.00 1500.007.00 3000.00
26.1% 26.1%4.3551 2228.986
69 69.00 1500.00
7.00 3000.00100.0% 100.0%
MeanNMinimumMaximum% of Total NMeanNMinimumMaximum% of Total NMeanNMinimumMaximum% of Total NMeanNMinimumMaximum% of Total NMeanNMinimumMaximum% of Total N
SATISFIY.25
.50
.75
1.00
Total
BIOGAS SUBSIDY

55
satisfaction degree and the amount of subsidy. This point could also be proved by
some facts, e.g. 3 interviewees among 7 who are frustrated by the project got 100%
finance from governments for the digesters.
5.4.2.2 Correlation between Satisfaction Degree and the
Biogas Production
Based on the analysis result in table 14, the 2-tailed pearson correlatiors between the
satisfaction degree and biogas production are both 0.741 and P<0,001 in a
confidence level of 99%. It is a believable evidence to show the correlation between
them. The result also could be confirmed by the result of group analysis.
The group with an attitude of satisfaction has the biogas produce of 5,44 m3 /day
biogas which is the highest among the four groups. They get subsidy of EUR 230,5
from government without an obvious difference with other group.
Table 14 Correlation analysis 2
Satisfy degree
Biogas generation
Satisfy degree
Pearson Correlation 1 .741* Sig. (2-tailed) . .000 N 69 69
Amount of subsidy
Pearson Correlation .741* 1 Sig. (2-tailed) .000 . N 69 69
Table 13 Correlation analysis 1
Satisfy degree
Amount of subsidy
Satisfy degree
Pearson Correlation
1 -.028
Sig. (2-tailed) . .816 N 69 69
Amount of subsidy
Pearson Correlation
-.028 1
Sig. (2-tailed) .816 . N 69 69

56
6 Conclusion and Outlook
GHG Emission Reduction by BHP in 2010
According to the ”Action plan for Biogas-household program in rural area of Datong
(2006-2010)”,70.000 individual bio-digesters and about 10 large and medium scale
biogas projects will be in operation by the end of 2010. Furthermore 10,000 biomass
stoves, improved kangs24 and various types of solar technology applications will also
be financed in the rural areas with help of this program. The reason for the enlarged
scope of activities is the fact that national subsidies are allocated in combination with
provincial and local government subsidies (配套资金). Thus flexibility is guaranteed to
adopt the general policy to the specific local conditions.
The three types of new technologies supported by the BHP have achieved their
goals in the perspective of economic and ecological development. Following the
government estimates farmers in Datong are expected to save EUR 5,346 mil by the
use of biogas digesters in 2007 (Datong Municipality’s Bureau of Agriculture, 2007).
Following the calculation of this thesis the GHG emission reduction of the BHP lies in
the range of 270,000 tCO2e in 2007. This number will increase to approximately
1,041 mil tCO2e by 2010. It equals the GHG emission of 2 fossil fuel power stations
with a generation of 60 MW25. It also equals the GHG emission by the combustion of
0,525 mio t of brown coal briquettes26. It is also equivalent to the annual carbon-stock
capacity of 236 km2 of eucalyptus plantation27.
GHG Emissions Control under a Decentralized Framework
A designed GHG emission control structure should involve point and non-point
polluters. Point pollution includes highly localized and large scale GHG emission
sources e.g. thermal power stations, factories and big livestock farms. Non-point 24 A kang is a traditional heating facility in the living room of rural farm house which is used as bed in night time and as sofa in day time. 25 Till Aug. 9th, 2007, China DNA indicates that Electricity Grid Emission factor is 0,97455 tCO2/kWh. www.cdm.ccchina.gov.cn 26 The net calorie value of brown coal briquettes is 20.7 TJ/Gg; and its CO2 emission factor is 97500 kg CO2/TJ. 27 The calculation bases on the Equation 2.9, table 4.3 and 4.11 in Volume 4, chapter 2 of IPCC 2006.

57
GHG emission would include all decentralized emissions caused by human activities,
e.g. daily cooking and heating, fugitive emissions during the agricultural production
and transfer, emissions from wastewater treatment facilities and waste handling
processes, animal and human excreta, etc. Although the amount of non-point
emissions is not as high as point GHG emissions, their collection and treatment may
be more difficult and possibly (when using centralized treatment facilities) more
expensive. Decentralized pollution-control measures proved to be effective and
successful. Considerable research has been devoted to the control non-point
pollution in the field of wastewater treatment. The decentralized wastewater
management based on small units shows excellent environmental benefits (Crites &
Tchobanoglous, 1998). In the dimension of GHG emission control, the CDM
Executive Board of UNFCCC is promoting the CDM projects especially in developing
countries, which are believed to hold the biggest potential for future GHG emissions.
Cost-efficiency of Governance in the Implementation of BHP
Good governance should always seek for the cost-efficiency, which means minimum
investment to access maximum satisfaction from its voter. The role of government
subsidies should be the stimulus and guide which can lead farmers to the path of
clean-energy use. In accordance with the cost-efficiency analysis in chapter 5, the
results show that farmers take care about the biogas produce more than the amount
of subsidy. The subsidy is important to attract and motivate farmers to set biogas
digesters, but once it is over a marginal point, the farmers would not care about the
detailed amount of subsidy any more. The marginal point of proportion between
subsidy and construction cost of biogas digester should vary in different xiang or cun,
depending the economic situation. The richer xiang or cun gets fewer subsidies.
The thesis suggests that part revenue saved from subsidy could be used to develop
the service system of the BHP. Lots of interviewees expressed strong wishes to
improve the technological service and increase the biogas produce. If this result is
viewed with a boarder background it makes more senses. First, since the national
government cancelled lots of taxes and charges to release the burden of farmers and
agriculture industry, the local governments, especially the governments in the level of
xiangs and cuns, have very poor revenue. Second, although a framework of technical
support has been built, it seems to work badly. The reason is mainly that the biogas
users have not got used to pay for technical service and the revenue towards these
service stations is not enough to keep the service run regularly. Since it is difficult to
change the behaviours of the farmers and there is not enough revenue for the

58
technical service system in a short time, there is a need to decrease the subsidy to
individual biogas digester and use the saved revenue to develop the technical
service system.
A long-term evaluation towards the satisfaction and feedback from biogas users
should be inducted in the evaluation and monitoring system. Currently, there is only
quantity checking and inspection, which care about the “hard” aspects more than the
“soft” aspects.
Recommendations for the Improved PPP
Many researchers are encouraged by the tendency from public-private partnership
(PPP) to market under the Kyoto Protocol framework in the field of GHG emission
reduction, e.g. Benecks, 2008, Esty, 2002. But marketization can not solve all
problems in the process of adoption of climate change because of two reasons. First,
the Kyoto framework is not able to cover all the projects which could mitigate the
climate change and its pipeline is very narrow in global scale and is suffered heavily
from bureaucratic burdens. Secondary, lots of programs are not economically
attractive even with the finance help from CERs.
The results of the study showed that two private companies have registered to
provide bio-technology service in Datong. The local government has also considered
the possibility of CDM. However, without a good predicted return, the help from
marketization or private sectors will not come. In this situation, improved PPP is
recommended.
With the saved finance from subsidy sector, government should pay more attentions
on the technical service. First, the technical service system should be completed by
the measures of training technicians and allocating basic equipments and tools.
Secondary, some NGOs and environmental organizations in local college who are
interested in the anti-poverty or adoption of climate change issues should be
supported. Take these earth-friendly clubs in college as example, these students
have good environmental background and glad to get some working experience for
their job seeking in future. Third, a co-ordination team within the biogas users should
be set. As the results of the survey show, 29 of the interviewees get their bio-
knowledge from their friends or neighbours, which is the second important way to get
the knowledge. So the guide towards the self-help is an available option for the
improved PPP in the level of communities.

59
Technology Development
The energy flow analysis shows clearly that the energy exchange efficiency of the
BHP is low 16.32 %. The exchange efficiency of individual biogas digesters is
11.91%. Although the size effect of small biogas application is negative, it is
indubitable that the technology and quality need to develop. For these householders
who feed amount of livestock, the uniform 8 m3 biogas digester is not sufficient. They
can not afford a tailor-made biogas design service from private company, because
their feed capacities are not as big as the livestock farms. For these median-size
householders, government should provide more options, e.g. the standard 10 m3 or
bigger biogas digester.
Except householders in some demonstration villages, most have no opportunities to
get a face-to-face train. The bullet and oral teaching from friends are the main
channels to obtain the biogas knowledge, which are not sufficient during the
operation. A framework of service system of the BHP has been set in Datong, but it
does not work well. The main reasons are the finance limitation and ignorance from
governments. The saved money from the proper subsidy could fill the finance gap.
The improved evaluation system could force local government to pay more attention
on the quality, rather quantity.
Contribution to Urban Area
China is facing fast urbanization and immigration, which brings a heavy burden on
the fragile eco-system of China. It is proved that the BHP is able to reduce the life
cost and improve the life quality of the farmers. The BHP is one part of a huge
portfolio “New Rural in China”. The portfolio includes road and TV signal connection
to every cun (village), development of small hydro power stations, biogas-household
program, modern agriculture etc. The targets of the portfolio are the sustainable
development in rural, better live condition in rural area and decrease of gap between
urban and rural.
If the environment and life quality are acceptable, farmers might prefer the living in
countryside. All of these ecological and economical benefits are eligible to attract
farmers to live in rural area and mitigate the pressure of urbanization. Besides, the
saved energy by BHP would release the pressure of energy supply in China. The
BHP can also contribute to water quality of urban area, as it consumes manure which
would pollute the water body and the urban area is always in the downstream of rural
area.
60
Cognitive Enhancement “Even small improvements in general cognitive capacities can have important
positive effect” (Bostrom, 2007, p3). Respectively with the survey result, most of
interviewees (76%) know some basic ideas about the economic and ecological
benefit from the biogas use. 10% of the interviewees considered the BHP as a way to
save the money from the fuel use. In case that the price of coal or other fuels is low,
the use of biogas would not be an attractive solution.
Cognitive enhancement of the biogas-use would be a huge and comprehensive
program. Climate change will affect everyone around the world, no matter rich or
poor. An over-view perspective of mitigating climate change and reducing GHG
emission should be instilled into every social sector with the endeavour of
governments and all the social participants. Low-carbon society needs a long
process to be built, but if we do not start now, it would never come.

61
References
1) Almus Matthias, 2003: Evaluating the Impact of Public Start-up Assistance –
Results from an Econometric Approach, Centre of European Economic Research,
Mannheim, GE
2) Ballesteros, Juan Acosta and Rico, Aurelia Modrego: 2001, Public Financing of
Cooperative R&D projects in Spain; the Concerted Projects under the National
R&D Plan, Research Policy, Elsevier, UK, Vol. 30(2001), p625-641
3) Barnett, Andrew, et al, 1978: Biogas Technology in the Third World; A
Multidisciplinary Review, A Research Publication by International Development
Research Centre, Ottawa ,CA, p97-109
4) Benecks, Gudrun, et al, 2008: From Public-Private Partnership to Market: The
Clean Development Mechanism (CDM) as a New Form of Governance in
Climate Protection, The Research Center 700 in Free University, Berlin
5) Bostrom, Nick, 2007: Smart Policy: Cognitive Enhancement in the Public Interest,
Oxford University, p3, [accessed 12/11/2008], Available:
http://www.nickbostrom.com/papers/smart-policy.pdf
6) Brouns, Bernd, et al, 2007: Promoting Renewable Energy Technologies in
Developing Countries Through the Clean Development Mechanism, The Federal
Environmental Agency, Dessau,p6-7
7) Crites, Ron and Tchobanoglous, George, 1998: Small and Decentralized
Wastewater Management Systems, WCB/McGraw-Hill, p1-7
8) Datong Xian’s Bureau of Agriculture, 2007: Summary of the Experience on the
Construction of the Biogas-household Program in 2007, Datong Xian (大同县
2007 年新农村沼气建设总结), Datong, p2
9) Datong Municipality’s Bureau of Agriculture, 2007: Yearly Work Report of 2007;
Action Plan of Implementation of Biogas Use (2006-2010); Inner Materials
10) Datong Municipality’s Bureau of Statistics, 2001-2005: Yearly Report about
Economic and Social Development of Datong Municipality, [accessed
11/09/2008], Available: http://www.dt.gov.cn/dtgov/cn/jjpd/jjgb/
11) Derwent, A. Richard and Jones E. Martyn, 1996: The Corporate Governance
Handbook, Gee Publishing, London, p65

62
12) Deublein, Dieter and Steinhauser, Angelika, 2008: Biogas from Waste and
Renewable Resources, WILEY-VCH Verlag GmbH, Weinheim, p13, 30, 35
13) Ecosecurities, 2006: Project Designed Document of Biogas Support Program –
Nepal, [accessed 12/12/2008], Available: http://cdm.unfccc.int/Projects/DB/DNV-
CUK1132671435.09/view
14) Esposti, Roberto, 2002: Public Agricultural R&D Design and Technological Spill-
ins; A dynamic Model, Research Policy, Elsevier, UK, Vol. 31(2002), p693-717
15) Esty, Daniel C, 2002: Global Environmental Governance, Options &
Opportunities, New Haven, Ct, US
16) Farrell, M.: 1957, The Measurement of Productive Efficiency, Journal of the
Royal Statistical Society, Series A, 120(3): 253-290
17) Gao, Yan, et al, 2007: The Experiment of Function of Biogas Digester with Heat
Preservation in Winter at High-latitude Area: Modern Agriculture, 2007(12):35-36;
高艳,等,2007:《高寒地区整体保温沼气池越冬试验》:《现代农业》
18) Gold Standard Foundation, 2008: GS VER Methodologies, Geneva, [accessed
12/12/2008], Available: http://www.cdmgoldstandard.org/materials.php?id=102
19) Google Earth, [accessed 12/09/2008]: <a
href="http://maps.google.co.uk/maps?q=China,+Shanxi,+Datong&sll=43.8487-
6.77535&sspn=120.716,360&ie=UTF8&v=2.2&cv=4.2.0205.5730&hl=en&oi=geo
refine&ct=clnk&cd=1&geocode=FeMzYwIdfbO_Bg&output=kml&ge_fileext=.kml"
>Shanxi, Datong</a>
20) Greene, William: 2003, Distinguishing between Heterogeneity and Inefficiency;
Stochastic Frontier Analysis of the World Health Organization’s Panel Data on
National Health Care Systems, [accessed 08/01/2009], Available:
http://pages.stern.nyu.edu/~wgreene/
21) Groisman, Pavel Ya. and Easterling, David R., 1994: Precipitation Changes over
the Northern Hemispheric Extratropics during Last Hundred Years, Global
Precipitation and Climate Change (edit by Debois, Michel and Desalmand,
Francoise), Springer-Verlag, Berlin, p119-133
22) GTZ, 1981: Biogas in the People’s Republic of China; Project Report, GTZ,
Eschborn, Germany, P7
23) Held, Isaac M. and Soden, Brian J., 2000: Water Vapor Feedback and Global
Warming, Annual Review of Energy and the Environment, 25, November 2000
p441-475
24) Herrera, Santiago, Pang, Gaobo, 2005: Efficiency of Public Spending in
Developing Countries: an Efficiency Frontier Approach, [accessed 09/01/2009],
63
Available:
http://www1.worldbank.org/publicsector/pe/PEAMMarch2005/EfficiencyofPublicS
pendingin.pdf
25) Hinostroza, Miriam, et al, 2007: Potentials and Barriers for End-use Energy
Efficiency under Programmatic CDM, UNEP and UNEP Risoe Centre, Roskilde,
DK, p1
26) IEA, 2004: Renewable Energy; Market & Policy Trends in IEA Countries, OECD
Publishing, p70, [accessed 10/06/2008],
Available:http://www.iea.org/textbase/nppdf/free/2004/renewable1.pdf
27) IEA, 1991: Greenhouse Gas Emission; the Energy Dimension, OECD Publishing,
p14-20
28) Ihori, Toshihiro, 2000: Efficiency of Disaggregate Public Capital Provision in
Japan, [accessed 10/06/2008], Available: http://www.e.u-
tokyo.ac.jp/cirje/research/dp/2000/2000cf75.pdf
29) IPCC, 2008: Climate Change 2007: Synthesis Report, Washington, p30-36,
[accessed 10/06/2008], Available: http://www.ipcc.ch/pdf/assessment-
report/ar4/syr/ar4_syr.pdf
30) Kolumbus, 2007, [accessed 12/06/2008], Available:
http://www.kolumbus.fi/suomen.biokaasukeskus/en/enperus.html
31) Lapin, M., 1994: Possible Impacts of Climate Change upon the Water Balance in
Central Europe, Global Precipitation and Climate Change (edit by Debois,
Michel and Desalmand, Francoise), Springer-Verlag, Berlin, p162-170
32) Li, Kangmin and Ho, Mae-wan, 2006: Biogas China, Science in Society, 2006
(32): 34,
[accessed 10/06/2008], Available: http://www.i-sis.org.uk/full/pdf/sis32.pdf
33) Li, Jingming, 2006: Rural Biogas Development in China, p2-3, [accessed
10/06/2008], Available:
http://www.methanetomarkets.org/resources/ag/docs/china_profile.pdf
34) Local Government of Datong Xian, 2008: Statistics Year Book of Datong Xian,
2007(大同县年鉴 2007); Datong, p2-14
35) Mandl, Ulrike, et al, 2008: The Effectiveness and Efficiency of Public Spending,
EU Publishing, Brussels, p4, [accessed 09/01/2009], Available:
http://ec.europa.eu/economy_finance/publications/publication11902_en.pdf
36) Mayntz, Renate, 2004: Governance in Modern State, Governance Regieren in
komlexen Regelsystemen (edit by Benz, A.), Wiesbaden, p66

64
37) Methane to Market, 2008, [accessed 12/06/2008], Available:
http://www.methanetomarkets.org/about/methane.htm
38) McGarry, Michael and Stainforth, Jill, 1978: Compost, Fertilizer, and Biogas
Production from Human and Farm Waste in the People’s Republic of China,
International Development Research Centre, P71
39) National Development and Reform Commission,: National Action Plan Against
Climate Change of China 中国应对气候变化国家方案, Beijing, p26-28,
[accessed 7/01/2009],
Available:http://www.ccchina.gov.cn/WebSite/CCChina/UpFile/File189.pdf
40) National Development and Reform Commission: China’s Policies and Actions
for Addressing Climate Change 中国应对气候变化的政策与行动, Beijing, p26-28,
[accessed 21/01/2009],
http://bb.china-embassy.org/chn/xwdt/P020081110750388638623.pdf
41) Netherlands Environmental Assessment Agency, 2006: Global Greenhouse Gas
Emission Increased 75% since 1970, [accessed 12/06/2008], Available:
http://www.mnp.nl/en/dossiers/Climatechange/TrendGHGemissions1990-
2004.html
42) Netherlands Environmental Assessment Agency, 2008: Global CO2 Emissions:
Increase Continued in 2007, [accessed 12/06/2008], Available:
http://www.mnp.nl/en/publications/2008/GlobalCO2emissionsthrough2007.html
43) New Economic Foundation, 2007: Chinadependence – the Second UK
Interdependence Report, London, p10, [accessed 7/01/2009], Available:
http://www.neweconomics.org/gen/uploads/fmq2gmn5w2dn2qemwoor0m45051
02007192709.pdf
44) Petit-Maire, Nicole, 1994: Natural Variability of the Asian, Indian and African
Monsoons over the last 130 KA (130,000 years), Global Precipitation and
Climate Change (edit by Debois, Michel and Desalmand, Francoise), Springer-
Verlag, Berlin, p3-15
45) Rohde, Robert A., 2008, [accessed 01/06/2008], Available:
http://www.globalwarmingart.com/wiki/Image:Greenhouse_Effect_png
46) Parkinson, J. E. 1994: Corporate Power and Responsibility, Oxford University
Press, Oxford, GB, p59
47) P.R.C., Ministry of Agriculture, 1987, 2002: Architectural Codes of Hydrostatic
Biogas Digester in Rural Area《农村水压式沼气池标准图集》 (GB/T4750-2002);
Operation Regulations of Hydrostatic Biogas Digester in Rural Area 《农村家用
水压式沼气池试工操作规范》 (GB/T4752-2002); Design Codes of Pipes of

65
Biogas Digester in Rural Area《农村家用沼气管路设计规范》 (GB/T7636-87);
Operation Regulations of Pipes Construction of Biogas Digester in Rural Area
《农村家用沼气管路施工安装操作规程》 (GB/T7637-87)
48) P.R.C., Ministry of Agriculture, 1999: Framework of the National Fund for the
Implementation of Biogas-household Program 《农村沼气建设项目国债管理办法
(试行)》,p8, [accessed 04/06/2008], Available:
http://www.jincao.com/fa/law25.31.htm#04
49) P.R.C., Ministry of Agriculture, 2006: National Action Plan for Biogas-household
Program in Rural Area (2006-2010) 《全国农村沼气工程建设规划》, Beijing,
p8,10,30,36, [accessed 04/06/2008], Available:
http://www.agri.gov.cn/xztz/P020070418570346665578.doc
50) Risse, Thomas and Lehmkuhl, Ursula, 2006: Governance in Areas of Limited
Statehood – New Modes of Governance? The Research Centre 700 in Free
University, Berlin, p7
51) Shanxi’s Department of Agriculture, 2004: Shanxi Provence’s Regulations about
the Acceptance of BHP Activities《山西省沼气项目验收办法(试行)》, p1-4,
[accessed 30/01/2009],
Available:http://ehome.gov.cn/Article/UploadFiles/20046985717188.doc
52) Sino Maps Press(中国地图出版社), 2000: Atlas of China, Beijing
53) Solomon, Jill, 2007: Corporate Governance and Accountability (second edition),
John Wiley & Sons, Chichester, Great Britain, p14-15
54) Su, Fubing and Yang, Dali, 2005: Elections, Governance and Accountability in
Rural China, Asian Perspective, Seoul, Vol.29, No.4, p125-157
55) UNESA, 2008: World Urbanization Prospects: The 2007 Revision Population
Database, [accessed 30/01/2009], Available:
http://esa.un.org/unup/index.asp?panel=1
56) UNFCCC, 2008: Glossary of CDM terms, p10, [accessed 21/01/2009], Available:
http://cdm.unfccc.int/Reference/Guidclarif/glos_CDM_v04.pdf
57) Van Buren, Ariane, 1976 (reprint in 1998): A Chinese Biogas Manual:
Popularizing Technology in the Countryside, Practical Action Publishing, Rugby,
GB, p16
58) Weston, J. Fred, et al, 2004: Takeovers, Restructuring, and Corporate
Governance (fourth edition), Pearson education, New Jersey, US, p583
59) WWF China, 2007, [accessed 25/06/2008], Available:
http://www.wwfchina.org/english/loca.php?loca=496
66
60) Wikipedia, 2008, [accessed 07/01/2009], Available:
http://de.wikipedia.org/wiki/Datong; http://en.wikipedia.org/wiki/Datong
61) Wikipedia, 2008, [accessed 12/07/2008], Available:
http://en.wikipedia.org/wiki/Biogas
62) Wu, Fulong, 2002: China’s Changing Urban Governance in the Transition
towards a more Market-oriented Economy, Urban studies, Routledge, Vol.39,
No.7, p1071-1093
63) Zhou, Junhu, et al., 2007: The Impacts on the Methane-forming Process of
Biogas Production Caused by Different Sources of Sludge, Journal of Zhejiang
University: 41 (5) 761-764
周俊虎, 等 , 2007: 不同污泥来源对稻草发酵产氢影响的研究: 浙江大学学报
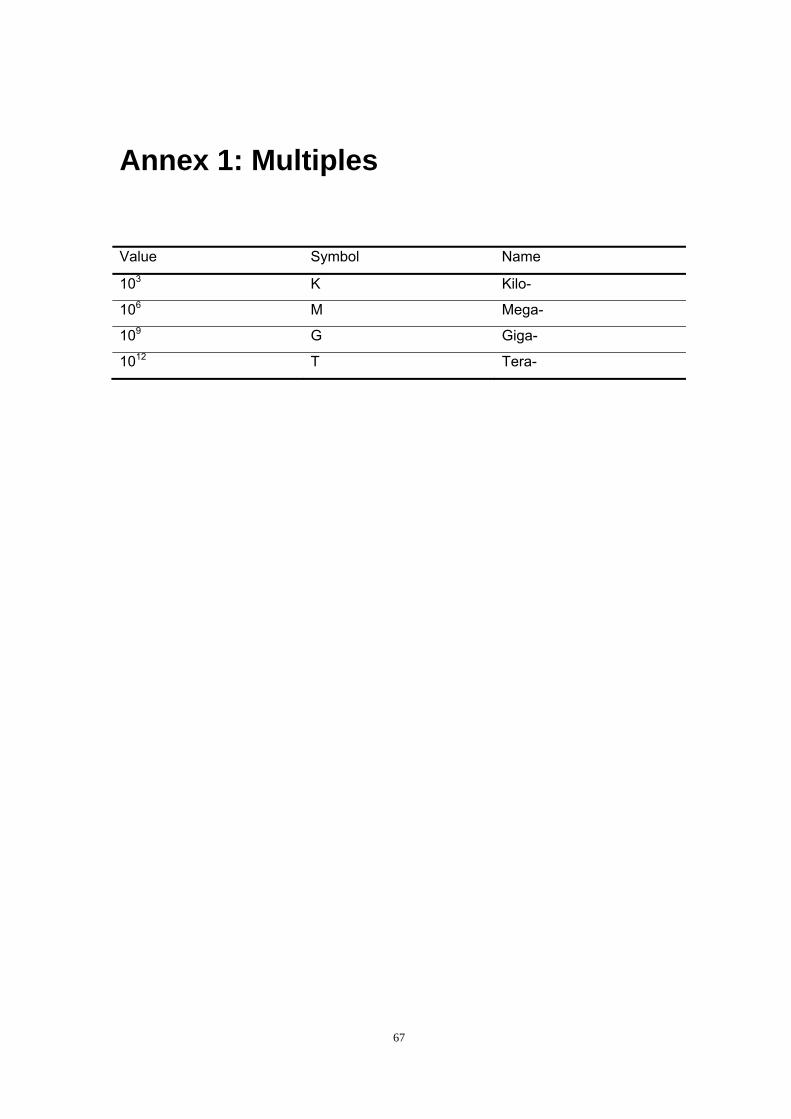
67
Annex 1: Multiples
Value Symbol Name
103 K Kilo-
106 M Mega-
109 G Giga-
1012 T Tera-

68
Annex 2: Calculation Sheet
National Biogas-household Program in China (Datong)
Category 1 For individual household
Source: GHG recovery in agricultural activities ties at household/small farm level
Parameter Unit Value Description Calculation Reference
Baseline
Emission BECH4 TCO2e 0 Baseline emission GWP*∑EFT*NT/103
2006 IPCC volume 4 chapter 10 P10.37
Equation10.22
GWPCH4 21 Global warming potential for CH4
EFT kg CO2/head/year 9 emission factor for Cow, 2006 IPCC volume 4 chapter 10 table 10.14, table
10.15
NT head 0 the number of head of Cow
EFT kg CO2/head/year 1 emission factor for Horse,
NT head 0 the number of head of Horse
EFT kg CO2/head/year 2 emission factor for Swine,
NT head 0 the number of head of Swine
EFT kg CO2/head/year 0.1 emission factor for Sheep,

69
NT head 0 the number of head of Sheep
EFT kg CO2/head/year 0.01 emission factor for Poultry,
NT head 0 the number of head of Poultry The average life time of Poultry is 9 month.
Farmer feed poultry in the circle of one year once.
Program
emission PE TCO2e 0 Project emission PEleakage+PE power,y
PEleakage TCO2e 0Project emission from physical
leakages
LFAD * [GWPCH4* DCH4
* Bo * VSm,y ]/1000
ASM III R: Methane recovery in agricultural
acitvities at household/small farm level: Project
Emission
GWPCH4 21 Global warming potential for CH4
DCH4 0.67Conversion factor of m3 CH4 to
kilogram CH4(CH4 density)
table 10A-8 of 2006 IPCC Guidelines for National
Greenhouse Gas
Inventories, Volume 4, and Chapter 10.
Bo m3 CH4 per kg of
dm by Cow 0.13
Maximum methane producing
potential of the manure type
treated in the biogas digesters
table 10A4-9 of 2006 IPCC Guidelines for National
Greenhouse Gas
Inventories, Volume 4, and Chapter 11.
VS kg of dm per year 0
Annual amount of volatile solids
treated in the biogas digesters on
dry matterweight basis
Bo m3 CH4 per kg of
dm by Horse 0.1
Maximum methane producing
potential of the manure type
treated in the biogas digesters
VS kg of dm per year 0
Annual amount of volatile solids
treated in the biogas digesters on
dry matter weight basis

70
Bo m3 CH4 per kg of
dm by Swine 0.29
Maximum methane producing
potential of the manure type
treated in the biogas digesters
VS kg of dm per year 0
Annual amount of volatile solids
treated in the biogas digesters on
dry matter weight basis
Bo m3 CH4 per kg of
dm by Sheep 0.13
Maximum methane producing
potential of the manure type
treated in the biogas digesters
table 10A-9 of 2006 IPCC Guidelines for National
Greenhouse Gas
Inventories, Volume 4, and Chapter 10.
VS kg of dm per year 0
Annual amount of volatile solids
treated in the biogas digesters on
dry matter weight basis
Bo m3 CH4 per kg of
dm by Poultry 0.36
Maximum methane producing
potential of the manure type
treated in the biogas digesters
VS kg of dm per year 0
Annual amount of volatile solids
treated in the biogas digesters on
dry matter weight basis
LFAD 0fraction of Leakage emission from
anarobic digesters
PE power,y TCO2e 0
Emission from the use of fossil
fuel or electricity for the operation
of the installed facilities
Emission
Reduction ER TCO2e 0
GHG emission reduction caused
by this source BE-PE

71
National Biogas-household Program in China ( Datong)
Category 1 For individual household
Source: Landfill GHG recovery
Parameter Unit Value Description Calculation Reference
Baseline
Emission BE tCO2 0 Baseline emission
*(1-f)GWPCH4*(1-
OX)*16/12*F*DOCf*M
CF*∑Wj,x*DOCj*e-kj*(y-
x)*(1-e-kj)
Methodological Tools for SSC: Tool to determine
methane emissions avoided from dumping waste
at a solid waste disposal site
j 0.9Model correction factor to account
for model uncertainties
f 0%
Fraction of methane captured at
the SWDS and flared, combusted
or used in another manner
GWPCH4 21Global warming potential of
methane
OX 0
Oxidation factor (reflecting the
amount of methane from SWDS
that is oxidized in the soil or other
material covering the waste)
unmanaged waste disposal point: 0
F 0.5Fraction of methane in the SWDS
gas
DOCf 0.5Fraction of degradable organic
carbon that can decompose
MCF 0.4 Methane correction factor Un-management-shallow waste disposal point

72
Wj,x Tons 0
Amount of organic waste type j
prevented from disposal in the
SWDS in the year x
DOCj 0.15
Fraction of degradable organic
carbon(by weight) in the waste
type j
temp<20.C MAP/PET<1
Kj 0.06 Decay rate for the waste type j
x 20
Year during the crediting period: X
runs from the first year of the first
crediting period(x=1) to the year y
for which avoided emissions are
calculated (x=y)
y 1year for which methane emissions
are calculated
Program
Emission PE 0 Program emission PE power,y
PE power,y 0
Emission from the use of fossil
fuel or electricity for the operation
of the installed facilities
o in rural area
Emission Reduction 0GHG emission reduction caused
by this source BE-PE
National Biogas-household Program in China ( Datong)
Category 1 For individual household
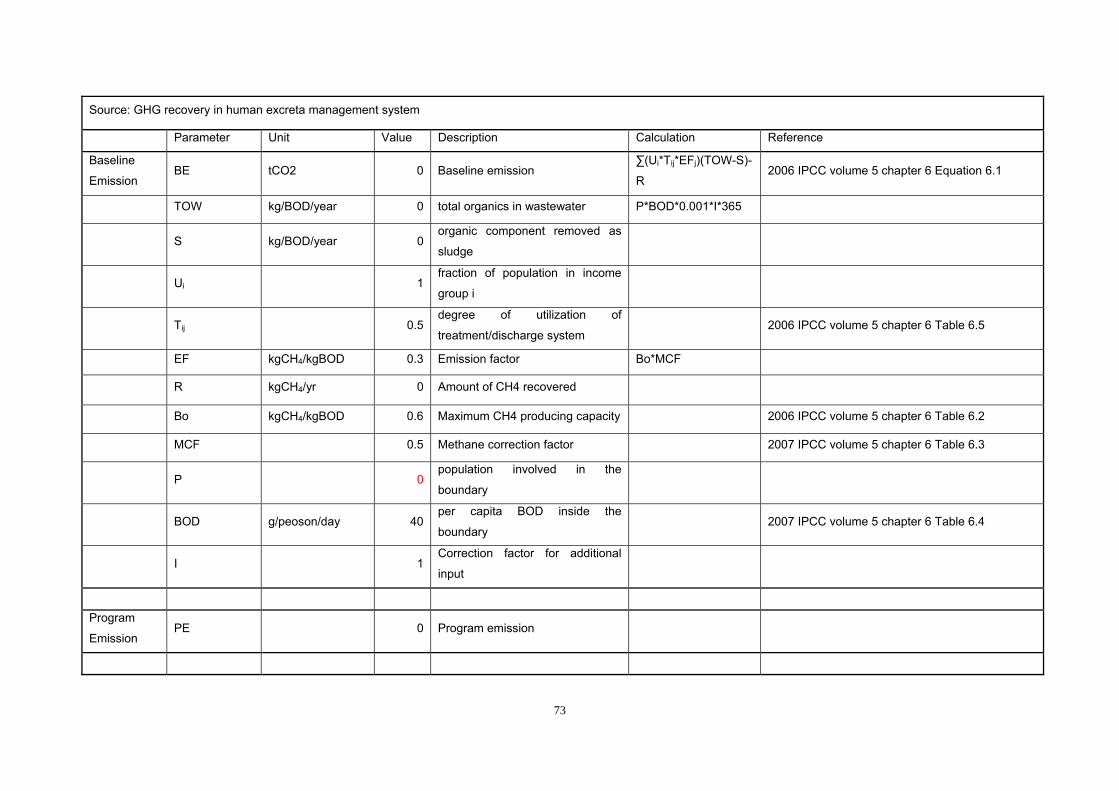
73
Source: GHG recovery in human excreta management system
Parameter Unit Value Description Calculation Reference
Baseline
Emission BE tCO2 0 Baseline emission
∑(Ui*Tij*EFj)(TOW-S)-
R 2006 IPCC volume 5 chapter 6 Equation 6.1
TOW kg/BOD/year 0 total organics in wastewater P*BOD*0.001*I*365
S kg/BOD/year 0organic component removed as
sludge
Ui 1fraction of population in income
group i
Tij 0.5degree of utilization of
treatment/discharge system 2006 IPCC volume 5 chapter 6 Table 6.5
EF kgCH4/kgBOD 0.3 Emission factor Bo*MCF
R kgCH4/yr 0 Amount of CH4 recovered
Bo kgCH4/kgBOD 0.6 Maximum CH4 producing capacity 2006 IPCC volume 5 chapter 6 Table 6.2
MCF 0.5 Methane correction factor 2007 IPCC volume 5 chapter 6 Table 6.3
P 0population involved in the
boundary
BOD g/peoson/day 40per capita BOD inside the
boundary 2007 IPCC volume 5 chapter 6 Table 6.4
I 1Correction factor for additional
input
Program
Emission PE 0 Program emission

74
Emission
Reduction 0
GHG emission reduction caused
by this source BE-PE
National Biogas-household Program in China ( Datong)
Category 1 For individual household
Source: Thermal energy for the user with or without electricity
Parameter Unit Value Description Calculation Reference
Baseline
Emission BE tCO2 0 Baseline emission BEfuel+BEelec.
The category comprises Biogas that supplies
individual households or users with the renewable
energy to replace fossil fuels.
(CDM SSC TYPE Ⅰ C)
BEelec. tCO2 0Emission from the electricity
consume Q*EF/1000
Q KWh 0 Quantity of electricity consume
EF kgCO2/KWh 0.79734 Emission factor of electricity Chinese DNA's Guideline of Emission Factor of
Chinese Electricity Grid
BEfuel tCO2 0
Emission from the fuel consume,
biomass, coal, LPG(liquefied
petroleum gas)…
∑Qfuel,i*EFi/Ei
Qfuel,coal kg 0 Quantity of fuel type i consume
EF kg CO2/kJ 94.6 Emission factor of coal IPCC 2006 Volume 2 P1.23 Table1.4
F kJ/kg 0.0282 Energy content of coal IPCC 2006 Volume 2 P1.18 Table1.2
Ecoal stove 0.3Efficiency of the plant using fuel
coal

75
Qfuel,LPG kg 0Quantity of fuel type LPG
consume
EF kg CO2/kJ 63.1 Emission factor of fuel:LPG IPCC 2006 Volume 2 P1.23 Table1.4
F kJ/kg 0.0473 Energy content of LPG IPCC 2006 Volume 2 P1.18 Table1.2
ELPG stove 0.9Efficiency of the plant using fuel
LPG
Qfuel,wood kg 0 Quantity of fuel wood consume
EF kg CO2/kJ 112 Emission factor of fuel: wood IPCC 2006 Volume 2 P1.23 Table1.4
F kJ/kg 0.0156 Energy content of coal IPCC 2006 Volume 2 P1.18 Table1.2
Ewood stove 0.3Efficiency of the plant using fuel:
wood
Program
Emission PE 0 Program emission
Emission Reduction 0GHG emission reduction caused
by this source BE-PE
National Biogas-household Program in China ( Datong)
Category 1 For individual household
Source: Non-CO2 GHG emission from biomass burning
Parameter Unit Value Description Calculation Reference
Baseline
Emission BECH4 tCO2 0 Baseline emission of CH4
GWPCO*A•MB •Cf
•Gef •10−3
CH4 emission from the biomass burning at the
crop-land

76
(Volume 4, 5.2.4 & Equation 2.27, IPCC Inventory)
CH4 MB T/ha 0mass of fuel available for
combustion
(wheat residues 4.0; Maize residues 10.0; rice
residues 5.5; sugarcane 6.5 chapter 2 Table 2.4)
GWPCH4 21 Global warming potential for N2O
A ha area burnt
Cf 0.9 combustion factor
Gef G/kg dry matter
burnt 2.7 emission factor
Program
Emission PE 0 Program emission
Emission Reduction 0GHG emission reduction caused
by this source BE-PE
National Biogas-household Program in China ( Datong)
Category 2 For large scale biogas digester
Source: Methane recovery in animal manure management system
Parameter Unit Value Description Calculation Reference
Baseline
Emission BECH4 tCO2 0 Baseline emission of CH4
GWPCH4
*DCH4*UFb*∑MCFj *
B0,LT*NLT,y* VSLT,y*
MS%Bl,j
ASM III D: Methane recovery in animal manure
management systems

77
GWPCH4 21 Global warming potential
DCH4 t/m3 0.00067 CH4 density
MCFj 0.66
Annual CH4 conversion factor for
the baseline animal waste
management system
2006 IPCC volume 4 chapter 10 table 10.17
B0,LT 0.13Maximum CH4 producing
potential of VS generated for Cow
NLT,y 0Annual average number of animal
of Dairy Cow
VSLT,y
a dry matter
weight basis, kg
dm/animal/year
102.2
Volatile solid for Dairy Cow
entering the animal manure
management system
B0,LT 0.29
Maximum CH4 producing
potential of VS generated for
Swine
NLT,y 0Annual average number of Market
Swine Life time is 4.5 month.
VSLT,y
a dry matter
weight basis, kg
dm/animal/year
109.5
Volatile solid for Swine entering
the animal manure management
system in year “y”
MS%Bl,j 100%
Fraction of manure handle in
baseline animal manure
management system
UFb 0.94model correction factor to account
for model uncertainties
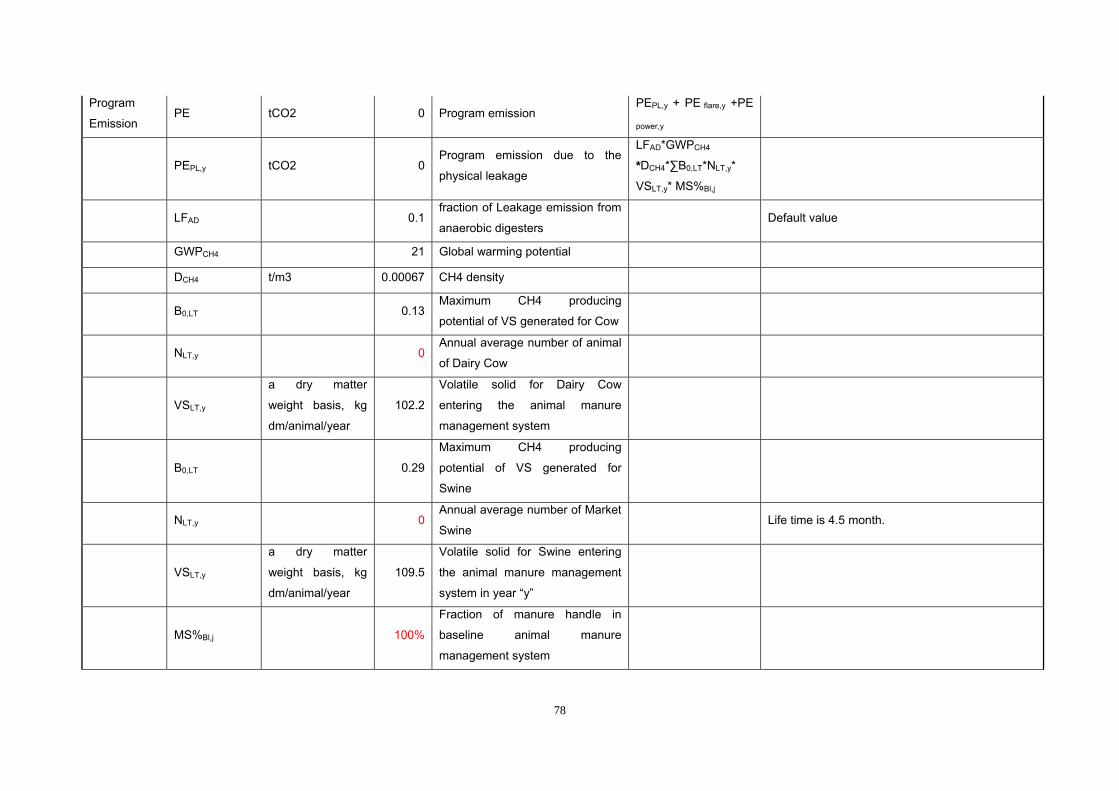
78
Program
Emission PE tCO2 0 Program emission
PEPL,y + PE flare,y +PE
power,y
PEPL,y tCO2 0Program emission due to the
physical leakage
LFAD*GWPCH4
*DCH4*∑B0,LT*NLT,y*
VSLT,y* MS%Bl,j
LFAD 0.1fraction of Leakage emission from
anaerobic digesters Default value
GWPCH4 21 Global warming potential
DCH4 t/m3 0.00067 CH4 density
B0,LT 0.13Maximum CH4 producing
potential of VS generated for Cow
NLT,y 0Annual average number of animal
of Dairy Cow
VSLT,y
a dry matter
weight basis, kg
dm/animal/year
102.2
Volatile solid for Dairy Cow
entering the animal manure
management system
B0,LT 0.29
Maximum CH4 producing
potential of VS generated for
Swine
NLT,y 0Annual average number of Market
Swine Life time is 4.5 month.
VSLT,y
a dry matter
weight basis, kg
dm/animal/year
109.5
Volatile solid for Swine entering
the animal manure management
system in year “y”
MS%Bl,j 100%
Fraction of manure handle in
baseline animal manure
management system

79
PE flare,y tCO2 0emission from flaring or
combustion of the biogas stream
PE power,y tCO2 0
emission from the use of fossil
fuel or electricity for the operation
of the installed facilities
Q KMh
CEFgrid kg CO2e/ kWh 2emission coefficient for electricity
consume
Emission Reduction 0GHG emission reduction caused
by this source BE-PE
National Biogas-household Program in China ( Datong)
Category 2 For large scale biogas digester
Source: Grid connected renewable electricity generation
Parameter Unit Value Description Calculation Reference
Baseline
Emission BEbaseline tCO2 0
GHG emission caused by elec.
production that is replaced by
Clean elec.
EPbio * CEFgrid
This category comprises biogas working as
renewable energy generation that supplies
electricity to replace the use of fossil fuel fired
generation unit.(CDM SSC TYPE Ⅰ D)
EPbio MWh 0
Electricity produced by the biogas
generator unit for grid electricity
replacement
CEFgrid kg CO2e/ kWh 0.79734emission coefficient for electricity
grid
KEYanggao kWh 0 Electricity generating capacity of
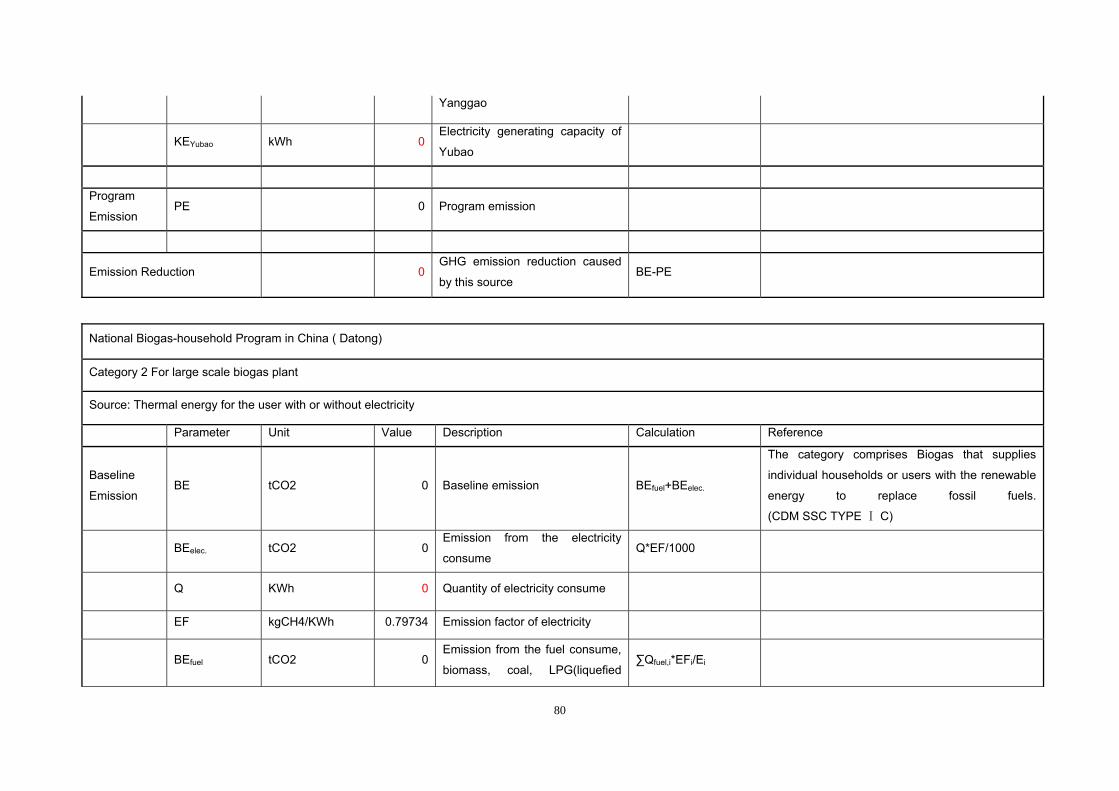
80
Yanggao
KEYubao kWh 0Electricity generating capacity of
Yubao
Program
Emission PE 0 Program emission
Emission Reduction 0GHG emission reduction caused
by this source BE-PE
National Biogas-household Program in China ( Datong)
Category 2 For large scale biogas plant
Source: Thermal energy for the user with or without electricity
Parameter Unit Value Description Calculation Reference
Baseline
Emission BE tCO2 0 Baseline emission BEfuel+BEelec.
The category comprises Biogas that supplies
individual households or users with the renewable
energy to replace fossil fuels.
(CDM SSC TYPE Ⅰ C)
BEelec. tCO2 0Emission from the electricity
consume Q*EF/1000
Q KWh 0 Quantity of electricity consume
EF kgCH4/KWh 0.79734 Emission factor of electricity
BEfuel tCO2 0Emission from the fuel consume,
biomass, coal, LPG(liquefied ∑Qfuel,i*EFi/Ei

81
petroleum gas)…
Qfuel,i kg 0 Quantity of fuel type i consume
EF kgCH4/kg 1 Emission factor of fuel type i
Ei 0.3 Efficiency of the plant using fuel i
Program
Emission PE 0 Program emission
Emission Reduction 0GHG emission reduction caused
by this source
National Biogas-household Program in China ( Datong)
Category 3 For Improved biomass stove
Source: Switch from Non-renewable fuel for thermal application by the user
Parameter Unit Value Description Calculation Reference
NCVbrown coal
riquettes TJ/Gg 20.7
Net calorific value of brown coal
briquettes that is substituted 2006 IPCC volume 2 table 1.2
EFbrown coal
briquettes kg CO2/TJ 97500
Effective CO2 emission factor of
brown coal briquettes 2006 IPCC volume 2 chapter 2 table 1.4
N 0 Number of stove
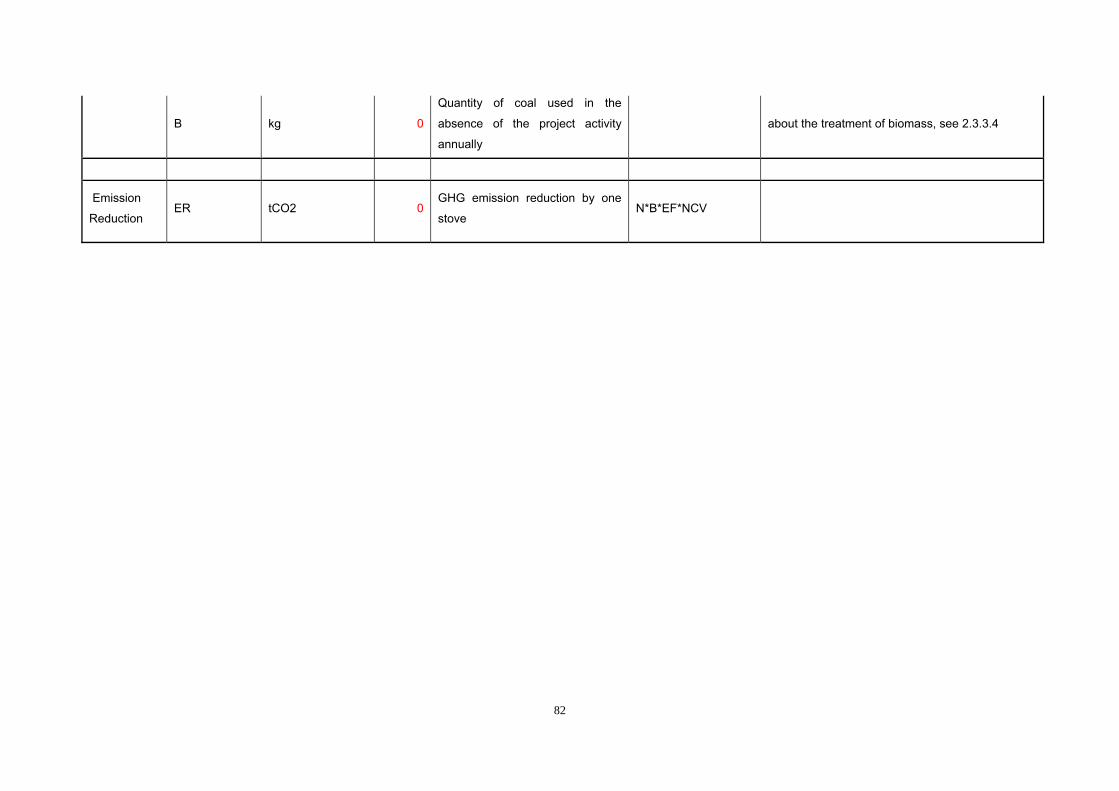
82
B kg 0
Quantity of coal used in the
absence of the project activity
annually
about the treatment of biomass, see 2.3.3.4
Emission
Reduction ER tCO2 0
GHG emission reduction by one
stove N*B*EF*NCV

83
Annex 3: Questionnaire
1. Basic information
Region: Sex:
Family member: The capacity of his/her biogas digester: m3/d
Since when, you start to use biogas:
2. Data collection
2.1 What are the energy sources in the absence of Biogas-household program?
How much would they consume?
A. Coal B. Wood fuel C. LPG(Liquefied Petroleum Gas)
D. Electricity E. Others _________________
The amount of these energy consume: __________________
2.2 Livestock types and numbers
A. Chickens B. Swine C. Cows
D. Sheep E. Others _________________
The numbers of these livestock: ____________
The days that livestock could live: ___________
2.3 The amount of waste (food waste, garden waste, et al) that would be
used in the biogas digester?
____________________________
2.4 The amount of biomass used in the biogas digester, which would be
combusted after the harvest in the absence of Biogas-household program.
____________________________
3. Attitudes
3.1 How would you evaluate the Biogas-household program?
A. satisfied B. basically satisfied C. No change to my life
D. Very Bad if choose D, the reason is _________________
3.2 How much do you know the Biogas-household program in China?
A. I don’t know at all. B. Just a little.
C. I know a lot. if choose C, how did you get to know it ________
3.3 In which forms would the subsidy from government arrives your hand?
A. Cash B. Construction material C. Technological support

84
D. Others _________
3.4 Is the subsidy important?
A. Yes, very important. B. Just better than none. C. Not important.
If you have something to supplement? ________
3.5 How do you get finance for the rest part of the cost of biogas plant?
A. Money saved by myself B. Loan from bank
C. Borrow money from other people with interest
D. Borrow money from other people without interest E. Others ________
3.7 During the implementation of Biogas-household program, where did you
obtain knowledge and technology referred to biogas and operation?
A. From the bullet and train organized by government
B. From books and media C. From other people
D. I have no knowledge about them.
3.8 What kind of role does the government play in Biogas-household program?
A. Very important B. Important, but less than what I expect.
C. I don’t think the government makes any sense in this program.
Tell me, in your opinion, where should be improved in the implementation of
Biogas-household program?
3.9 Since next 5 years, the national and local government would pay lots of money
and energy on Biogas-household program, What is your perspective for this
program?

85
Annex 4: Information of Interviewees
Li, Xiulong 李秀龙 Male 倍加造镇解庄村 Beijiazao Xiang Xiezhuang Cun Oct,2007
Lv, Jin 吕进 Male 杜庄乡落镇营村 Duzhuang Xiang Luozhenying Cun Oct,2007
Ding, Zhuang 丁壮 Male 巨乐乡塔儿村 Jule Xiang Ta'er Cun Oct,2007
Ding, Chun 丁春 Male 巨乐乡塔儿村 Jule Xiang Ta'er Cun Oct,2007
Liu, Chengrui 刘成瑞 Male 巨乐乡下羊落村 Jule Xiang Xiayangluo Cun Oct,2007 Wang, Shouguan 王守官 Male 西坪镇官堡村 Xipin Xiang Guanbu Cun Oct,2007
Yang, Zuo 杨作 Male 西坪镇上高庄村 Xipin Xiang Shanggaozhuang Cun Oct,2007
Xu, Hong 徐红 Male 西坪镇水头村 Xipin Xiang Shuitou Cun Nov,2007
Ge, Ming 葛明 Male 西坪镇寺上村 Xipin Xiang Sishang Cun Oct,2007
Yang, Gen 杨根 Male 西坪镇唐家堡村 Xipin Xiang Tangjiabu Cun Nov,2007
Gou, Gang 苟刚 Male 西坪镇坨坊村 Xipin Xiang Tuofang Cun Oct,2007
Liu, Yong 刘永 Male 西坪镇西坪村 Xipin Xiang Xipin Cun Oct,2007
Wei, Quan 魏全 Male 许堡乡集仁村 Xubao Xiang Jiren Cun Nov,2007 Song, Zhiyuan 宋志元 Male 许堡乡肖家窑头村 Xubao Xiang Xiaojiaoyaotou Cun Nov, 2007
Du, Tianli 杜天礼 Male 许堡乡许堡村 Xubao Xiang Xubao Cun Nov, 2007
Liu, Runchai 刘润才 Male 许堡乡养老洼村 Xubao Xiang Yanglaowa Cun Nov,2007
Bai, Fucai 白福才 Male 周士庄镇后铺村 Zhoushizhuang Xiang Houpu Cun Oct,2007
Yang, Cuntian 杨存田 Male 周士庄镇后铺村 Zhoushizhuang
Xiang Houpu Cun Oct,2007
Wang,Yufu 王玉福 Male 周士庄镇后铺村 Zhoushizhuang Xiang Houpu Cun Sep,2006
Wu, Cheng 武成 Male 周士庄镇架遇造村Zhoushizhuang Xiang Jiayuzao Cun Oct,2007
Zhou, Shengcai 周生才 Male 周士庄镇驾遇造村
Zhoushizhuang Xiang Jiayuzao Cun Sep, 2007
Dang, Wen 党文 Male 周士庄镇孟家宅村Zhoushizhuang Xiang Mengjiazhai Cun Oct,2007
Zhao, Hai 赵海 Male 周士庄镇上庄村 Zhoushizhuang Xiang Shangzhuang Cun Nov,2007
Feng, Yong 冯勇 Male 周士庄镇西羊坊村Zhoushizhuang Xiang Xiyangfang Cun Nov,2007
Li, Jiang 李江 Male 巨乐乡吴家洼村 Jule Xiang Wujiawa Cun Oct,2007
Guo, Ailian 郭爱莲 Female
倍加造镇郭家窑头
村 Beijiazao Xiang Guojiayaotou Cun Jun, 2007
Wang, Ji 王继 Male 倍加造镇郭家窑头
村 Beijiazao Xiang Guojiayaotou Cun Jun, 2007
Yang, Jie 杨杰 Male 倍加造镇郭家窑头
村 Beijiazao Xiang Guojiayaotou Cun July, 2007
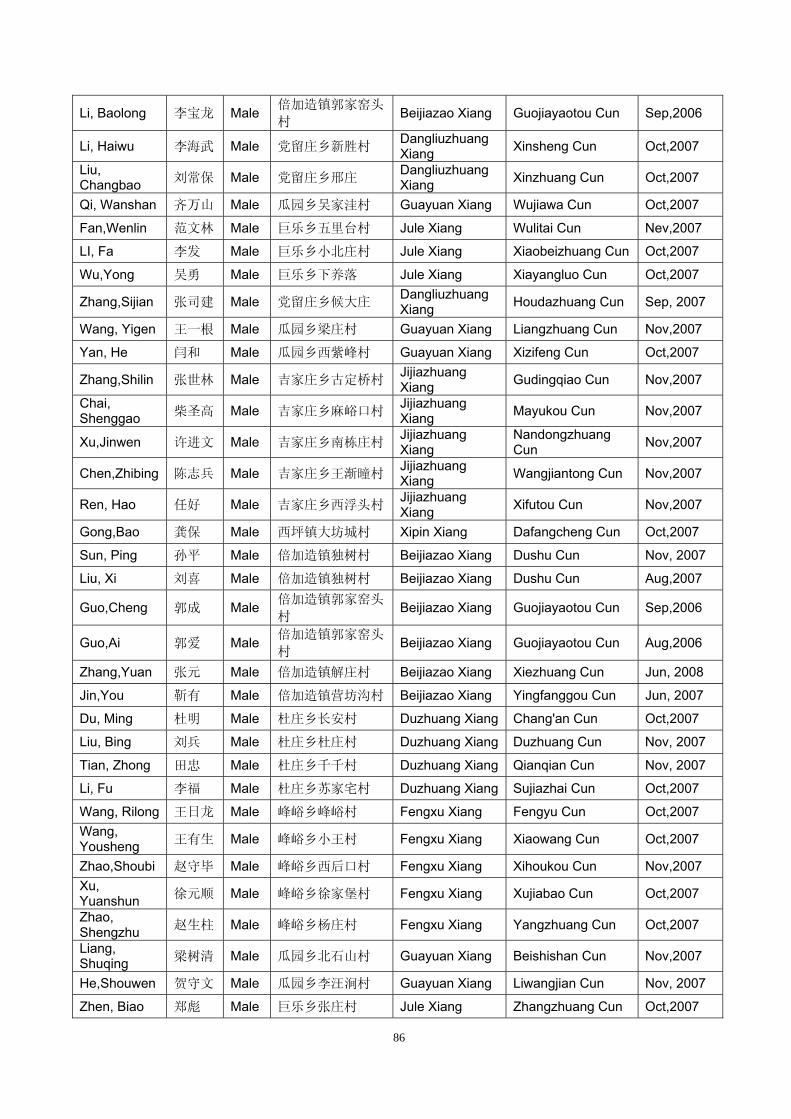
86
Li, Baolong 李宝龙 Male 倍加造镇郭家窑头
村 Beijiazao Xiang Guojiayaotou Cun Sep,2006
Li, Haiwu 李海武 Male 党留庄乡新胜村 Dangliuzhuang Xiang Xinsheng Cun Oct,2007
Liu, Changbao 刘常保 Male 党留庄乡邢庄 Dangliuzhuang
Xiang Xinzhuang Cun Oct,2007
Qi, Wanshan 齐万山 Male 瓜园乡吴家洼村 Guayuan Xiang Wujiawa Cun Oct,2007
Fan,Wenlin 范文林 Male 巨乐乡五里台村 Jule Xiang Wulitai Cun Nev,2007
LI, Fa 李发 Male 巨乐乡小北庄村 Jule Xiang Xiaobeizhuang Cun Oct,2007
Wu,Yong 吴勇 Male 巨乐乡下养落 Jule Xiang Xiayangluo Cun Oct,2007
Zhang,Sijian 张司建 Male 党留庄乡候大庄 Dangliuzhuang Xiang Houdazhuang Cun Sep, 2007
Wang, Yigen 王一根 Male 瓜园乡梁庄村 Guayuan Xiang Liangzhuang Cun Nov,2007
Yan, He 闫和 Male 瓜园乡西紫峰村 Guayuan Xiang Xizifeng Cun Oct,2007
Zhang,Shilin 张世林 Male 吉家庄乡古定桥村Jijiazhuang Xiang Gudingqiao Cun Nov,2007
Chai, Shenggao 柴圣高 Male 吉家庄乡麻峪口村
Jijiazhuang Xiang Mayukou Cun Nov,2007
Xu,Jinwen 许进文 Male 吉家庄乡南栋庄村Jijiazhuang Xiang
Nandongzhuang Cun Nov,2007
Chen,Zhibing 陈志兵 Male 吉家庄乡王渐曈村Jijiazhuang Xiang Wangjiantong Cun Nov,2007
Ren, Hao 任好 Male 吉家庄乡西浮头村Jijiazhuang Xiang Xifutou Cun Nov,2007
Gong,Bao 龚保 Male 西坪镇大坊城村 Xipin Xiang Dafangcheng Cun Oct,2007
Sun, Ping 孙平 Male 倍加造镇独树村 Beijiazao Xiang Dushu Cun Nov, 2007
Liu, Xi 刘喜 Male 倍加造镇独树村 Beijiazao Xiang Dushu Cun Aug,2007
Guo,Cheng 郭成 Male 倍加造镇郭家窑头
村 Beijiazao Xiang Guojiayaotou Cun Sep,2006
Guo,Ai 郭爱 Male 倍加造镇郭家窑头
村 Beijiazao Xiang Guojiayaotou Cun Aug,2006
Zhang,Yuan 张元 Male 倍加造镇解庄村 Beijiazao Xiang Xiezhuang Cun Jun, 2008
Jin,You 靳有 Male 倍加造镇营坊沟村 Beijiazao Xiang Yingfanggou Cun Jun, 2007
Du, Ming 杜明 Male 杜庄乡长安村 Duzhuang Xiang Chang'an Cun Oct,2007
Liu, Bing 刘兵 Male 杜庄乡杜庄村 Duzhuang Xiang Duzhuang Cun Nov, 2007
Tian, Zhong 田忠 Male 杜庄乡千千村 Duzhuang Xiang Qianqian Cun Nov, 2007
Li, Fu 李福 Male 杜庄乡苏家宅村 Duzhuang Xiang Sujiazhai Cun Oct,2007
Wang, Rilong 王日龙 Male 峰峪乡峰峪村 Fengxu Xiang Fengyu Cun Oct,2007 Wang, Yousheng 王有生 Male 峰峪乡小王村 Fengxu Xiang Xiaowang Cun Oct,2007
Zhao,Shoubi 赵守毕 Male 峰峪乡西后口村 Fengxu Xiang Xihoukou Cun Nov,2007 Xu, Yuanshun 徐元顺 Male 峰峪乡徐家堡村 Fengxu Xiang Xujiabao Cun Oct,2007
Zhao, Shengzhu 赵生柱 Male 峰峪乡杨庄村 Fengxu Xiang Yangzhuang Cun Oct,2007
Liang, Shuqing 梁树清 Male 瓜园乡北石山村 Guayuan Xiang Beishishan Cun Nov,2007
He,Shouwen 贺守文 Male 瓜园乡李汪涧村 Guayuan Xiang Liwangjian Cun Nov, 2007
Zhen, Biao 郑彪 Male 巨乐乡张庄村 Jule Xiang Zhangzhuang Cun Oct,2007

87
Du,Wen 杜文 Male 巨乐乡张庄村 Jule Xiang Zhangzhuang Cun Oct,2007
Zhang,Pin 张平 Male 西坪镇康店村 Xipin Xiang Kangdian Cun Sep,2007 Chen, Shanlin 陈善林 Male 西坪镇康秀村 Xipin Xiang Kangxiu Cun Oct,2007
Chai, Shougong 柴守攻 Male 许堡乡清泉村 Xubao Xiang Qinquan Cun Nov,2007
Guo,Yucai 郭玉才 Male 周士庄镇三府村 Zhoushizhuang Xiang Sanfufen Cun Jun,2007
Zhang,Shenglong 张生龙 Male 周士庄镇周士庄村
Zhoushizhuang Xiang
Zhoushizhuang Cun Sep,2006

88
Annex 5: Schedule of the thesis
Time
Steps
Apr.
2008
May
2008
June
2008
July
2008
Aug.
2008
Sep.
2008
Oct.
2008
Nov.
2008
Doc.
2008
Jan.
2009
Fe.
2009
Subject searching
Background info. collection
Introduction
Methodology
Survey design
Survey implementation
Calculation and Analysis
Conclusion
Review of first version
Review of second version
Review of third version
Final version

89
List of Charts
Chart 1 Heat flow on the world surface ......................................................................... 6
Chart 2 Global emissions of GHG .................................................................................. 9
Chart 3 Three steps of biogas production ................................................................... 11
Chart 4 Basic Form of Biogas Digester ....................................................................... 12
Chart 5 Models of Biogas-household program in China ........................................... 16
Chart 6 Percentage of urban population in World-wide and China (1950-2050) .. 18
Chart 7 Datong Municipality .......................................................................................... 20
Chart 8 Datong: Rural households using Biogas Digesters ..................................... 21
Chart 9 Datong: Financial Sources for Digester* (Unit: EUR) ................................. 24
Chart 10 Datong Xian: 11 Xiang’s GDP, 2007(Mil EUR) .......................................... 26
Chart 11 Datong Xian: Net income of Farmers in 2007, by Xiang (EUR) ............. 27
Chart 12 Datong Xian: Distribution of biogas users in Xiangs in 2007 ................... 28
Chart 13 The position of BHP within the general Carbon flow ................................ 32
Chart 14 Data collection procedure ............................................................................. 36
Chart 15 Energy flow map ............................................................................................. 45
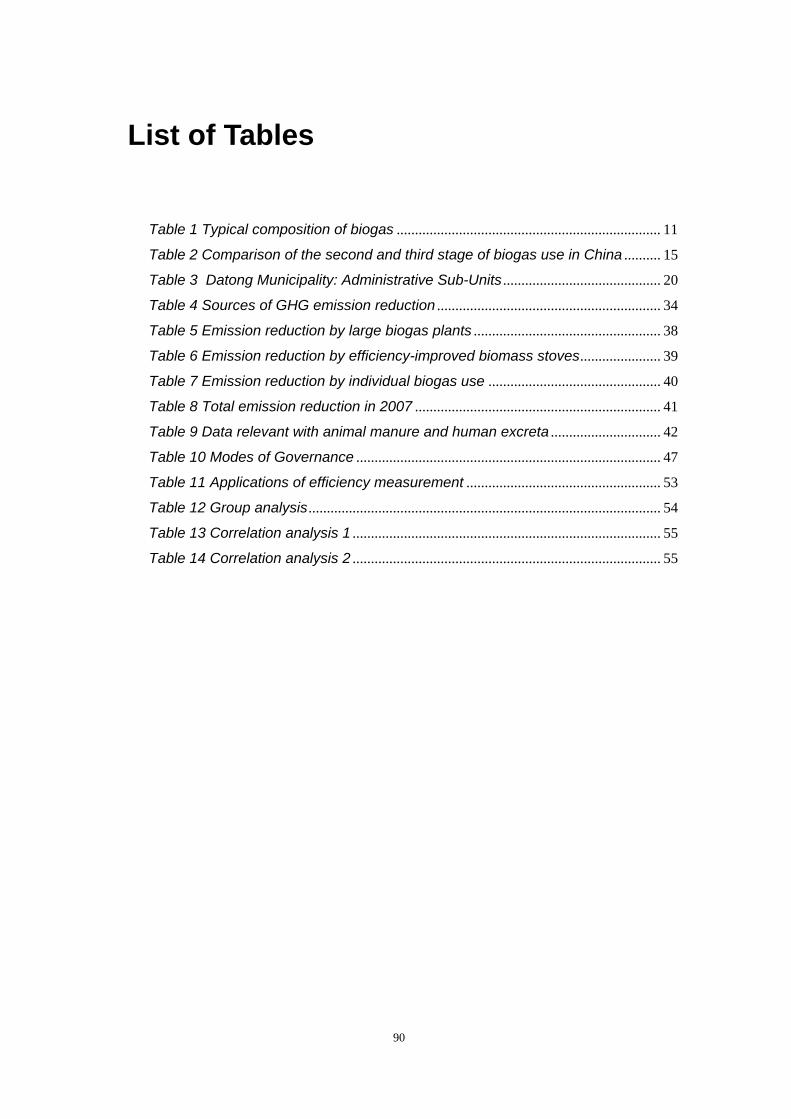
90
List of Tables
Table 1 Typical composition of biogas ........................................................................ 11
Table 2 Comparison of the second and third stage of biogas use in China .......... 15
Table 3 Datong Municipality: Administrative Sub-Units ........................................... 20
Table 4 Sources of GHG emission reduction ............................................................. 34
Table 5 Emission reduction by large biogas plants ................................................... 38
Table 6 Emission reduction by efficiency-improved biomass stoves ...................... 39
Table 7 Emission reduction by individual biogas use ............................................... 40
Table 8 Total emission reduction in 2007 ................................................................... 41
Table 9 Data relevant with animal manure and human excreta .............................. 42
Table 10 Modes of Governance ................................................................................... 47
Table 11 Applications of efficiency measurement ..................................................... 53
Table 12 Group analysis ................................................................................................ 54
Table 13 Correlation analysis 1 .................................................................................... 55
Table 14 Correlation analysis 2 .................................................................................... 55

91
List of Pictures
Picture 1 The location of Datong within the Chinese Territory ................................ 19
Picture 2 Datong: large biogas project ........................................................................ 22
Picture 3 Improved efficiency biomass stoves ........................................................... 23
Picture 4 Household-use biogas digesters ................................................................. 23