IR Presentation March 2016 - GBL presentation_March... · IR Presentation March 2016 ... (including...
35
Groupe Bruxelles Lambert Experience. Our greatest asset. IR Presentation March 2016 GBL | March 2016
Transcript of IR Presentation March 2016 - GBL presentation_March... · IR Presentation March 2016 ... (including...
Groupe Bruxelles Lambert
Experience. Our greatest asset.
IR Presentation
March 2016
GBL | March 2016
2
1. GBL’s strategy – 2015 and forward 2
2. 2015 financial performance 14
3. Outlook 20
4. Appendix 22
GBL | March 2016
3
GBL’s strategy – 2015 and forward
GBL | March 2016
JAN FEB MAR APR MAY JUN JUL AUG SEP OCT DECNOV
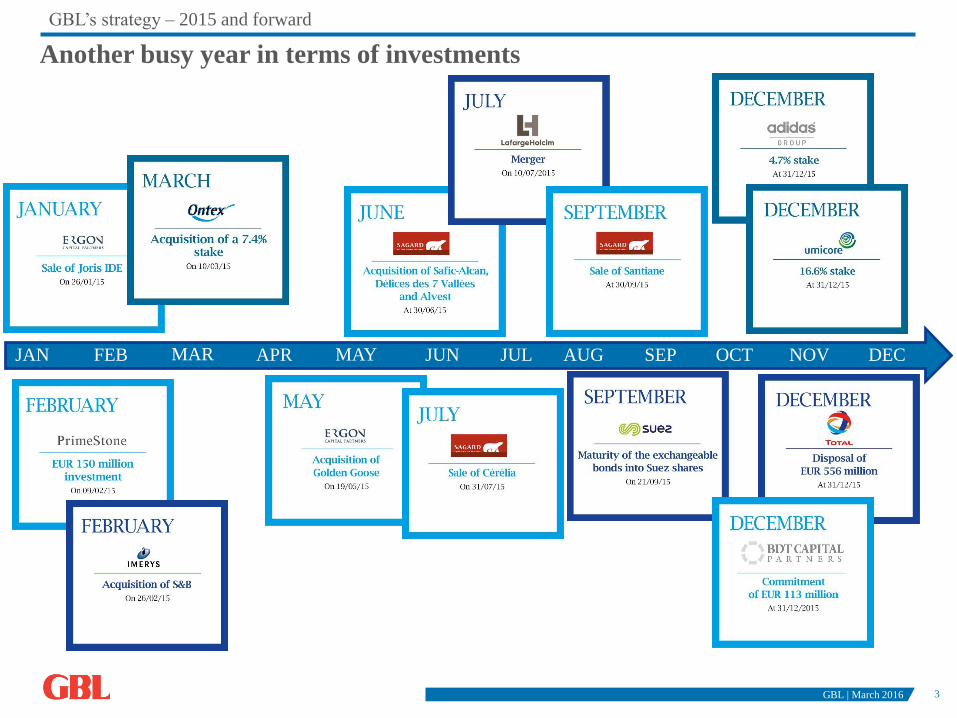
Another busy year in terms of investments
4
GBL’s strategy – 2015 and forward
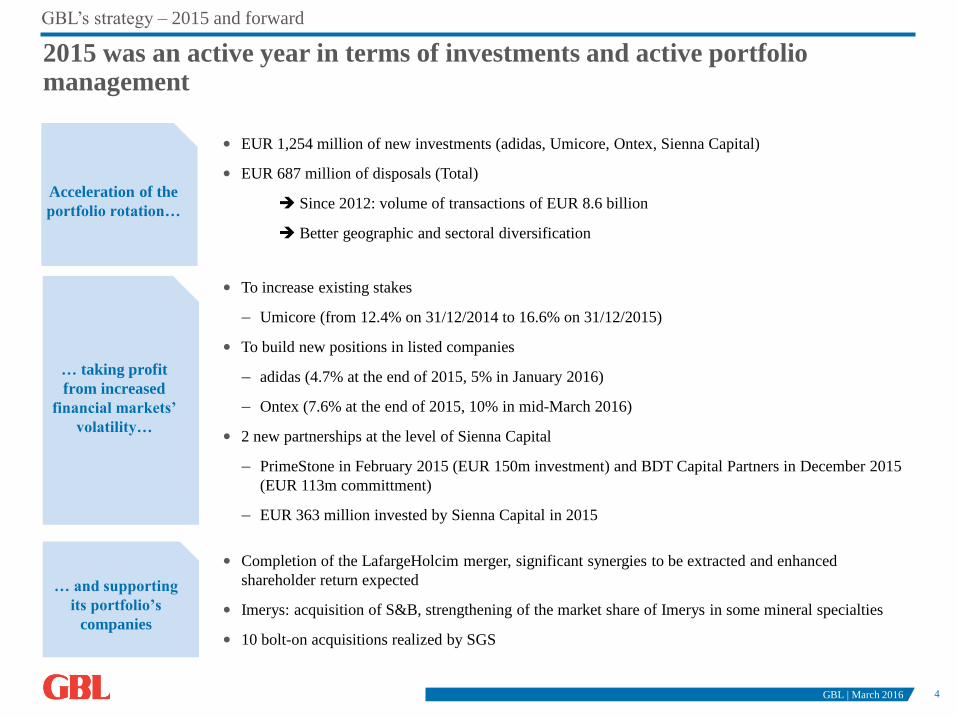
2015 was an active year in terms of investments and active portfolio management
Acceleration of the
portfolio rotation…
• EUR 1,254 million of new investments (adidas, Umicore, Ontex, Sienna Capital)
• EUR 687 million of disposals (Total)
Since 2012: volume of transactions of EUR 8.6 billion
Better geographic and sectoral diversification
… taking profit
from increased
financial markets’
volatility…
• To increase existing stakes
– Umicore (from 12.4% on 31/12/2014 to 16.6% on 31/12/2015)
• To build new positions in listed companies
– adidas (4.7% at the end of 2015, 5% in January 2016)
– Ontex (7.6% at the end of 2015, 10% in mid-March 2016)
• 2 new partnerships at the level of Sienna Capital
– PrimeStone in February 2015 (EUR 150m investment) and BDT Capital Partners in December 2015
(EUR 113m committment)
– EUR 363 million invested by Sienna Capital in 2015
… and supporting
its portfolio’s
companies
• Completion of the LafargeHolcim merger, significant synergies to be extracted and enhanced
shareholder return expected
• Imerys: acquisition of S&B, strengthening of the market share of Imerys in some mineral specialties
• 10 bolt-on acquisitions realized by SGS
GBL | March 2016
5
GBL’s strategy – 2015 and forward
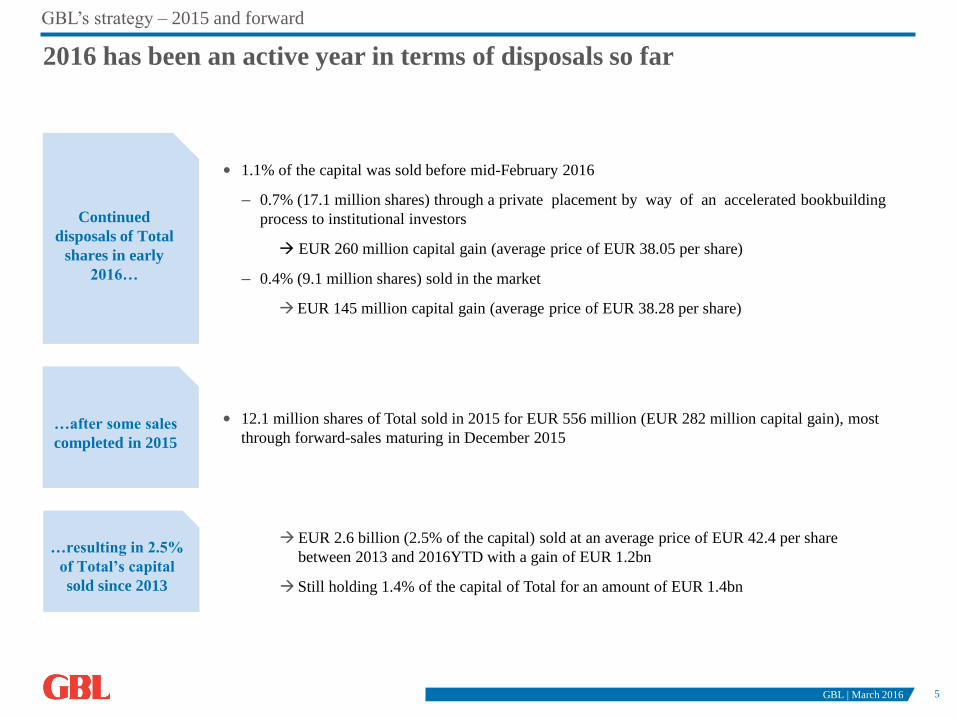
2016 has been an active year in terms of disposals so far
Continued
disposals of Total
shares in early
2016…
• 1.1% of the capital was sold before mid-February 2016
– 0.7% (17.1 million shares) through a private placement by way of an accelerated bookbuilding
process to institutional investors
EUR 260 million capital gain (average price of EUR 38.05 per share)
– 0.4% (9.1 million shares) sold in the market
EUR 145 million capital gain (average price of EUR 38.28 per share)
…resulting in 2.5%
of Total’s capital
sold since 2013
EUR 2.6 billion (2.5% of the capital) sold at an average price of EUR 42.4 per share
between 2013 and 2016YTD with a gain of EUR 1.2bn
Still holding 1.4% of the capital of Total for an amount of EUR 1.4bn
GBL | March 2016
…after some sales
completed in 2015
• 12.1 million shares of Total sold in 2015 for EUR 556 million (EUR 282 million capital gain), most
through forward-sales maturing in December 2015
6
GBL’s strategy – 2015 and forward
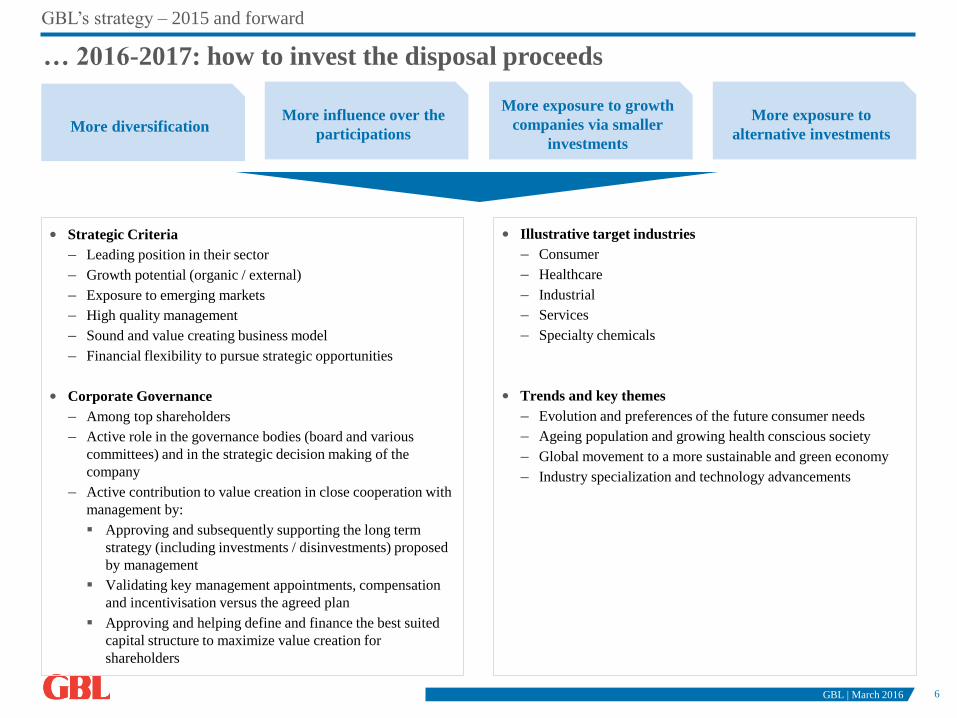
… 2016-2017: how to invest the disposal proceeds
GBL | March 2016
More diversification More influence over the
participations
More exposure to growth
companies via smaller
investments
More exposure to
alternative investments
• Strategic Criteria
– Leading position in their sector
– Growth potential (organic / external)
– Exposure to emerging markets
– High quality management
– Sound and value creating business model
– Financial flexibility to pursue strategic opportunities
• Corporate Governance
– Among top shareholders
– Active role in the governance bodies (board and various
committees) and in the strategic decision making of the
company
– Active contribution to value creation in close cooperation with
management by:
Approving and subsequently supporting the long term
strategy (including investments / disinvestments) proposed
by management
Validating key management appointments, compensation
and incentivisation versus the agreed plan
Approving and helping define and finance the best suited
capital structure to maximize value creation for
shareholders
• Illustrative target industries
– Consumer
– Healthcare
– Industrial
– Services
– Specialty chemicals
• Trends and key themes
– Evolution and preferences of the future consumer needs
– Ageing population and growing health conscious society
– Global movement to a more sustainable and green economy
– Industry specialization and technology advancements
7
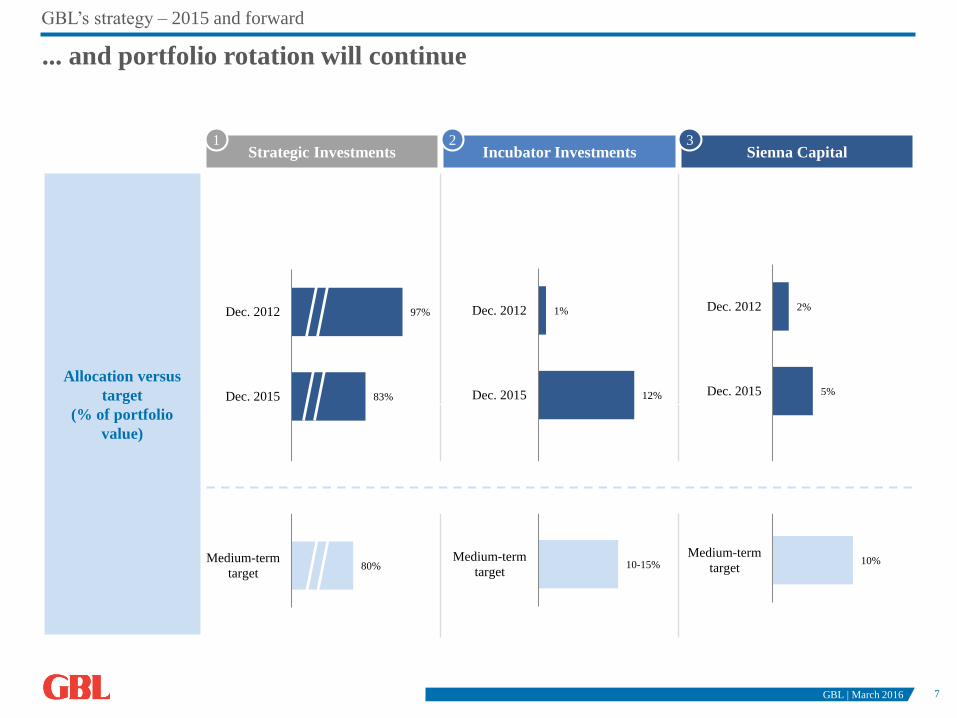
GBL’s strategy – 2015 and forward
... and portfolio rotation will continue
Strategic Investments Incubator Investments Sienna Capital
Allocation versus
target
(% of portfolio
value)
80%
83%
97%
Medium-term
target
Dec. 2015
Dec. 2012
10%
5%
2%
Medium-term
target
Dec. 2015
Dec. 2012
1 2 3
10-15%
12%
1%
Medium-term
target
Dec. 2015
Dec. 2012
GBL | March 2016
8
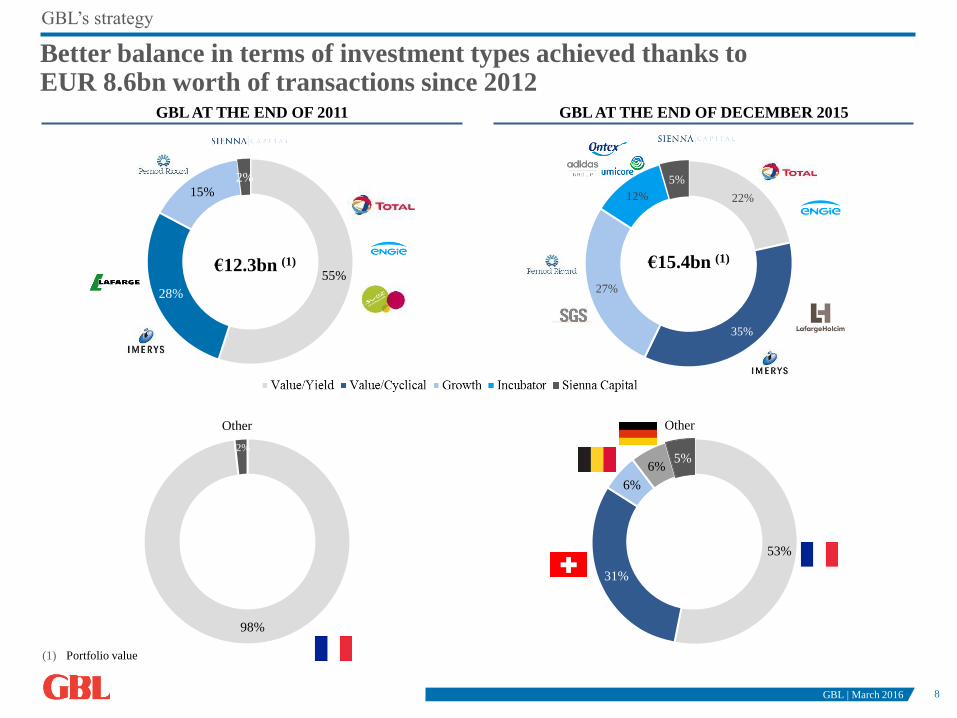
22%
35%
27%
12%
5%
53%
31%
6%
6%5%
55%
28%
15%2%
GBL’s strategy
Better balance in terms of investment types achieved thanks to EUR 8.6bn worth of transactions since 2012
GBL AT THE END OF 2011 GBL AT THE END OF DECEMBER 2015
€12.3bn (1) €15.4bn (1)
98%
2%
Other
(1) Portfolio value
Other
GBL | March 2016
9
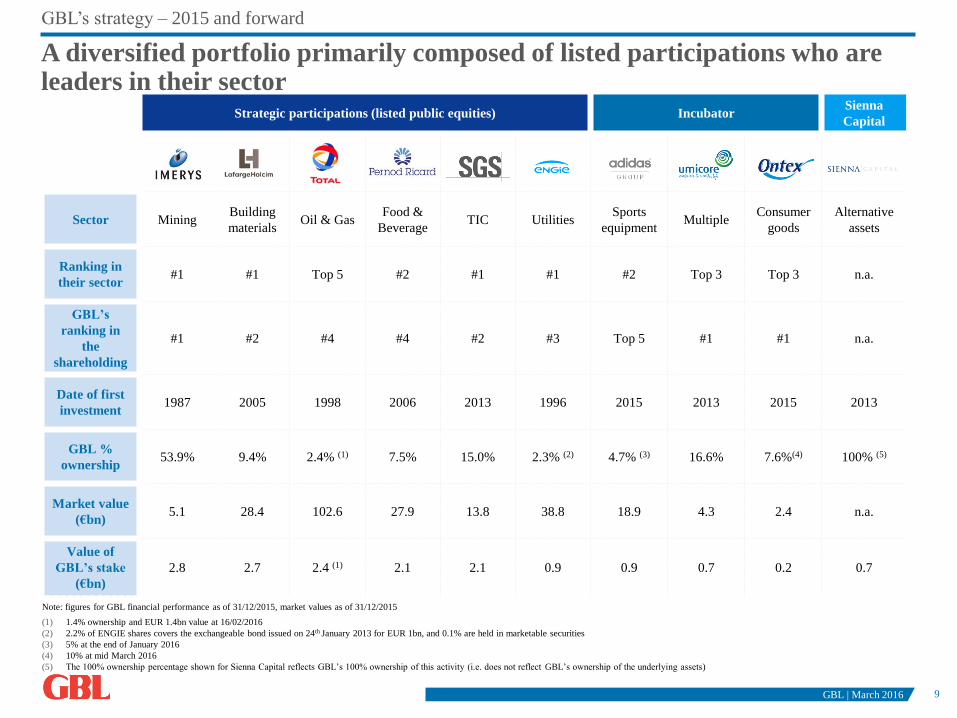
Strategic participations (listed public equities) IncubatorSienna
Capital
Sector Mining Building
materialsOil & Gas
Food &
Beverage TIC Utilities
Sports
equipmentMultiple
Consumer
goods
Alternative
assets
Ranking in
their sector#1 #1 Top 5 #2 #1 #1 #2 Top 3 Top 3 n.a.
GBL’s
ranking in
the
shareholding
#1 #2 #4 #4 #2 #3 Top 5 #1 #1 n.a.
Date of first
investment1987 2005 1998 2006 2013 1996 2015 2013 2015 2013
GBL %
ownership53.9% 9.4% 2.4% (1) 7.5% 15.0% 2.3% (2) 4.7% (3) 16.6% 7.6%(4) 100% (5)
Market value
(€bn)5.1 28.4 102.6 27.9 13.8 38.8 18.9 4.3 2.4 n.a.
Value of
GBL’s stake
(€bn)
2.8 2.7 2.4 (1) 2.1 2.1 0.9 0.9 0.7 0.2 0.7
GBL’s strategy – 2015 and forward
Note: figures for GBL financial performance as of 31/12/2015, market values as of 31/12/2015
(1) 1.4% ownership and EUR 1.4bn value at 16/02/2016
(2) 2.2% of ENGIE shares covers the exchangeable bond issued on 24th January 2013 for EUR 1bn, and 0.1% are held in marketable securities
(3) 5% at the end of January 2016
(4) 10% at mid March 2016
(5) The 100% ownership percentage shown for Sienna Capital reflects GBL’s 100% ownership of this activity (i.e. does not reflect GBL’s ownership of the underlying assets)
A diversified portfolio primarily composed of listed participations who are leaders in their sector
GBL | March 2016
10
1. GBL’s strategy – 2015 and forward 2
2. 2015 financial performance 10
3. Outlook 20
4. Appendix 22
GBL | March 2016
11
2015 financial performance
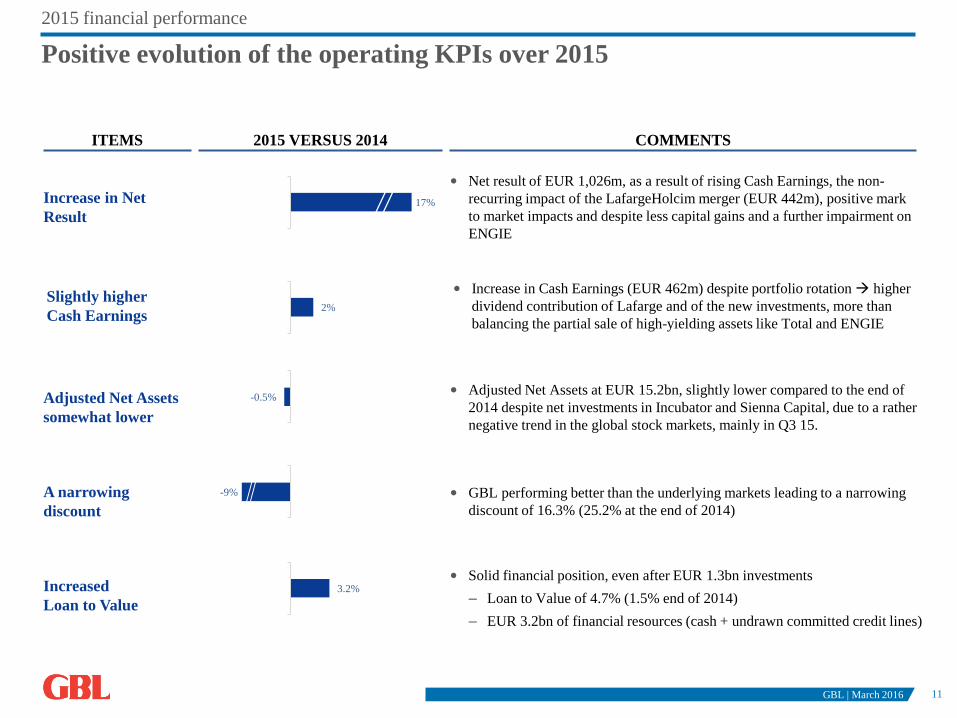
Positive evolution of the operating KPIs over 2015
COMMENTS2015 VERSUS 2014
• Adjusted Net Assets at EUR 15.2bn, slightly lower compared to the end of
2014 despite net investments in Incubator and Sienna Capital, due to a rather
negative trend in the global stock markets, mainly in Q3 15.
Adjusted Net Assets
somewhat lower
• Increase in Cash Earnings (EUR 462m) despite portfolio rotation higher
dividend contribution of Lafarge and of the new investments, more than
balancing the partial sale of high-yielding assets like Total and ENGIE
Slightly higher
Cash Earnings
• Net result of EUR 1,026m, as a result of rising Cash Earnings, the non-
recurring impact of the LafargeHolcim merger (EUR 442m), positive mark
to market impacts and despite less capital gains and a further impairment on
ENGIE
Increase in Net
Result
• Solid financial position, even after EUR 1.3bn investments
– Loan to Value of 4.7% (1.5% end of 2014)
– EUR 3.2bn of financial resources (cash + undrawn committed credit lines)
Increased
Loan to Value
• GBL performing better than the underlying markets leading to a narrowing
discount of 16.3% (25.2% at the end of 2014)
A narrowing
discount
ITEMS
3.2%
2%
17%
GBL | March 2016
-9%
-0.5%
12
2015 financial performance
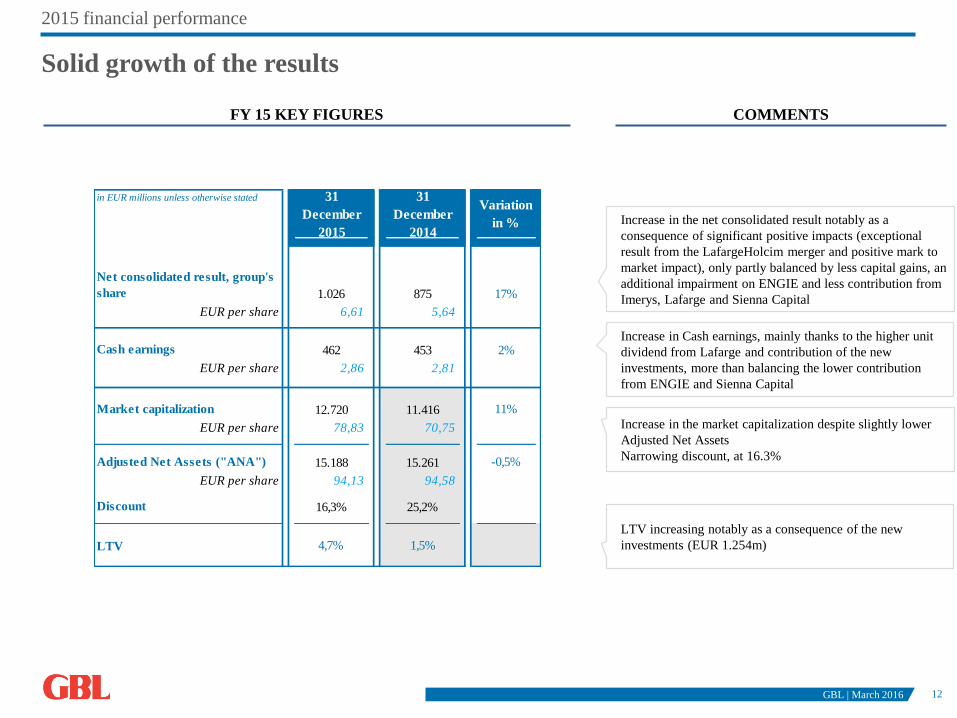
Solid growth of the results
COMMENTSFY 15 KEY FIGURES
GBL | March 2016
Increase in the net consolidated result notably as a
consequence of significant positive impacts (exceptional
result from the LafargeHolcim merger and positive mark to
market impact), only partly balanced by less capital gains, an
additional impairment on ENGIE and less contribution from
Imerys, Lafarge and Sienna Capital
Increase in Cash earnings, mainly thanks to the higher unit
dividend from Lafarge and contribution of the new
investments, more than balancing the lower contribution
from ENGIE and Sienna Capital
Increase in the market capitalization despite slightly lower
Adjusted Net Assets
Narrowing discount, at 16.3%
in EUR millions unless otherwise stated
Net consolidated result, group's
share 17%
EUR per share
Cash earnings 2%
EUR per share
Market capitalization 11%
EUR per share
Adjusted Net Assets ("ANA") -0,5%
EUR per share
Discount
LTV
16,3% 25,2%
Variation
in %
4,7% 1,5%
94,13
15.261
11.416
94,58
15.188
78,83 70,75
2,81
31
December
2015
6,61
12.720
1.026
2,86
875
31
December
2014
462 453
5,64
LTV increasing notably as a consequence of the new
investments (EUR 1.254m)
13
2015 financial performance
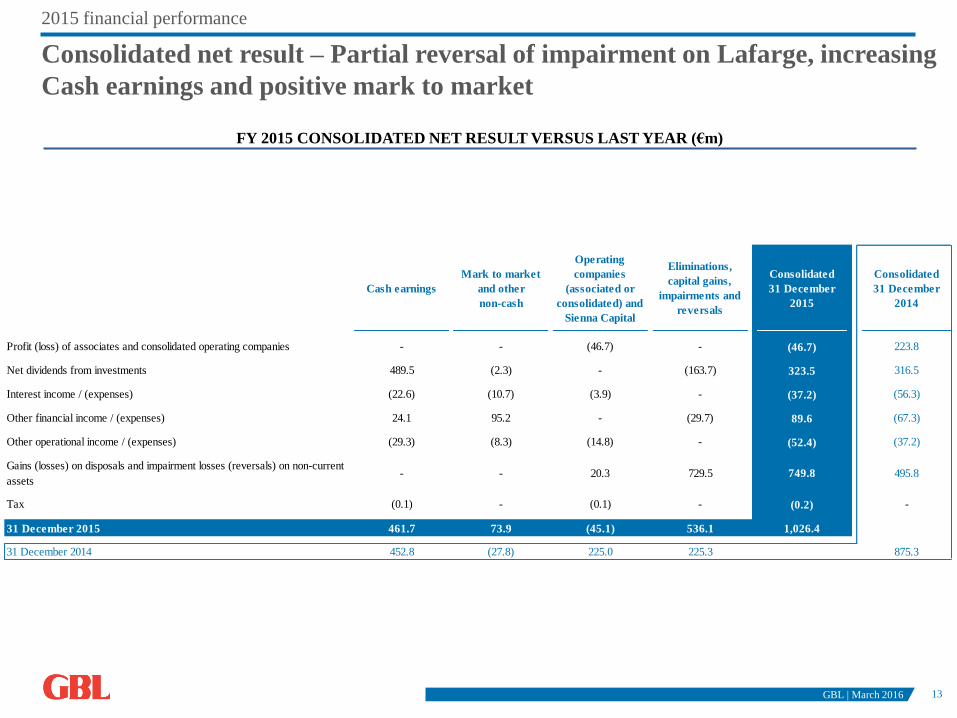
Consolidated net result – Partial reversal of impairment on Lafarge, increasing
Cash earnings and positive mark to market
FY 2015 CONSOLIDATED NET RESULT VERSUS LAST YEAR (€m)
GBL | March 2016
Cash earnings
Mark to market
and other
non-cash
Operating
companies
(associated or
consolidated) and
Sienna Capital
Eliminations,
capital gains,
impairments and
reversals
Consolidated
31 December
2015
Consolidated
31 December
2014
Profit (loss) of associates and consolidated operating companies - - (46.7) - (46.7) 223.8
Net dividends from investments 489.5 (2.3) - (163.7) 323.5 316.5
Interest income / (expenses) (22.6) (10.7) (3.9) - (37.2) (56.3)
Other financial income / (expenses) 24.1 95.2 - (29.7) 89.6 (67.3)
Other operational income / (expenses) (29.3) (8.3) (14.8) - (52.4) (37.2)
Gains (losses) on disposals and impairment losses (reversals) on non-current
assets- - 20.3 729.5 749.8 495.8
Tax (0.1) - (0.1) - (0.2) -
31 December 2015 461.7 73.9 (45.1) 536.1 1,026.4
31 December 2014 452.8 (27.8) 225.0 225.3 875.3
14
2015 financial performance
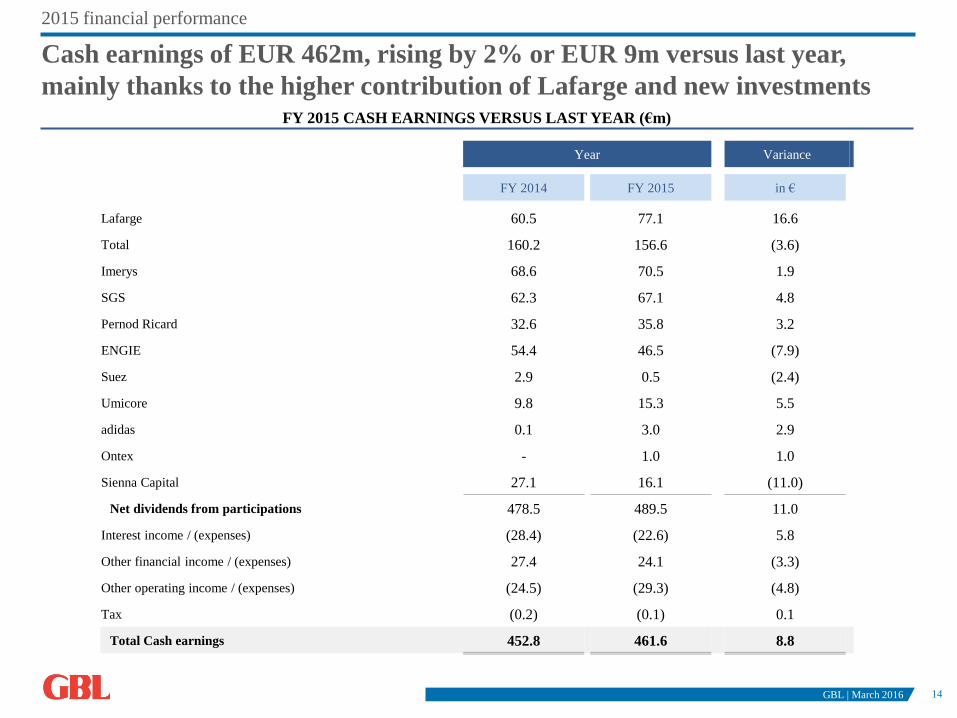
Cash earnings of EUR 462m, rising by 2% or EUR 9m versus last year,
mainly thanks to the higher contribution of Lafarge and new investmentsFY 2015 CASH EARNINGS VERSUS LAST YEAR (€m)
GBL | March 2016
Year Variance
FY 2014 FY 2015 in €
Lafarge 60.5 77.1 16.6
Total 160.2 156.6 (3.6)
Imerys 68.6 70.5 1.9
SGS 62.3 67.1 4.8
Pernod Ricard 32.6 35.8 3.2
ENGIE 54.4 46.5 (7.9)
Suez 2.9 0.5 (2.4)
Umicore 9.8 15.3 5.5
adidas 0.1 3.0 2.9
Ontex - 1.0 1.0
Sienna Capital 27.1 16.1 (11.0)
Net dividends from participations 478.5 489.5 11.0
Interest income / (expenses) (28.4) (22.6) 5.8
Other financial income / (expenses) 27.4 24.1 (3.3)
Other operating income / (expenses) (24.5) (29.3) (4.8)
Tax (0.2) (0.1) 0.1
Total Cash earnings 452.8 461.6 8.8
15
2015 financial performance
GBL | March 2016
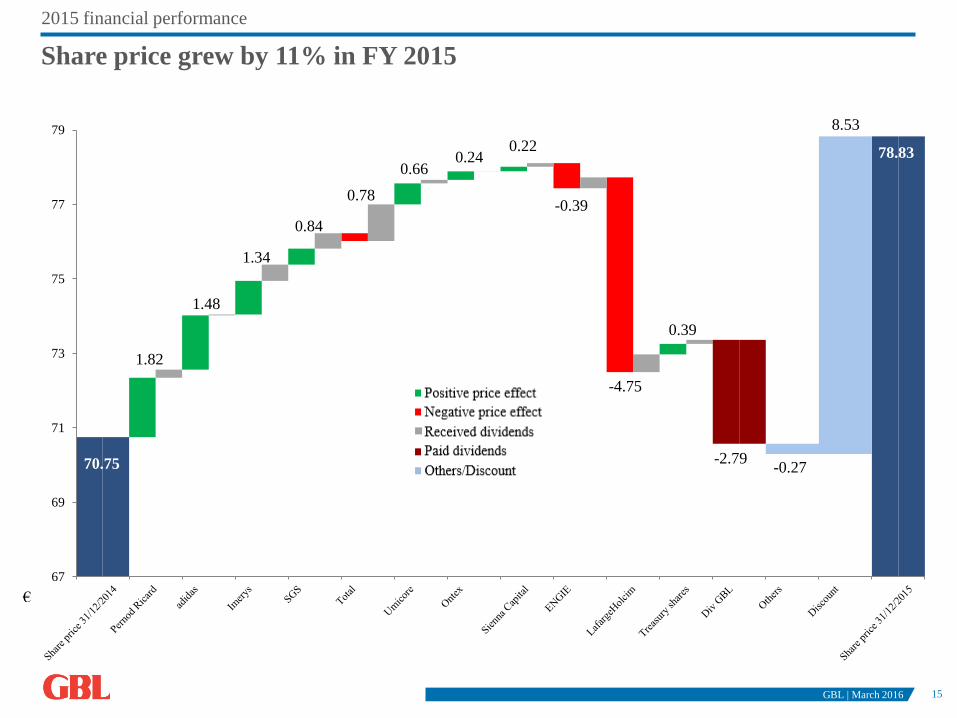
Share price grew by 11% in FY 2015
67
69
71
73
75
77
79
70.75
1.82
1.48
1.34
0.84
0.78
0.66 0.24
-0.27 -2.79
0.39
-4.75
0.22 78.83
€
8.53
-0.39
16
1,950 1,950
3,241
1,291
Undrawn confirmed
credit lines
Cash Financial liquidity
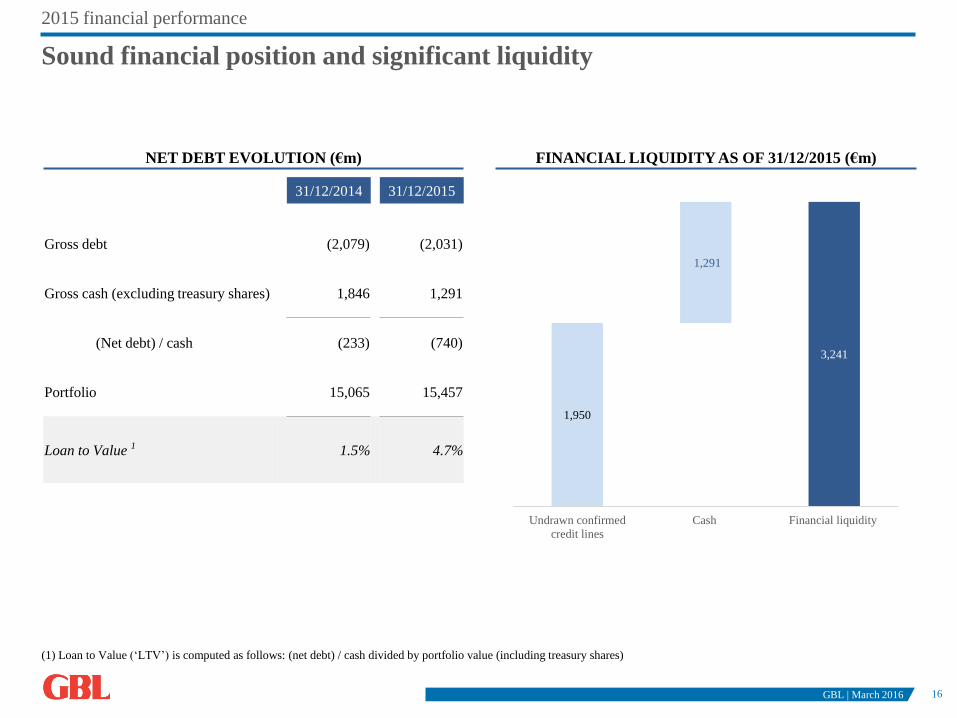
2015 financial performance
(1) Loan to Value (‘LTV’) is computed as follows: (net debt) / cash divided by portfolio value (including treasury shares)
Sound financial position and significant liquidity
31/12/2014 31/12/2015
Gross debt (2,079) (2,031)
Gross cash (excluding treasury shares) 1,846 1,291
(Net debt) / cash (233) (740)
Portfolio 15,065 15,457
Loan to Value 1 1.5% 4.7%
FINANCIAL LIQUIDITY AS OF 31/12/2015 (€m) NET DEBT EVOLUTION (€m)
GBL | March 2016
17
2015 financial performance
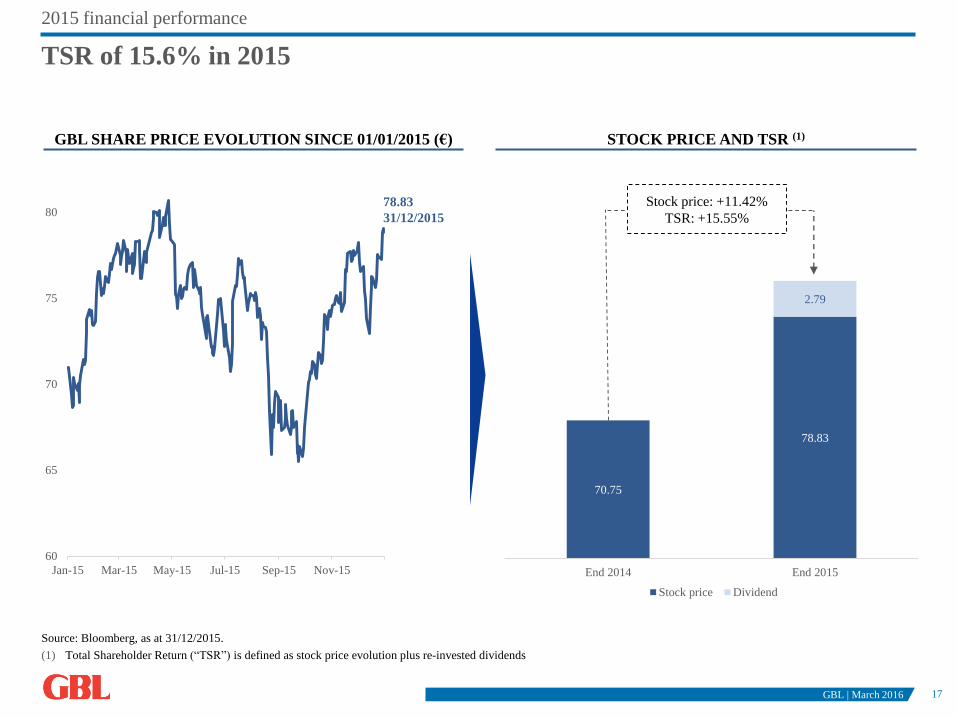
Source: Bloomberg, as at 31/12/2015.
(1) Total Shareholder Return (“TSR”) is defined as stock price evolution plus re-invested dividends
TSR of 15.6% in 2015
STOCK PRICE AND TSR (1)GBL SHARE PRICE EVOLUTION SINCE 01/01/2015 (€)
GBL | March 2016
60
65
70
75
80
Jan-15 Mar-15 May-15 Jul-15 Sep-15 Nov-15
78.83
31/12/2015
70.75
78.83
2.79
End 2014 End 2015
Stock price Dividend
Stock price: +11.42%
TSR: +15.55%
18
2015 financial performance
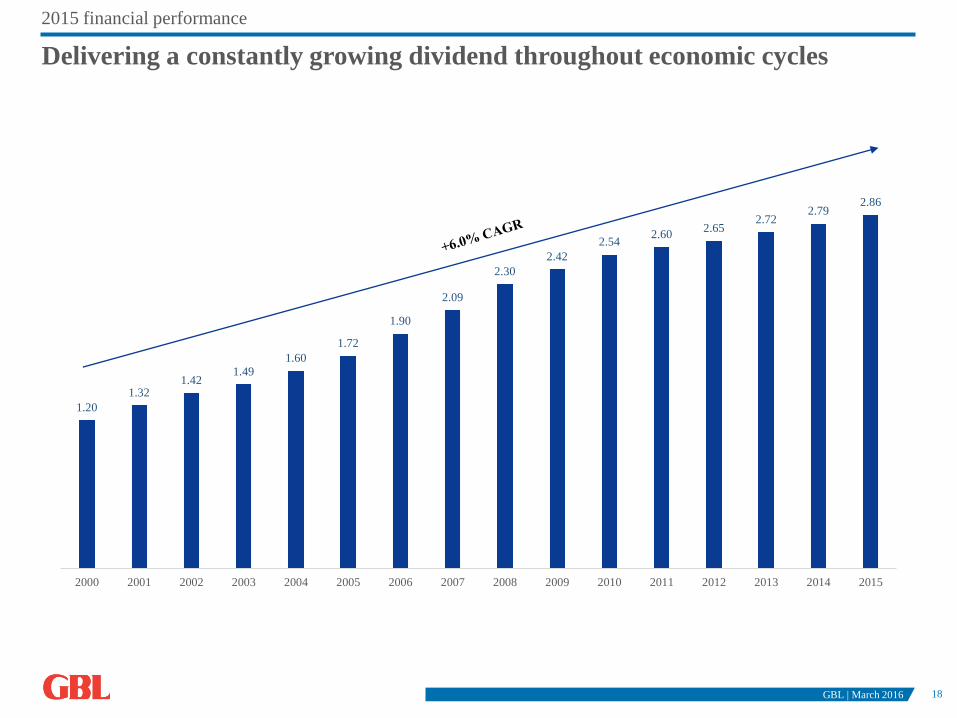
Delivering a constantly growing dividend throughout economic cycles
GBL | March 2016
1.20
1.32 1.42
1.49 1.60
1.72
1.90
2.09
2.30
2.42
2.54 2.60
2.65 2.72
2.79 2.86
2000 2001 2002 2003 2004 2005 2006 2007 2008 2009 2010 2011 2012 2013 2014 2015
19
2015 financial performance
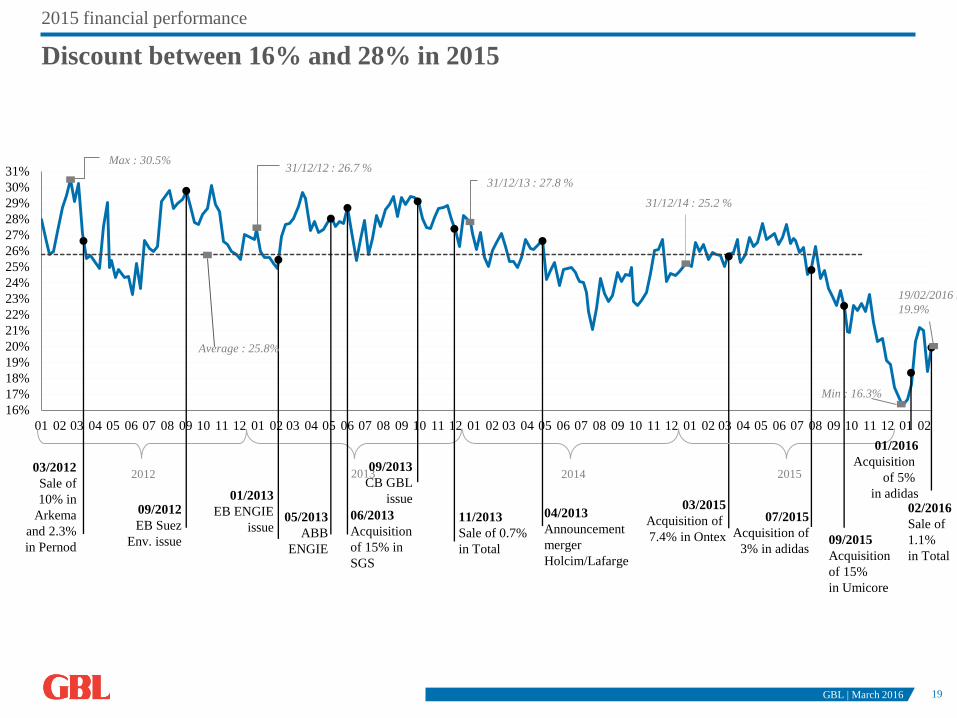
Discount between 16% and 28% in 2015
GBL | March 2016
16%
17%
18%
19%
20%
21%
22%
23%
24%
25%
26%
27%
28%
29%
30%
31%
01 02 03 04 05 06 07 08 09 10 11 12 01 02 03 04 05 06 07 08 09 10 11 12 01 02 03 04 05 06 07 08 09 10 11 12 01 02 03 04 05 06 07 08 09 10 11 12 01 02
Max : 30.5%
20132012
Min : 16.3%
31/12/12 : 26.7 %
2014
31/12/13 : 27.8 %
Average : 25.8%
31/12/14 : 25.2 %
2015
19/02/2016 :
19.9%
09/2012
EB Suez
Env. issue
01/2013
EB ENGIE
issue06/2013
Acquisition
of 15% in
SGS
05/2013
ABB
ENGIE
03/2012
Sale of
10% in
Arkema
and 2.3%
in Pernod
09/2013
CB GBL
issue
11/2013
Sale of 0.7%
in Total
04/2013
Announcement
merger
Holcim/Lafarge
03/2015
Acquisition of
7.4% in Ontex
07/2015
Acquisition of
3% in adidas09/2015
Acquisition
of 15%
in Umicore
01/2016
Acquisition
of 5%
in adidas02/2016
Sale of
1.1%
in Total
20
1. GBL’s strategy – 2015 and forward 2
2. 2015 financial performance 10
3. Outlook 20
4. Appendix 22
GBL | March 2016
21
Outlook
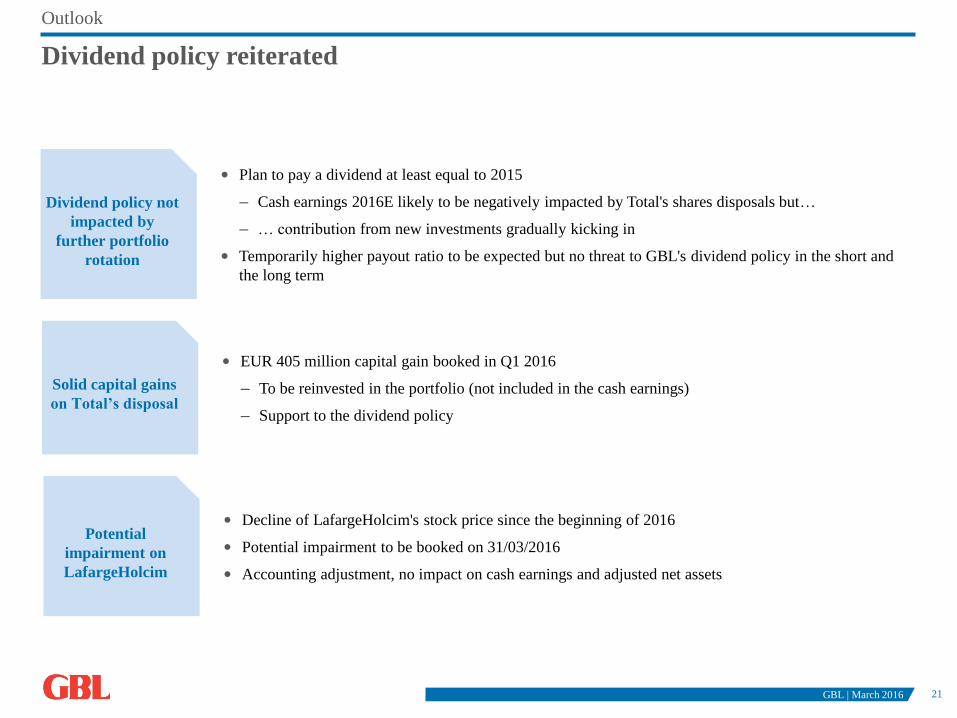
Dividend policy reiterated
Dividend policy not
impacted by
further portfolio
rotation
• Plan to pay a dividend at least equal to 2015
– Cash earnings 2016E likely to be negatively impacted by Total's shares disposals but…
– … contribution from new investments gradually kicking in
• Temporarily higher payout ratio to be expected but no threat to GBL's dividend policy in the short and
the long term
Solid capital gains
on Total’s disposal
• EUR 405 million capital gain booked in Q1 2016
– To be reinvested in the portfolio (not included in the cash earnings)
– Support to the dividend policy
Potential
impairment on
LafargeHolcim
• Decline of LafargeHolcim's stock price since the beginning of 2016
• Potential impairment to be booked on 31/03/2016
• Accounting adjustment, no impact on cash earnings and adjusted net assets
GBL | March 2016
22
1. GBL’s strategy – 2015 and forward 2
2. 2015 financial performance 10
3. Outlook 20
4. Appendix 22
GBL | March 2016
23
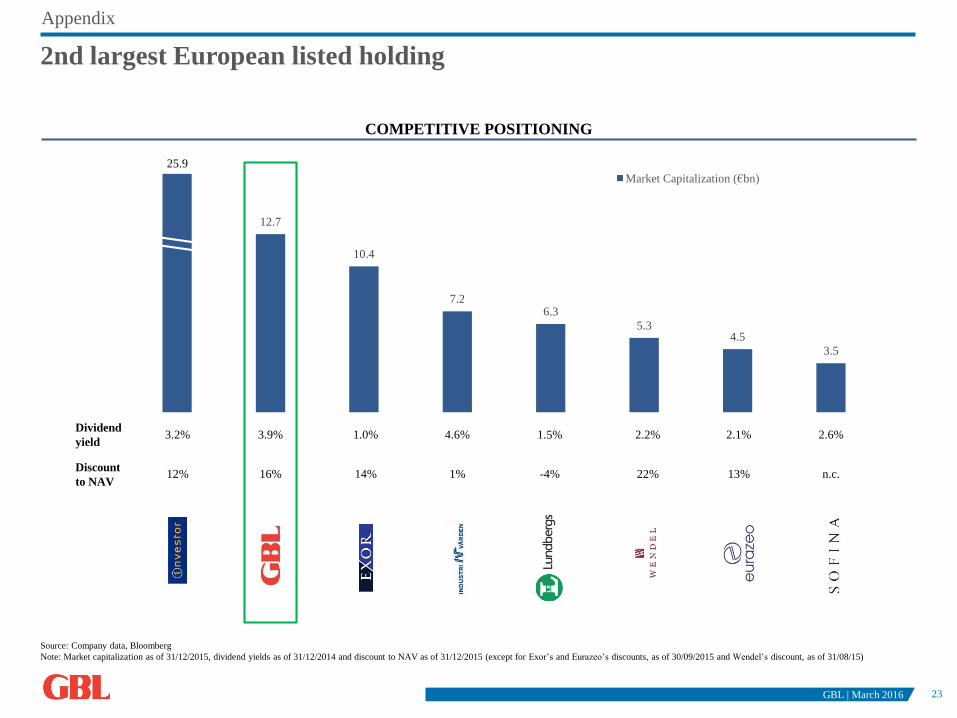
12.7
10.4
7.26.3
5.34.5
3.5
Market Capitalization (€bn)
COMPETITIVE POSITIONING
Appendix
2nd largest European listed holding
Source: Company data, Bloomberg
Note: Market capitalization as of 31/12/2015, dividend yields as of 31/12/2014 and discount to NAV as of 31/12/2015 (except for Exor’s and Eurazeo’s discounts, as of 30/09/2015 and Wendel’s discount, as of 31/08/15)
Dividend
yield
Discount
to NAV
25.9
GBL | March 2016
2.2%3.2% 2.1% 2.6%1.5%1.0% 4.6%3.9%
22%12% 13% n.c.-4%14% 1%16%
24
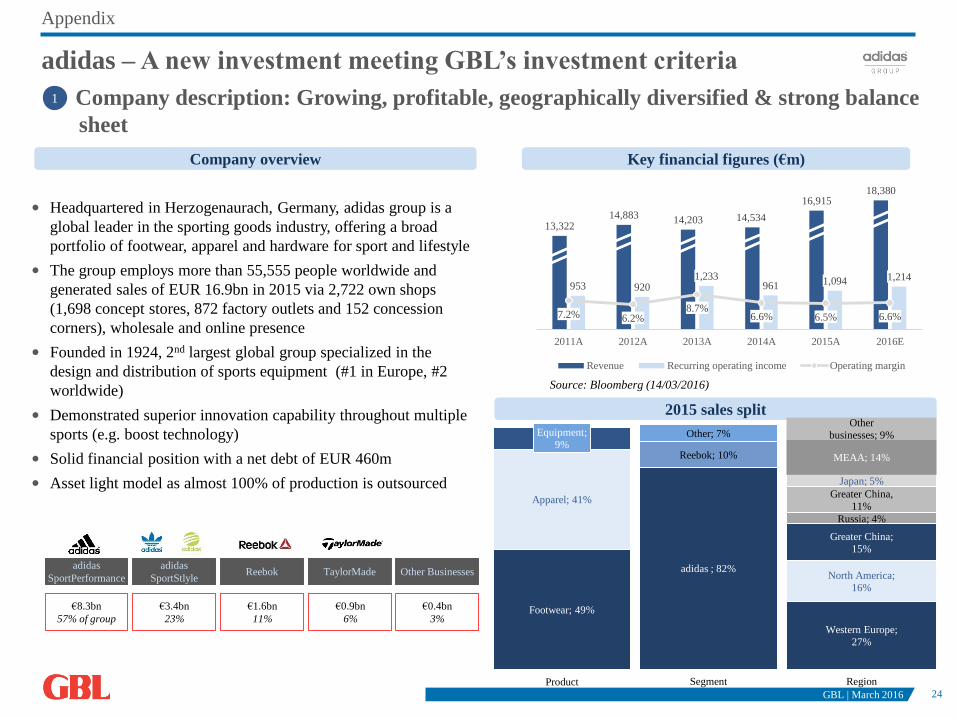
• Headquartered in Herzogenaurach, Germany, adidas group is a
global leader in the sporting goods industry, offering a broad
portfolio of footwear, apparel and hardware for sport and lifestyle
• The group employs more than 55,555 people worldwide and
generated sales of EUR 16.9bn in 2015 via 2,722 own shops
(1,698 concept stores, 872 factory outlets and 152 concession
corners), wholesale and online presence
• Founded in 1924, 2nd largest global group specialized in the
design and distribution of sports equipment (#1 in Europe, #2
worldwide)
• Demonstrated superior innovation capability throughout multiple
sports (e.g. boost technology)
• Solid financial position with a net debt of EUR 460m
• Asset light model as almost 100% of production is outsourced
2015 sales split
Key financial figures (€m) Company overview
13,32214,883 14,203 14,534
16,91518,380
953 920 1,233
961 1,094 1,214
7.2% 6.2% 8.7%
6.6% 6.5% 6.6%
2011A 2012A 2013A 2014A 2015A 2016E
Revenue Recurring operating income Operating margin
Source: Bloomberg (14/03/2016)
adidas ; 82%
Reebok; 10%
Other; 7%
Segment
adidas – A new investment meeting GBL’s investment criteria
Company description: Growing, profitable, geographically diversified & strong balance
sheet
1
€8.3bn
57% of group
adidas
SportPerformance
adidas
SportStlyleReebok TaylorMade Other Businesses
€3.4bn
23%
€1.6bn
11%
€0.9bn
6%
€0.4bn
3%Footwear; 49%
Apparel; 41%
Equipment;
9%
Product
Western Europe;
27%
North America;
16%
Greater China;
15%
Russia; 4%
Greater China,
11%
Japan; 5%
MEAA; 14%
Other
businesses; 9%
Region
GBL | March 2016
Appendix
25
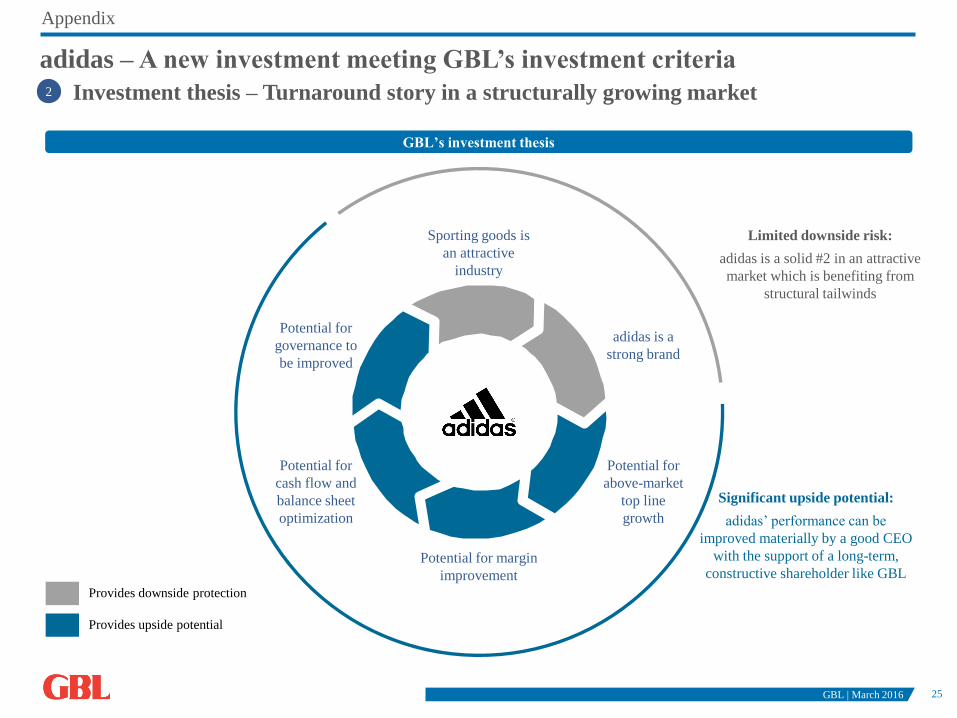
Appendix
Limited downside risk:
adidas is a solid #2 in an attractive
market which is benefiting from
structural tailwinds
Sporting goods is
an attractive
industry
adidas is a
strong brand
Potential for
above-market
top line
growth
Potential for margin
improvement
Potential for
cash flow and
balance sheet
optimization
Potential for
governance to
be improved
Significant upside potential:
adidas’ performance can be
improved materially by a good CEO
with the support of a long-term,
constructive shareholder like GBL
Provides upside potential
Provides downside protection
GBL’s investment thesis
adidas – A new investment meeting GBL’s investment criteria
Investment thesis – Turnaround story in a structurally growing market
GBL | March 2016
2
26
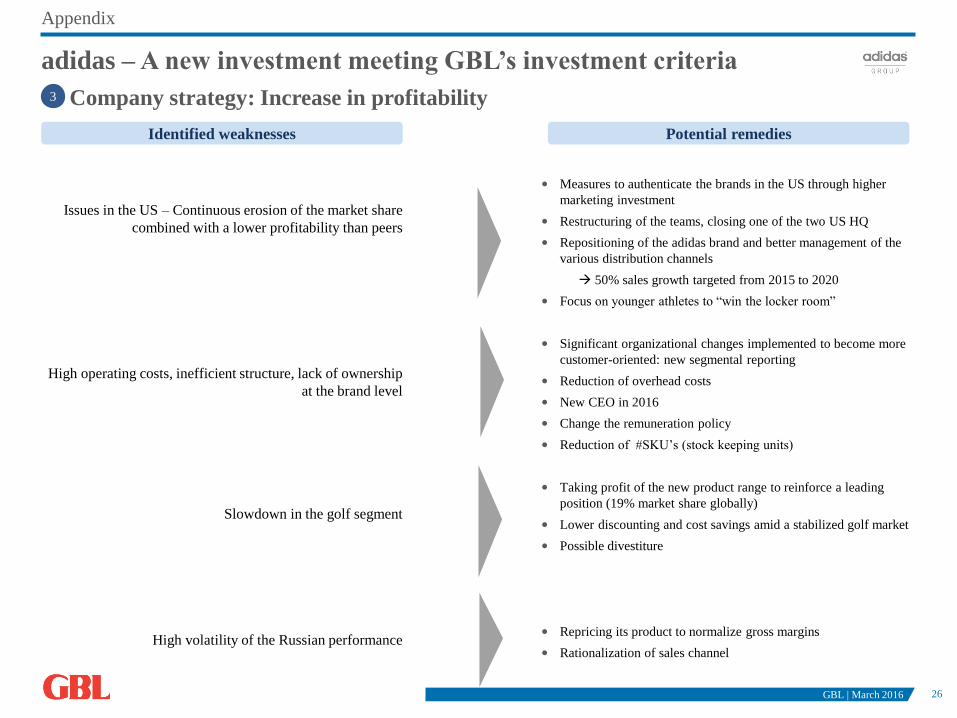
Issues in the US – Continuous erosion of the market share
combined with a lower profitability than peers
High operating costs, inefficient structure, lack of ownership
at the brand level
Slowdown in the golf segment
High volatility of the Russian performance
adidas – A new investment meeting GBL’s investment criteria
Company strategy: Increase in profitability3
Identified weaknesses Potential remedies
• Measures to authenticate the brands in the US through higher
marketing investment
• Restructuring of the teams, closing one of the two US HQ
• Repositioning of the adidas brand and better management of the
various distribution channels
50% sales growth targeted from 2015 to 2020
• Focus on younger athletes to “win the locker room”
• Significant organizational changes implemented to become more
customer-oriented: new segmental reporting
• Reduction of overhead costs
• New CEO in 2016
• Change the remuneration policy
• Reduction of #SKU’s (stock keeping units)
• Taking profit of the new product range to reinforce a leading
position (19% market share globally)
• Lower discounting and cost savings amid a stabilized golf market
• Possible divestiture
• Repricing its product to normalize gross margins
• Rationalization of sales channel
GBL | March 2016
Appendix
27
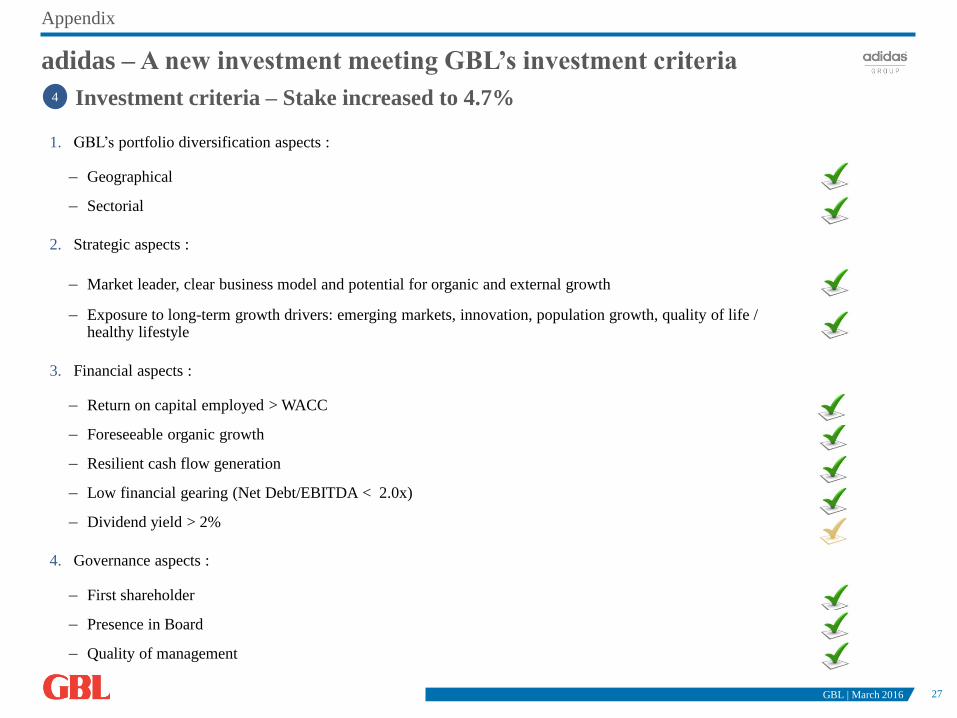
1. GBL’s portfolio diversification aspects :
– Geographical
– Sectorial
2. Strategic aspects :
– Market leader, clear business model and potential for organic and external growth
– Exposure to long-term growth drivers: emerging markets, innovation, population growth, quality of life / healthy lifestyle
3. Financial aspects :
– Return on capital employed > WACC
– Foreseeable organic growth
– Resilient cash flow generation
– Low financial gearing (Net Debt/EBITDA < 2.0x)
– Dividend yield > 2%
4. Governance aspects :
– First shareholder
– Presence in Board
– Quality of management
adidas – A new investment meeting GBL’s investment criteria
Investment criteria – Stake increased to 4.7%4
GBL | March 2016
Appendix
28
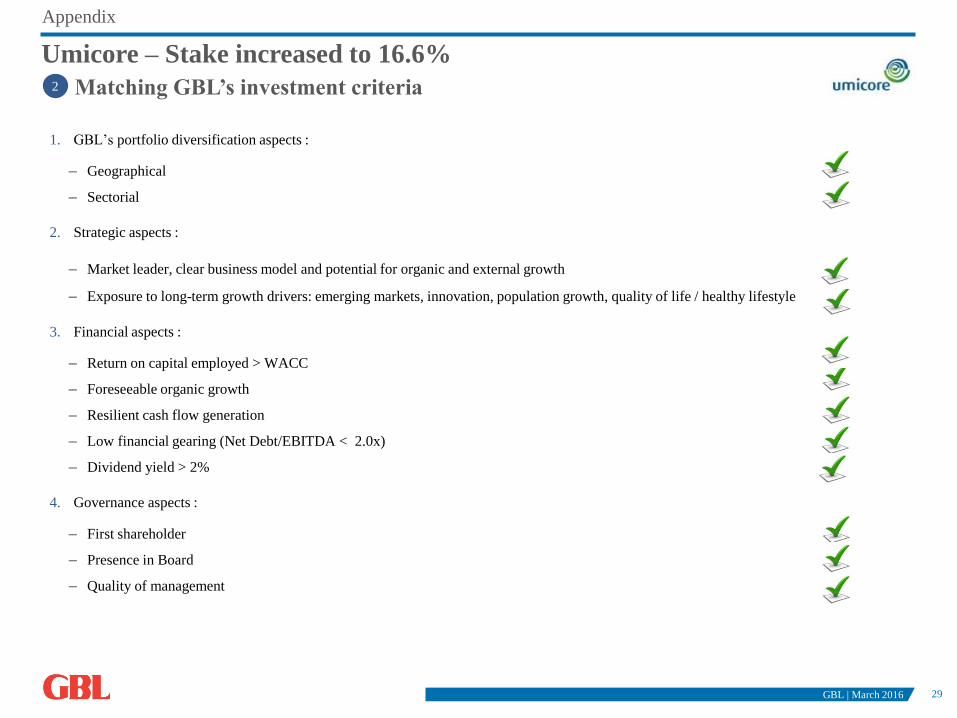
Umicore – Stake increased to 16.6%
A major player in its market with significant growth prospects
Company
description –
Surfing on green
mega-trends
Company strategy
– Reinforcing its
position of leader in
clean energy
materials and
recycling
• Technological leadership and sustainable development aspects as competitive advantages
Growing turnover and profitability
• Lower dependence on precious metals prices by a better balance between the 3 business lines
• Completion of all the investments planned, leading to accelerated organic growth going-forward,
without heavy capex plan
• R&D investments continued, in order to maintain technological leadership
• Open governance, enabling shareholders like GBL to play their role
1
Company
description –
Surfing on green
mega-trends
• 3 business lines:
– Undisputed world leader in precious metals recycling (increasing its capacity by 40% in its Hoboken
plant, at full speed in 2017)
– Global leader in catalysts (together with Johnson Matthey and BASF), enjoying increasing volumes
and prices, which is supported by more constraining regulation
– Leading player in rechargeable batteries, both in portable electronics and electric vehicles
• Very focused on technology, which is a competitive advantage
• Surfing on mega-trends like resources scarcity, more electrical vehicles and more stringent emission
controls
GBL | March 2016
Appendix
29GBL | March 2016
Umicore – Stake increased to 16.6%
Matching GBL’s investment criteria2
1. GBL’s portfolio diversification aspects :
– Geographical
– Sectorial
2. Strategic aspects :
– Market leader, clear business model and potential for organic and external growth
– Exposure to long-term growth drivers: emerging markets, innovation, population growth, quality of life / healthy lifestyle
3. Financial aspects :
– Return on capital employed > WACC
– Foreseeable organic growth
– Resilient cash flow generation
– Low financial gearing (Net Debt/EBITDA < 2.0x)
– Dividend yield > 2%
4. Governance aspects :
– First shareholder
– Presence in Board
– Quality of management
Appendix
30
Company
description –
A major player in
an attractive
market
• Major producer of disposable personal hygiene products (baby diapers, feminine care products and
adult incontinence), distributed in more than 100 countries through their own brands as well as under
leading retailer brands
• Leader in its main market segments
• Resilient business throughout the cycle (basic necessities)
• High quality management team
• 5,500 employees
Company strategy –
A leader in a
consolidating
market
• Being the leader in private label products (distributed by retailers), surfing on supportive demographic
waves
• Leading the consolidation of this structurally attractive market (3-4% annual organic growth)
• Gradual increase in the EBITDA margin (+30bps/year on average)
• Asset light model
• Significant cash conversion allowing for deleveraging and dividend distribution
– Low working capital requirements (c. 9% of sales)
– Low capex requirements (c. 3% of sales)
In line with GBL
criteria
• Bringing overall geographical and sector diversification to GBL, in line with the new strategy
implemented since 2012
• GBL is the first shareholder of a fragmented ownership
• GBL is supported by Management and the Board
• GBL could be represented at the Board
Ontex – A 7.6% stake in a solid, growing Belgian mid-cap
Company description and strategy1
GBL | March 2016
Appendix

31
Continuous organic
growth…
• Ontex has realized a continuous organic growth since 2003 (CAGR '03 – ’15 of c. 5%)
• Ontex will continue to grow organically (ca. 4-6% in the future), supported by
– the increased share of private labels in Western Europe
– favorable demographic trends supporting adult incontinence products
– demographic growth and higher adoption rates for hygiene products in emerging markets
– increasing adoption rates in key markets
… and probable
development via
acquisitions
• Ontex has a strong M&A track-record acquiring and successfully integrating amongst other iD in 2010,
Lille in 2011 and Serenity in 2013
• Early November, Ontex announced the acquisition of Grupo Mabe for a consideration of EUR 314 Mio
(EUR 400 Mio including earn out)
– This acquisition is the largest of the group and the first outside Western Europe
– Grupo Mabe reported sales of c.EUR 400 Mio
– The company operates in 11 countries across Americas and is #2 of the babycare market and #3 in
Incontinence in Mexico
– The rationale of the acquisition is in line with the strategic criteria: brands, emerging markets and
incontinence business
– Value creation: high-single digit increase in EPS and ROCE > WACC in year 1
• To finance the Grupo Mabe acquisition, Ontex carried out a capital increase (EUR 191m)
Ontex – A 7.6% stake in a solid, growing Belgian mid-cap
Focus on the growth drivers2
GBL | March 2016
Appendix
32
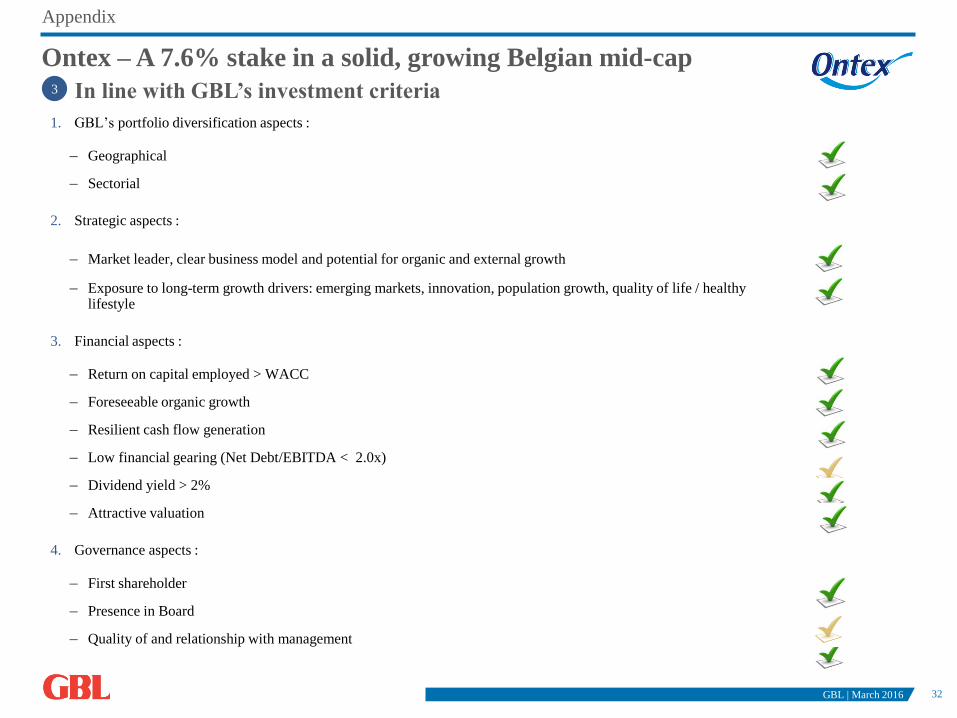
Ontex – A 7.6% stake in a solid, growing Belgian mid-cap
In line with GBL’s investment criteria3
1. GBL’s portfolio diversification aspects :
– Geographical
– Sectorial
2. Strategic aspects :
– Market leader, clear business model and potential for organic and external growth
– Exposure to long-term growth drivers: emerging markets, innovation, population growth, quality of life / healthylifestyle
3. Financial aspects :
– Return on capital employed > WACC
– Foreseeable organic growth
– Resilient cash flow generation
– Low financial gearing (Net Debt/EBITDA < 2.0x)
– Dividend yield > 2%
– Attractive valuation
4. Governance aspects :
– First shareholder
– Presence in Board
– Quality of and relationship with management
GBL | March 2016
Appendix
33
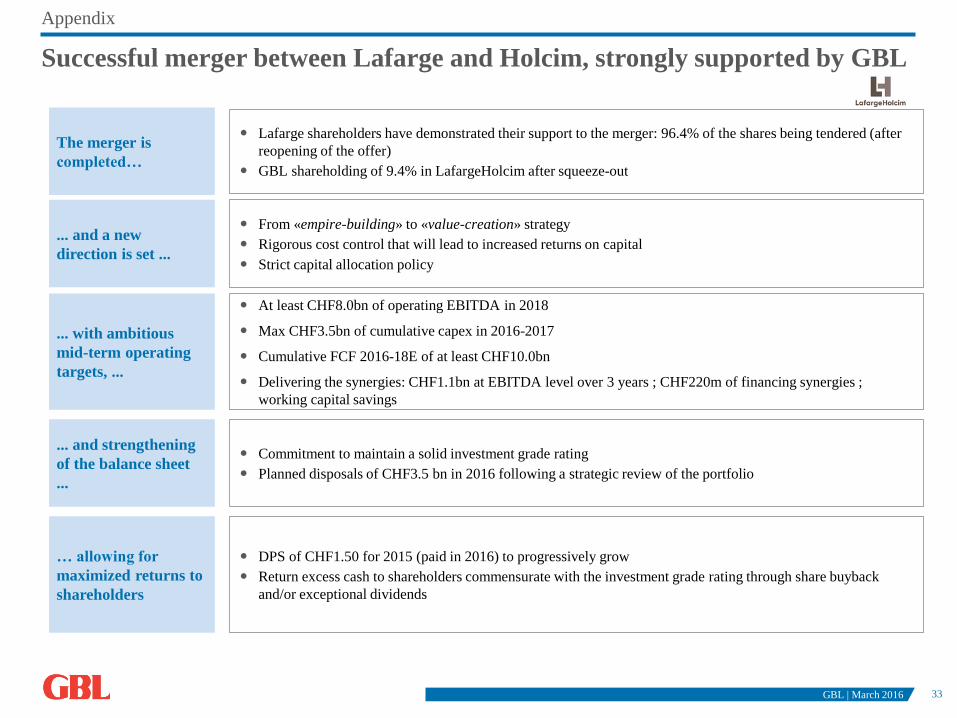
Successful merger between Lafarge and Holcim, strongly supported by GBL
Lafarge shareholders have demonstrated their support to the merger: 96.4% of the shares being tendered (after
reopening of the offer)
GBL shareholding of 9.4% in LafargeHolcim after squeeze-out
The merger is
completed…
... with ambitious
mid-term operating
targets, ...
... and strengthening
of the balance sheet
...
At least CHF8.0bn of operating EBITDA in 2018
Max CHF3.5bn of cumulative capex in 2016-2017
Cumulative FCF 2016-18E of at least CHF10.0bn
Delivering the synergies: CHF1.1bn at EBITDA level over 3 years ; CHF220m of financing synergies ;
working capital savings
Commitment to maintain a solid investment grade rating
Planned disposals of CHF3.5 bn in 2016 following a strategic review of the portfolio
From «empire-building» to «value-creation» strategy
Rigorous cost control that will lead to increased returns on capital
Strict capital allocation policy
... and a new
direction is set ...
DPS of CHF1.50 for 2015 (paid in 2016) to progressively grow
Return excess cash to shareholders commensurate with the investment grade rating through share buyback
and/or exceptional dividends
… allowing for
maximized returns to
shareholders
GBL | March 2016
Appendix
34
Appendix
Profiles – Managing Directors
Earlier in his career, Mr. Gallienne worked at the private equity firm Rhône Group in New York and London. In
2005, he founded and was Managing Director of the private equity funds of Ergon Capital Partners in Brussels. He
has been a Director of Groupe Bruxelles Lambert since 2009 and Managing Director since 2012.
He graduated in Management and Administration, with a major in Finance, from the ESDE Business School in Paris
and obtained an MBA from INSEAD in Fontainebleau.
Mr. Gallienne serves as a Director of Lafarge, Imerys, Pernod Ricard, SGS and Umicore.
Ian Gallienne
Mr. Lamarche began his career at Deloitte Haskins & Sells in Belgium and in the Netherlands. He joined Société
Générale de Belgique as an investment manager and management controller from 1989 to 1995. He moved to
Compagnie Financière de Suez as Advisor to the Chairman and Secretary of the Executive Committee (1995-1997)
before becoming Deputy Director for Planning, Control and Accounting. In 2000, Gérard Lamarche joined NALCO
(American subsidiary of the Suez Group and world leader in industrial water treatment) as Director, Senior
Executive Vice President and CFO. In January 2003, he was appointed CFO of the Suez group.
Mr. Lamarche has a degree in Economics from the University of Louvain-La-Neuve and the INSEAD Institute of
Management (Advanced Management Program for Suez Group Executives).
Gérard Lamarche is on the board of several other quoted and non-quoted companies in Europe including Total, SGS,
Lafarge and Legrand.
Gérard Lamarche
GBL | March 2016
35
This presentation has been prepared exclusively for information purposes. Recipient of this presentation may not reproduce, redistribute
or pass on, in whole or in part, this presentation to any person.
This presentation has not been reviewed or registered with any public authority or stock exchange. Persons into whose possession this
presentation come are required to inform themselves about and to comply with all applicable laws and regulations in force in any
jurisdiction in or from which it invests or receives or possesses this presentation.
Prospective investors are required to make their own independent investigations and appraisals of GBL before taking any investment
decision with respect to securities of GBL.
GBL does not make any representation or warranty (expressed or implied) as to the accuracy or completeness of the information
contained in this document and as to the accuracy of the projections, estimates, assumptions and figures contained in this document. By
receipt of this document, the recipient agrees that GBL (or either of its shareholders, directors or employees) shall have no liability for
any misstatement or omission or fact or any opinion expressed herein, nor for the consequences of any reliance upon any statement,
conclusion or opinion contained herein.
By using or retaining a copy hereof, user and/or retainer hereby acknowledge, agree and accept that they have read this disclaimer and
agreed to be bound by it.
GBL | March 2016