Ipd occupiers test sept 2011
18
On the pulse of the property world An Introduction to IPD Occupiers September 2011
-
Upload
andrewhawkeswood -
Category
Real Estate
-
view
828 -
download
0
Transcript of Ipd occupiers test sept 2011
On the
pulse of
the
property
world
An Introduction to IPD Occupiers
September 2011

© IPDwww.ipd.com
On the pulse of
the property world
Figures stated
are %
difference
from IPD
benchmark
Costs +10% above
benchmark in Red
Costs -10% above
benchmark in Green
About IPD
IPD (Investment Property Databank) is the world leader in performance analysis for
the property industry with more than $1.3 trillion of real estate under measurement
Our approach:
• Clear standardised definitions ensure consistency and comparability across
portfolios, countries and regions
• Independence – no participation in investment markets or consultancy on
investment decisions or other real estate issues
• Confidentiality of commercially sensitive information on individual properties,
investment portfolios and businesses
• Use of primary data delivered by our clients
© IPDwww.ipd.com
On the pulse of
the property world
Figures stated
are %
difference
from IPD
benchmark
Costs +10% above
benchmark in Red
Costs -10% above
benchmark in Green
• IPD Occupiers collects and analyses estates with over 70,000
properties - over 60 million sq metres – annually
• Data is collected direct from clients not from suppliers
• Data is mapped and validated to ensure like for like comparisons.
• Create special interest groups (R&D Space, European Banking
and Utility) to establish best practices and create a greater
understanding of real estate performance to meet the business
strategy
• IPD Occupiers give clients a balanced view of performance
IPD Occupiers

© IPDwww.ipd.com
On the pulse of
the property world
Figures stated
are %
difference
from IPD
benchmark
Costs +10% above
benchmark in Red
Costs -10% above
benchmark in Green
Clients of IPD Occupiers

© IPDwww.ipd.com
On the pulse of
the property world
Figures stated
are %
difference
from IPD
benchmark
Costs +10% above
benchmark in Red
Costs -10% above
benchmark in Green
R&D companies
UK:
France:
© IPDwww.ipd.com
On the pulse of
the property world
Figures stated
are %
difference
from IPD
benchmark
Costs +10% above
benchmark in Red
Costs -10% above
benchmark in GreenSep-11
IPD occupiers global estate
measurement standards (GEMS)
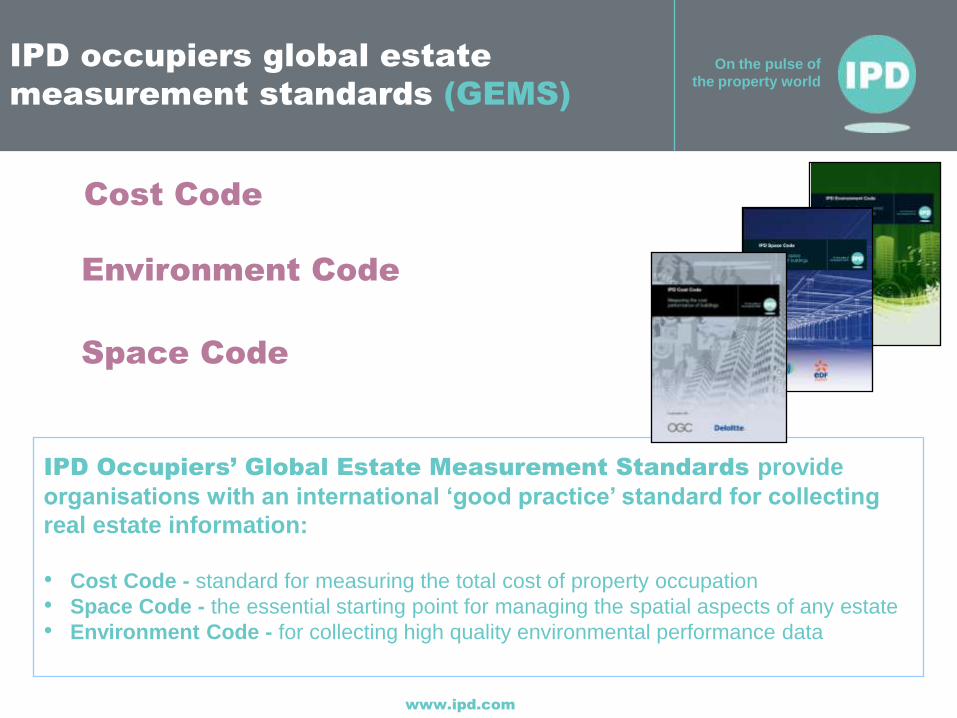
IPD Occupiers’ Global Estate Measurement Standards provide
organisations with an international ‘good practice’ standard for collecting
real estate information:
• Cost Code - standard for measuring the total cost of property occupation
• Space Code - the essential starting point for managing the spatial aspects of any estate
• Environment Code - for collecting high quality environmental performance data
Cost Code
Space Code
Environment Code
© IPDwww.ipd.com
On the pulse of
the property world
Figures stated
are %
difference
from IPD
benchmark
Costs +10% above
benchmark in Red
Costs -10% above
benchmark in Green
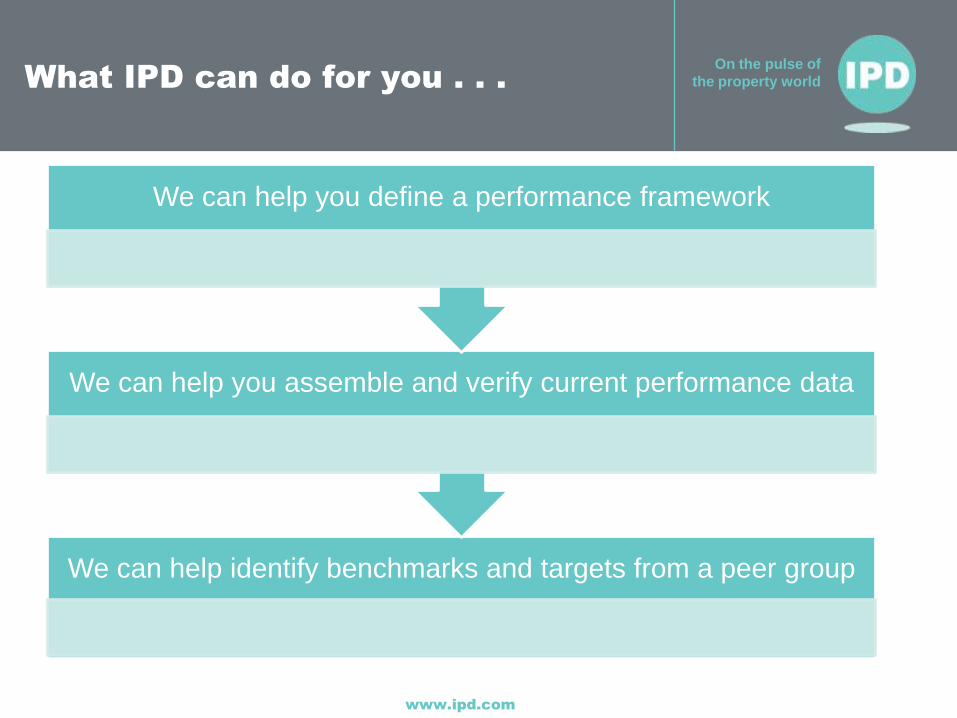
We can help identify benchmarks and targets from a peer group
We can help you assemble and verify current performance data
We can help you define a performance framework
What IPD can do for you . . .
Sep-11
© IPDwww.ipd.com
On the pulse of
the property world
Figures stated
are %
difference
from IPD
benchmark
Costs +10% above
benchmark in Red
Costs -10% above
benchmark in Green
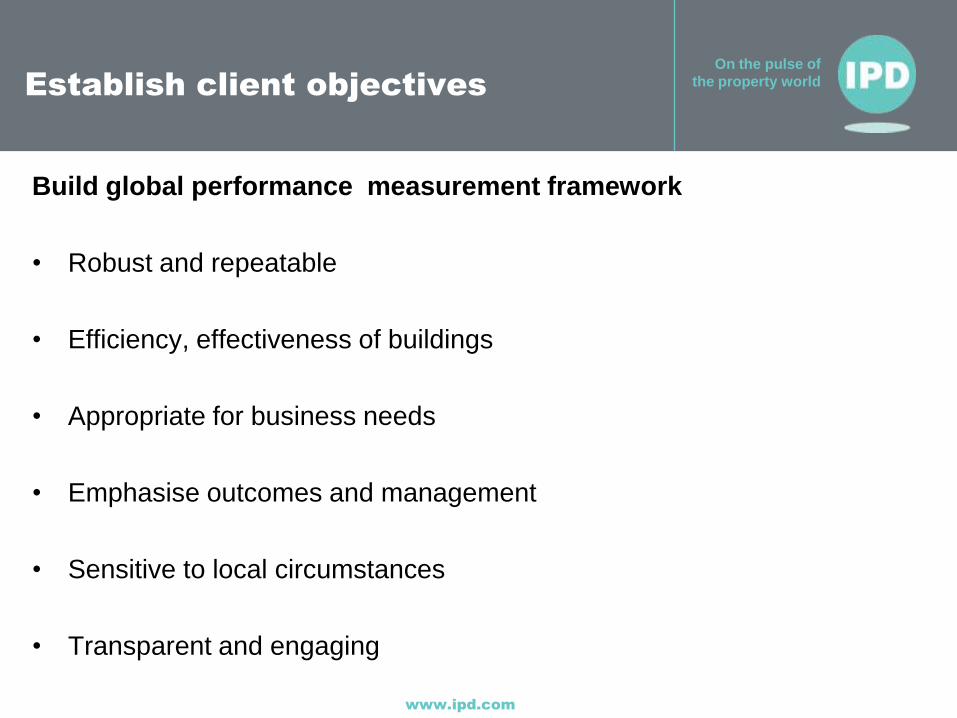
Build global performance measurement framework
• Robust and repeatable
• Efficiency, effectiveness of buildings
• Appropriate for business needs
• Emphasise outcomes and management
• Sensitive to local circumstances
• Transparent and engaging
Establish client objectives
Sep-11
© IPDwww.ipd.com
On the pulse of
the property world
Figures stated
are %
difference
from IPD
benchmark
Costs +10% above
benchmark in Red
Costs -10% above
benchmark in Green
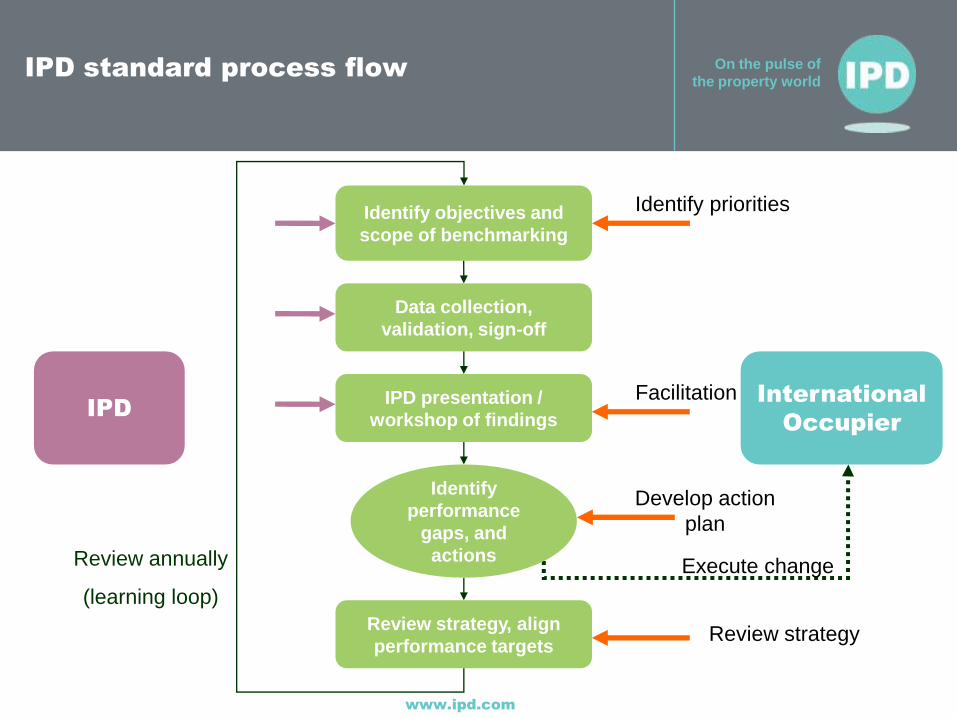
IPD standard process flow
Sep-11
Identify objectives and
scope of benchmarking
Data collection,
validation, sign-off
IPD presentation /
workshop of findings
Review strategy, align
performance targets
International
OccupierIPD
Identify
performance
gaps, and
actionsExecute change
Develop action
plan
Facilitation
Review strategy
Identify priorities
Review annually
(learning loop)
© IPDwww.ipd.com
On the pulse of
the property world
Figures stated
are %
difference
from IPD
benchmark
Costs +10% above
benchmark in Red
Costs -10% above
benchmark in Green
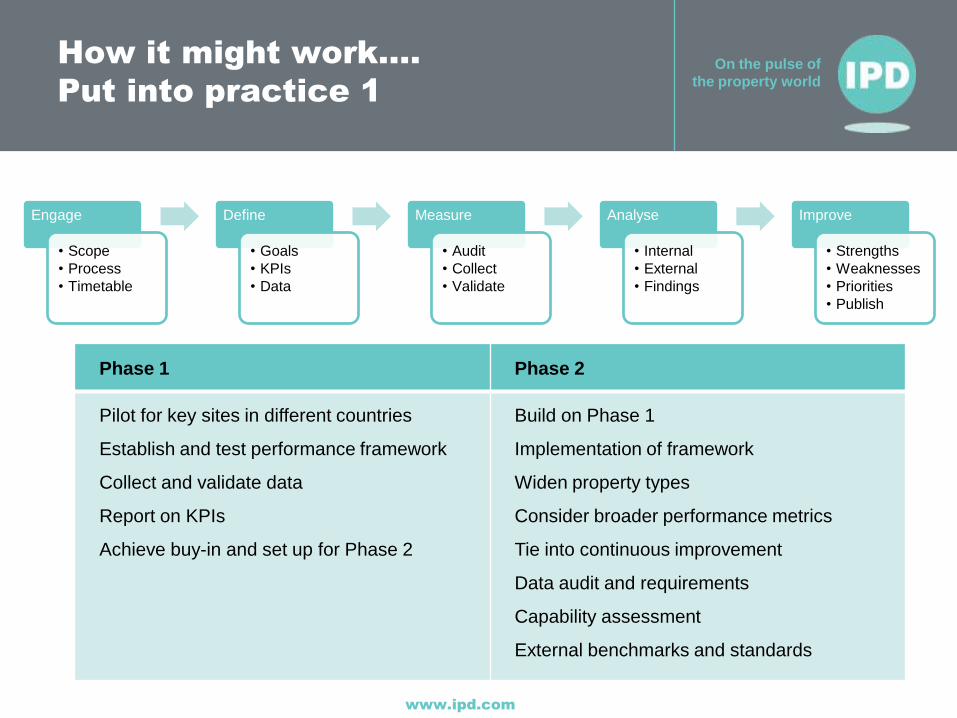
How it might work….
Put into practice 1
Sep-11
Engage
• Scope
• Process
• Timetable
Define
• Goals
• KPIs
• Data
Measure
• Audit
• Collect
• Validate
Analyse
• Internal
• External
• Findings
Improve
• Strengths
• Weaknesses
• Priorities
• Publish
Phase 1 Phase 2
Pilot for key sites in different countries
Establish and test performance framework
Collect and validate data
Report on KPIs
Achieve buy-in and set up for Phase 2
Build on Phase 1
Implementation of framework
Widen property types
Consider broader performance metrics
Tie into continuous improvement
Data audit and requirements
Capability assessment
External benchmarks and standards
© IPDwww.ipd.com
On the pulse of
the property world
Figures stated
are %
difference
from IPD
benchmark
Costs +10% above
benchmark in Red
Costs -10% above
benchmark in Green
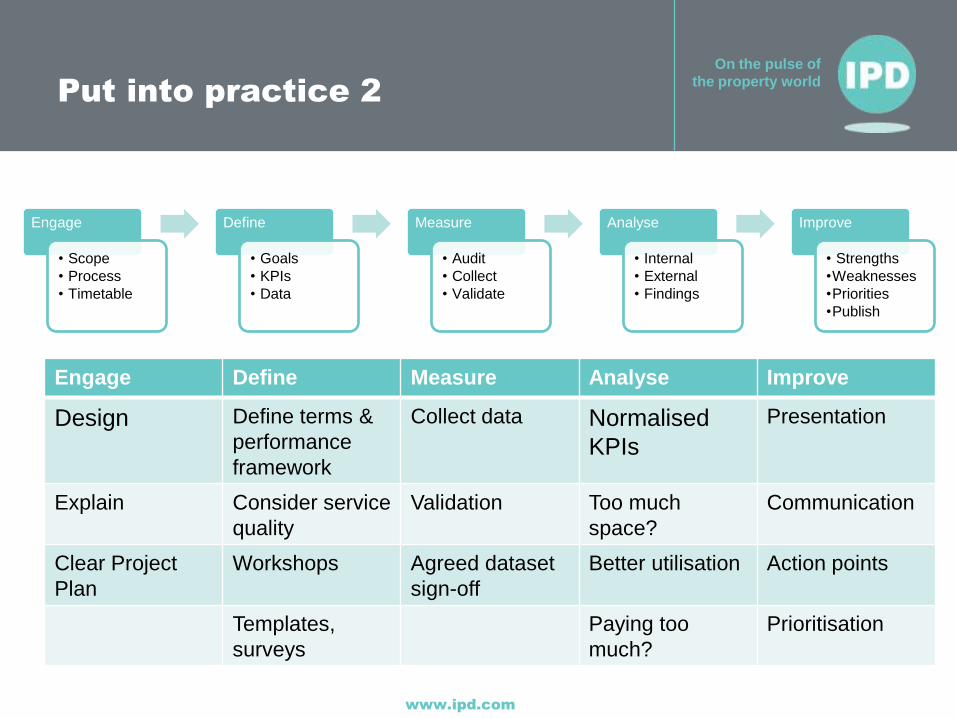
Put into practice 2
Sep-11
Engage
• Scope
• Process
• Timetable
Define
• Goals
• KPIs
• Data
Measure
• Audit
• Collect
• Validate
Analyse
• Internal
• External
• Findings
Improve
• Strengths
•Weaknesses
•Priorities
•Publish
Engage Define Measure Analyse Improve
Design Define terms &
performance
framework
Collect data Normalised
KPIs
Presentation
Explain Consider service
quality
Validation Too much
space?
Communication
Clear Project
Plan
Workshops Agreed dataset
sign-off
Better utilisation Action points
Templates,
surveys
Paying too
much?
Prioritisation
© IPDwww.ipd.com
On the pulse of
the property world
Figures stated
are %
difference
from IPD
benchmark
Costs +10% above
benchmark in Red
Costs -10% above
benchmark in Green
Annual Benchmarking Service
Sep-11
www.ipd.com
On the pulse of
the property world
Workstation provision ratio
(wkstn/fte)
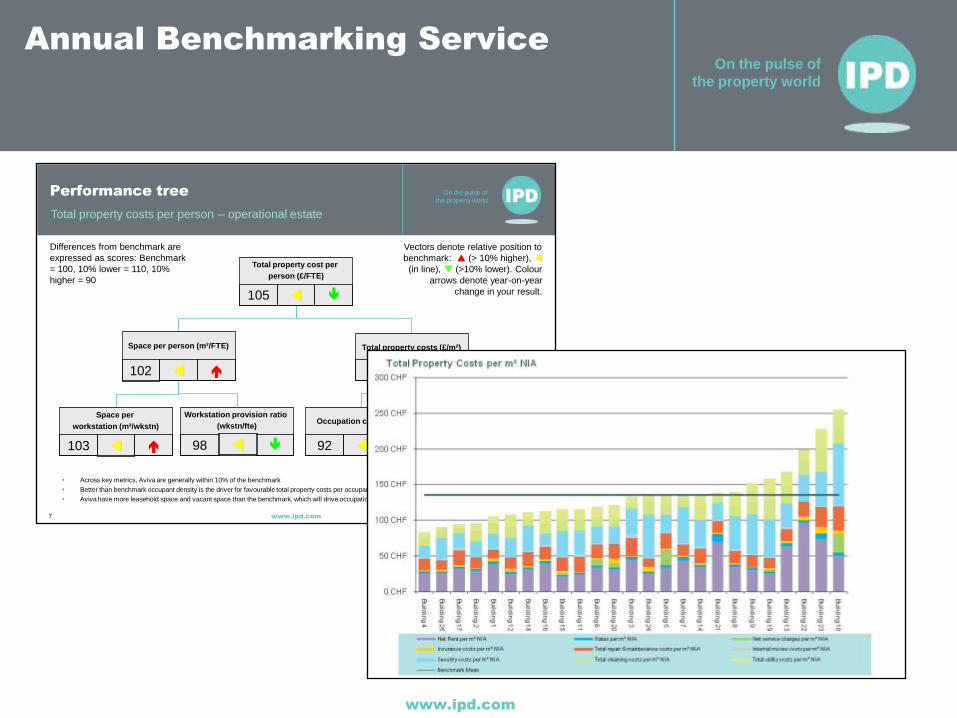
Performance tree
Differences from benchmark are
expressed as scores: Benchmark
= 100, 10% lower = 110, 10%
higher = 90
Total property costs per person – operational estate
Vectors denote relative position to
benchmark: p (> 10% higher), t
(in line), q (>10% lower). Colour
arrows denote year-on-year
change in your result.
Total property cost per
person (£/FTE)
105
Space per person (m²/FTE)
102
Total property costs (£/m²)
91 t
Space per
workstation (m²/wkstn)
103 t 98
Occupation costs (£/m²)
92 t
Operation costs (£/m²)
96 t
t
t
t
• Across key metrics, Aviva are generally within 10% of the benchmark
• Better than benchmark occupant density is the driver for favourable total property costs per occupant
• Aviva have more leasehold space and vacant space than the benchmark, which will drive occupation and operation costs higher t han benchmark
7
© IPDwww.ipd.com
On the pulse of
the property world
Figures stated
are %
difference
from IPD
benchmark
Costs +10% above
benchmark in Red
Costs -10% above
benchmark in Green
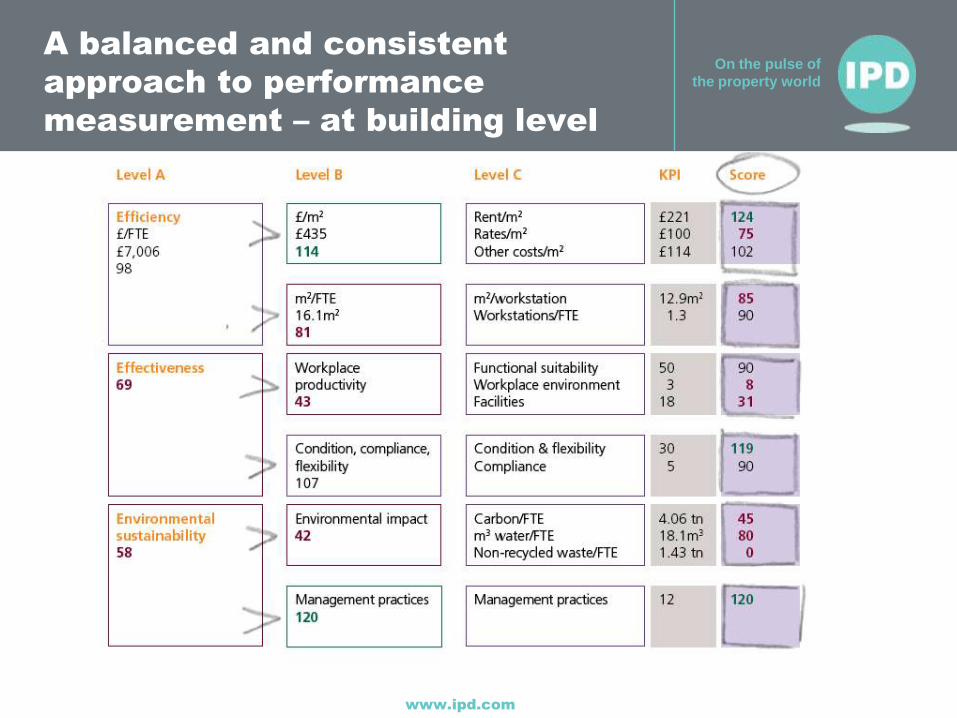
A balanced and consistent
approach to performance
measurement – at building level
Sep-11
© IPDwww.ipd.com
On the pulse of
the property world
Figures stated
are %
difference
from IPD
benchmark
Costs +10% above
benchmark in Red
Costs -10% above
benchmark in Green
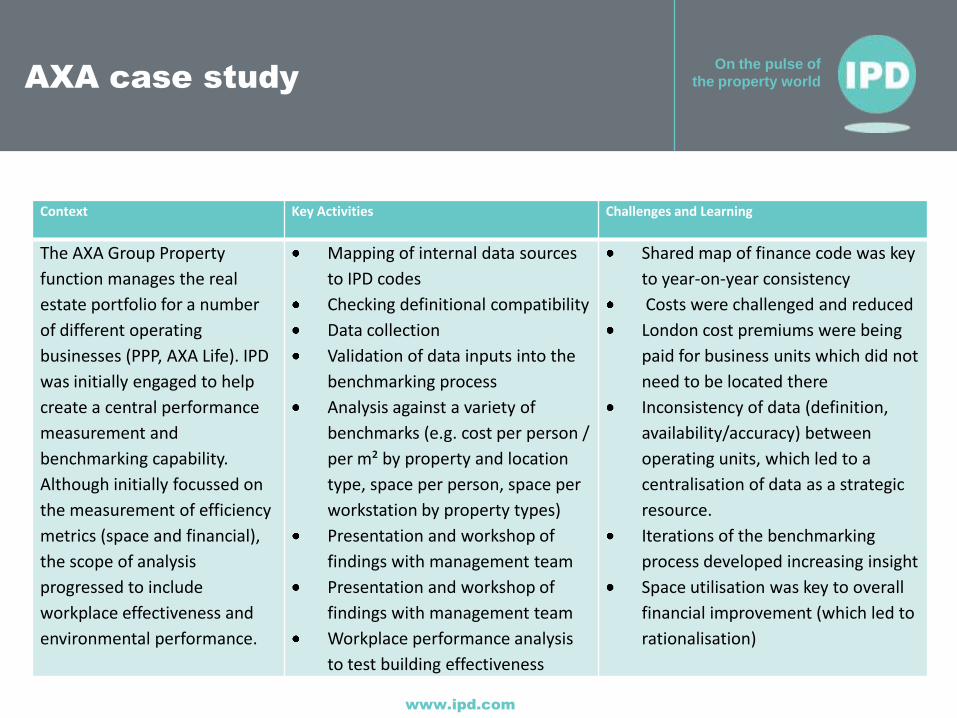
AXA case study
Context Key Activities Challenges and Learning
The AXA Group Property
function manages the real
estate portfolio for a number
of different operating
businesses (PPP, AXA Life). IPD
was initially engaged to help
create a central performance
measurement and
benchmarking capability.
Although initially focussed on
the measurement of efficiency
metrics (space and financial),
the scope of analysis
progressed to include
workplace effectiveness and
environmental performance.
Mapping of internal data sources
to IPD codes
Checking definitional compatibility
Data collection
Validation of data inputs into the
benchmarking process
Analysis against a variety of
benchmarks (e.g. cost per person /
per m² by property and location
type, space per person, space per
workstation by property types)
Presentation and workshop of
findings with management team
Presentation and workshop of
findings with management team
Workplace performance analysis
to test building effectiveness
Shared map of finance code was key
to year-on-year consistency
Costs were challenged and reduced
London cost premiums were being
paid for business units which did not
need to be located there
Inconsistency of data (definition,
availability/accuracy) between
operating units, which led to a
centralisation of data as a strategic
resource.
Iterations of the benchmarking
process developed increasing insight
Space utilisation was key to overall
financial improvement (which led to
rationalisation)
Sep-11
© IPDwww.ipd.com
On the pulse of
the property world
Figures stated
are %
difference
from IPD
benchmark
Costs +10% above
benchmark in Red
Costs -10% above
benchmark in Green
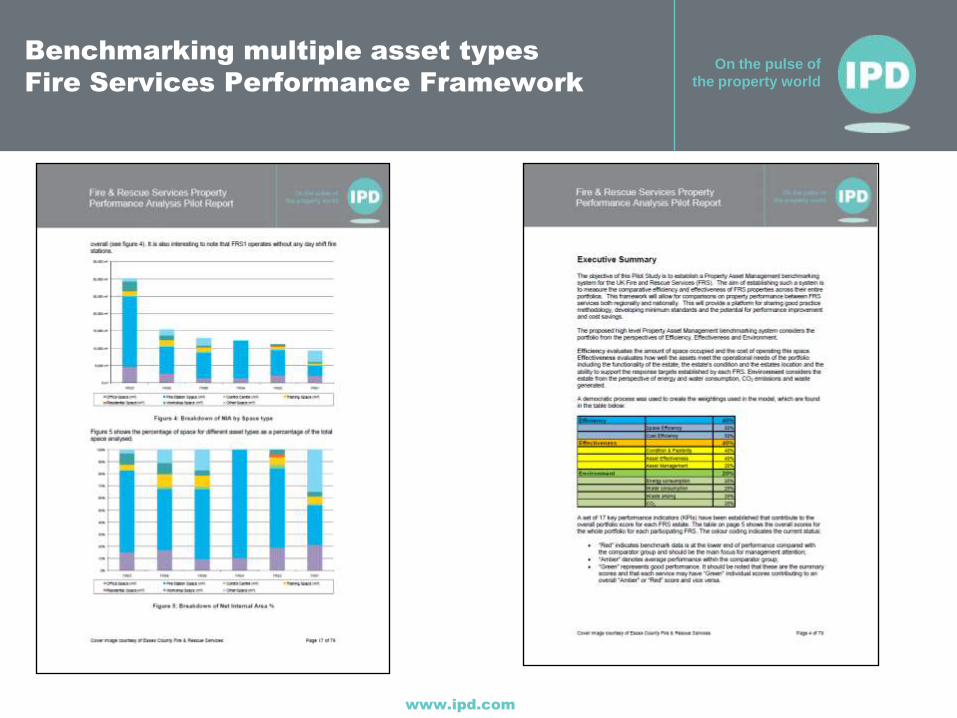
Benchmarking multiple asset types
Fire Services Performance Framework
Sep-11
© IPDwww.ipd.com
On the pulse of
the property world
Figures stated
are %
difference
from IPD
benchmark
Costs +10% above
benchmark in Red
Costs -10% above
benchmark in Green
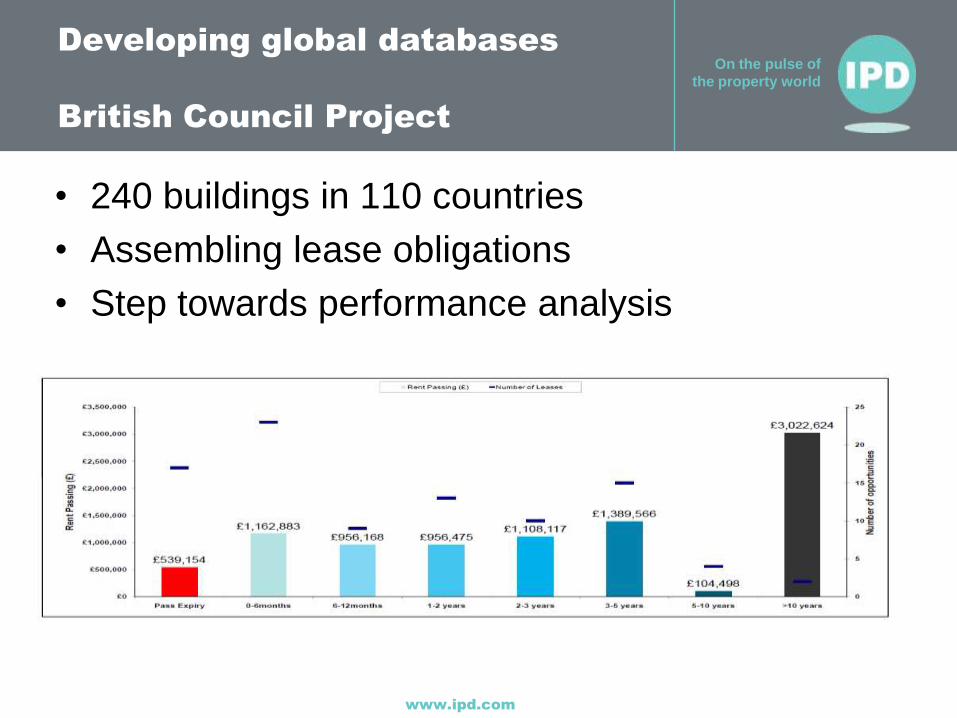
Developing global databases
British Council Project
• 240 buildings in 110 countries
• Assembling lease obligations
• Step towards performance analysis
Sep-11
© IPDwww.ipd.com
On the pulse of
the property world
Figures stated
are %
difference
from IPD
benchmark
Costs +10% above
benchmark in Red
Costs -10% above
benchmark in Green
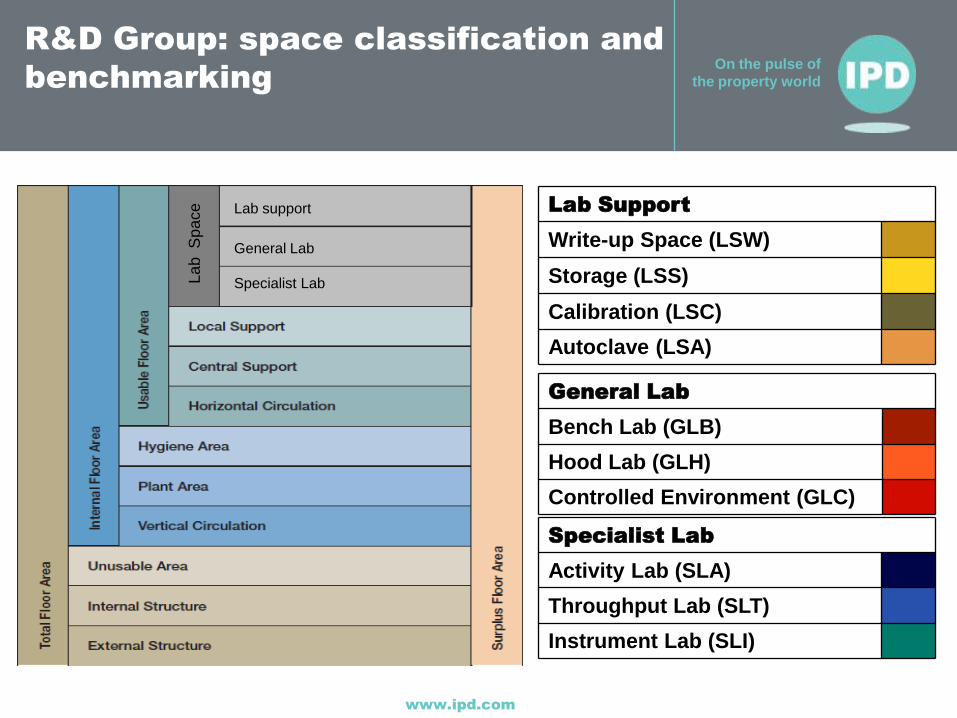
R&D Group: space classification and
benchmarking
Sep-11
La
b S
pa
ce
Lab
Support
General Lab
Specialist Lab
Lab support Lab Support
Write-up Space (LSW)
Storage (LSS)
Calibration (LSC)
Autoclave (LSA)
General Lab
Bench Lab (GLB)
Hood Lab (GLH)
Controlled Environment (GLC)
Specialist Lab
Activity Lab (SLA)
Throughput Lab (SLT)
Instrument Lab (SLI)

On the
pulse of
the
property
world
Andrew Hawkeswood
Email: [email protected]
Tel: +44 (0)779 131 5026
www.ipdoccupiers.com
IPD Occupiers