iomass and nutrient distribution in cacao trees Theobroma ...
78
1 Biomass and nutrient distribution in cacao trees ( Theobroma cacao): A case study in Cote d’Ivoire MSc Thesis, Plant Production Systems Group Fabián Calvo Romero 2018
Transcript of iomass and nutrient distribution in cacao trees Theobroma ...
1
Biomass and nutrient distribution in cacao trees (Theobroma cacao): A case study in Cote d’Ivoire
MSc Thesis, Plant Production Systems Group
Fabián Calvo Romero 2018
2
Biomass and nutrient distribution in cacao trees (Theobroma cacao): A case study in Cote d’Ivoire
MSc Thesis, Plant Production System Name: Fabián Calvo Romero Student ID: 910603154030 Study: MSc Plant Sciences – Specialization Natural Resources Management Supervisors: Dr. Ir. Maja Slingerland, PhD. Lotte Woittiez Chair group: Plant Production Systems Course code: PPS80442 Date: June 2018 Examiner: Prof.Dr. Ken Giller Disclaimer: This thesis report is part of an education program and hence might still contain (minor) inaccuracies and errors. Correct citation: Calvo Romero, F., 2018, Biomass and nutrient distribution in cacao trees (Theobroma cacao): A case study in Ivory Coast., MSc Thesis Wageningen University, XX p. Contact [email protected] for access to data, models and scripts used for the analysis
3
Contents 1 Acknowledgment .......................................................................................................................... 4
2 Abstract ......................................................................................................................................... 5
3 Introduction ................................................................................................................................... 6
4 Materials and methods ................................................................................................................ 10
4.1 Study area ............................................................................................................................ 10
4.2 Selection of study plots and management history ............................................................... 10
4.3 Selection of cacao plants ..................................................................................................... 11
4.4 Characteristics of the studied plots ...................................................................................... 11
4.5 Harvest and processing of cacao tree .................................................................................. 14
4.6 Statistical analysis ............................................................................................................... 18
4.7 Measured and calculated variables ...................................................................................... 18
5 Results......................................................................................................................................... 21
5.1 Structural parameters ........................................................................................................... 21
5.2 Biomass quantification and distribution of cacao trees of four different ages .................... 22
5.3 Allometric equations for biomass prediction ...................................................................... 24
5.4 Effect of leaf position within the canopy on leaf morphological parameters ..................... 25
5.5 Wood density of different branch orders ............................................................................. 26
5.6 Nutrient content of cacao tree organs .................................................................................. 27
5.7 Nutrient content of leaves of different categories ............................................................... 30
5.8 Comparison of the nutrient content of cacao tree components between four different tree
ages. 33
5.9 Non-destructive leaf measurements for nutrient content determination ............................. 36
5.10 Comparison between destructive and non-destructive measurements to determine the
nutrient content of wood in cacao trees ......................................................................................... 37
5.11 Nutrient distribution in cacao trees of four age categories .............................................. 38
6 Discussion ................................................................................................................................... 41
6.1 Structural parameters and biomass distribution .................................................................. 41
6.2 Biomass prediction, allometric relations ............................................................................. 41
6.3 Leaf position in the canopy affect leaf morphology ............................................................ 42
6.4 Nutrient content and distribution ......................................................................................... 42
6.5 Non-destructive methods to determine nutrient content of plant components .................... 44
6.6 Wood density ....................................................................................................................... 45
6.7 Leaf optimal nutrient content .............................................................................................. 44
7 Conclusions................................................................................................................................. 46
8 References ................................................................................................................................... 47
9 Annex ..............................................................................................................................................

4
1 Acknowledgment
This study would not have been possible without the collaboration of many people coming from very different backgrounds. First of all, I think I had the best supervisors ever, thank you Maja, Lotte, Emmanuel Kassin and Jiska for your feedback and guidance. Also, I would like to deeply acknowledge my team in Ivory Coast, special regards to Nassis and Innocent for their technical assistance and friendship. As well, thanks to all the people in Ivory Coast, who opened me the doors of their houses and shared their food with me, you made this experience amazing. Finally, thanks to Ata, my mom Carolina and my dad Warner for their in conditional support, always. Pura Vida, Fabián
5
2 Abstract The mineral nutrition of cacao agro-ecosystems is a key factors for achieving potential yields. Therefore, there is a need to quantify and understand the total cacao tree nutrient requirements. This study was carried out in coordination with CNRA (Centre National de Recherche Agronomique) in Divo, Ivory Coast. We investigated the distribution of biomass and nutrients in cocoa tree components. We harvested and measured a total of 12 cacao trees of four age classes. We found that management practices such as pruning have a great effect on biomass distribution. In fact, the fraction of dry matter allocated to leaves and branches decreased, stem increased, and roots was maintained in relation to total biomass with increasing tree age. In our study, for all tree age classes, the greatest contribution to total biomass was branches > roots > leaves > stem. Also, we developed allometric relations. We found that the best predictor for tree components biomass and total biomass was stem diameter. We noticed, that recyclable plant components have a higher nutrient content, like leaves and pods, whereas less recyclable components like stem, branches and woody roots, a lower content. Also, the order of nutrient concentration is component specific. We found mobilization of N, P and K from older to younger leaves which lead to concentration of Ca and Mg in senescing leaves. Also, the highest amount of N was found in the beans and newly produced leaves, and K in the pods. Leaf position in the canopy had a significant effect on leaf thickness, and SPAD units but did not affected leaf nitrogen content. Based in our findings, the use of a SPAD meter do not stands as a promising option to determine leaf N content on cacao trees. On the other hand, the use of an increment borer arises as an option for wood nutrient estimation. Finally, we determined that the wood density of six branch orders was constant of about 0.41 g/cm3. Our results have implication for modelling purposes relating growth, biomass and nutrient allocation in cacao trees. Currently, our research is the most complete study on biomass and nutrient distribution in cacao trees.
6
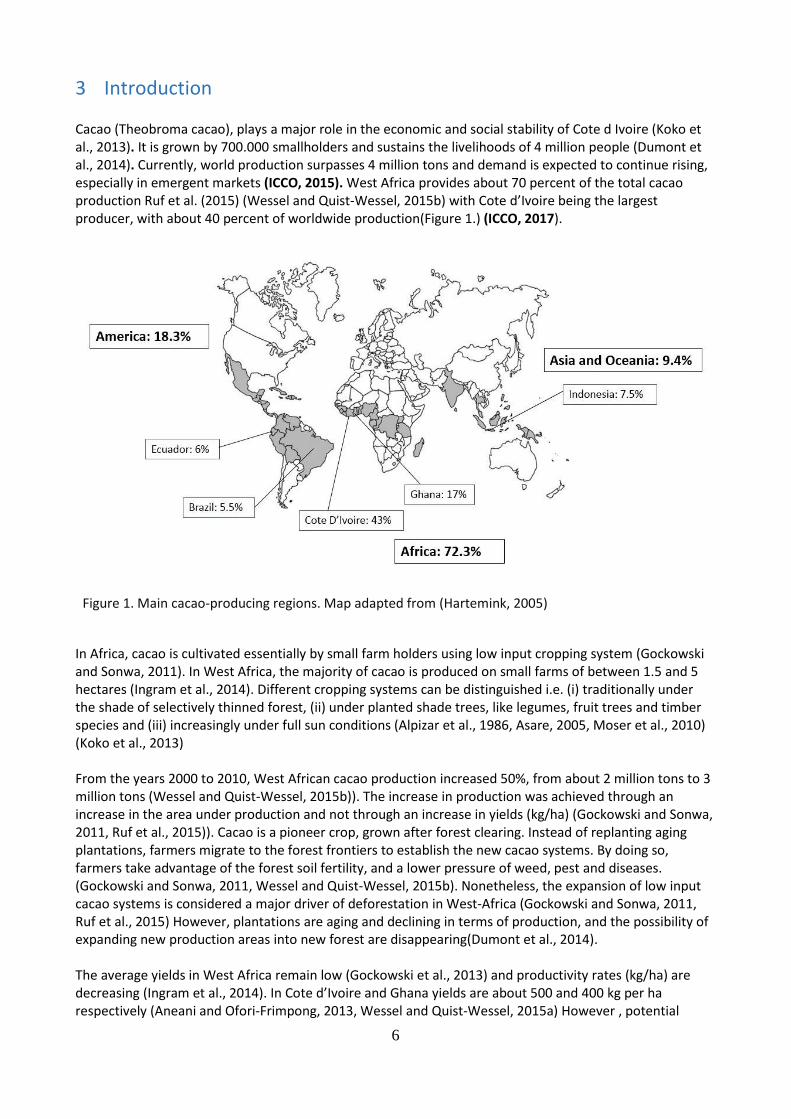
3 Introduction Cacao (Theobroma cacao), plays a major role in the economic and social stability of Cote d Ivoire (Koko et al., 2013). It is grown by 700.000 smallholders and sustains the livelihoods of 4 million people (Dumont et al., 2014). Currently, world production surpasses 4 million tons and demand is expected to continue rising, especially in emergent markets (ICCO, 2015). West Africa provides about 70 percent of the total cacao production Ruf et al. (2015) (Wessel and Quist-Wessel, 2015b) with Cote d’Ivoire being the largest producer, with about 40 percent of worldwide production(Figure 1.) (ICCO, 2017).
Figure 1. Main cacao-producing regions. Map adapted from (Hartemink, 2005)
In Africa, cacao is cultivated essentially by small farm holders using low input cropping system (Gockowski and Sonwa, 2011). In West Africa, the majority of cacao is produced on small farms of between 1.5 and 5 hectares (Ingram et al., 2014). Different cropping systems can be distinguished i.e. (i) traditionally under the shade of selectively thinned forest, (ii) under planted shade trees, like legumes, fruit trees and timber species and (iii) increasingly under full sun conditions (Alpizar et al., 1986, Asare, 2005, Moser et al., 2010) (Koko et al., 2013) From the years 2000 to 2010, West African cacao production increased 50%, from about 2 million tons to 3 million tons (Wessel and Quist-Wessel, 2015b)). The increase in production was achieved through an increase in the area under production and not through an increase in yields (kg/ha) (Gockowski and Sonwa, 2011, Ruf et al., 2015)). Cacao is a pioneer crop, grown after forest clearing. Instead of replanting aging plantations, farmers migrate to the forest frontiers to establish the new cacao systems. By doing so, farmers take advantage of the forest soil fertility, and a lower pressure of weed, pest and diseases. (Gockowski and Sonwa, 2011, Wessel and Quist-Wessel, 2015b). Nonetheless, the expansion of low input cacao systems is considered a major driver of deforestation in West-Africa (Gockowski and Sonwa, 2011, Ruf et al., 2015) However, plantations are aging and declining in terms of production, and the possibility of expanding new production areas into new forest are disappearing(Dumont et al., 2014). The average yields in West Africa remain low (Gockowski et al., 2013) and productivity rates (kg/ha) are decreasing (Ingram et al., 2014). In Cote d’Ivoire and Ghana yields are about 500 and 400 kg per ha respectively (Aneani and Ofori-Frimpong, 2013, Wessel and Quist-Wessel, 2015a) However , potential
7
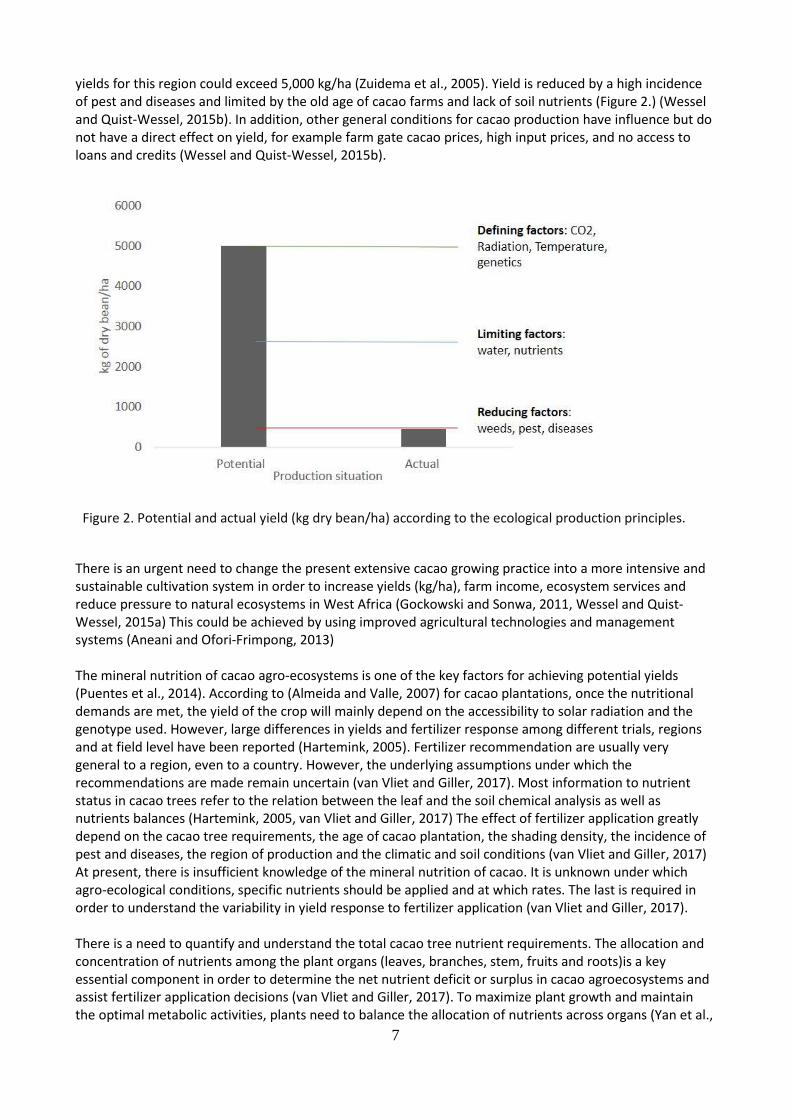
yields for this region could exceed 5,000 kg/ha (Zuidema et al., 2005). Yield is reduced by a high incidence of pest and diseases and limited by the old age of cacao farms and lack of soil nutrients (Figure 2.) (Wessel and Quist-Wessel, 2015b). In addition, other general conditions for cacao production have influence but do not have a direct effect on yield, for example farm gate cacao prices, high input prices, and no access to loans and credits (Wessel and Quist-Wessel, 2015b).
Figure 2. Potential and actual yield (kg dry bean/ha) according to the ecological production principles.
There is an urgent need to change the present extensive cacao growing practice into a more intensive and sustainable cultivation system in order to increase yields (kg/ha), farm income, ecosystem services and reduce pressure to natural ecosystems in West Africa (Gockowski and Sonwa, 2011, Wessel and Quist-Wessel, 2015a) This could be achieved by using improved agricultural technologies and management systems (Aneani and Ofori-Frimpong, 2013) The mineral nutrition of cacao agro-ecosystems is one of the key factors for achieving potential yields (Puentes et al., 2014). According to (Almeida and Valle, 2007) for cacao plantations, once the nutritional demands are met, the yield of the crop will mainly depend on the accessibility to solar radiation and the genotype used. However, large differences in yields and fertilizer response among different trials, regions and at field level have been reported (Hartemink, 2005). Fertilizer recommendation are usually very general to a region, even to a country. However, the underlying assumptions under which the recommendations are made remain uncertain (van Vliet and Giller, 2017). Most information to nutrient status in cacao trees refer to the relation between the leaf and the soil chemical analysis as well as nutrients balances (Hartemink, 2005, van Vliet and Giller, 2017) The effect of fertilizer application greatly depend on the cacao tree requirements, the age of cacao plantation, the shading density, the incidence of pest and diseases, the region of production and the climatic and soil conditions (van Vliet and Giller, 2017) At present, there is insufficient knowledge of the mineral nutrition of cacao. It is unknown under which agro-ecological conditions, specific nutrients should be applied and at which rates. The last is required in order to understand the variability in yield response to fertilizer application (van Vliet and Giller, 2017). There is a need to quantify and understand the total cacao tree nutrient requirements. The allocation and concentration of nutrients among the plant organs (leaves, branches, stem, fruits and roots)is a key essential component in order to determine the net nutrient deficit or surplus in cacao agroecosystems and assist fertilizer application decisions (van Vliet and Giller, 2017). To maximize plant growth and maintain the optimal metabolic activities, plants need to balance the allocation of nutrients across organs (Yan et al.,
8
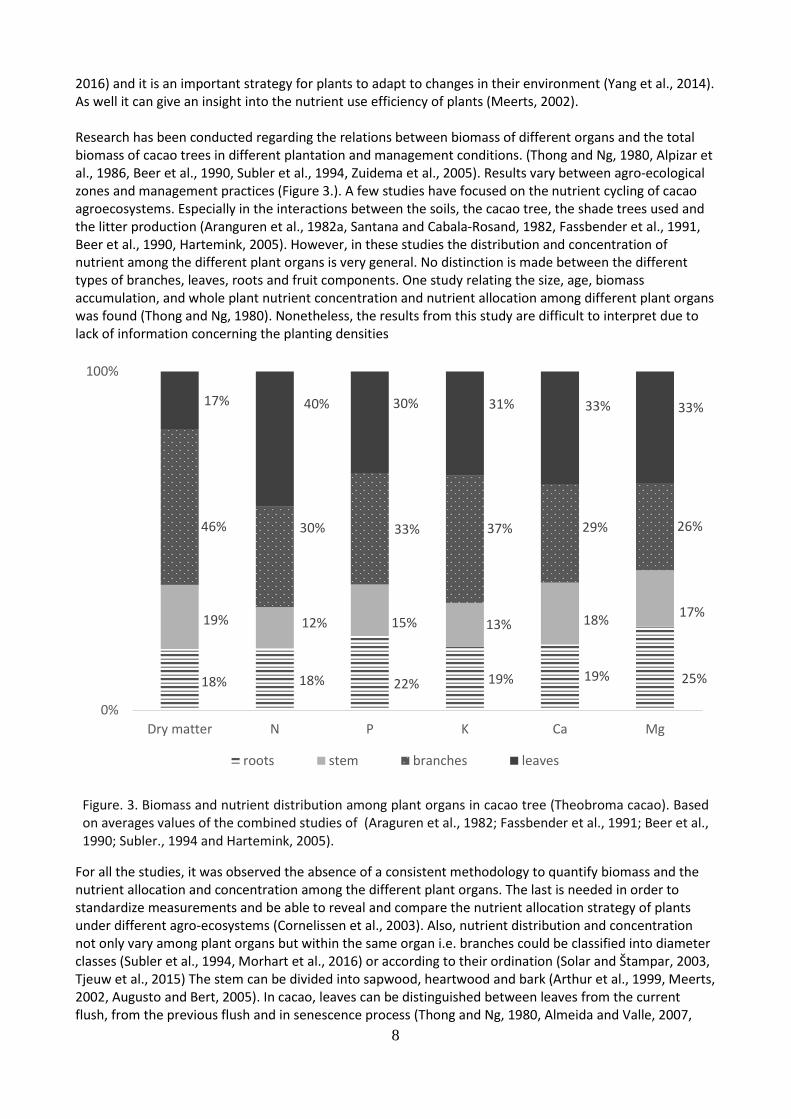
2016) and it is an important strategy for plants to adapt to changes in their environment (Yang et al., 2014). As well it can give an insight into the nutrient use efficiency of plants (Meerts, 2002). Research has been conducted regarding the relations between biomass of different organs and the total biomass of cacao trees in different plantation and management conditions. (Thong and Ng, 1980, Alpizar et al., 1986, Beer et al., 1990, Subler et al., 1994, Zuidema et al., 2005). Results vary between agro-ecological zones and management practices (Figure 3.). A few studies have focused on the nutrient cycling of cacao agroecosystems. Especially in the interactions between the soils, the cacao tree, the shade trees used and the litter production (Aranguren et al., 1982a, Santana and Cabala-Rosand, 1982, Fassbender et al., 1991, Beer et al., 1990, Hartemink, 2005). However, in these studies the distribution and concentration of nutrient among the different plant organs is very general. No distinction is made between the different types of branches, leaves, roots and fruit components. One study relating the size, age, biomass accumulation, and whole plant nutrient concentration and nutrient allocation among different plant organs was found (Thong and Ng, 1980). Nonetheless, the results from this study are difficult to interpret due to lack of information concerning the planting densities
Figure. 3. Biomass and nutrient distribution among plant organs in cacao tree (Theobroma cacao). Based on averages values of the combined studies of (Araguren et al., 1982; Fassbender et al., 1991; Beer et al., 1990; Subler., 1994 and Hartemink, 2005).
For all the studies, it was observed the absence of a consistent methodology to quantify biomass and the nutrient allocation and concentration among the different plant organs. The last is needed in order to standardize measurements and be able to reveal and compare the nutrient allocation strategy of plants under different agro-ecosystems (Cornelissen et al., 2003). Also, nutrient distribution and concentration not only vary among plant organs but within the same organ i.e. branches could be classified into diameter classes (Subler et al., 1994, Morhart et al., 2016) or according to their ordination (Solar and Štampar, 2003, Tjeuw et al., 2015) The stem can be divided into sapwood, heartwood and bark (Arthur et al., 1999, Meerts, 2002, Augusto and Bert, 2005). In cacao, leaves can be distinguished between leaves from the current flush, from the previous flush and in senescence process (Thong and Ng, 1980, Almeida and Valle, 2007,
18% 18% 22% 19% 19% 25%
19% 12% 15% 13% 18%17%
46% 30% 33% 37% 29% 26%
17% 40% 30% 31% 33% 33%
0%
100%
Dry matter N P K Ca Mg
roots stem branches leaves
9
Bouvet and Melun, 2013). Cacao pods can be separated into husk and beans (Thong and Ng, 1980)(Thong et al., 1978;(Alpizar et al., 1986). Finally, roots can be divided into coarse root, lateral roots and fine roots (Aranguren et al., 1982a, Alpizar et al., 1986, Nygren et al., 2013) Information on biomass production and nutrient partitioning within the biomass is important for the selection and management of trees for improved productivity and efficient nutrient and carbon cycling in cacao production systems (Dossa et al., 2008a) This study will provide important basis for the description of cacao tree structure, and give an insight on the nutrient resource allocation among different plant organs and within the same organ (stem, branches, leaves, pods, and roots ). This information could be required in experimental and modelling studies dealing with cacao agro-ecosystems such as nutrient cycling. Also, the results will serve as a basis for appropriate nutrient management recommendations for cacao agro-ecosystems.
Main research questions
1. How is the overall biomass distributed among cacao tree components (leaves, stem and branches,
roots)?
2. What are the nutrient contents of cacao tree components?
3. Does nutrient distribution among cacao tree components change with tree age?
Research Sub-questions
Which structural and physiological parameters could be used to predict, through allometric equations,
plant organ biomass and total biomass in cacao trees?
What is the effect of leaf position in the canopy on leaf size and thickness (estimated using parameters
such as Specific Leaf Area (SLA), and leaf content of nitrogen and other nutrients?
What is the nutritional content of leaves of different ages? e.g. leaves from the current flush, leaves
from the previous flush and senescencing leaves.
Can non-destructive measurements be used to determine the nutrient content of plant organs in cacao
trees? For instance, is it possible to develop a calibration curve between leaf SPAD units and N or Mg
content? Can an increment borer be used to estimate accurately the nutrient content of wood?
The aim of this research is to:
Generate a protocol to determine the biomass and nutrient distribution in cacao trees, including
destructive and nondestructive methods.
Quantify and compare the biomass, the nutrient allocation and concentration in cacao trees
between tree of four different physiological ages (1.5, 5, 10 and 19 years old trees).
10
4 Materials and methods 4.1 Study area
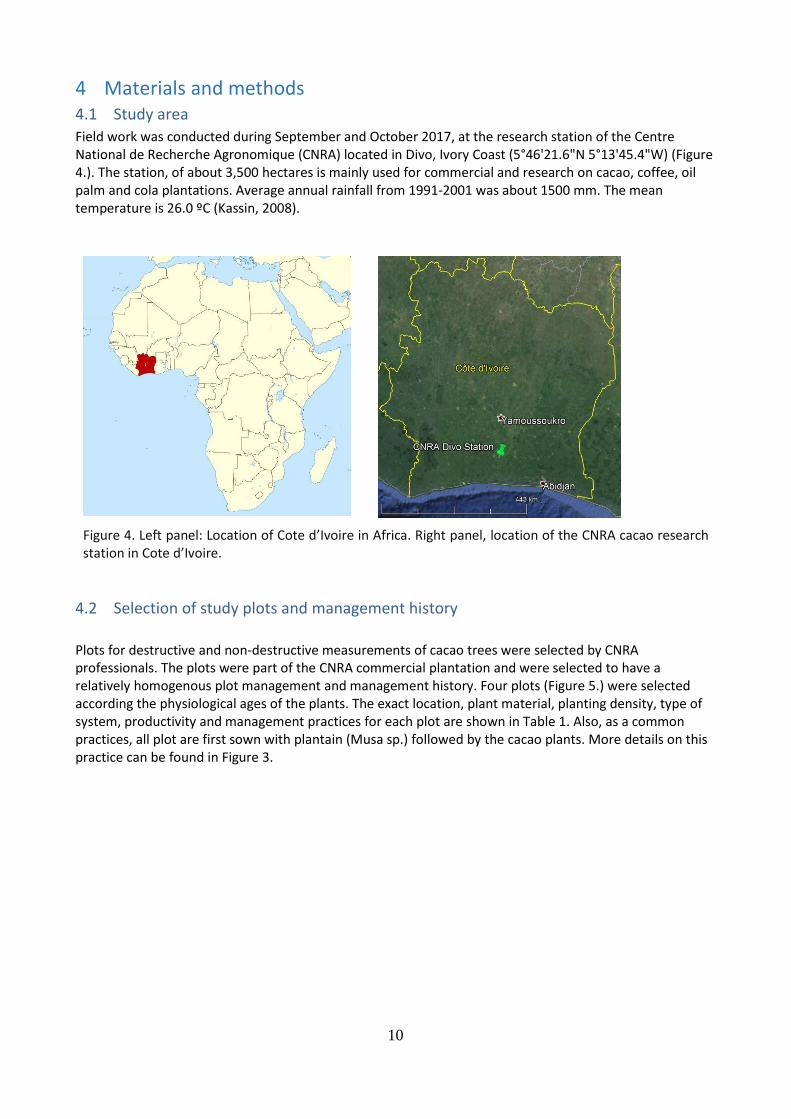
Field work was conducted during September and October 2017, at the research station of the Centre National de Recherche Agronomique (CNRA) located in Divo, Ivory Coast (5°46'21.6"N 5°13'45.4"W) (Figure 4.). The station, of about 3,500 hectares is mainly used for commercial and research on cacao, coffee, oil palm and cola plantations. Average annual rainfall from 1991-2001 was about 1500 mm. The mean temperature is 26.0 ºC (Kassin, 2008).
Figure 4. Left panel: Location of Cote d’Ivoire in Africa. Right panel, location of the CNRA cacao research station in Cote d’Ivoire.
4.2 Selection of study plots and management history
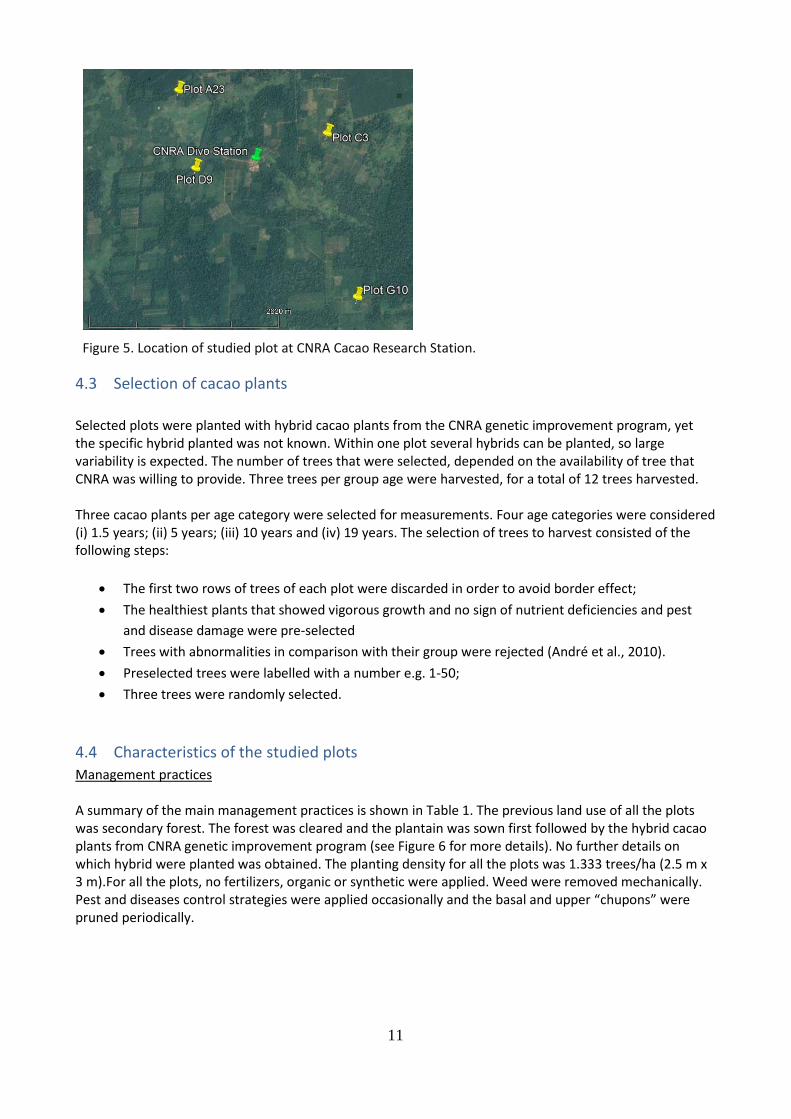
Plots for destructive and non-destructive measurements of cacao trees were selected by CNRA professionals. The plots were part of the CNRA commercial plantation and were selected to have a relatively homogenous plot management and management history. Four plots (Figure 5.) were selected according the physiological ages of the plants. The exact location, plant material, planting density, type of system, productivity and management practices for each plot are shown in Table 1. Also, as a common practices, all plot are first sown with plantain (Musa sp.) followed by the cacao plants. More details on this practice can be found in Figure 3.
11
4.3 Selection of cacao plants
Selected plots were planted with hybrid cacao plants from the CNRA genetic improvement program, yet the specific hybrid planted was not known. Within one plot several hybrids can be planted, so large variability is expected. The number of trees that were selected, depended on the availability of tree that CNRA was willing to provide. Three trees per group age were harvested, for a total of 12 trees harvested. Three cacao plants per age category were selected for measurements. Four age categories were considered (i) 1.5 years; (ii) 5 years; (iii) 10 years and (iv) 19 years. The selection of trees to harvest consisted of the following steps:
The first two rows of trees of each plot were discarded in order to avoid border effect;
The healthiest plants that showed vigorous growth and no sign of nutrient deficiencies and pest
and disease damage were pre-selected
Trees with abnormalities in comparison with their group were rejected (André et al., 2010).
Preselected trees were labelled with a number e.g. 1-50;
Three trees were randomly selected.
4.4 Characteristics of the studied plots
Management practices A summary of the main management practices is shown in Table 1. The previous land use of all the plots was secondary forest. The forest was cleared and the plantain was sown first followed by the hybrid cacao plants from CNRA genetic improvement program (see Figure 6 for more details). No further details on which hybrid were planted was obtained. The planting density for all the plots was 1.333 trees/ha (2.5 m x 3 m).For all the plots, no fertilizers, organic or synthetic were applied. Weed were removed mechanically. Pest and diseases control strategies were applied occasionally and the basal and upper “chupons” were pruned periodically.
Figure 5. Location of studied plot at CNRA Cacao Research Station.
12
Table 1. Study plots and management history
Plot Age
(years) Location Type of system Productivity (tones
of dry beans/ha) Observation
A23 1.5 N 05º46´48.4¨ W 005º14´30.0¨
Intercropped with plantain (2.5m x 3m)
0
C3 5 N 05º46´35.2¨ W 005º13´13.1¨
Monocrop a 1 Mortality of cacao plants was around 10% due to water excess in some area
D9 10 N 05º46´12.0¨ W 005º14´13.2¨
Monocrop a 2.5 Prior the plot was a fertilizer experiment. Control plots were the ones used for this study
G10 19 N 05º45´24.9¨ W 005º12´47.3¨
Agroforestry : Shade trees species planted at a distance of 10 m x 10 m (100 shade trees/ha)
1
At the moment of the study, the timber trees were almost totally defoliated
a All plots start as an intercrop with plantain (see Figure 3).
13
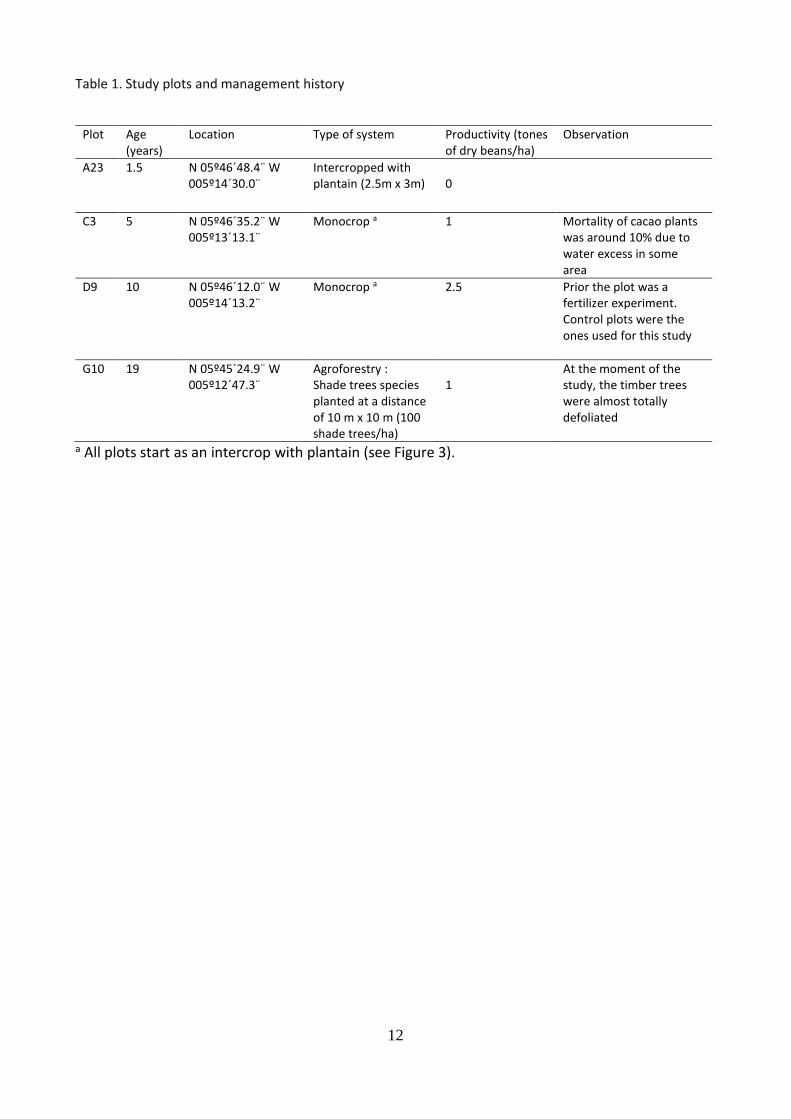
Figure 6. Development of cacao production systems at CNRA. A) Plots A23 (1.5 year), C3 (5years) and D9 (10 years); B) Plot G10 (19 years). Developed by Calvo Romero, F. Based on individual plant drawings from free google images.
14
4.5 Harvest and processing of cacao tree
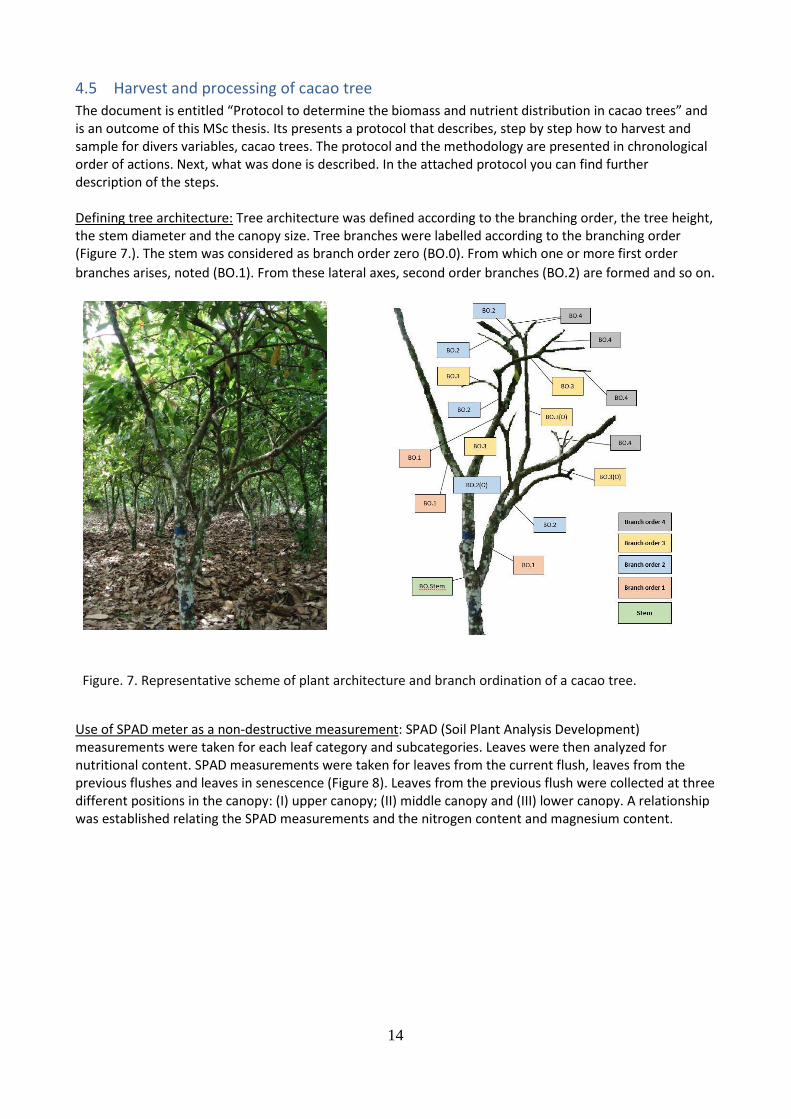
The document is entitled “Protocol to determine the biomass and nutrient distribution in cacao trees” and is an outcome of this MSc thesis. Its presents a protocol that describes, step by step how to harvest and sample for divers variables, cacao trees. The protocol and the methodology are presented in chronological order of actions. Next, what was done is described. In the attached protocol you can find further description of the steps. Defining tree architecture: Tree architecture was defined according to the branching order, the tree height, the stem diameter and the canopy size. Tree branches were labelled according to the branching order (Figure 7.). The stem was considered as branch order zero (BO.0). From which one or more first order
branches arises, noted (BO.1). From these lateral axes, second order branches (BO.2) are formed and so on.
Figure. 7. Representative scheme of plant architecture and branch ordination of a cacao tree.
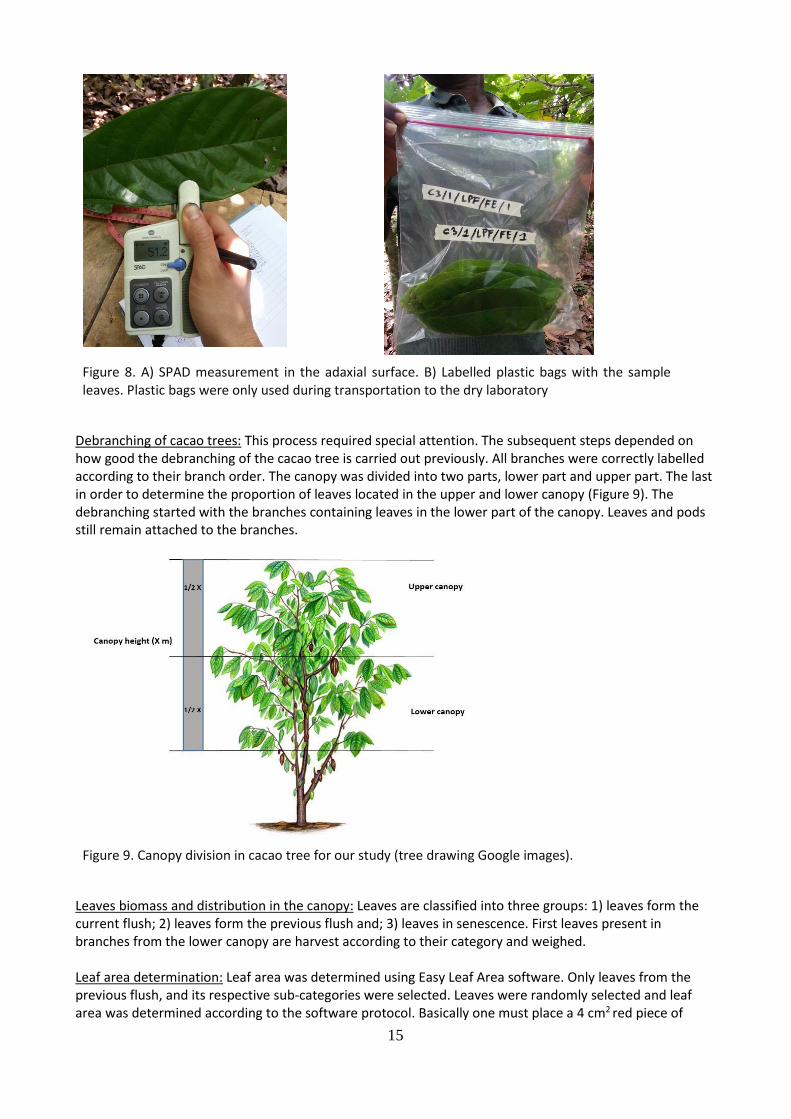
Use of SPAD meter as a non-destructive measurement: SPAD (Soil Plant Analysis Development) measurements were taken for each leaf category and subcategories. Leaves were then analyzed for nutritional content. SPAD measurements were taken for leaves from the current flush, leaves from the previous flushes and leaves in senescence (Figure 8). Leaves from the previous flush were collected at three different positions in the canopy: (I) upper canopy; (II) middle canopy and (III) lower canopy. A relationship was established relating the SPAD measurements and the nitrogen content and magnesium content.
15
Figure 8. A) SPAD measurement in the adaxial surface. B) Labelled plastic bags with the sample leaves. Plastic bags were only used during transportation to the dry laboratory
Debranching of cacao trees: This process required special attention. The subsequent steps depended on how good the debranching of the cacao tree is carried out previously. All branches were correctly labelled according to their branch order. The canopy was divided into two parts, lower part and upper part. The last in order to determine the proportion of leaves located in the upper and lower canopy (Figure 9). The debranching started with the branches containing leaves in the lower part of the canopy. Leaves and pods still remain attached to the branches.
Figure 9. Canopy division in cacao tree for our study (tree drawing Google images).
Leaves biomass and distribution in the canopy: Leaves are classified into three groups: 1) leaves form the current flush; 2) leaves form the previous flush and; 3) leaves in senescence. First leaves present in branches from the lower canopy are harvest according to their category and weighed. Leaf area determination: Leaf area was determined using Easy Leaf Area software. Only leaves from the previous flush, and its respective sub-categories were selected. Leaves were randomly selected and leaf area was determined according to the software protocol. Basically one must place a 4 cm2 red piece of
16
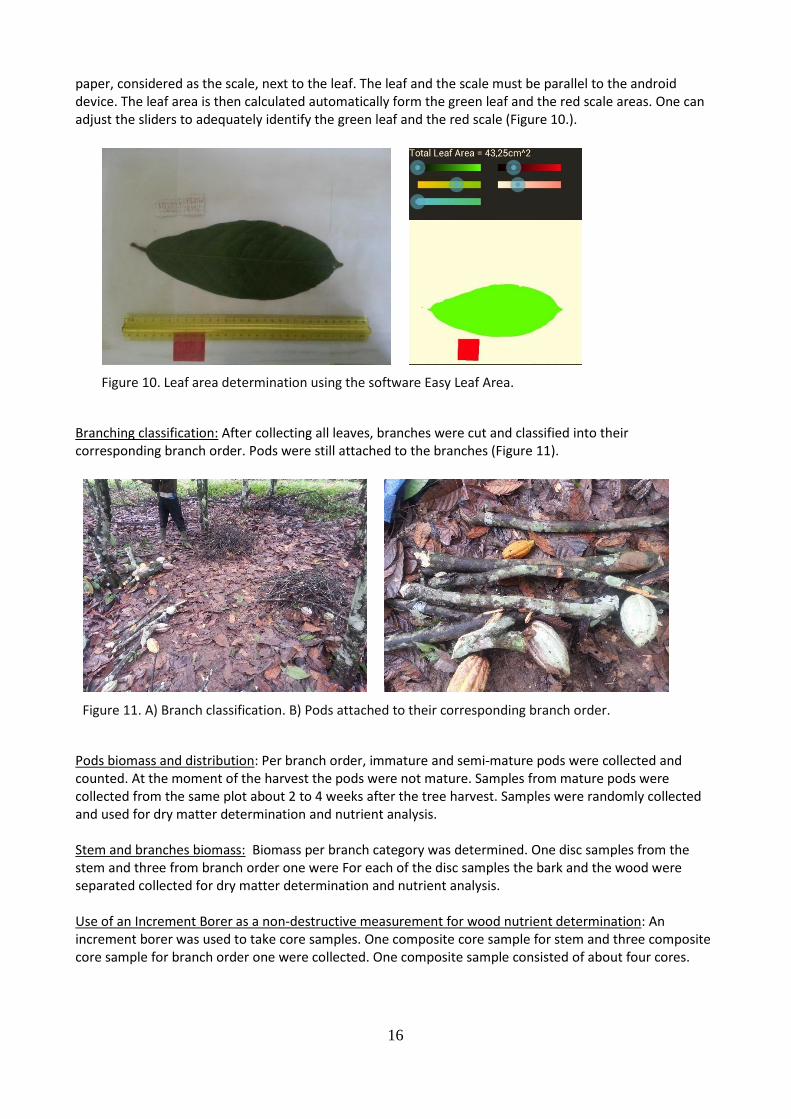
paper, considered as the scale, next to the leaf. The leaf and the scale must be parallel to the android device. The leaf area is then calculated automatically form the green leaf and the red scale areas. One can adjust the sliders to adequately identify the green leaf and the red scale (Figure 10.).
Figure 10. Leaf area determination using the software Easy Leaf Area.
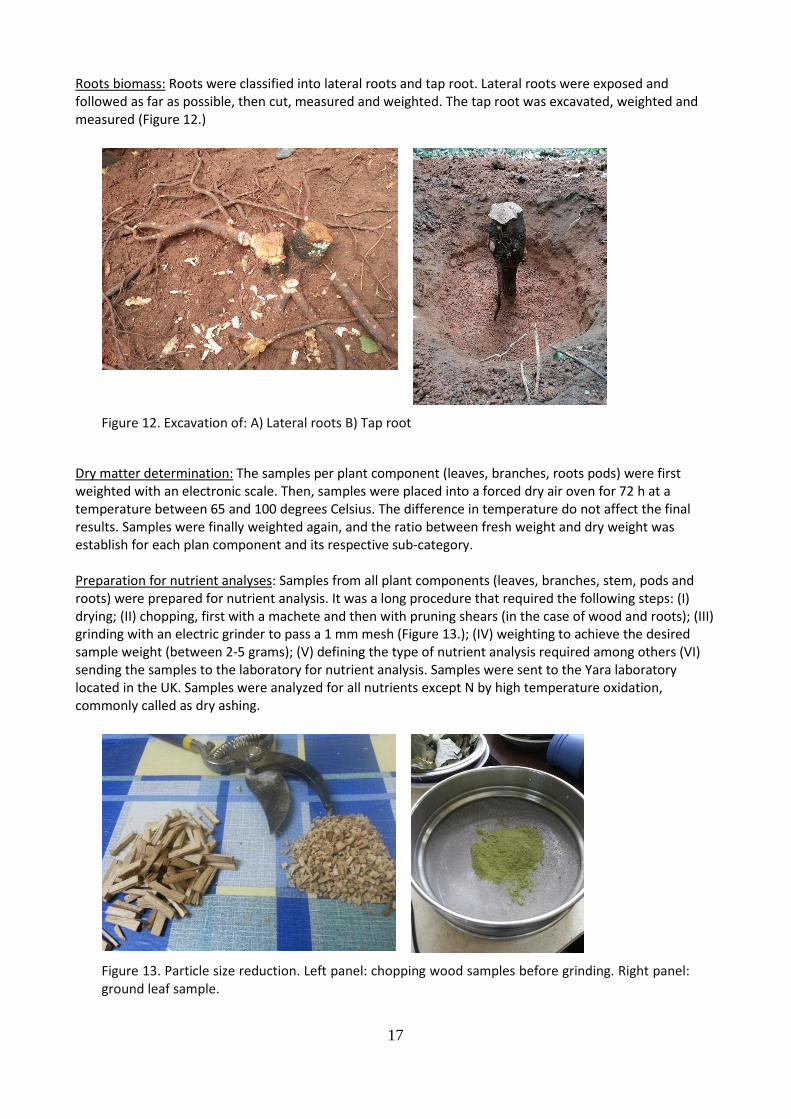
Branching classification: After collecting all leaves, branches were cut and classified into their corresponding branch order. Pods were still attached to the branches (Figure 11).
Figure 11. A) Branch classification. B) Pods attached to their corresponding branch order.
Pods biomass and distribution: Per branch order, immature and semi-mature pods were collected and counted. At the moment of the harvest the pods were not mature. Samples from mature pods were collected from the same plot about 2 to 4 weeks after the tree harvest. Samples were randomly collected and used for dry matter determination and nutrient analysis. Stem and branches biomass: Biomass per branch category was determined. One disc samples from the stem and three from branch order one were For each of the disc samples the bark and the wood were separated collected for dry matter determination and nutrient analysis. Use of an Increment Borer as a non-destructive measurement for wood nutrient determination: An increment borer was used to take core samples. One composite core sample for stem and three composite core sample for branch order one were collected. One composite sample consisted of about four cores.
17
Roots biomass: Roots were classified into lateral roots and tap root. Lateral roots were exposed and followed as far as possible, then cut, measured and weighted. The tap root was excavated, weighted and measured (Figure 12.)
Figure 12. Excavation of: A) Lateral roots B) Tap root
Dry matter determination: The samples per plant component (leaves, branches, roots pods) were first weighted with an electronic scale. Then, samples were placed into a forced dry air oven for 72 h at a temperature between 65 and 100 degrees Celsius. The difference in temperature do not affect the final results. Samples were finally weighted again, and the ratio between fresh weight and dry weight was establish for each plan component and its respective sub-category. Preparation for nutrient analyses: Samples from all plant components (leaves, branches, stem, pods and roots) were prepared for nutrient analysis. It was a long procedure that required the following steps: (I) drying; (II) chopping, first with a machete and then with pruning shears (in the case of wood and roots); (III) grinding with an electric grinder to pass a 1 mm mesh (Figure 13.); (IV) weighting to achieve the desired sample weight (between 2-5 grams); (V) defining the type of nutrient analysis required among others (VI) sending the samples to the laboratory for nutrient analysis. Samples were sent to the Yara laboratory located in the UK. Samples were analyzed for all nutrients except N by high temperature oxidation, commonly called as dry ashing.
Figure 13. Particle size reduction. Left panel: chopping wood samples before grinding. Right panel: ground leaf sample.
18
4.6 Statistical analysis
All statistical analysis were performed using the statistical software SPSS version 23. Box plots were used to describe structural parameters, biomass distribution and nutrient content of cacao tree components. For the box-plots, extreme outliers (noted with * in the software) were excluded. Analysis of variance (ANOVA) was conducted to determine the effect of leaf position in the canopy on the Specific Leaf Area (SLA) and on the SPAD units. Stepwise regressions were used to develop allometric relations between the independent variable, stem diameter and dependent variables (biomass components and structural parameters). This regression method enter one by one the variables with the lowest p-value, and exclude the ones which their p-value becomes larger than the default limit (set by SPSS). The same method was used to analyses the effect of tree age on tree diameter, tree height, and leaves biomass and stem/branches and roots biomass.
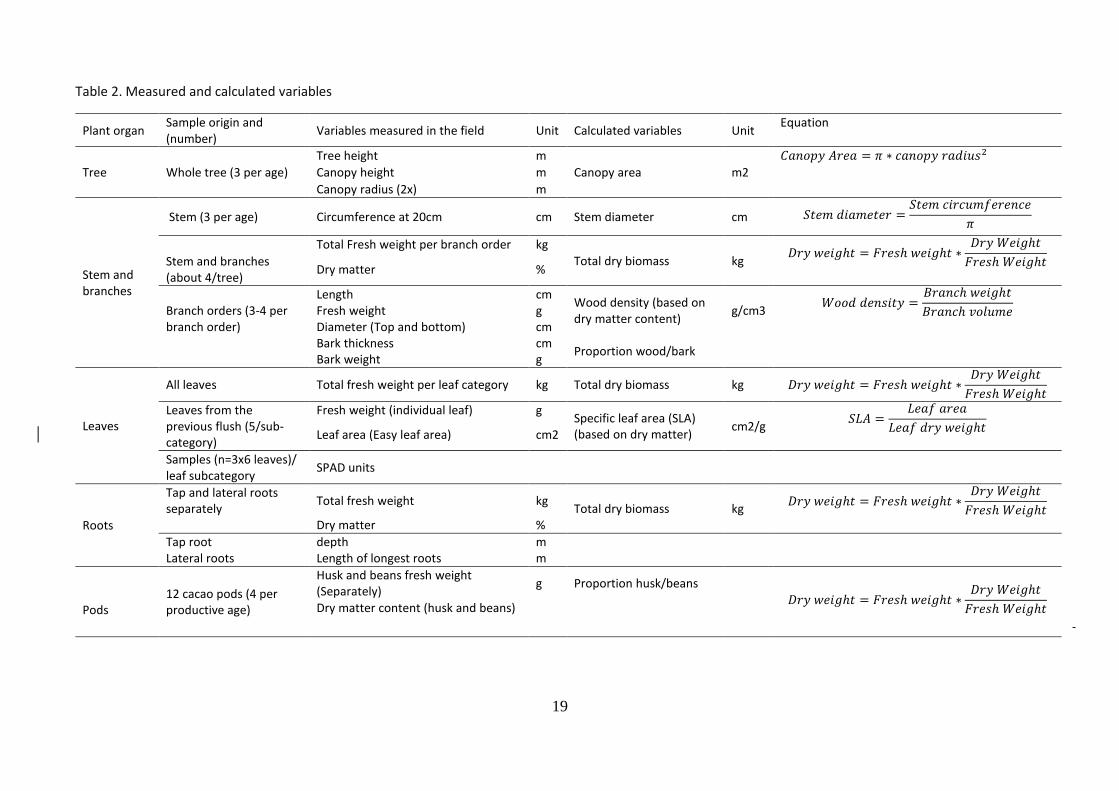
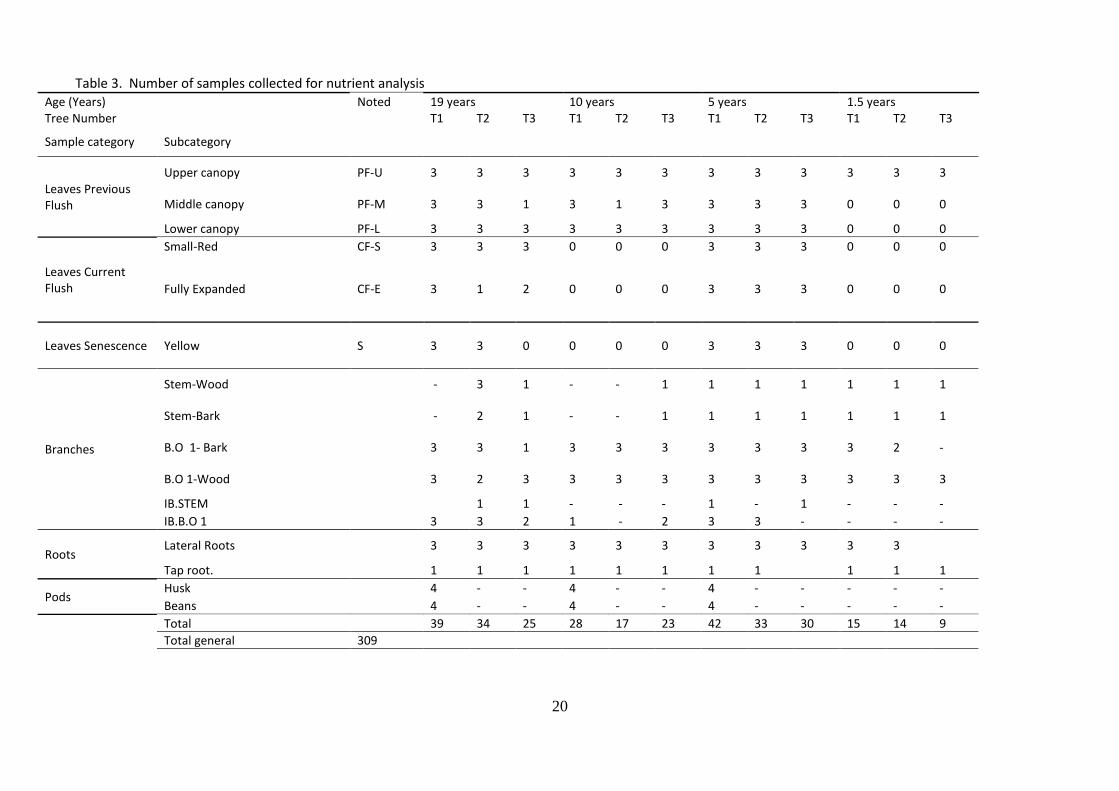
4.7 Measured and calculated variables
During the field work 21 measurements were taken. From these, 10 variables were calculated. Both, measured and calculated variables and respective equations are shown in Table 2. Additionally, the number of nutrient analysis to be performed per plant organ and plant organ sub-category is shown in Table 3. The total number of nutrient analysis was 311 (309 from the samples collected and 2 samples to check consistency of the analysis).
19
Table 2. Measured and calculated variables
Plant organ Sample origin and (number)
Variables measured in the field Unit Calculated variables Unit Equation
Tree
Tree height m
Canopy area m2
𝐶𝑎𝑛𝑜𝑝𝑦 𝐴𝑟𝑒𝑎 = 𝜋 ∗ 𝑐𝑎𝑛𝑜𝑝𝑦 𝑟𝑎𝑑𝑖𝑢𝑠2
Whole tree (3 per age) Canopy height m
Canopy radius (2x) m
Stem and branches
Stem (3 per age) Circumference at 20cm cm Stem diameter cm 𝑆𝑡𝑒𝑚 𝑑𝑖𝑎𝑚𝑒𝑡𝑒𝑟 =𝑆𝑡𝑒𝑚 𝑐𝑖𝑟𝑐𝑢𝑚𝑓𝑒𝑟𝑒𝑛𝑐𝑒
𝜋
Total Fresh weight per branch order kg
Total dry biomass kg 𝐷𝑟𝑦 𝑤𝑒𝑖𝑔ℎ𝑡 = 𝐹𝑟𝑒𝑠ℎ 𝑤𝑒𝑖𝑔ℎ𝑡 ∗
𝐷𝑟𝑦 𝑊𝑒𝑖𝑔ℎ𝑡
𝐹𝑟𝑒𝑠ℎ 𝑊𝑒𝑖𝑔ℎ𝑡
Stem and branches (about 4/tree)
Dry matter %
Branch orders (3-4 per branch order)
Length cm Wood density (based on dry matter content)
g/cm3 𝑊𝑜𝑜𝑑 𝑑𝑒𝑛𝑠𝑖𝑡𝑦 =
𝐵𝑟𝑎𝑛𝑐ℎ 𝑤𝑒𝑖𝑔ℎ𝑡
𝐵𝑟𝑎𝑛𝑐ℎ 𝑣𝑜𝑙𝑢𝑚𝑒
Fresh weight g Diameter (Top and bottom) cm Bark thickness cm
Proportion wood/bark
Bark weight g
Leaves
All leaves Total fresh weight per leaf category kg Total dry biomass kg 𝐷𝑟𝑦 𝑤𝑒𝑖𝑔ℎ𝑡 = 𝐹𝑟𝑒𝑠ℎ 𝑤𝑒𝑖𝑔ℎ𝑡 ∗𝐷𝑟𝑦 𝑊𝑒𝑖𝑔ℎ𝑡
𝐹𝑟𝑒𝑠ℎ 𝑊𝑒𝑖𝑔ℎ𝑡
Leaves from the previous flush (5/sub-category)
Fresh weight (individual leaf) g Specific leaf area (SLA) (based on dry matter)
cm2/g 𝑆𝐿𝐴 =
𝐿𝑒𝑎𝑓 𝑎𝑟𝑒𝑎
𝐿𝑒𝑎𝑓 𝑑𝑟𝑦 𝑤𝑒𝑖𝑔ℎ𝑡
Leaf area (Easy leaf area) cm2
Samples (n=3x6 leaves)/ leaf subcategory
SPAD units
Roots
Tap and lateral roots separately
Total fresh weight kg Total dry biomass kg
𝐷𝑟𝑦 𝑤𝑒𝑖𝑔ℎ𝑡 = 𝐹𝑟𝑒𝑠ℎ 𝑤𝑒𝑖𝑔ℎ𝑡 ∗𝐷𝑟𝑦 𝑊𝑒𝑖𝑔ℎ𝑡
𝐹𝑟𝑒𝑠ℎ 𝑊𝑒𝑖𝑔ℎ𝑡
Dry matter %
Tap root depth m Lateral roots Length of longest roots m
Pods
12 cacao pods (4 per productive age)
Husk and beans fresh weight (Separately)
g Proportion husk/beans
𝐷𝑟𝑦 𝑤𝑒𝑖𝑔ℎ𝑡 = 𝐹𝑟𝑒𝑠ℎ 𝑤𝑒𝑖𝑔ℎ𝑡 ∗𝐷𝑟𝑦 𝑊𝑒𝑖𝑔ℎ𝑡
𝐹𝑟𝑒𝑠ℎ 𝑊𝑒𝑖𝑔ℎ𝑡
Dry matter content (husk and beans)
-
20
Table 3. Number of samples collected for nutrient analysis Age (Years) Noted 19 years 10 years 5 years 1.5 years Tree Number T1 T2 T3 T1 T2 T3 T1 T2 T3 T1 T2 T3
Sample category Subcategory
Leaves Previous Flush
Upper canopy PF-U 3 3 3 3 3 3 3 3 3 3 3 3
Middle canopy PF-M 3 3 1 3 1 3 3 3 3 0 0 0
Lower canopy PF-L 3 3 3 3 3 3 3 3 3 0 0 0
Leaves Current Flush
Small-Red CF-S 3 3 3 0 0 0 3 3 3 0 0 0
Fully Expanded CF-E 3 1 2 0 0 0 3 3 3 0 0 0
Leaves Senescence Yellow S 3 3 0 0 0 0 3 3 3 0 0 0
Branches
Stem-Wood - 3 1 - - 1 1 1 1 1 1 1
Stem-Bark - 2 1 - - 1 1 1 1 1 1 1
B.O 1- Bark 3 3 1 3 3 3 3 3 3 3 2 -
B.O 1-Wood 3 2 3 3 3 3 3 3 3 3 3 3
IB.STEM 1 1 - - - 1 - 1 - - -
IB.B.O 1 3 3 2 1 - 2 3 3 - - - -
Roots Lateral Roots 3 3 3 3 3 3 3 3 3 3 3
Tap root. 1 1 1 1 1 1 1 1 1 1 1
Pods Husk 4 - - 4 - - 4 - - - - -
Beans 4 - - 4 - - 4 - - - - -
Total 39 34 25 28 17 23 42 33 30 15 14 9
Total general 309

5 Results 5.1 Structural parameters
Structural parameters of cacao trees of four different ages are compared in Figure 14. For the variables tree diameter, tree height and canopy height, we observed a significant increase from 1.5 to 5-year-old cacao trees. From 5 to 19 years old cacao trees, the mentioned variables increased marginally, reaching a plateau. This will suggest that the tree diameter, tree height and canopy height are defined mainly in the first five year of growth, then it is stabilized. Canopy area increased linearly with increasing tree age. If we compare tree height and canopy area, this indicates that the tree stabilizes their orthotropic growth but increases the plagiotropic growth of branches. In general, the data is skewed, meaning that the data is not normally distributed among quartiles. This suggest large tree to tree variability within the same age categories.
Figure 14. Structural parameters of cacao trees (1) tree diameter (m); (2) tree height (m); (3) canopy height and (4) canopy area. The median is represented by the line in the box, while the end of the bars at the bottom and the top represents the minimum and maximum values.
22
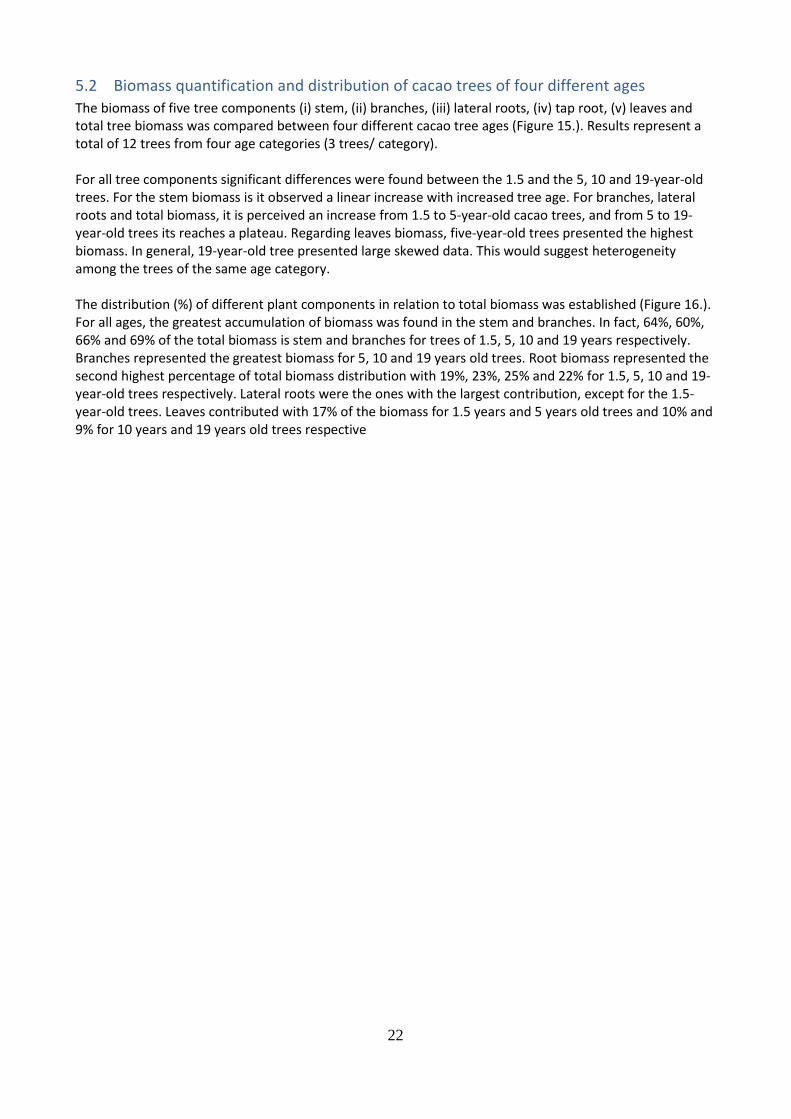
5.2 Biomass quantification and distribution of cacao trees of four different ages
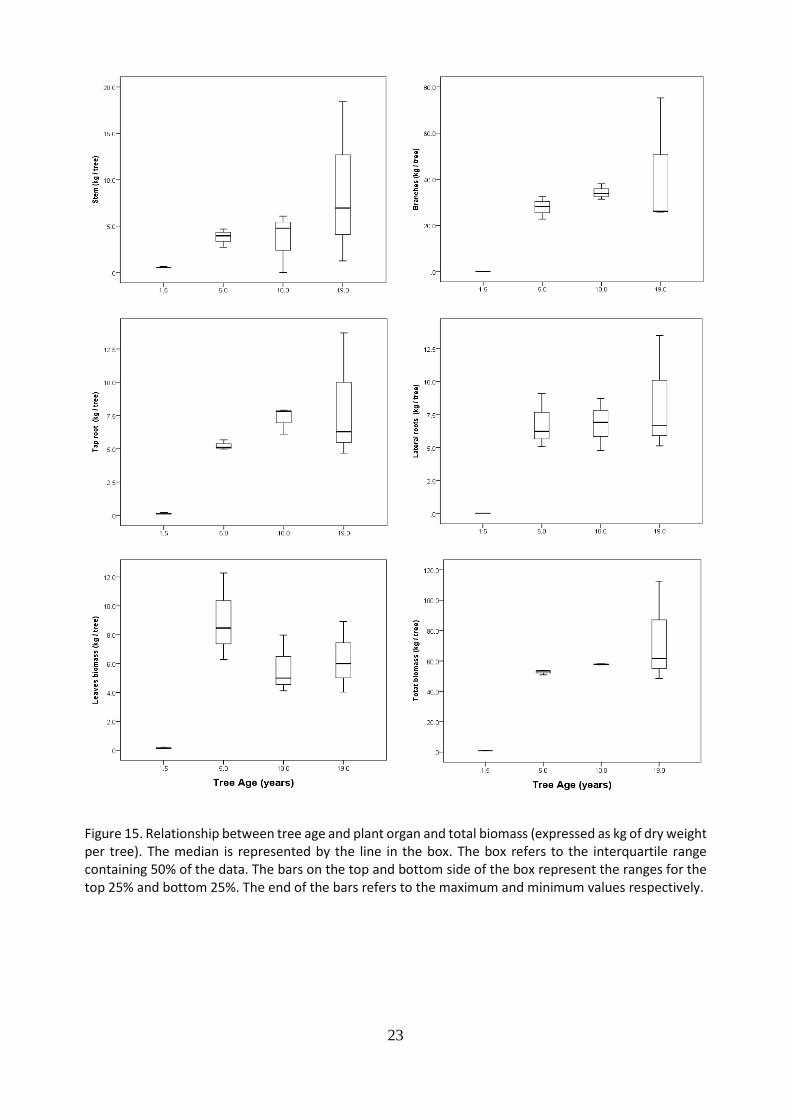
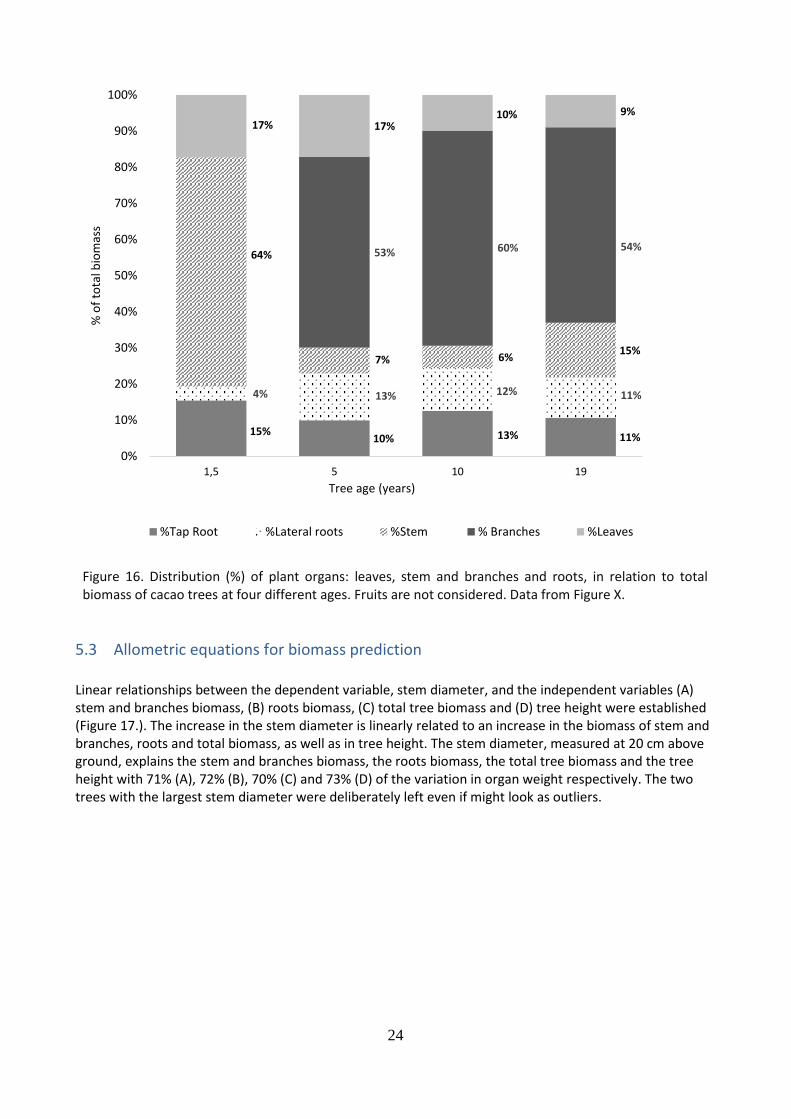
The biomass of five tree components (i) stem, (ii) branches, (iii) lateral roots, (iv) tap root, (v) leaves and total tree biomass was compared between four different cacao tree ages (Figure 15.). Results represent a total of 12 trees from four age categories (3 trees/ category). For all tree components significant differences were found between the 1.5 and the 5, 10 and 19-year-old trees. For the stem biomass is it observed a linear increase with increased tree age. For branches, lateral roots and total biomass, it is perceived an increase from 1.5 to 5-year-old cacao trees, and from 5 to 19-year-old trees its reaches a plateau. Regarding leaves biomass, five-year-old trees presented the highest biomass. In general, 19-year-old tree presented large skewed data. This would suggest heterogeneity among the trees of the same age category. The distribution (%) of different plant components in relation to total biomass was established (Figure 16.). For all ages, the greatest accumulation of biomass was found in the stem and branches. In fact, 64%, 60%, 66% and 69% of the total biomass is stem and branches for trees of 1.5, 5, 10 and 19 years respectively. Branches represented the greatest biomass for 5, 10 and 19 years old trees. Root biomass represented the second highest percentage of total biomass distribution with 19%, 23%, 25% and 22% for 1.5, 5, 10 and 19-year-old trees respectively. Lateral roots were the ones with the largest contribution, except for the 1.5-year-old trees. Leaves contributed with 17% of the biomass for 1.5 years and 5 years old trees and 10% and 9% for 10 years and 19 years old trees respective
23
Figure 15. Relationship between tree age and plant organ and total biomass (expressed as kg of dry weight per tree). The median is represented by the line in the box. The box refers to the interquartile range containing 50% of the data. The bars on the top and bottom side of the box represent the ranges for the top 25% and bottom 25%. The end of the bars refers to the maximum and minimum values respectively.
24
Figure 16. Distribution (%) of plant organs: leaves, stem and branches and roots, in relation to total biomass of cacao trees at four different ages. Fruits are not considered. Data from Figure X.
5.3 Allometric equations for biomass prediction
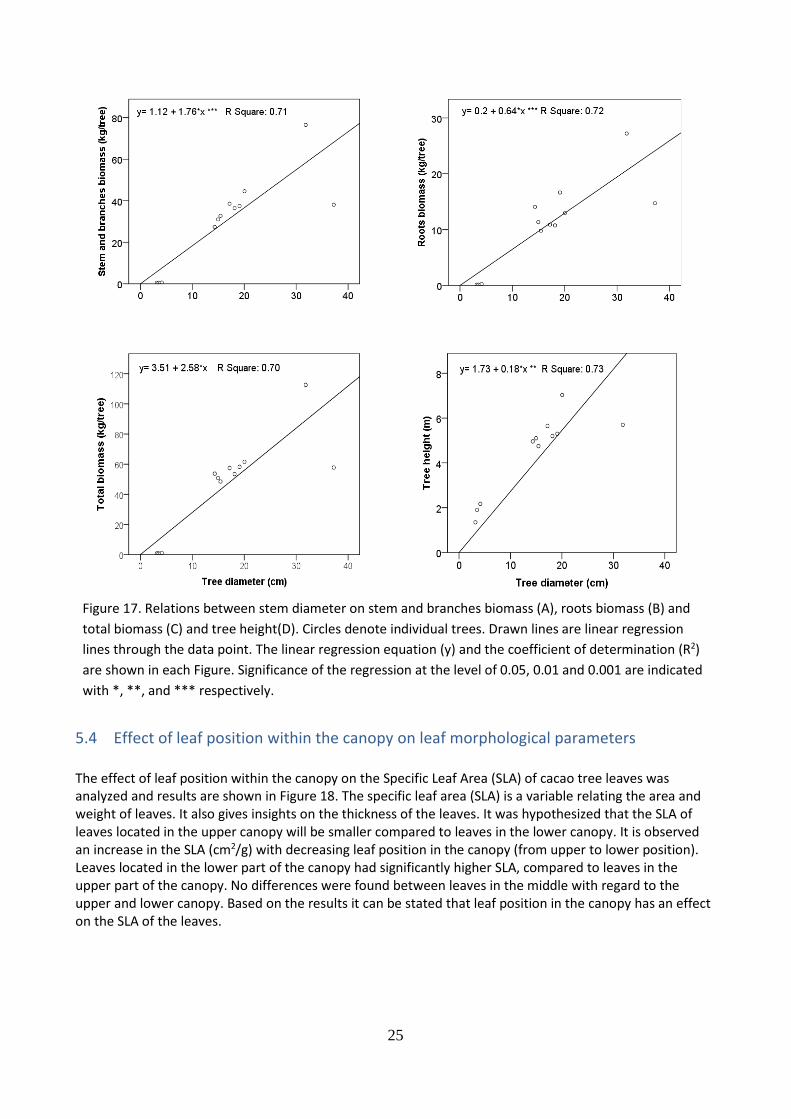
Linear relationships between the dependent variable, stem diameter, and the independent variables (A) stem and branches biomass, (B) roots biomass, (C) total tree biomass and (D) tree height were established (Figure 17.). The increase in the stem diameter is linearly related to an increase in the biomass of stem and branches, roots and total biomass, as well as in tree height. The stem diameter, measured at 20 cm above ground, explains the stem and branches biomass, the roots biomass, the total tree biomass and the tree height with 71% (A), 72% (B), 70% (C) and 73% (D) of the variation in organ weight respectively. The two trees with the largest stem diameter were deliberately left even if might look as outliers.
15%10% 13% 11%
4% 13% 12% 11%
64%
7% 6%15%
53% 60% 54%
17% 17%10% 9%
0%
10%
20%
30%
40%
50%
60%
70%
80%
90%
100%
1,5 5 10 19
% o
f to
tal b
iom
ass
Tree age (years)
%Tap Root %Lateral roots %Stem % Branches %Leaves
25
Figure 17. Relations between stem diameter on stem and branches biomass (A), roots biomass (B) and
total biomass (C) and tree height(D). Circles denote individual trees. Drawn lines are linear regression
lines through the data point. The linear regression equation (y) and the coefficient of determination (R2)
are shown in each Figure. Significance of the regression at the level of 0.05, 0.01 and 0.001 are indicated
with *, **, and *** respectively.
5.4 Effect of leaf position within the canopy on leaf morphological parameters
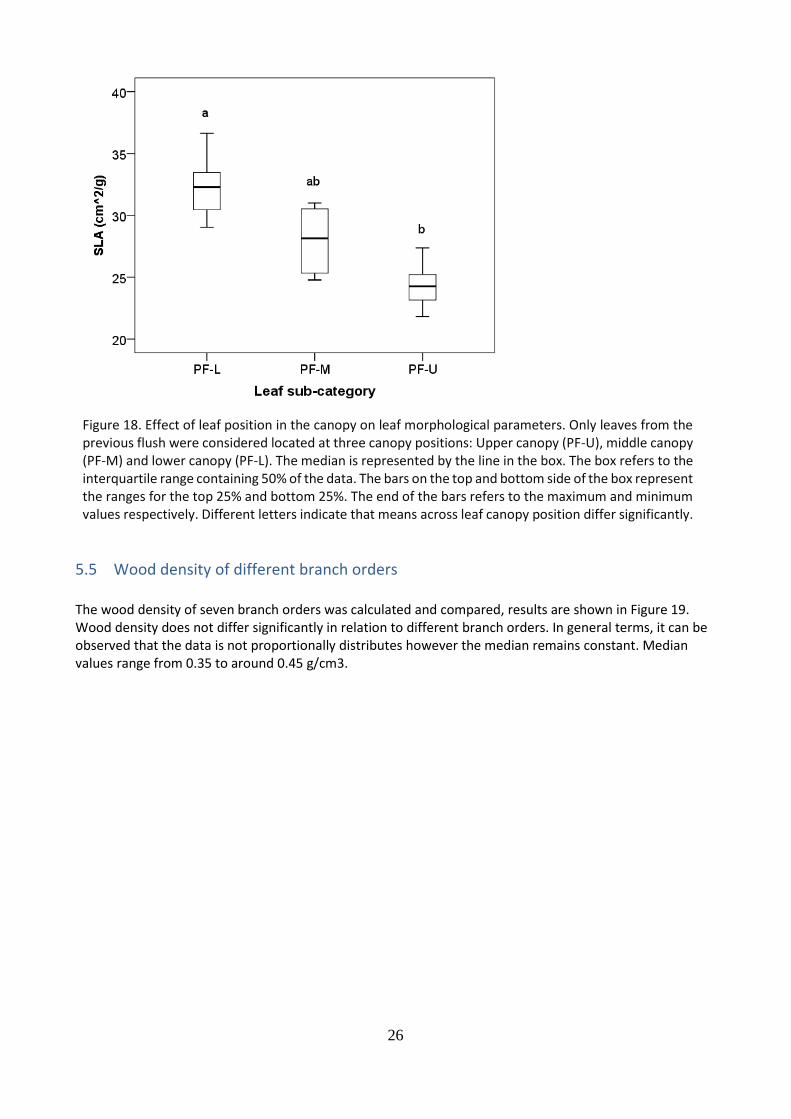
The effect of leaf position within the canopy on the Specific Leaf Area (SLA) of cacao tree leaves was analyzed and results are shown in Figure 18. The specific leaf area (SLA) is a variable relating the area and weight of leaves. It also gives insights on the thickness of the leaves. It was hypothesized that the SLA of leaves located in the upper canopy will be smaller compared to leaves in the lower canopy. It is observed an increase in the SLA (cm2/g) with decreasing leaf position in the canopy (from upper to lower position). Leaves located in the lower part of the canopy had significantly higher SLA, compared to leaves in the upper part of the canopy. No differences were found between leaves in the middle with regard to the upper and lower canopy. Based on the results it can be stated that leaf position in the canopy has an effect on the SLA of the leaves.
26
Figure 18. Effect of leaf position in the canopy on leaf morphological parameters. Only leaves from the previous flush were considered located at three canopy positions: Upper canopy (PF-U), middle canopy (PF-M) and lower canopy (PF-L). The median is represented by the line in the box. The box refers to the interquartile range containing 50% of the data. The bars on the top and bottom side of the box represent the ranges for the top 25% and bottom 25%. The end of the bars refers to the maximum and minimum values respectively. Different letters indicate that means across leaf canopy position differ significantly.
5.5 Wood density of different branch orders
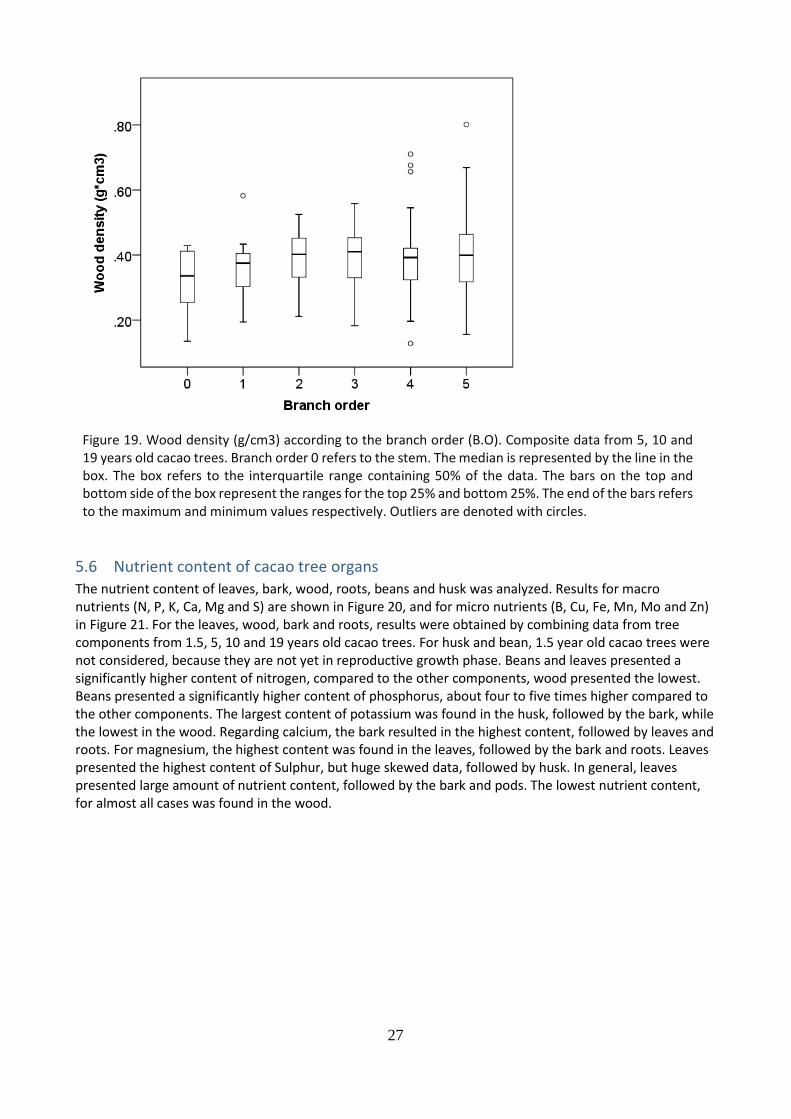
The wood density of seven branch orders was calculated and compared, results are shown in Figure 19. Wood density does not differ significantly in relation to different branch orders. In general terms, it can be observed that the data is not proportionally distributes however the median remains constant. Median values range from 0.35 to around 0.45 g/cm3.
27
Figure 19. Wood density (g/cm3) according to the branch order (B.O). Composite data from 5, 10 and 19 years old cacao trees. Branch order 0 refers to the stem. The median is represented by the line in the box. The box refers to the interquartile range containing 50% of the data. The bars on the top and bottom side of the box represent the ranges for the top 25% and bottom 25%. The end of the bars refers to the maximum and minimum values respectively. Outliers are denoted with circles.
5.6 Nutrient content of cacao tree organs
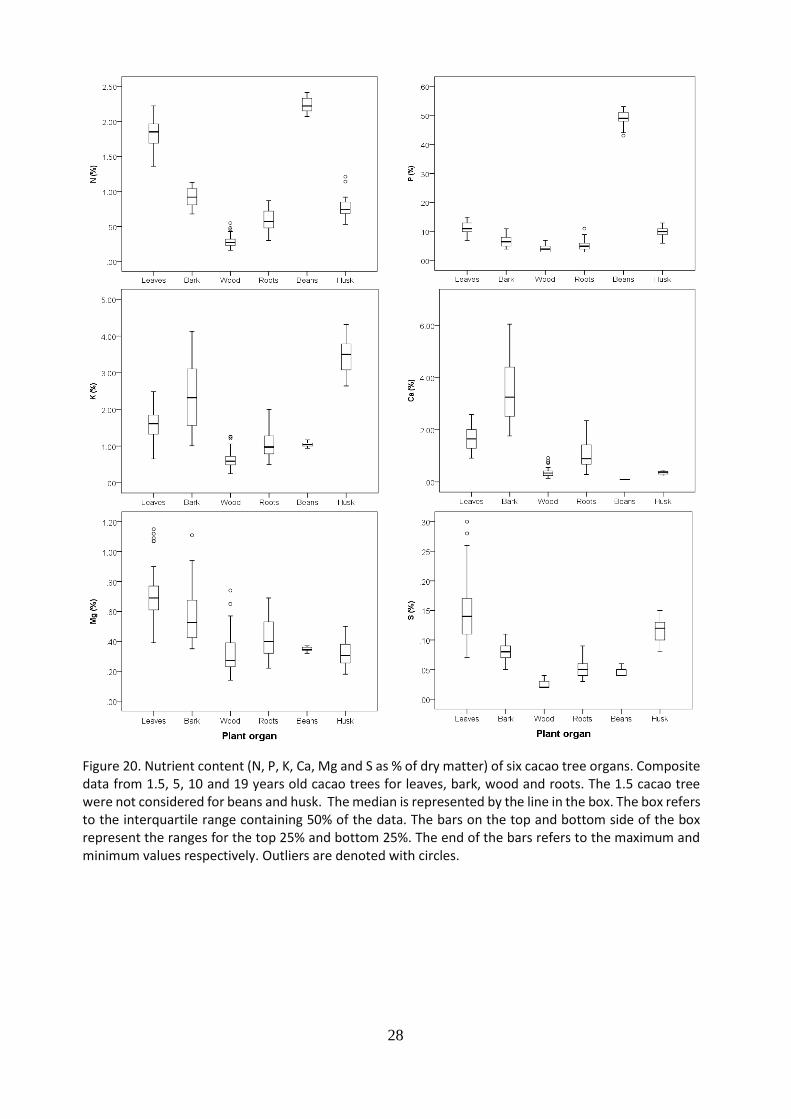
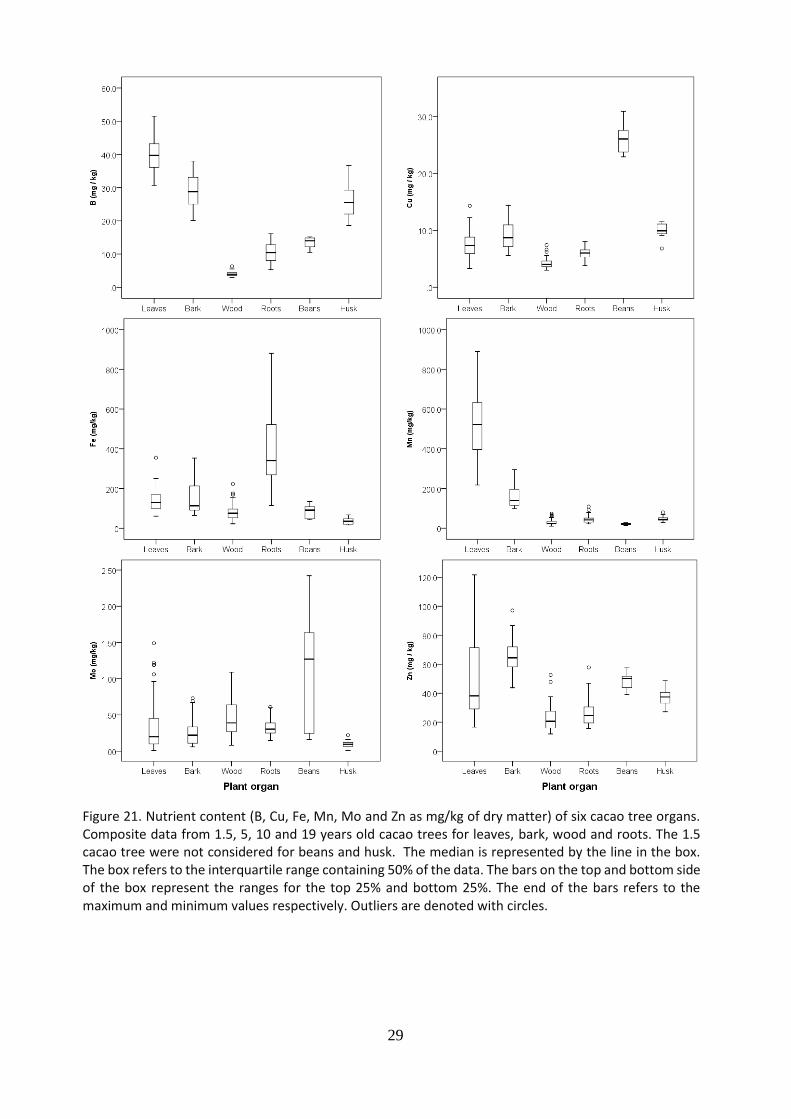
The nutrient content of leaves, bark, wood, roots, beans and husk was analyzed. Results for macro nutrients (N, P, K, Ca, Mg and S) are shown in Figure 20, and for micro nutrients (B, Cu, Fe, Mn, Mo and Zn) in Figure 21. For the leaves, wood, bark and roots, results were obtained by combining data from tree components from 1.5, 5, 10 and 19 years old cacao trees. For husk and bean, 1.5 year old cacao trees were not considered, because they are not yet in reproductive growth phase. Beans and leaves presented a significantly higher content of nitrogen, compared to the other components, wood presented the lowest. Beans presented a significantly higher content of phosphorus, about four to five times higher compared to the other components. The largest content of potassium was found in the husk, followed by the bark, while the lowest in the wood. Regarding calcium, the bark resulted in the highest content, followed by leaves and roots. For magnesium, the highest content was found in the leaves, followed by the bark and roots. Leaves presented the highest content of Sulphur, but huge skewed data, followed by husk. In general, leaves presented large amount of nutrient content, followed by the bark and pods. The lowest nutrient content, for almost all cases was found in the wood.
28
Figure 20. Nutrient content (N, P, K, Ca, Mg and S as % of dry matter) of six cacao tree organs. Composite data from 1.5, 5, 10 and 19 years old cacao trees for leaves, bark, wood and roots. The 1.5 cacao tree were not considered for beans and husk. The median is represented by the line in the box. The box refers to the interquartile range containing 50% of the data. The bars on the top and bottom side of the box represent the ranges for the top 25% and bottom 25%. The end of the bars refers to the maximum and minimum values respectively. Outliers are denoted with circles.
29
Figure 21. Nutrient content (B, Cu, Fe, Mn, Mo and Zn as mg/kg of dry matter) of six cacao tree organs. Composite data from 1.5, 5, 10 and 19 years old cacao trees for leaves, bark, wood and roots. The 1.5 cacao tree were not considered for beans and husk. The median is represented by the line in the box. The box refers to the interquartile range containing 50% of the data. The bars on the top and bottom side of the box represent the ranges for the top 25% and bottom 25%. The end of the bars refers to the maximum and minimum values respectively. Outliers are denoted with circles.
30
5.7 Nutrient content of leaves of different categories
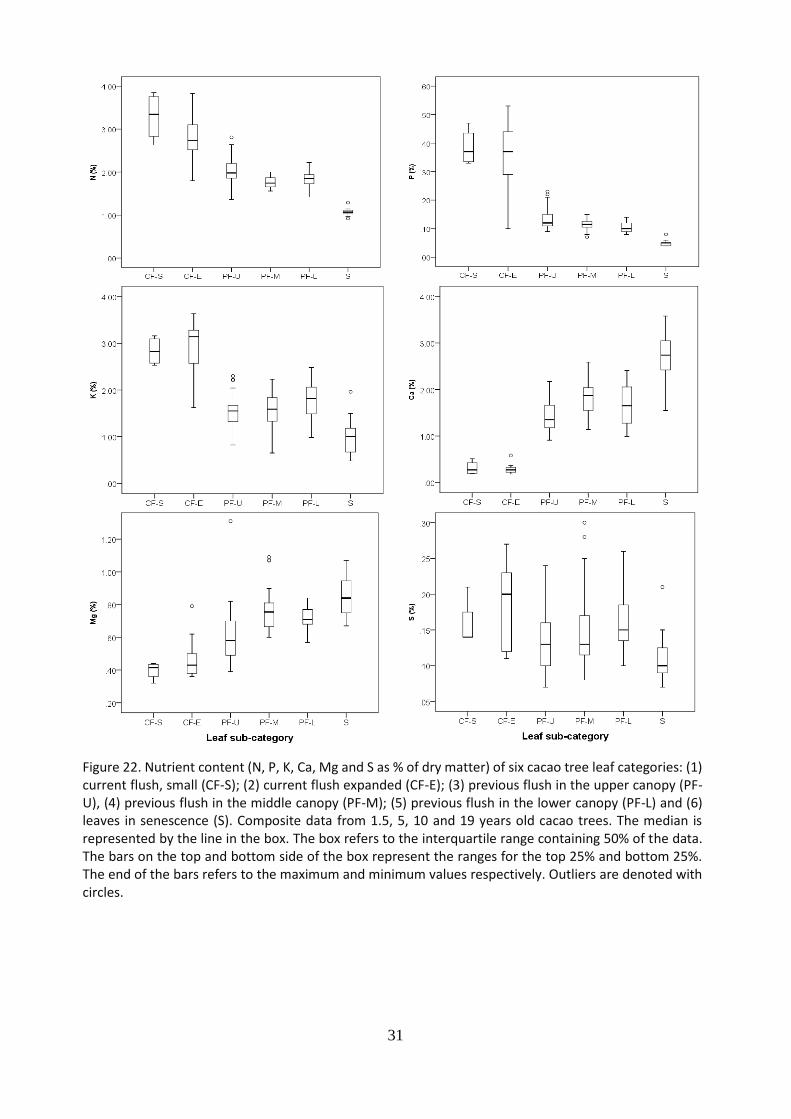
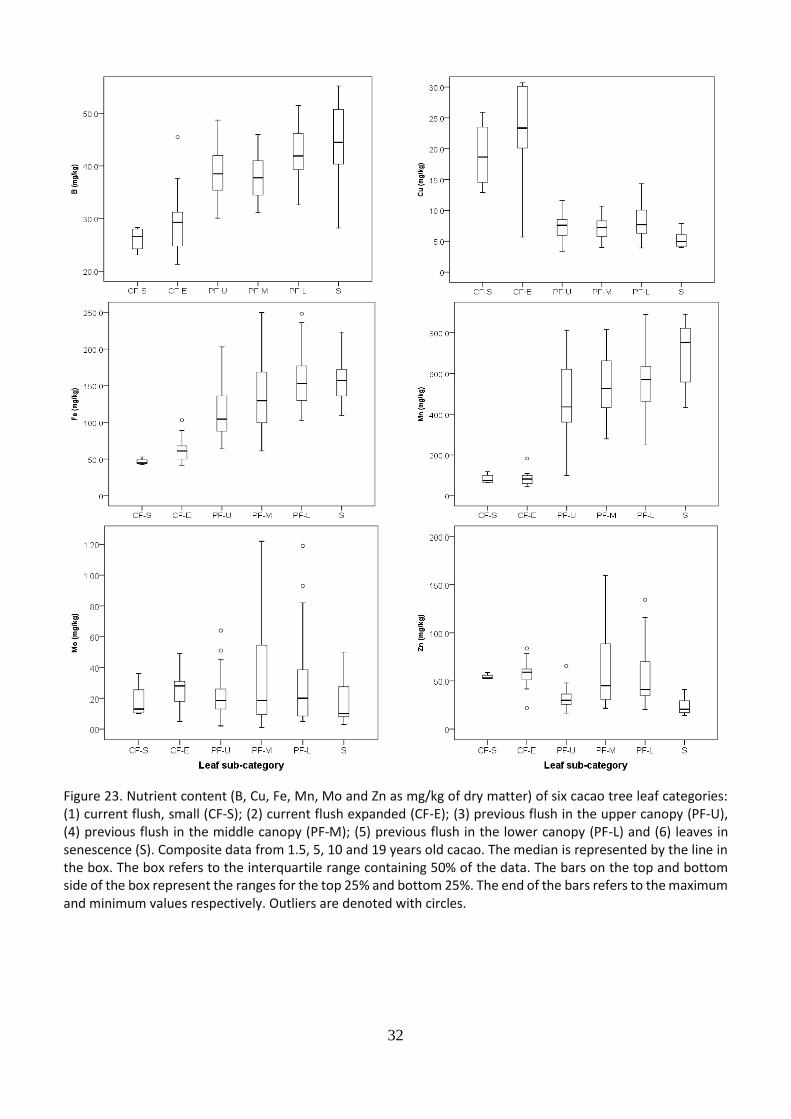
The nutrient content of leaves from six different categories was analyzed and results are shown in Figure 22 and Figure 23. For nitrogen (N), phosphorus (P) and potassium (K) copper (Cu) and zinc (Zn) it is observed a decreasing nutrient content from leaves from the current flush toward senescing leaves. The highest nutrient content was obtained in leaves from the current flush (CF-S and CF-E), followed by leaves from the previous flushes (PF-U, PF-M and PF-L) and finally senescing leaves (S). Contrary, for calcium (Ca), magnesium (Mg), boron (B), iron (Fe) and manganese (Mn) it is observed an increase in the nutrient content from leaves from the current flush towards senescing leaves. The lowest nutrient content was found in leaves from the current flush (CF-S and CF-E), followed by leaves from the previous flushes (PF-U, PF-M and PF-L) and finally the highest nutrient content was in senescing leaves (S). In general terms, the content of certain nutrients (N, P, K, Cu, Zn) decreases while others (Ca, Mg, B, Fe and Mn) increases in the transition between newly produced leaves (Leaves from the current flush) to mature leaves (Leaves form the current flush) and senescing leaves. This could give us some insight on the nutrient translocation and nutrient fixation in cacao leaves.
31
Figure 22. Nutrient content (N, P, K, Ca, Mg and S as % of dry matter) of six cacao tree leaf categories: (1) current flush, small (CF-S); (2) current flush expanded (CF-E); (3) previous flush in the upper canopy (PF-U), (4) previous flush in the middle canopy (PF-M); (5) previous flush in the lower canopy (PF-L) and (6) leaves in senescence (S). Composite data from 1.5, 5, 10 and 19 years old cacao trees. The median is represented by the line in the box. The box refers to the interquartile range containing 50% of the data. The bars on the top and bottom side of the box represent the ranges for the top 25% and bottom 25%. The end of the bars refers to the maximum and minimum values respectively. Outliers are denoted with circles.
32
Figure 23. Nutrient content (B, Cu, Fe, Mn, Mo and Zn as mg/kg of dry matter) of six cacao tree leaf categories: (1) current flush, small (CF-S); (2) current flush expanded (CF-E); (3) previous flush in the upper canopy (PF-U), (4) previous flush in the middle canopy (PF-M); (5) previous flush in the lower canopy (PF-L) and (6) leaves in senescence (S). Composite data from 1.5, 5, 10 and 19 years old cacao. The median is represented by the line in the box. The box refers to the interquartile range containing 50% of the data. The bars on the top and bottom side of the box represent the ranges for the top 25% and bottom 25%. The end of the bars refers to the maximum and minimum values respectively. Outliers are denoted with circles.
33
5.8 Comparison of the nutrient content of cacao tree components between four
different tree ages.
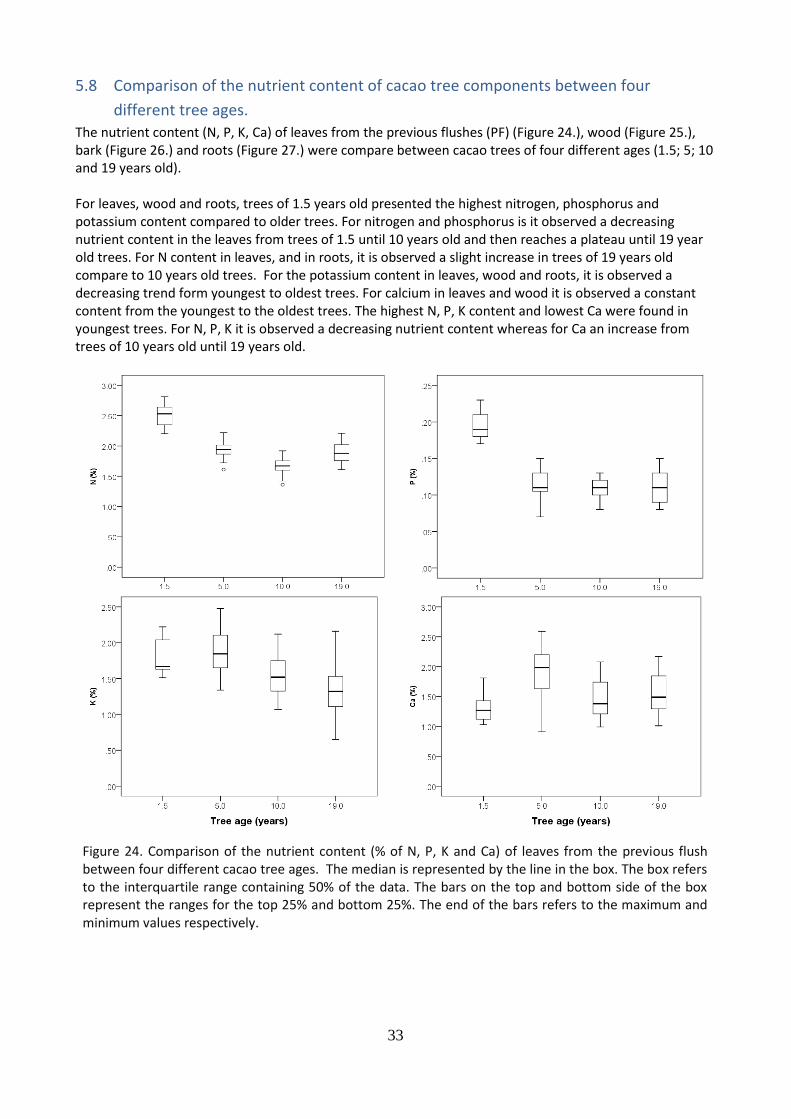
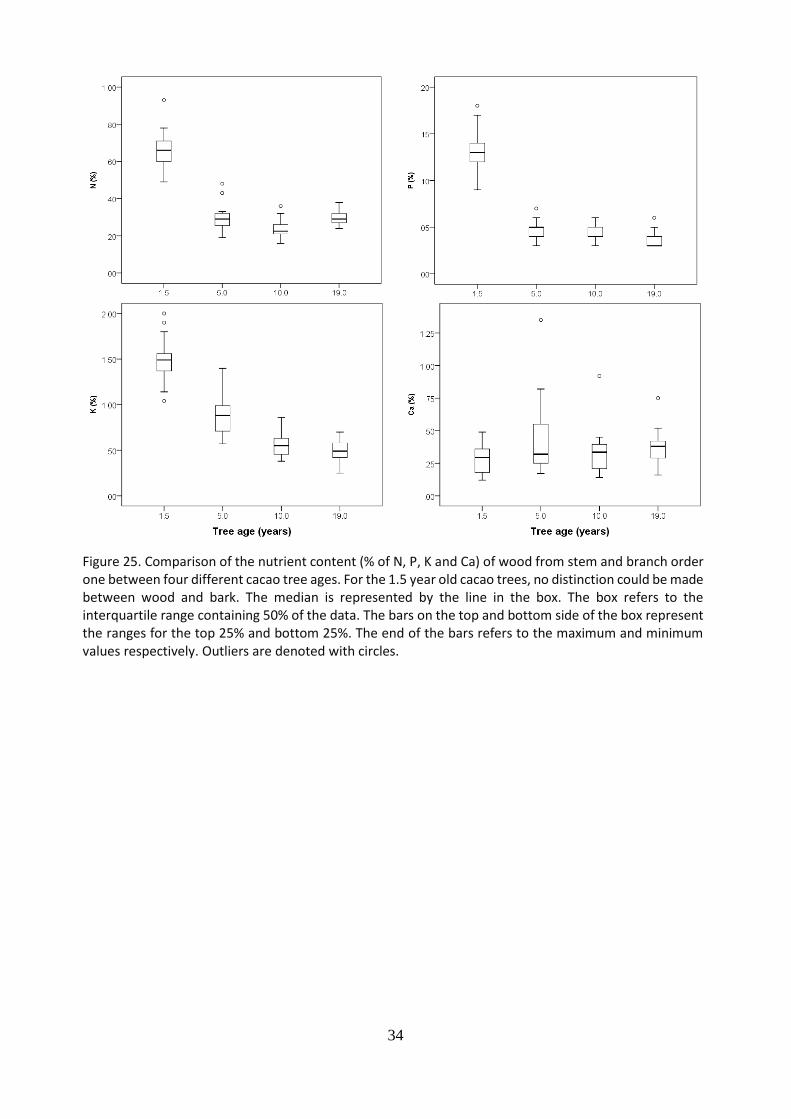
The nutrient content (N, P, K, Ca) of leaves from the previous flushes (PF) (Figure 24.), wood (Figure 25.), bark (Figure 26.) and roots (Figure 27.) were compare between cacao trees of four different ages (1.5; 5; 10 and 19 years old). For leaves, wood and roots, trees of 1.5 years old presented the highest nitrogen, phosphorus and potassium content compared to older trees. For nitrogen and phosphorus is it observed a decreasing nutrient content in the leaves from trees of 1.5 until 10 years old and then reaches a plateau until 19 year old trees. For N content in leaves, and in roots, it is observed a slight increase in trees of 19 years old compare to 10 years old trees. For the potassium content in leaves, wood and roots, it is observed a decreasing trend form youngest to oldest trees. For calcium in leaves and wood it is observed a constant content from the youngest to the oldest trees. The highest N, P, K content and lowest Ca were found in youngest trees. For N, P, K it is observed a decreasing nutrient content whereas for Ca an increase from trees of 10 years old until 19 years old.
Figure 24. Comparison of the nutrient content (% of N, P, K and Ca) of leaves from the previous flush between four different cacao tree ages. The median is represented by the line in the box. The box refers to the interquartile range containing 50% of the data. The bars on the top and bottom side of the box represent the ranges for the top 25% and bottom 25%. The end of the bars refers to the maximum and minimum values respectively.
34
Figure 25. Comparison of the nutrient content (% of N, P, K and Ca) of wood from stem and branch order one between four different cacao tree ages. For the 1.5 year old cacao trees, no distinction could be made between wood and bark. The median is represented by the line in the box. The box refers to the interquartile range containing 50% of the data. The bars on the top and bottom side of the box represent the ranges for the top 25% and bottom 25%. The end of the bars refers to the maximum and minimum values respectively. Outliers are denoted with circles.
35
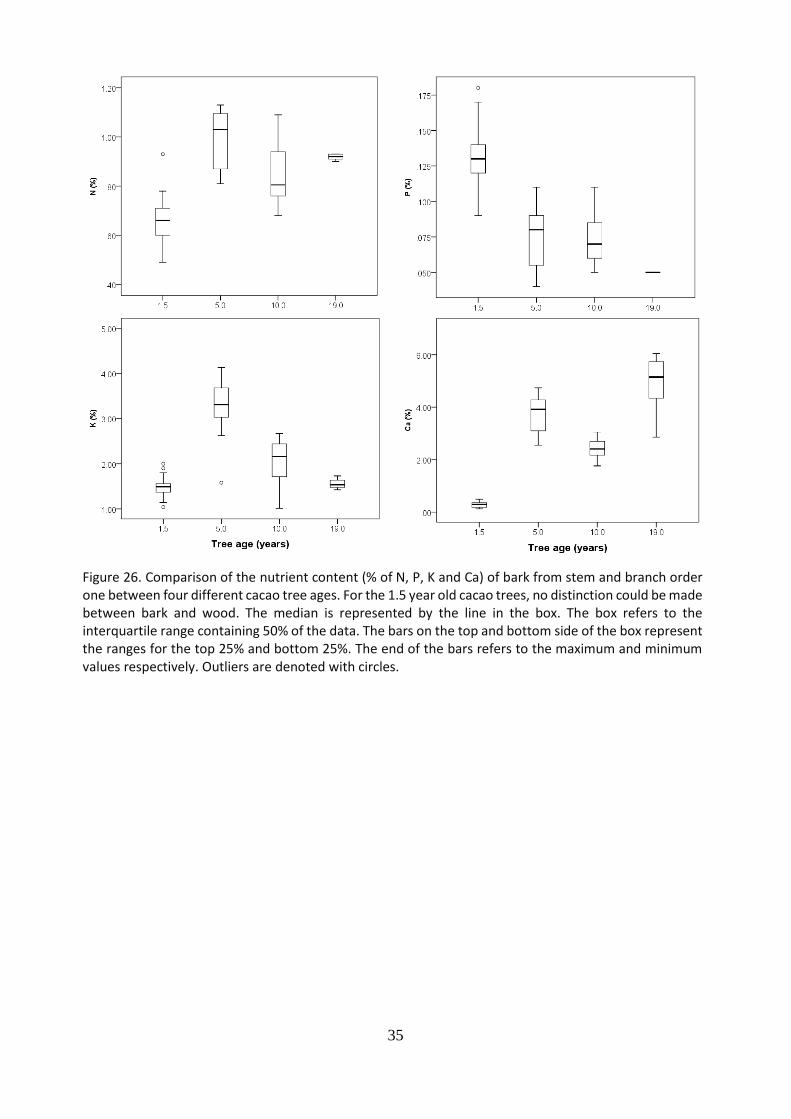
Figure 26. Comparison of the nutrient content (% of N, P, K and Ca) of bark from stem and branch order one between four different cacao tree ages. For the 1.5 year old cacao trees, no distinction could be made between bark and wood. The median is represented by the line in the box. The box refers to the interquartile range containing 50% of the data. The bars on the top and bottom side of the box represent the ranges for the top 25% and bottom 25%. The end of the bars refers to the maximum and minimum values respectively. Outliers are denoted with circles.
36
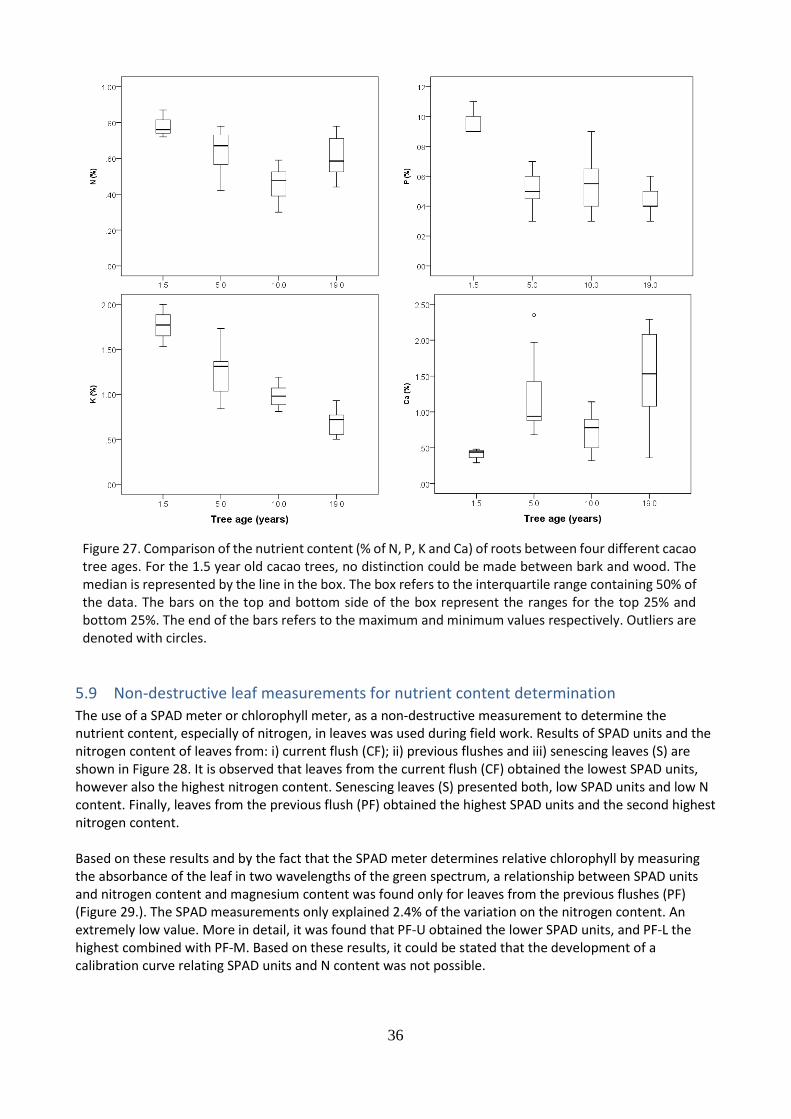
Figure 27. Comparison of the nutrient content (% of N, P, K and Ca) of roots between four different cacao tree ages. For the 1.5 year old cacao trees, no distinction could be made between bark and wood. The median is represented by the line in the box. The box refers to the interquartile range containing 50% of the data. The bars on the top and bottom side of the box represent the ranges for the top 25% and bottom 25%. The end of the bars refers to the maximum and minimum values respectively. Outliers are denoted with circles.
5.9 Non-destructive leaf measurements for nutrient content determination
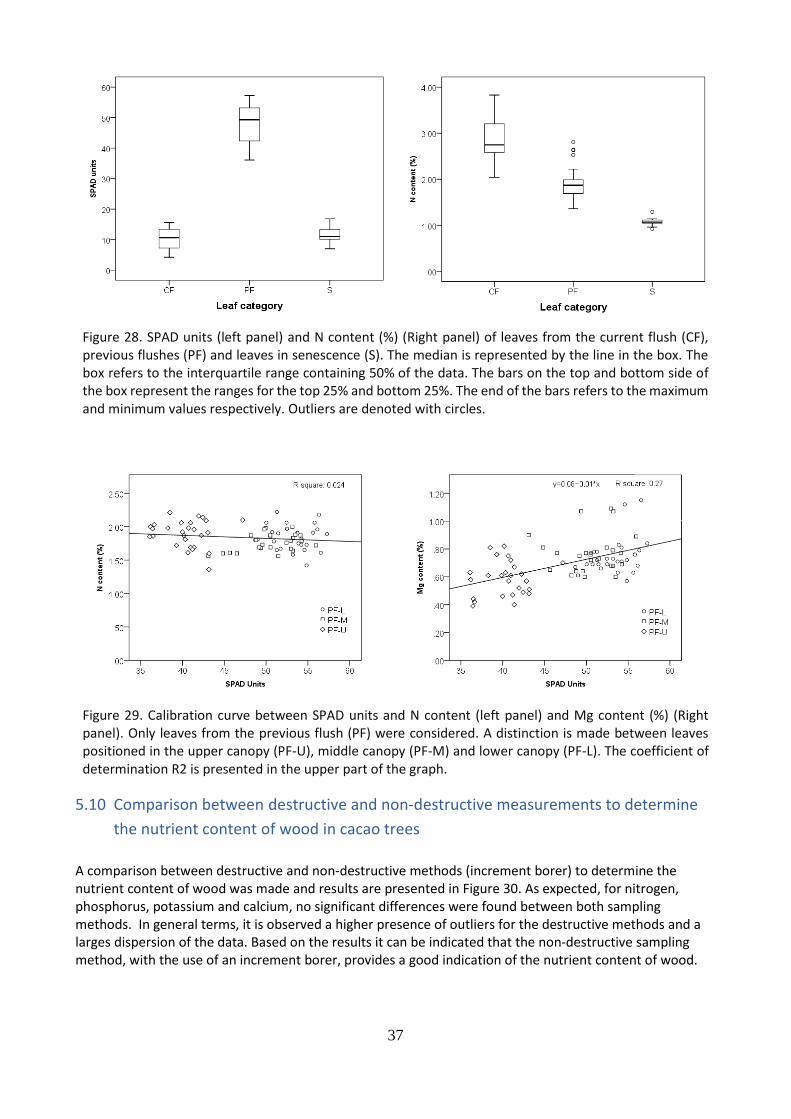
The use of a SPAD meter or chlorophyll meter, as a non-destructive measurement to determine the nutrient content, especially of nitrogen, in leaves was used during field work. Results of SPAD units and the nitrogen content of leaves from: i) current flush (CF); ii) previous flushes and iii) senescing leaves (S) are shown in Figure 28. It is observed that leaves from the current flush (CF) obtained the lowest SPAD units, however also the highest nitrogen content. Senescing leaves (S) presented both, low SPAD units and low N content. Finally, leaves from the previous flush (PF) obtained the highest SPAD units and the second highest nitrogen content. Based on these results and by the fact that the SPAD meter determines relative chlorophyll by measuring the absorbance of the leaf in two wavelengths of the green spectrum, a relationship between SPAD units and nitrogen content and magnesium content was found only for leaves from the previous flushes (PF) (Figure 29.). The SPAD measurements only explained 2.4% of the variation on the nitrogen content. An extremely low value. More in detail, it was found that PF-U obtained the lower SPAD units, and PF-L the highest combined with PF-M. Based on these results, it could be stated that the development of a calibration curve relating SPAD units and N content was not possible.
37
Figure 28. SPAD units (left panel) and N content (%) (Right panel) of leaves from the current flush (CF), previous flushes (PF) and leaves in senescence (S). The median is represented by the line in the box. The box refers to the interquartile range containing 50% of the data. The bars on the top and bottom side of the box represent the ranges for the top 25% and bottom 25%. The end of the bars refers to the maximum and minimum values respectively. Outliers are denoted with circles.
Figure 29. Calibration curve between SPAD units and N content (left panel) and Mg content (%) (Right panel). Only leaves from the previous flush (PF) were considered. A distinction is made between leaves positioned in the upper canopy (PF-U), middle canopy (PF-M) and lower canopy (PF-L). The coefficient of determination R2 is presented in the upper part of the graph.
5.10 Comparison between destructive and non-destructive measurements to determine
the nutrient content of wood in cacao trees
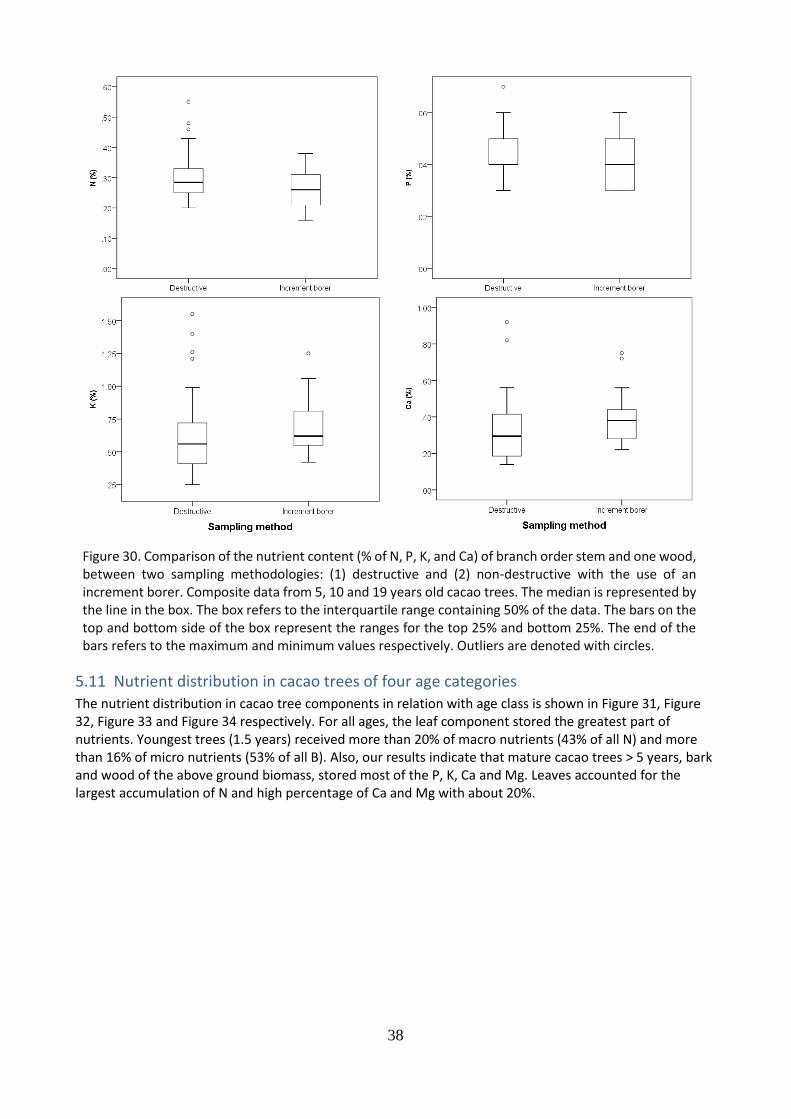
A comparison between destructive and non-destructive methods (increment borer) to determine the nutrient content of wood was made and results are presented in Figure 30. As expected, for nitrogen, phosphorus, potassium and calcium, no significant differences were found between both sampling methods. In general terms, it is observed a higher presence of outliers for the destructive methods and a larges dispersion of the data. Based on the results it can be indicated that the non-destructive sampling method, with the use of an increment borer, provides a good indication of the nutrient content of wood.
38
Figure 30. Comparison of the nutrient content (% of N, P, K, and Ca) of branch order stem and one wood, between two sampling methodologies: (1) destructive and (2) non-destructive with the use of an increment borer. Composite data from 5, 10 and 19 years old cacao trees. The median is represented by the line in the box. The box refers to the interquartile range containing 50% of the data. The bars on the top and bottom side of the box represent the ranges for the top 25% and bottom 25%. The end of the bars refers to the maximum and minimum values respectively. Outliers are denoted with circles.
5.11 Nutrient distribution in cacao trees of four age categories
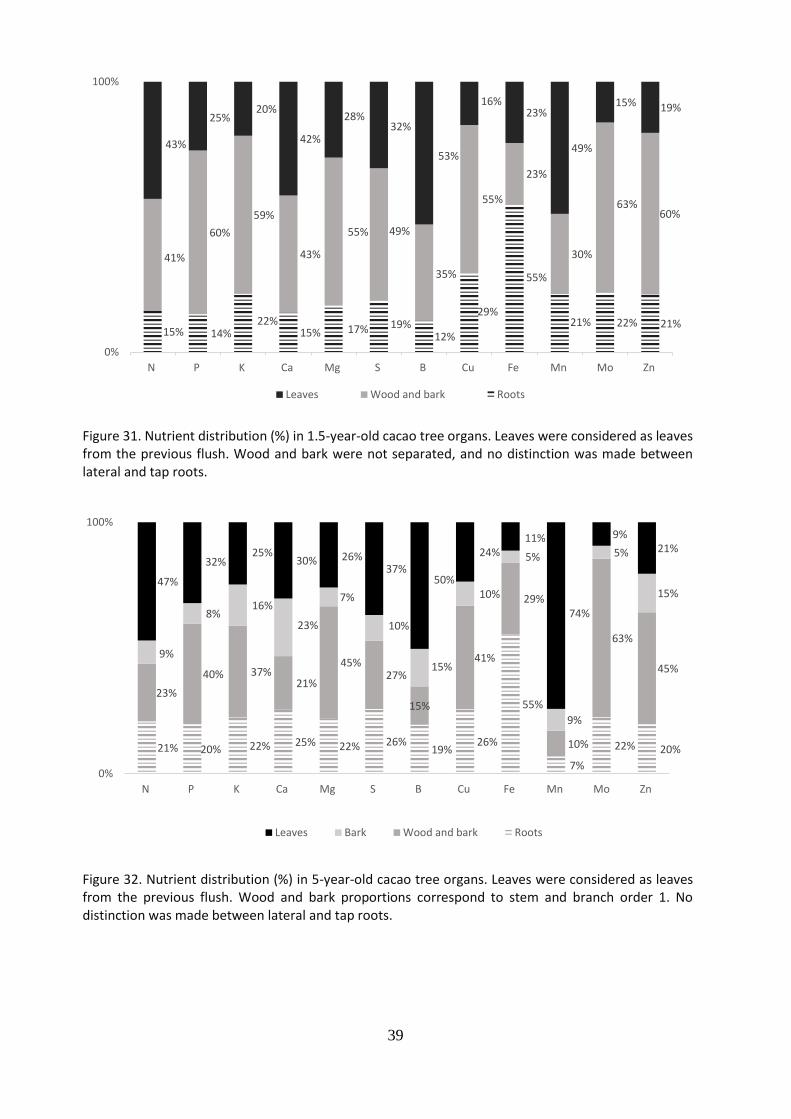
The nutrient distribution in cacao tree components in relation with age class is shown in Figure 31, Figure 32, Figure 33 and Figure 34 respectively. For all ages, the leaf component stored the greatest part of nutrients. Youngest trees (1.5 years) received more than 20% of macro nutrients (43% of all N) and more than 16% of micro nutrients (53% of all B). Also, our results indicate that mature cacao trees > 5 years, bark and wood of the above ground biomass, stored most of the P, K, Ca and Mg. Leaves accounted for the largest accumulation of N and high percentage of Ca and Mg with about 20%.
39
Figure 31. Nutrient distribution (%) in 1.5-year-old cacao tree organs. Leaves were considered as leaves from the previous flush. Wood and bark were not separated, and no distinction was made between lateral and tap roots.
Figure 32. Nutrient distribution (%) in 5-year-old cacao tree organs. Leaves were considered as leaves from the previous flush. Wood and bark proportions correspond to stem and branch order 1. No distinction was made between lateral and tap roots.
15% 14%22%
15% 17% 19%12%
29%
55%
21% 22% 21%
41%
60%
59%
43%
55% 49%
35%
55%
23%
30%
63%60%
43%
25%20%
42%
28%32%
53%
16%23%
49%
15% 19%
0%
100%
N P K Ca Mg S B Cu Fe Mn Mo Zn
Leaves Wood and bark Roots
21% 20% 22% 25% 22% 26%19%
26%
55%
7%
22% 20%
23%
40% 37%21%
45%27%
15%
41%
29%
10%
63%
45%9%
8%16%
23%
7%
10%
15%
10%
5%
9%
5%
15%47%
32%25%
30% 26%37%
50%
24%11%
74%
9%21%
0%
100%
N P K Ca Mg S B Cu Fe Mn Mo Zn
Leaves Bark Wood and bark Roots
40
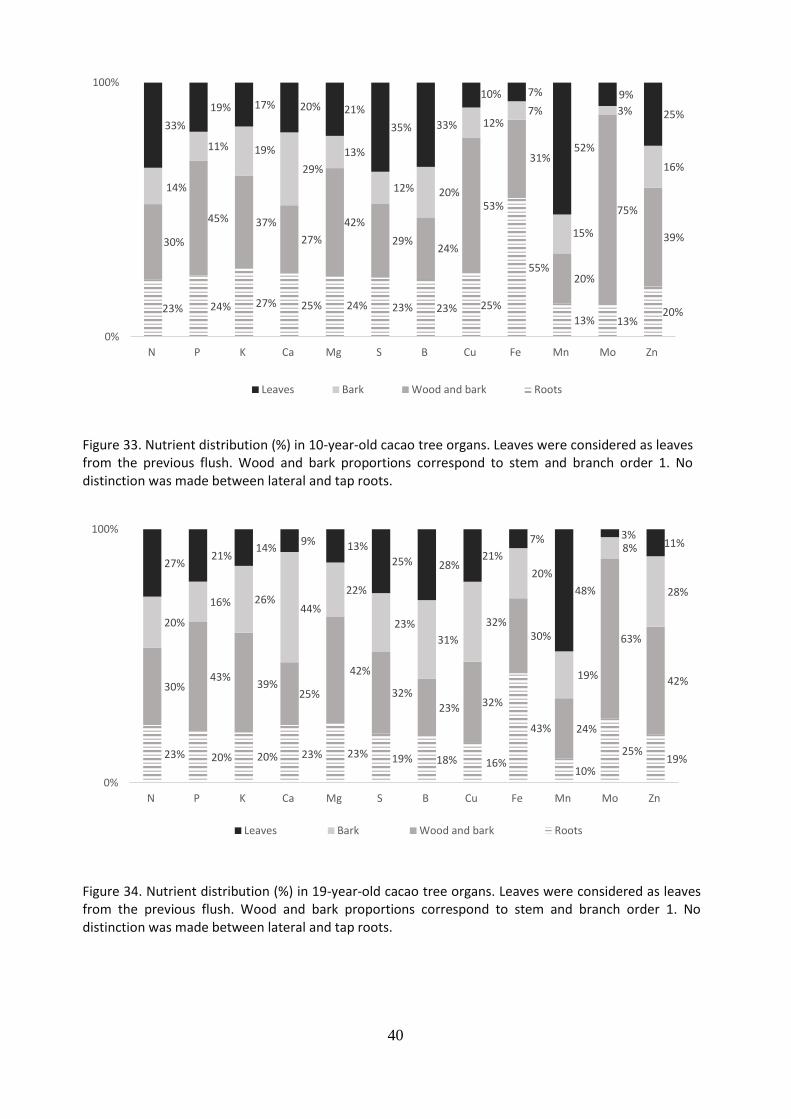
Figure 33. Nutrient distribution (%) in 10-year-old cacao tree organs. Leaves were considered as leaves from the previous flush. Wood and bark proportions correspond to stem and branch order 1. No distinction was made between lateral and tap roots.
Figure 34. Nutrient distribution (%) in 19-year-old cacao tree organs. Leaves were considered as leaves from the previous flush. Wood and bark proportions correspond to stem and branch order 1. No distinction was made between lateral and tap roots.
23% 24% 27% 25% 24% 23% 23% 25%
55%
13% 13%20%
30%
45% 37%
27%
42%
29%24%
53%
31%
20%
75%
39%
14%
11% 19%
29%
13%
12% 20%
12%7%
15%
3%
16%
33%
19% 17% 20% 21%
35% 33%
10% 7%
52%
9%
25%
0%
100%
N P K Ca Mg S B Cu Fe Mn Mo Zn
Leaves Bark Wood and bark Roots
23% 20% 20% 23% 23% 19% 18% 16%
43%
10%
25%19%
30%43%
39%25%
42%
32%
23% 32%
30%
24%
63%
42%
20%
16% 26%44%
22%
23%
31%
32%
20%
19%
8%
28%
27%21%
14%9% 13%
25% 28%21%
7%
48%
3%11%
0%
100%
N P K Ca Mg S B Cu Fe Mn Mo Zn
Leaves Bark Wood and bark Roots
41
6 Discussion
6.1 Structural parameters and biomass distribution
Most of the structural parameters and tree component´s biomass increased from 1.5 to 5-year-old trees, reaching a plateau until 19 years. This would suggest that cacao trees experience vegetative growth during the first years and once they reach their reproductive stage, the increase for most of the structural parameters and tree components biomass is marginal. In our study, the distribution of biomass over tree components from larger to lower weights was branches > roots > leaves > stem for all age classes. Our results are comparable with other studies. In Costa Rica, for 5-year-old cacao trees under agroforestry systems (Alpizar, 1986)and (Beer et al., 1990) Fassbender et al. (1988) found the distribution of biomass as following: branches > leaves > roots > stem. In Malaysia, Thong et al (1980) found: branches > leaves > roots > stem. While in Brazil, for 16.5-year-old cacao trees under agroforestry system, Subler (1994) found: branches > stem > leaves, he did not considered roots. Our study is in line with previous studies (Thong et al.,1980; Alpizar et al.,1982; Fassbender et al., 1988) in which greatest part of the biomass (>65%) was found in the above-ground components, especially in branches and leaves. We found greater roots biomass compared to Thong et al (1980); Alpizar et al. (1982) and Fassbender et al. (1988). The first author weighted tap root and took a sample to determine lateral roots biomass. The last two authors determined only fine root biomass for an agroforestry system without making the distinction between cacao trees and timber species. For our study, lateral roots and tap root were followed, exposed as much as possible and weighted, therefore the values for total root biomass are more realistic. As expected, the fraction of dry matter allocated to leaves decreased with increasing tree age due to the accumulation of wood. This suggest that younger plants invest more assimilates to the leaves, to increase leaf area resulting in a greater light capture and thus generating more assimilates for vegetative growth (Lammers et al., 2008, p 321.). In our study, with increased tree age, the allocation of dry matter to branches decreased, stem increased, and tree height was maintained. As a common management practice in cacao production systems, during the lifetime of trees, branches (orthotropic) are periodically pruned (Beer, 1988; Hartemink, 2005; Almeida et al.,2007). Tree height and branch biomass are mainly determined by the growth of orthotropic branches (Almeida et al., 2007). Therefore, in our study pruning affected the fraction of dry matter allocated to branches and limited tree height but did not affected the increase of stem biomass. Essentially, as stated by (Niemenak et al., 2010), the intrinsic characteristics of mature trees are often unperceivable due to changes in tree architecture through management practices. Therefore, management practices such as pruning, could have a direct influence on the relations used to predict cacao tree components biomass and total biomass.
6.2 Biomass prediction, allometric relations In our study and literature (Subler et al., 1994, Roxburgh et al., 2015) stem diameter has shown to be the best predictor for tree components and total biomass. (Subler et al., 1994) found that the best predictor (R2 > 0.90) of total and tree components biomass was the sum of the stem and first order branches diameter. Also, Zuidema et al. (2005) established allometric relations between organ biomass and total biomass and between tree age and total biomass. The precision of the allometric relationships is strictly related to the number of trees that were sampled. The greatest precision is obtained when the number of individual trees is at least 17 (Roxburgh et al.,2015). As the number of trees sampled increases, the confidence in the reliability of the allometric model that predict the biomass is higher. In the study of Subler (1994), eight mature cacao trees (16-17 years old) were collected. In our study we measured a total of 12 cacao trees of 4 age classes. This could explain why in our study the
42
relationships were high (R2 >.70) but most of them not statistically significant. Also, we included our stem diameter data in Subler (1994) allometric equations. We found that our total and tree components (branches, stem and leaves) was highly underestimated e.g a difference of about 45kg for mature trees. For total biomass, Subler (1994) determine the 95% C.I for mature tree to be between 17.3 and 21.6 kg/trees, where as we found between 50 and 115 kg/trees. So basically there were bigger trees in our study, probably related to the cacao variety used and management practices such as pruning. In fact, we found quadratic relationships.as with increase tree age, certain variables such as tree height, and stem and branches biomass, level up due to management practices. Also, we observed large variability in term of biomass, between age categories and within age categories. In fact, in Ivory Coast,(Wibaux et al., 2017) observed large yield differences between trees of the same plot and age. The last was attributed to the use of plants of un-controlled genetic background resulting in high phenotypic variability. Therefore, it could be assumed that these will also lead to high variability related to structural parameters. It can be concluded that it is not possible to generalized allometric equations as they depend on factors such as tree variety and management practices. Thus, allometric relationships must be context specific.
6.3 Leaf position in the canopy affect leaf morphology As expected, the position of the leaves in the canopy had a significant effect on leaf morphological parameters. The amount of solar radiation captured by the leaves depends on the position of the leaves in the canopy (Miyaji et al., 1997). The lower the position in the canopy, the less light incidence. Based in our results, it can be stated that for cacao trees, there is an increase of SLA, or decrease in leaf thickness with decreasing light incidence. Our results are in line with the ones found by Miyaji et al., (1997) in cacao, and by (Bote et al., 2018) in coffee. The increase in leaf thickness, is a morphological response of leaves at higher radiation levels that would help leaves to use radiation more efficiently and maximize the water use efficiency (Atwell, 1999, Scoffoni et al., 2015). In fact, smaller and thicker leaves (upper canopy) are more capable of retaining water by reducing transpiration and thus sustaining a favorable temperature (Scoffoni et al., 2015) Also, smaller leaves may allow more solar radiation to pass to leaves located in the lower canopy. The last is beneficial in high radiation areas, where top leaves receive light in excess, saturating the photosynthetic system (Bote et al., 2018), especially in shade tolerant plants like cacao (Araujo et al., 2017).
6.4 Nutrient content and distribution Nutrient content differed significantly between tree components and between tree age categories. In our research, it was observed that recyclable plant components tend to have higher nutrient content, like leaves and pods, whereas less recyclable components like stem and branches, showed a lower value. The last in combination with the soil nutrient content, is an important finding as it give a better insight on the in and output nutrient balance of cacao agroecosystems. . Similar results were obtained by Thong et al. (1978); Alpízar et al. (1982); Fassbender et al. (1988); and Hartemink, (2005) in cacao and Dossa et al., (2008) in coffee. As a general trend the order concentration for major nutrients (N, P, K) in plant components, not considering pods, was leaves > bark > roots > wood. Several authors found a similar trend but did not make the distinction between bark and wood resulting in: leaves > roots > branches > stem (Alpizar et al., 1986). Both, stem and branches are composed by a lower proportion of bark and higher of wood. In our study, the bark presented significantly higher nutrient content than wood. The bark plays a key role in the storage of water and photosynthates as it contains secondary phloem (Rosell, 2016) This explains its high nutrient content. Our result showed that the nutrient accumulation of the bark is N > Ca > K > Mg > P and the wood K > Ca > N > Mg > P. A similar nutrient accumulation pattern was found by Thong et al. (1980); Alpizar et al. (1982) and Fassbender et al. (1988). Their results refer to the combination of bark and wood. In line with with Thong et al., (1980) for roots, we obtained K > Ca > N >Mg > P. For the same component Aranguren et al., (1982) found Ca > N > K > Mg > P.
43
The nutrient accumulation of mature leaves was N > K > Ca > Mg > P. Our results are in accordance with the findings of Thong et al. (1978) in 5-7-year-old trees and very similar to Alpizar et al. (1982) and Fassbender et al., (1988) in 4.5-year-old trees. Similar to our results in young cacao trees (less three years), Thong et al. (1978) observed that the leaf component stores great part of the nutrients. In our study, leaves of 1.5-year-old trees stored more than 20% of macro nutrients (43% of all N) and more than 16% of micro nutrients (53% of all B). For both, young and mature trees, leaves presented high values for N, Mg, Ca, B, Mn and Zn. Most of the nutrients are stored in the lamina, and only about 15% in the petiole and midrib of the leaf (Thong et al., 1978). The Nitrogen dynamics in cacao trees were explained by Aranguren et al (1982). The author indicated that about 20% of the nitrogen is translocated before leaves senesce. We found about 60% of translocation, assuming that all N from senescing leaves goes to newly produced leaves. This would explain the high N content in newly produced leaves and the low N content in senescing leaves. Due to this nutrients translocation, there was an increased concentration of other nutrients, such as Ca. Sleigh et al. (1984) found that the import of assimilates into the stem and tap root was reduced during flush leaf expansion. They also noticed a lower growth rate of the roots at the leaf expansion is related to a redirection of photo-assimilates from the roots to the developing flush leaves. Pods (beans and husk) represent the main nutrient removal from cacao production systems. Hartemink (2005) calculated, from different studies, the amount of nutrients (N, P, K) removed by 1000 kg of dry cacao beans. The results vary greatly between studies. The maximum nutrient removal was obtained by Aranguren et al. (1982) in Venezuela, with a removal of nitrogen of about 40kg/ha. The lowest removal was obtained by (Heuvelop et al., 1988)in Costa Rica, with a removal of N, P, and K of about 19, 5 and 11 kg/ha respectively. Our results are comparable to the ones obtained by (Snoeck and Jadin, 1992) in Ivory Coast, they found a removal of N, P and K of about 22, 3 and 8 kg/ha respectively. For our study and the literature, beans presented the highest N content of all tree components whereas husk the highest K. However large differences in the nutrient content of beans and husk between studies could be related to differences in the soil and climatic conditions of the studied sites. Cacao agroecosystems will gradually deplete soil nutrients resulting in reduce productivity over time if a balanced in and output of nutrients is not maintained (Hartemink, 2005; van Vliet and Giller, 2017). Our findings show a high N content in leaves, bark and beans. In fact, N plays a central role in the synthesis and composition of proteins ((Maathuis et al., 2013). However, currently the Centre National de Recherche Agronomique (CNRA) of Ivory Coast do not considers N into their fertilizer recommendations (van Vliet and Giller, 2017). The last is subject to debate as literature and our results indicates that it is required in large amounts (compared to other nutrients), especially as beans are 100% removed from the field. Other nutrients such as K and Ca play a major structural role as components of the cell wall and are fundamental for cell turgor. Which explains its high nutrient content in all tree components. Most fertilizer recommendations consider K, but not Ca (van Vliet and Giller., 2017). Regarding Mg, it has a structural role in the chlorophyll and thus in the overall photosynthetic activity. Therefore its presence, especially in leaves is fundamental, and lack of Mg could have severe implications in the photosynthesis activity. In Ivory Coast, Mg has not yet been included in the fertilization recommendations (van Vliet and Giller., 2017); For P, it presented the lowest nutrient content of macronutrients in all plant components (except for beans). But it is a regulator of the protein activity, thus P fertilization is included in all fertilizer recommendations for cacao (van Vliet and Giller., 2017). Little is known about the influence and importance of micro-nutrient in cacao nutrition, and deficiencies are usually underestimated (NETO et al., 2015). However, Cunningham and Arnold (1962) did not find an increase in productivity from micro-nutrient fertilization. We found relatively high values of B, Mn and Zn in leaves. The first, plays a role in the meristematic activity, therefore in the growth and division of cells. The second is fundamental in the development of resistance in plant to fungal diseases (Maathuis and Diatloff., 2013) And the third fundamental in enzymatic processes (Cruz-Neto et al.,2015).

44
6.5 Leaf nutrient concentrations Leaf nutrient analysis has been widely used as a tool to indicate the nutritional status of cacao trees (Paramo et al., 2016, van Vliet and Giller, 2017). Several authors have defined optimal nutrient concentration in cacao leaves, and ranges are shown in Table 5. Optimal nutrient ranges vary among authors, especially for micronutrients. The last is expected as leaf nutrient analyses depends on several factors e.g. leaf age, flush status, fruit bearing and light intensity, management practices e.g. fertilization and edaphic-climatic condition under which the experiments were performed (Páramos et al., 2016; Van Vliet and Giller.2017). Before the comparison it is important to mention that, according to CNRA technicians, fertilizers (organic or synthetic) were only applied at planting, for all plots. For N, P, K and Ca, the youngest trees (1.5 year) presented the highest nutrient content in the leaves and values are within the optimal nutrient content of leaves. The last was expected as the 1.5-year-old cacao trees were planted in a plot that was previously a secondary forest and thus it is assumed that it presented a high natural fertility of the soils. For the same nutrients, older trees presented lower values, still within the optimal range but in the lower part of the range. Especially for K it is evident a decreasing trend from 5 to 19-year-old trees. The last is due to a constant extraction of cacao pods that contain high K content. Pods (beans and husk) represent the main nutrient removal form cacao production systems (Hartemink, 2005). If nutrients, especially K are not added to the system, there is a gradual decrease of the K content in the soils, leading to deficient values in the leaves. Regarding the micro-nutrients without distinction between tree ages, Cu and Zn are lower than the recommended, whereas B, Fe and Mn are within the optimal ranges. Worth mentioning that Fe is highly variable among authors.
Table 5. Optimal nutrient concentration in cacao leaves according to several authors.
Author A B C D E F G H
N
%
1.61 - 1.83 1.77 - 2.19 1.9 - 2.3 2.34 - 2.4 1.80 - 2.50 1.8 - 2.0 > 1.8 1.5 – 2.5
P 0.12 - 0.19 0.09 - 0.12 0.15 - 0.18 0.21 - 0.22 0.10 - 0.18 0.13 - 0.2 0.16 - 0.2 0.08 -0.2
K 0.9 - 1.27 0.04 - 1.25 0.17 - 0.2 1.65 - 1.71 1.00 - 1.2 1.2 - 2.0 - 0.6 - 2.2
Ca 1.69 - 2.45 1.67 - 2.22 0.9 - 1.2 0.83 - 0.9 - - - 0.8 – 2.5
Mg 0.44 - 0.71 0.64 - 0.9 0.4 - 0.7 0.43 - 0.45 - - - 0.3 – 0.8
S 0.2 - 0.23 0.14 - 0.2 0.17 - 0.2 - - - - 0.06-0.2
B
mg/kg
25 - 39 - 30 - 40 - - - - 30 - 50
Cu 16 - 73 6 - 8 10 - 15 38 – 44 - - - 4 – 14
Fe 195 - 346 33 - 64 150 - 200 62 - 83 - - - 60 - 250
Mn 354 - 547 242 - 435 150 - 200 194 - 226 - - - >200
Zn 34 - 62 32 - 75 50 - 70 116 - 130 - - - 30 - 150
A: Páramo et al., (2016) in Colombia; B: Abreu, (1996) in Brazil; C: Malavolta et al. (1997); D: Sodré, (2002) in Brazil; E: Loué, (1961, 1962), in Cote d´Ivoire; F: Murray, (1966) in Trinidad y Tobago and Wessel, (1971) in Nigeria. H: Results of our study in Ivory Coast, for mature leaves.
6.6 Non-destructive methods to determine nutrient content of plant components
6.6.1 Leaves
The effect of canopy position on leaf morphological characteristics was previously discussed and was expected to have an effect on leaf N content. It was hypothesized that the use of a portable chlorophyll meter or SPAD meter was a promising method to estimate the N content of leaves. There was no relationship SPAD readings and N content. Based in our study, the use of a SPAD meter to determine N content is not recommended. Our results showed large differences on SPAD units between mature
45
leaves located in the lower and upper canopy. Contrary as expected, the N content of mature leaves at different canopy position did not differ significantly. Therefore, a calibration curve relating SPAD unit and N content could not be established, as the observed differences in the SPAD could not explain the N content of leaves. For cacao, such a curve has been obtained by (Dantas et al., 2012). In their study, the authors selected four cacao trees of more than four years old. The authors selected 20 locations in Bahía, Brazil in order to obtain different edaphic and topographic conditions. Studied sites presented shade trees that were periodically pruned. The shade coverage was not stated. Per location four trees were chosen, and per tree eight leaves were collected, each being the third from the apex of a recent produced branch, fully expanded and mature. In their study, the variation of SPAD units explained 54% of the N content. They obtained the following equation: N content (N g/kg-1) = 4.717 + 0.31* SPAD (units). We compared the results of our N content based on Dantas et al (2012) equation. We found that for leaves in the upper canopy, N content was underestimated (about 10%), whereas for leaves in the lower canopy N content was overestimated (about 10%). However, our study did not find significant differences between the N content of mature leaves at different canopy positions, therefore the equation is not applicable for our study. Based on Dantas et al., (2012) methodology and results it can be established that edaphic-climatic conditions have a great effect on the N content of mature cacao leaves. The SPAD meter utilizes two light emitting diodes (650-940nm) to measure transmission through leaves of red and infra-red light. Basically, the SPAD meter measures the greenness of the leaves and correlates it with the chlorophyll content (Markwell et al., 1995, Parry et al., 2014). For this reason we found significant differences between SPAD units at different canopy positions. Leaf position had a significant effect on leaf thickness, hence affecting light transmission.
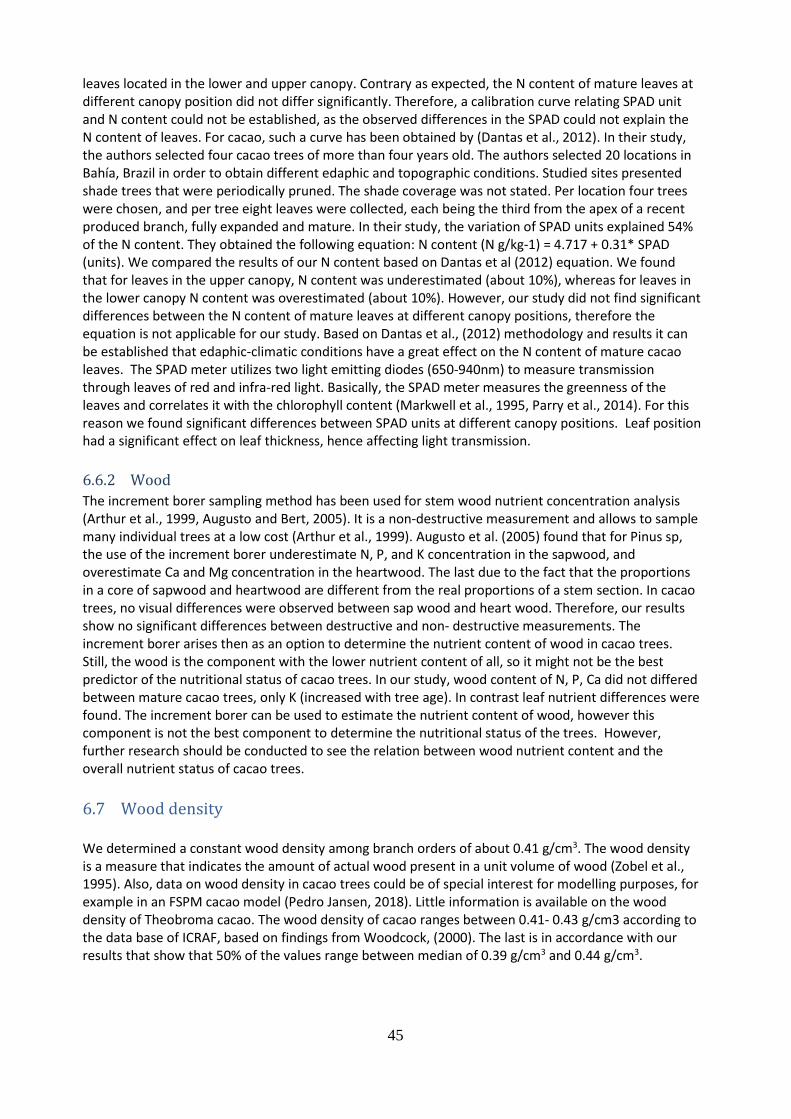
6.6.2 Wood
The increment borer sampling method has been used for stem wood nutrient concentration analysis (Arthur et al., 1999, Augusto and Bert, 2005). It is a non-destructive measurement and allows to sample many individual trees at a low cost (Arthur et al., 1999). Augusto et al. (2005) found that for Pinus sp, the use of the increment borer underestimate N, P, and K concentration in the sapwood, and overestimate Ca and Mg concentration in the heartwood. The last due to the fact that the proportions in a core of sapwood and heartwood are different from the real proportions of a stem section. In cacao trees, no visual differences were observed between sap wood and heart wood. Therefore, our results show no significant differences between destructive and non- destructive measurements. The increment borer arises then as an option to determine the nutrient content of wood in cacao trees. Still, the wood is the component with the lower nutrient content of all, so it might not be the best predictor of the nutritional status of cacao trees. In our study, wood content of N, P, Ca did not differed between mature cacao trees, only K (increased with tree age). In contrast leaf nutrient differences were found. The increment borer can be used to estimate the nutrient content of wood, however this component is not the best component to determine the nutritional status of the trees. However, further research should be conducted to see the relation between wood nutrient content and the overall nutrient status of cacao trees.
6.7 Wood density We determined a constant wood density among branch orders of about 0.41 g/cm3. The wood density is a measure that indicates the amount of actual wood present in a unit volume of wood (Zobel et al., 1995). Also, data on wood density in cacao trees could be of special interest for modelling purposes, for example in an FSPM cacao model (Pedro Jansen, 2018). Little information is available on the wood density of Theobroma cacao. The wood density of cacao ranges between 0.41- 0.43 g/cm3 according to the data base of ICRAF, based on findings from Woodcock, (2000). The last is in accordance with our results that show that 50% of the values range between median of 0.39 g/cm3 and 0.44 g/cm3.
46
7 Conclusions We determined that management practices such as pruning have an impact on the biomass distribution among cacao tree components. Cacao trees showed the greatest vegetative growth from 1.5 until 5 years old, then reaching a plateau. In fact pruning limited tree height and branches biomass. Based on this, we developed allometric equations to predict tree biomass. Our equations did not coincide with the findings of other studies. As pruning and other management practices are even farm specific, based in our results it can be stated that general allometric equations cannot be obtained. Also, we found that recyclable plant components presented a higher nutrient content, like leaves and pods, whereas less recyclable components like stem and branches, showed a lower value. The last in combination with the soil nutrient stocks, is an important component to understands and manage efficiently the nutrient balances of cacao agroecosystems in order to achieve long term sustainability of the production systems. Our major findings were on leaf characteristics. We determined translocation of certain nutrients from senescing leaves to newly produced leaves, and concentration of other nutrient of immobile nutrients in senescing leaves. The last is of great importance as it gives insights on the intrinsic leaf nutrient management mechanisms of cacao trees. Additionally, we found that leaf position in the canopy affected one leaf morphological characteristic, the Specific Leaf Area, a measure of the leaf thickness. Leaves in the upper canopy were significantly thicker than leaves in the lower canopy. This result provides insights on the effects of light incidence on leaf structure. Moreover, based in our results, the use of a SPAD meter as a non-destructive method for leaf nutrient content determination is not applicable. We found significant SPAD readings among leaves in different position but not in the N content. It seems like the soil and climatic condition have a greater effect on leaf N content than the leaf position in the canopy.
47
8 References ABO‐HAMED, S., COLLIN, H. & HARDWICK, K. 1983. Biochemical and physiological aspects
of leaf development in cocoa (Theobroma cacao L.). New Phytologist, 95, 9-17.
ALMEIDA, A.-A. F. D. & VALLE, R. R. 2007. Ecophysiology of the cacao tree. Brazilian Journal
of Plant Physiology, 19, 425-448.
ALPIZAR, L., FASSBENDER, H. W., HEUVELDOP, J., FÖLSTER, H. & ENRIQUEZ, G. 1986.
Modelling agroforestry systems of cacao (Theobroma cacao) with laurel (Cordia alliodora)
and poro (Erythrina poeppigiana) in Costa Rica. Agroforestry systems, 4, 175-189.
ANDRÉ, F., JONARD, M. & PONETTE, Q. 2010. Biomass and nutrient content of sessile oak
(Quercus petraea (Matt.) Liebl.) and beech (Fagus sylvatica L.) stem and branches in a
mixed stand in southern Belgium. Science of the total environment, 408, 2285-2294.
ANEANI, F. & OFORI-FRIMPONG, K. 2013. An analysis of yield gap and some factors of cocoa
(Theobroma cacao) yields in Ghana. Sustainable Agriculture Research, 2, 117.
ARANGUREN, J., ESCALANTE, G. & HERRERA, R. 1982a. Nitrogen cycle of tropical perennial
crops under shade trees. Plant and Soil, 67, 247-258.
ARANGUREN, J., ESCALANTE, G. & HERRERA, R. 1982b. Nitrogen cycle of tropical perennial
crops under shade trees - II. Cacao. Plant and Soil, 67, 259-269.
ARTHUR, M., SICCAMA, T. & YANAI, R. 1999. Calcium and magnesium in wood of northern
hardwood forest species: relations to site characteristics. Canadian journal of forest
research, 29, 339-346.
ASARE, R. 2005. Cocoa agroforests in West Africa: a look at activities on preferred trees in the
farming systems, Forest & Landscape Denmark (FLD) Copenhagen.
ATWELL, B. J. 1999. Plants in action: adaptation in nature, performance in cultivation,
Macmillan Education AU.
AUGUSTO, L. & BERT, D. 2005. Estimating stemwood nutrient concentration with an increment
borer: a potential source of error. Forestry, 78, 451-455.
BAKER, N., HARDWICK, K. & JONES, P. 1975. Biochemical and physiological aspects of leaf
development in cocoa (Theobroma cacao). New Phytologist, 75, 513-518.
BARTHELEMY, D. & CARAGLIO, Y. 2007. Plant architecture: A dynamic, multilevel and
comprehensive approach to plant form, structure and ontogeny. Annals of Botany, 99, 375-
407.
BEER, J., BONNEMANN, A., CHAVEZ, W., FASSBENDER, H. W., IMBACH, A. & MARTEL,
I. 1990. Modelling agroforestry systems of cacao (Theobroma cacao) with laurel (Cordia
alliodora) or poro (Erythrina poeppigiana) in Costa Rica. Agroforestry systems, 12, 229-249.
BOTE, A. D., AYALEW, B., OCHO, F. L., ANTEN, N. P. R. & VOS, J. 2018. Analysis of coffee
(Coffea arabica L.) performance in relation to radiation levels and rates of nitrogen supply I.
Vegetative growth, production and distribution of biomass and radiation use efficiency.
European Journal of Agronomy, 92, 115-122.
BOUVET, A. & MELUN, F. 2013. Nutrient concentration and allometric models for hybrid
eucalyptus planted in France. Annals of forest science, 70, 251-260.
CORNELISSEN, J., LAVOREL, S., GARNIER, E., DIAZ, S., BUCHMANN, N., GURVICH, D.,
REICH, P., TER STEEGE, H., MORGAN, H. & VAN DER HEIJDEN, M. 2003. A
handbook of protocols for standardised and easy measurement of plant functional traits
worldwide. Australian journal of Botany, 51, 335-380.
DANTAS, P. A. D. S., SOUZA JÚNIOR, J. O. D., GOMES, F. P. & RIBEIRO, D. O. 2012. Non
destructive estimation of foliar nitrogen in cacao tree using chlorophyll meter. Revista
Brasileira de Fruticultura, 34, 669-677.
DOSSA, E., FERNANDES, E., REID, W. & EZUI, K. 2008a. Above-and belowground biomass,
nutrient and carbon stocks contrasting an open-grown and a shaded coffee plantation.
Agroforestry Systems, 72, 103-115.
48
DOSSA, E. L., FERNANDES, E. C. M., REID, W. S. & EZUI, K. 2008b. Above- and
belowground biomass, nutrient and carbon stocks contrasting an open-grown and a shaded
coffee plantation. Agroforestry Systems, 72, 103-115.
DUMONT, E. S., GNAHOUA, G.-M., OHOUO, L., SINCLAIR, F. L. & VAAST, P. 2014.
Farmers in Côte d’Ivoire value integrating tree diversity in cocoa for the provision of
ecosystem services. Agroforestry systems, 88, 1047-1066.
DURAND, J. B., GUÉDON, Y., CARAGLIO, Y. & COSTES, E. 2005. Analysis of the plant
architecture via tree‐structured statistical models: the hidden Markov tree models. New
Phytologist, 166, 813-825.
FASSBENDER, H., BEER, J., HEUVELDOP, J., IMBACH, A., ENRIQUEZ, G. &
BONNEMANN, A. 1991. Ten year balances of organic matter and nutrients in agroforestry
systems at CATIE, Costa Rica. Forest Ecology and management, 45, 173-183.
GOCKOWSKI, J., AFARI-SEFA, V., SARPONG, D. B., OSEI-ASARE, Y. B. & AGYEMAN, N.
F. 2013. Improving the productivity and income of Ghanaian cocoa farmers while
maintaining environmental services: What role for certification? International Journal of
Agricultural Sustainability, 11, 331-346.
GOCKOWSKI, J. & SONWA, D. 2011. Cocoa intensification scenarios and their predicted impact
on CO2 emissions, biodiversity conservation, and rural livelihoods in the Guinea rain forest
of West Africa. Environmental Management, 48, 307-321.
HARTEMINK, A. E. 2005. Nutrient stocks, nutrient cycling, and soil changes in cocoa ecosystems:
a review. Advances in agronomy, 86, 227-253.
HEUVELOP, J., FASSBENDER, H., ALPIZAR, L., ENRIQUEZ, G. & FALSTER, H. 1988.
Modelling agroforestry systems of cacao (Theobroma cacao) in Costa Rica. II. Cacao and
wood production, litter production and decomposition. Agrofor Syst, 6, 37-48.
INGRAM, V., WAARTS, Y., GE, L., VAN VUGT, S., WEGNER, L., PUISTER-JANSEN, L.,
RUF, F. & TANOH, R. 2014. The IDH Cocoa Productivity and Quality Programme (CPQP)
in Côte d’Ivoire. Impact Assessment Framework and Baseline, LEI Wageningen UR
(University & Research Centre), LEI Report, 16, 196.
JONES JR, J. B. & CASE, V. W. 1990. Sampling, handling and analyzing plant tissue samples.
Sampling, handling and analyzing plant tissue samples., 389-427.
KALRA, Y. 1997. Handbook of reference methods for plant analysis, CRC press.
KOKO, L. K., SNOECK, D., LEKADOU, T. T. & ASSIRI, A. A. 2013. Cacao-fruit tree
intercropping effects on cocoa yield, plant vigour and light interception in Côte d’Ivoire.
Agroforestry systems, 87, 1043-1052.
LEE, D. W., BRAMMEIER, S. & SMITH, A. P. 1987. The selective advantages of anthocyanins in
developing leaves of mango and cacao. Biotropica, 40-49.
MAATHUIS, F. J., DIATLOFF, E. & MAATHUIS, F. J. 2013. Plant mineral nutrients: methods
and protocols.
MARKWELL, J., OSTERMAN, J. C. & MITCHELL, J. L. 1995. Calibration of the Minolta
SPAD-502 leaf chlorophyll meter. Photosynthesis research, 46, 467-472.
MEERTS, P. 2002. Mineral nutrient concentrations in sapwood and heartwood: a literature review.
Annals of Forest Science, 59, 713-722.
MIYAJI, K.-I., DA SILVA, W. S. & ALVIM, P. D. T. 1997. Longevity of leaves of a tropical tree,
Theobroma cacao, grown under shading, in relation to position within the canopy and time
of emergence. The New Phytologist, 135, 445-454.
MORHART, C., SHEPPARD, J. P., SCHULER, J. K. & SPIECKER, H. 2016. Above-ground
woody biomass allocation and within tree carbon and nutrient distribution of wild cherry
(Prunus avium L.)–a case study. Forest Ecosystems, 3, 4.
MOSER, G., LEUSCHNER, C., HERTEL, D., HÖLSCHER, D., KÖHLER, M., LEITNER, D.,
MICHALZIK, B., PRIHASTANTI, E., TJITROSEMITO, S. & SCHWENDENMANN, L.
49
2010. Response of cocoa trees (Theobroma cacao) to a 13-month desiccation period in
Sulawesi, Indonesia. Agroforestry Systems, 79, 171-187.
NETO, C., DE OLIVEIRA, R., SOUZA JÚNIOR, J. O. D., SODRÉ, G. A. & BALIGAR, V. C.
2015. GROWTH AND NUTRITION OF CACAO SEEDLINGS INFLUENCED BY ZINC
APLICATION IN SOIL. Revista Brasileira de Fruticultura, 37, 1053-1064.
NIEMENAK, N., CILAS, C., ROHSIUS, C., BLEIHOLDER, H., MEIER, U. & LIEBEREI, R.
2010. Phenological growth stages of cacao plants (Theobroma sp.): codification and
description according to the BBCH scale. Annals of Applied Biology, 156, 13-24.
NYGREN, P., LEBLANC, H. A., LU, M. & LUCIANO, C. A. G. 2013. Distribution of coarse and
fine roots of Theobroma cacao and shade tree Inga edulis in a cocoa plantation. Annals of
forest science, 70, 229-239.
ORCHARD, J., COLLIN, H. & HARDWICK, K. 1980. Biochemical and physiological aspects of
leaf development in cocoa (Theobroma cacao). IV. Changes in growth inhibitors. Plant
Science Letters, 18, 299-305.
PARAMO, P., JAZBLEIDI, Y., GOMÉZ CARABALÍ, A. & MENJIVAR FLORES, J. C. 2016.
Influence of the relationship among nutrients on yield of cocoa (Theobroma cacao L.)
clones. Acta Agronómica, 65, 176-182.
PARRY, C., BLONQUIST, J. & BUGBEE, B. 2014. In situ measurement of leaf chlorophyll
concentration: analysis of the optical/absolute relationship. Plant, cell & environment, 37,
2508-2520.
PONETTE, Q., RANGER, J., OTTORINI, J. M. & ULRICH, E. 2001. Aboveground biomass and
nutrient content of five Douglas-fir stands in France. Forest Ecology and Management, 142,
109-127.
ROSELL, J. A. 2016. Bark thickness across the angiosperms: more than just fire. New Phytologist,
211, 90-102.
ROXBURGH, S., PAUL, K., CLIFFORD, D., ENGLAND, J. & RAISON, R. 2015. Guidelines for
constructing allometric models for the prediction of woody biomass: how many individuals
to harvest? Ecosphere, 6, 1-27.
RUF, F., SCHROTH, G. & DOFFANGUI, K. 2015. Climate change, cocoa migrations and
deforestation in West Africa: What does the past tell us about the future? Sustainability
Science, 10, 101-111.
SANTANA, M. & CABALA-ROSAND, P. 1982. Dynamics of nitrogen in a shaded cacao
plantation. Plant and Soil, 67, 271-281.
SCOFFONI, C., KUNKLE, J., PASQUET‐KOK, J., VUONG, C., PATEL, A. J.,
MONTGOMERY, R. A., GIVNISH, T. J. & SACK, L. 2015. Light‐induced plasticity in
leaf hydraulics, venation, anatomy, and gas exchange in ecologically diverse Hawaiian
lobeliads. New Phytologist, 207, 43-58.
SNOECK, J. & JADIN, P. Cacao (# Theobroma cacao# L.). 1992. IFA.
SOLAR, A. & ŠTAMPAR, F. 2003. Genotypic differences in branching pattern and fruiting habit
in common walnut (Juglans regia L.). Annals of botany, 92, 317-325.
SOMARRIBA, E. & BEER, J. 2011. Productivity of Theobroma cacao agroforestry systems with
timber or legume service shade trees. Agroforestry systems, 81, 109-121.
SUBLER, S., MUÑOZ ARBOLEDA, F., SOMARRIBA, E. B., MORA, S., NÚÑEZ, M. I.,
SÁMANO, G. M., BÁEZ, J. L., POSSÚ, B., SAYA, W. & OM ORDÓÑEZ JURADO, H.
1994. Allometric equations for estimating the above ground biosmass of cacao stands in the
eastern Amazon Basin. Global Environmental Facility, Oficina San José (Costa Rica)
Centro Agronómico Tropical de Investigación y Enseñanza, Turrialba (Costa Rica).
THONG, K. & NG, W. 1980. Growth and nutrients composition of monocrop cocoa plants on
inland Malaysian soils. Growth and nutrients composition of monocrop cocoa plants on
inland Malaysian soils., 262-286.
50
TJEUW, J., MULIA, R., SLINGERLAND, M. & VAN NOORDWIJK, M. 2015. Tree or shrub: a
functional branch analysis of Jatropha curcas L. Agroforestry Systems, 89, 841-856.
VAN VLIET, J. A. & GILLER, K. E. 2017. Chapter Five - Mineral Nutrition of Cocoa: A Review.
In: SPARKS, D. L. (ed.) Advances in Agronomy. Academic Press.
WARREN, J. M. & EMAMDIE, D. Z. 1997. Reproductive allocation and pollinator distributions in
cauliflorus trees in Trinidad. Journal of tropical ecology, 13, 337-345.
WESSEL, M. & QUIST-WESSEL, P. F. 2015a. Cocoa production in West Africa, a review and
analysis of recent developments. NJAS-Wageningen Journal of Life Sciences, 74, 1-7.
WESSEL, M. & QUIST-WESSEL, P. M. F. 2015b. Cocoa production in West Africa, a review and
analysis of recent developments. NJAS - Wageningen Journal of Life Sciences, 74-75, 1-7.
WIBAUX, T., KONAN, D.-C., SNOECK, D., JAGORET, P. & BASTIDE, P. 2017. Study of tree-
to-tree yield variability among seedling-based cacao populations in an industrial plantation
in côte d'ivoire. Experimental Agriculture, 1-12.
WOOD, G. A. R. & LASS, R. 2008. Cocoa, John Wiley & Sons.
YAN, Z., LI, P., CHEN, Y., HAN, W. & FANG, J. 2016. Nutrient allocation strategies of woody
plants: an approach from the scaling of nitrogen and phosphorus between twig stems and
leaves. Scientific reports, 6, 20099.
YANG, X., TANG, Z., JI, C., LIU, H., MA, W., MOHHAMOT, A., SHI, Z., SUN, W., WANG, T.
& WANG, X. 2014. Scaling of nitrogen and phosphorus across plant organs in shrubland
biomes across Northern China. Scientific reports, 4.
ZUIDEMA, P. A., LEFFELAAR, P. A., GERRITSMA, W., MOMMER, L. & ANTEN, N. P. R.
2005. A physiological production model for cocoa (Theobroma cacao): model presentation,
validation and application. Agricultural Systems, 84, 195-225.
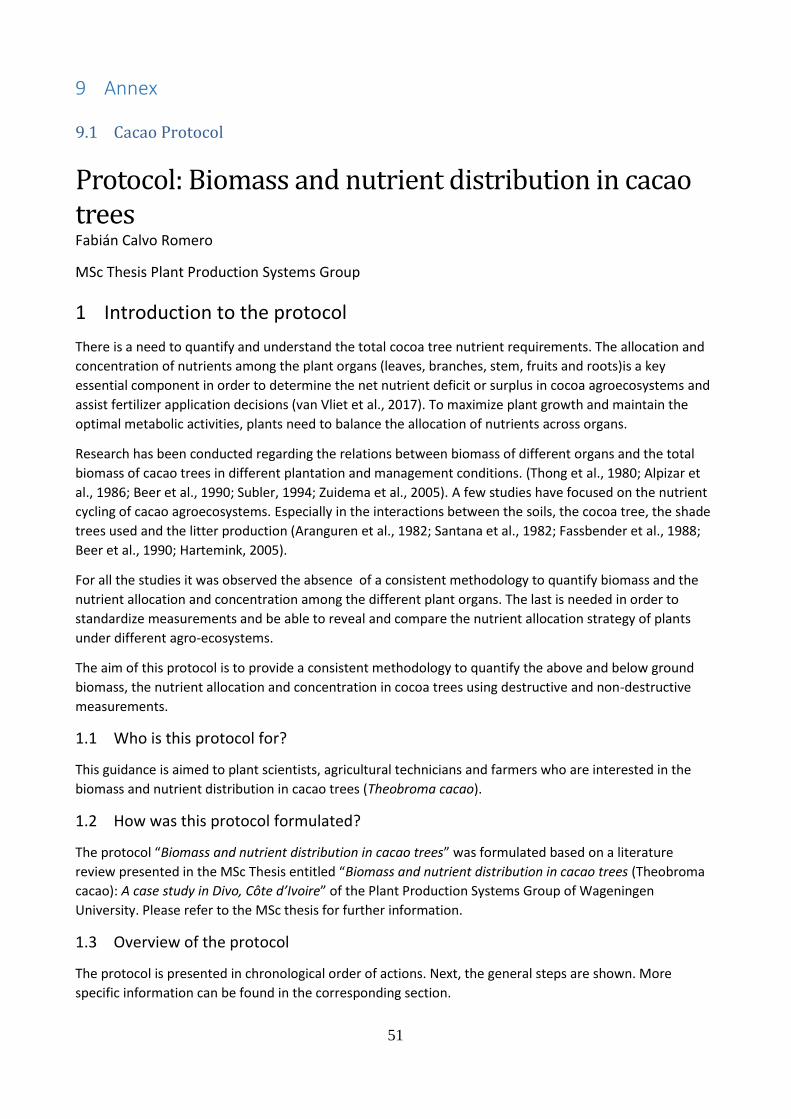
51
9 Annex
9.1 Cacao Protocol
Protocol: Biomass and nutrient distribution in cacao trees Fabián Calvo Romero
MSc Thesis Plant Production Systems Group
1 Introduction to the protocol
There is a need to quantify and understand the total cocoa tree nutrient requirements. The allocation and
concentration of nutrients among the plant organs (leaves, branches, stem, fruits and roots)is a key
essential component in order to determine the net nutrient deficit or surplus in cocoa agroecosystems and
assist fertilizer application decisions (van Vliet et al., 2017). To maximize plant growth and maintain the
optimal metabolic activities, plants need to balance the allocation of nutrients across organs.
Research has been conducted regarding the relations between biomass of different organs and the total
biomass of cacao trees in different plantation and management conditions. (Thong et al., 1980; Alpizar et
al., 1986; Beer et al., 1990; Subler, 1994; Zuidema et al., 2005). A few studies have focused on the nutrient
cycling of cacao agroecosystems. Especially in the interactions between the soils, the cocoa tree, the shade
trees used and the litter production (Aranguren et al., 1982; Santana et al., 1982; Fassbender et al., 1988;
Beer et al., 1990; Hartemink, 2005).
For all the studies it was observed the absence of a consistent methodology to quantify biomass and the
nutrient allocation and concentration among the different plant organs. The last is needed in order to
standardize measurements and be able to reveal and compare the nutrient allocation strategy of plants
under different agro-ecosystems.
The aim of this protocol is to provide a consistent methodology to quantify the above and below ground
biomass, the nutrient allocation and concentration in cocoa trees using destructive and non-destructive
measurements.
1.1 Who is this protocol for?
This guidance is aimed to plant scientists, agricultural technicians and farmers who are interested in the
biomass and nutrient distribution in cacao trees (Theobroma cacao).
1.2 How was this protocol formulated?
The protocol “Biomass and nutrient distribution in cacao trees” was formulated based on a literature
review presented in the MSc Thesis entitled “Biomass and nutrient distribution in cacao trees (Theobroma
cacao): A case study in Divo, Côte d’Ivoire” of the Plant Production Systems Group of Wageningen
University. Please refer to the MSc thesis for further information.
1.3 Overview of the protocol
The protocol is presented in chronological order of actions. Next, the general steps are shown. More
specific information can be found in the corresponding section.

52
1. Selection of trees for the study: The number of trees to be selected will depend on the budget of
the project and of course on the availability of trees. At least three trees per age category is
recommended.
2. Defining tree architecture: In this protocol, tree architecture is defined according to the branching
order, the tree height, the stem diameter and the canopy size. Also, tree branches are labelled
according to the branching order.
3. Use of SPAD meter as a non-destructive measurement: SPAD measurements are taken for each
leaf category and subcategories (Table 1). Leaves are then analysed for nutritional content. A
relationship is established relating the SPAD measurements and the Nitrogen content.
4. Debranching of cacao trees: This process requires special attention. The coming steps will depend
on how good the debranching of the cacao tree is carried out. All branches must be correctly
labelled according to their branch order. The canopy is divided in two, lower part and upper part.
The debranching starts with the branches containing leaves in the lower part of the canopy. Leaves
and pods still remain attached to the branches.
5. Leaves biomass and distribution in the canopy: Leaves are classified into three groups: 1) leaves
form the current flush; 2) leaves form the previous flush and; 3) leaves in senescence. First leaves
present in branches from the lower canopy are harvest according to their category and weighted.
6. Leaf area determination: Leaf area is determined using Easy Leaf Area software. Only leaves from
the previous flush, and its respective sub-categories are selected. Leaves are randomly selected and
leaf area is determined according to the software protocol.
7. Branching classification: After collecting all leaves, branches are cut and classified into their
corresponding branch order. Pods still remain attached to the branches.
8. Pods biomass and distribution: Immature and mature pods are collected and counted according to
the branch order. Samples are collected for dry matter determination and nutrient analysis.
9. Stem and branches biomass: Biomass per branch category is determined. Disc samples are
collected for dry matter determination and nutrient analysis.
10. Use of an Increment Borer as a non-destructive measurement: Using an increment borer, core
samples are collected from the stem and branch order 1.
11. Roots biomass: Roots are classified into lateral roots and tap root. Lateral roots are exposed and
followed as far as possible, then cut, measured and weighted. The tap root is excavated, weighted
and measured.
12. Dry matter determination: Samples from all plant organs (leaves, branches, stem, pods and roots)
are prepared for dry matter determination.
13. Preparation for nutrient analyses: Samples from all plant organs (leaves, branches, stem, pods and
roots) are prepared for nutrient analysis. The procedure involves drying, chopping, grinding,
weighting, defining the type of nutrient analysis required among others.
Table 1. Plant organ categories and number of nutrient analysis required per cacao tree.
Sample category Subcategory Per tree
Leaves Previous
Flush
Fully Exposed 3
Middle Exposure 3
Full Shade 3
Leaves Current
Flush
Small-Red 3
Fully Expanded 3
Leaves Senescence Yellow 3
Stem-Wood 3
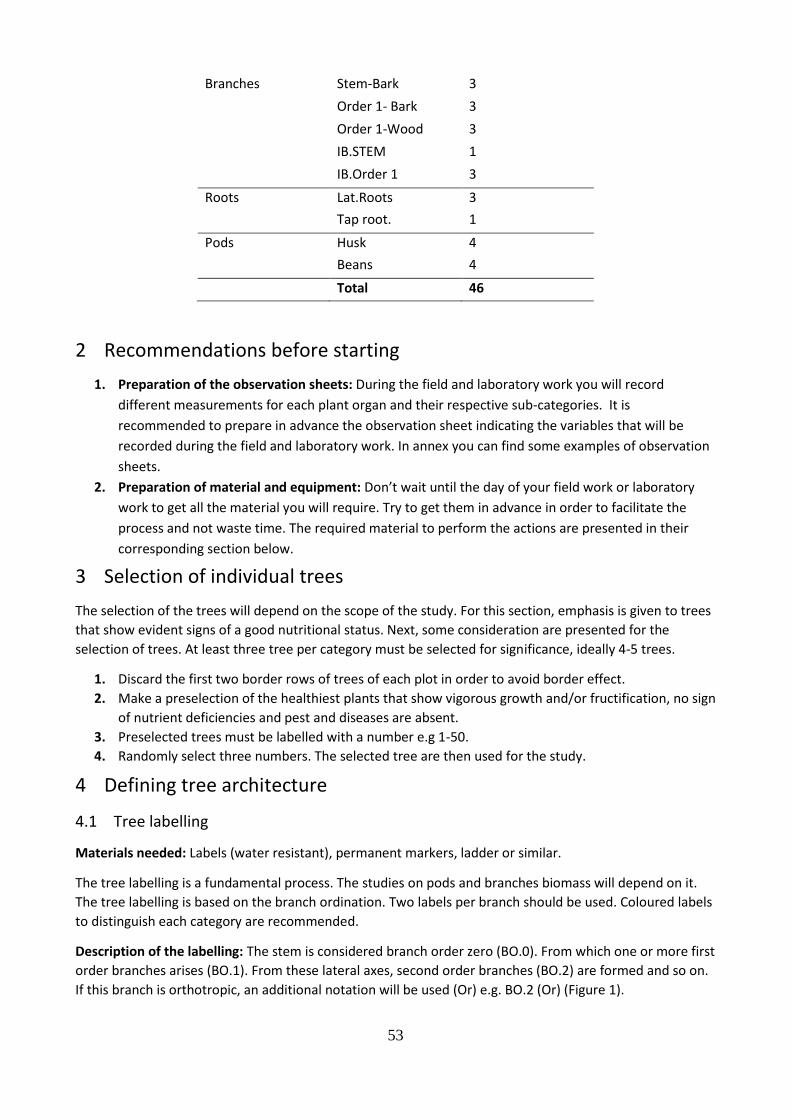
53
Branches Stem-Bark 3
Order 1- Bark 3
Order 1-Wood 3
IB.STEM 1
IB.Order 1 3
Roots Lat.Roots 3
Tap root. 1
Pods Husk 4
Beans 4
Total 46
2 Recommendations before starting
1. Preparation of the observation sheets: During the field and laboratory work you will record
different measurements for each plant organ and their respective sub-categories. It is
recommended to prepare in advance the observation sheet indicating the variables that will be
recorded during the field and laboratory work. In annex you can find some examples of observation
sheets.
2. Preparation of material and equipment: Don’t wait until the day of your field work or laboratory
work to get all the material you will require. Try to get them in advance in order to facilitate the
process and not waste time. The required material to perform the actions are presented in their
corresponding section below.
3 Selection of individual trees
The selection of the trees will depend on the scope of the study. For this section, emphasis is given to trees
that show evident signs of a good nutritional status. Next, some consideration are presented for the
selection of trees. At least three tree per category must be selected for significance, ideally 4-5 trees.
1. Discard the first two border rows of trees of each plot in order to avoid border effect.
2. Make a preselection of the healthiest plants that show vigorous growth and/or fructification, no sign
of nutrient deficiencies and pest and diseases are absent.
3. Preselected trees must be labelled with a number e.g 1-50.
4. Randomly select three numbers. The selected tree are then used for the study.
4 Defining tree architecture
4.1 Tree labelling
Materials needed: Labels (water resistant), permanent markers, ladder or similar.
The tree labelling is a fundamental process. The studies on pods and branches biomass will depend on it.
The tree labelling is based on the branch ordination. Two labels per branch should be used. Coloured labels
to distinguish each category are recommended.
Description of the labelling: The stem is considered branch order zero (BO.0). From which one or more first
order branches arises (BO.1). From these lateral axes, second order branches (BO.2) are formed and so on.
If this branch is orthotropic, an additional notation will be used (Or) e.g. BO.2 (Or) (Figure 1).
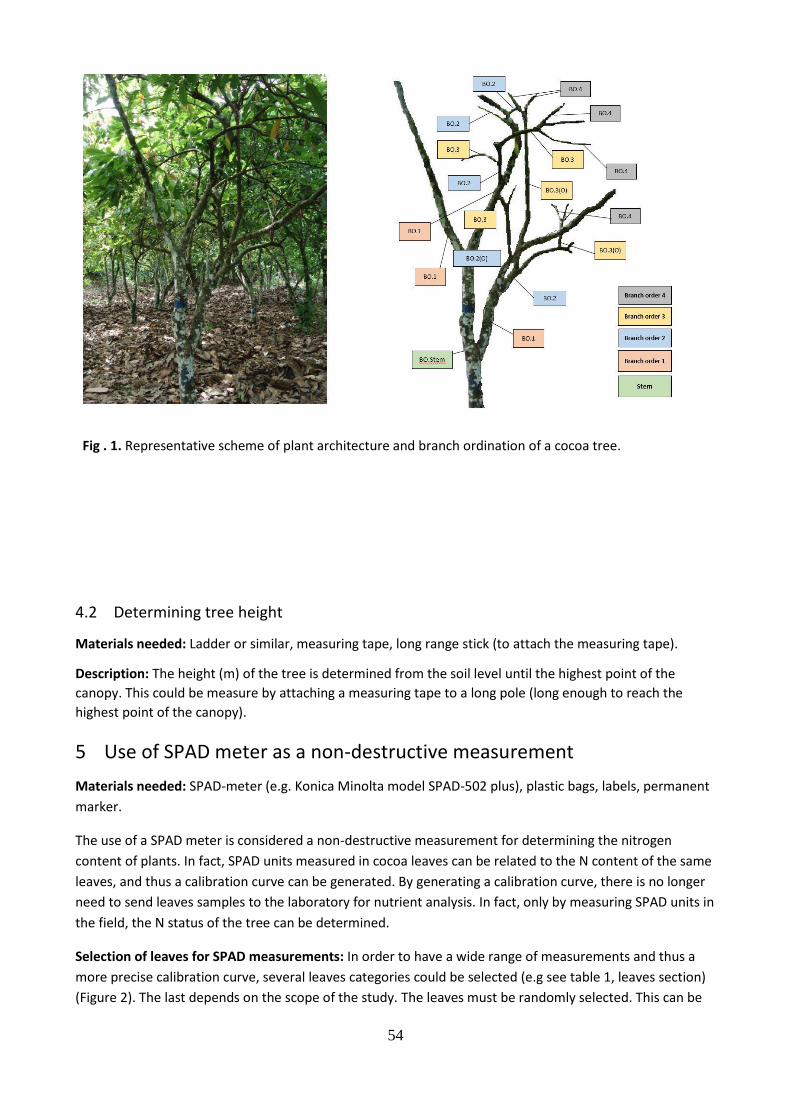
54
Fig . 1. Representative scheme of plant architecture and branch ordination of a cocoa tree.
4.2 Determining tree height
Materials needed: Ladder or similar, measuring tape, long range stick (to attach the measuring tape).
Description: The height (m) of the tree is determined from the soil level until the highest point of the
canopy. This could be measure by attaching a measuring tape to a long pole (long enough to reach the
highest point of the canopy).
5 Use of SPAD meter as a non-destructive measurement
Materials needed: SPAD-meter (e.g. Konica Minolta model SPAD-502 plus), plastic bags, labels, permanent
marker.
The use of a SPAD meter is considered a non-destructive measurement for determining the nitrogen
content of plants. In fact, SPAD units measured in cocoa leaves can be related to the N content of the same
leaves, and thus a calibration curve can be generated. By generating a calibration curve, there is no longer
need to send leaves samples to the laboratory for nutrient analysis. In fact, only by measuring SPAD units in
the field, the N status of the tree can be determined.
Selection of leaves for SPAD measurements: In order to have a wide range of measurements and thus a
more precise calibration curve, several leaves categories could be selected (e.g see table 1, leaves section)
(Figure 2). The last depends on the scope of the study. The leaves must be randomly selected. This can be
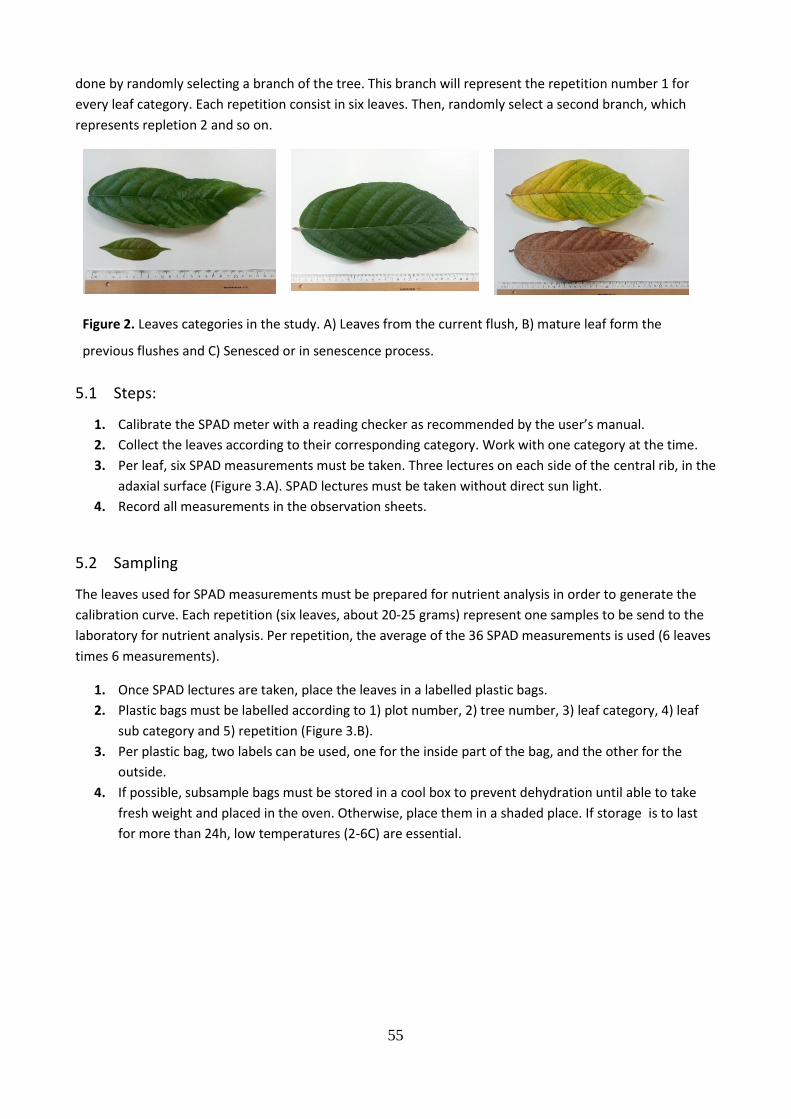
55
done by randomly selecting a branch of the tree. This branch will represent the repetition number 1 for
every leaf category. Each repetition consist in six leaves. Then, randomly select a second branch, which
represents repletion 2 and so on.
Figure 2. Leaves categories in the study. A) Leaves from the current flush, B) mature leaf form the
previous flushes and C) Senesced or in senescence process.
5.1 Steps:
1. Calibrate the SPAD meter with a reading checker as recommended by the user’s manual.
2. Collect the leaves according to their corresponding category. Work with one category at the time.
3. Per leaf, six SPAD measurements must be taken. Three lectures on each side of the central rib, in the
adaxial surface (Figure 3.A). SPAD lectures must be taken without direct sun light.
4. Record all measurements in the observation sheets.
5.2 Sampling
The leaves used for SPAD measurements must be prepared for nutrient analysis in order to generate the
calibration curve. Each repetition (six leaves, about 20-25 grams) represent one samples to be send to the
laboratory for nutrient analysis. Per repetition, the average of the 36 SPAD measurements is used (6 leaves
times 6 measurements).
1. Once SPAD lectures are taken, place the leaves in a labelled plastic bags.
2. Plastic bags must be labelled according to 1) plot number, 2) tree number, 3) leaf category, 4) leaf
sub category and 5) repetition (Figure 3.B).
3. Per plastic bag, two labels can be used, one for the inside part of the bag, and the other for the
outside.
4. If possible, subsample bags must be stored in a cool box to prevent dehydration until able to take
fresh weight and placed in the oven. Otherwise, place them in a shaded place. If storage is to last
for more than 24h, low temperatures (2-6C) are essential.
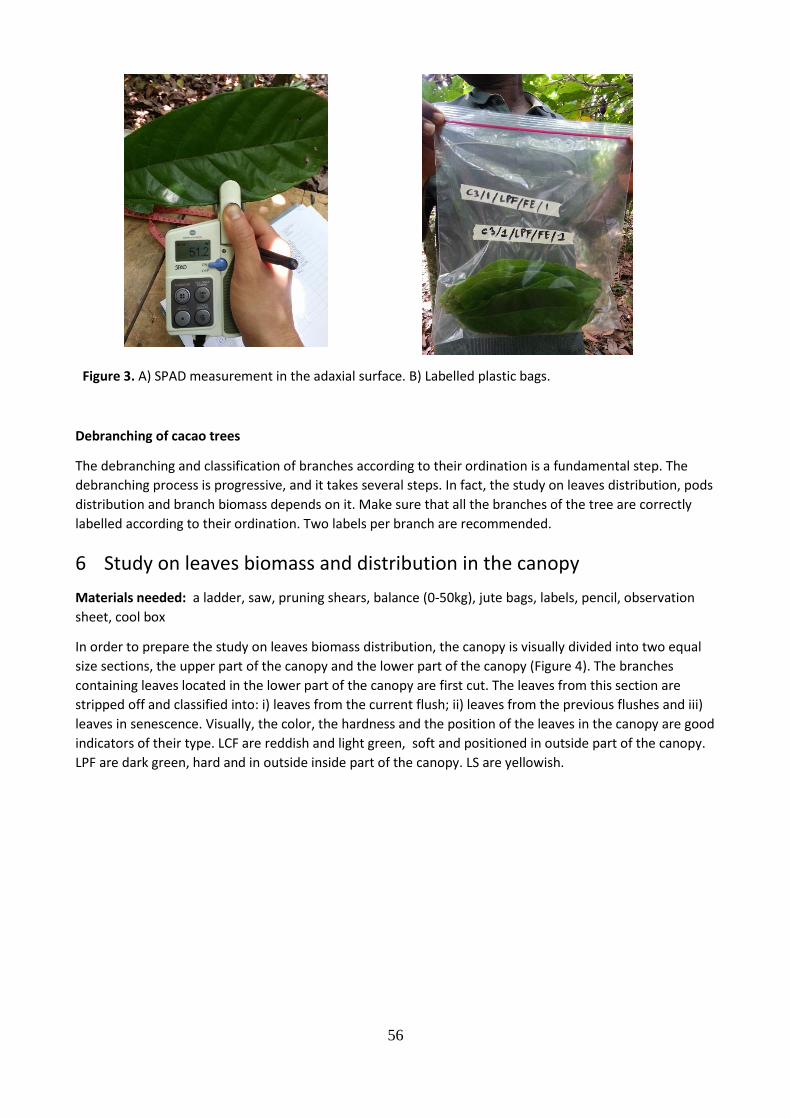
56
Figure 3. A) SPAD measurement in the adaxial surface. B) Labelled plastic bags.
Debranching of cacao trees
The debranching and classification of branches according to their ordination is a fundamental step. The
debranching process is progressive, and it takes several steps. In fact, the study on leaves distribution, pods
distribution and branch biomass depends on it. Make sure that all the branches of the tree are correctly
labelled according to their ordination. Two labels per branch are recommended.
6 Study on leaves biomass and distribution in the canopy
Materials needed: a ladder, saw, pruning shears, balance (0-50kg), jute bags, labels, pencil, observation
sheet, cool box
In order to prepare the study on leaves biomass distribution, the canopy is visually divided into two equal
size sections, the upper part of the canopy and the lower part of the canopy (Figure 4). The branches
containing leaves located in the lower part of the canopy are first cut. The leaves from this section are
stripped off and classified into: i) leaves from the current flush; ii) leaves from the previous flushes and iii)
leaves in senescence. Visually, the color, the hardness and the position of the leaves in the canopy are good
indicators of their type. LCF are reddish and light green, soft and positioned in outside part of the canopy.
LPF are dark green, hard and in outside inside part of the canopy. LS are yellowish.
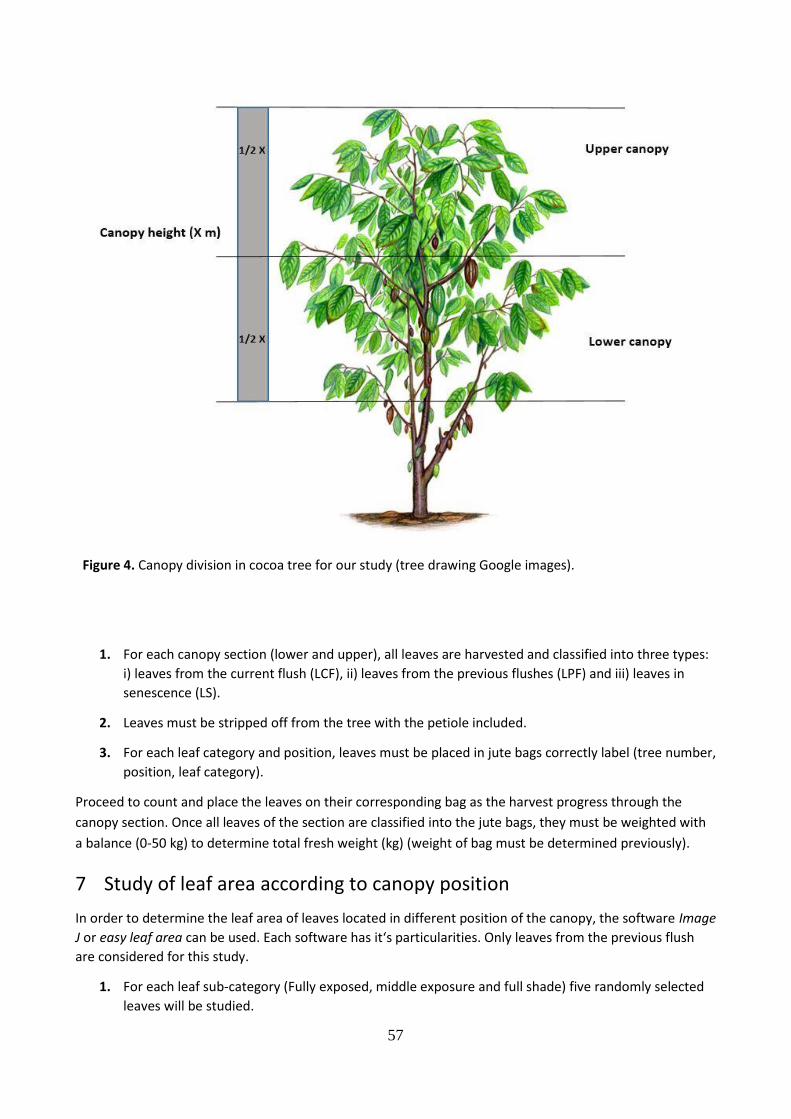
57
Figure 4. Canopy division in cocoa tree for our study (tree drawing Google images).
1. For each canopy section (lower and upper), all leaves are harvested and classified into three types:
i) leaves from the current flush (LCF), ii) leaves from the previous flushes (LPF) and iii) leaves in
senescence (LS).
2. Leaves must be stripped off from the tree with the petiole included.
3. For each leaf category and position, leaves must be placed in jute bags correctly label (tree number,
position, leaf category).
Proceed to count and place the leaves on their corresponding bag as the harvest progress through the
canopy section. Once all leaves of the section are classified into the jute bags, they must be weighted with
a balance (0-50 kg) to determine total fresh weight (kg) (weight of bag must be determined previously).
7 Study of leaf area according to canopy position
In order to determine the leaf area of leaves located in different position of the canopy, the software Image
J or easy leaf area can be used. Each software has it‘s particularities. Only leaves from the previous flush
are considered for this study.
1. For each leaf sub-category (Fully exposed, middle exposure and full shade) five randomly selected
leaves will be studied.
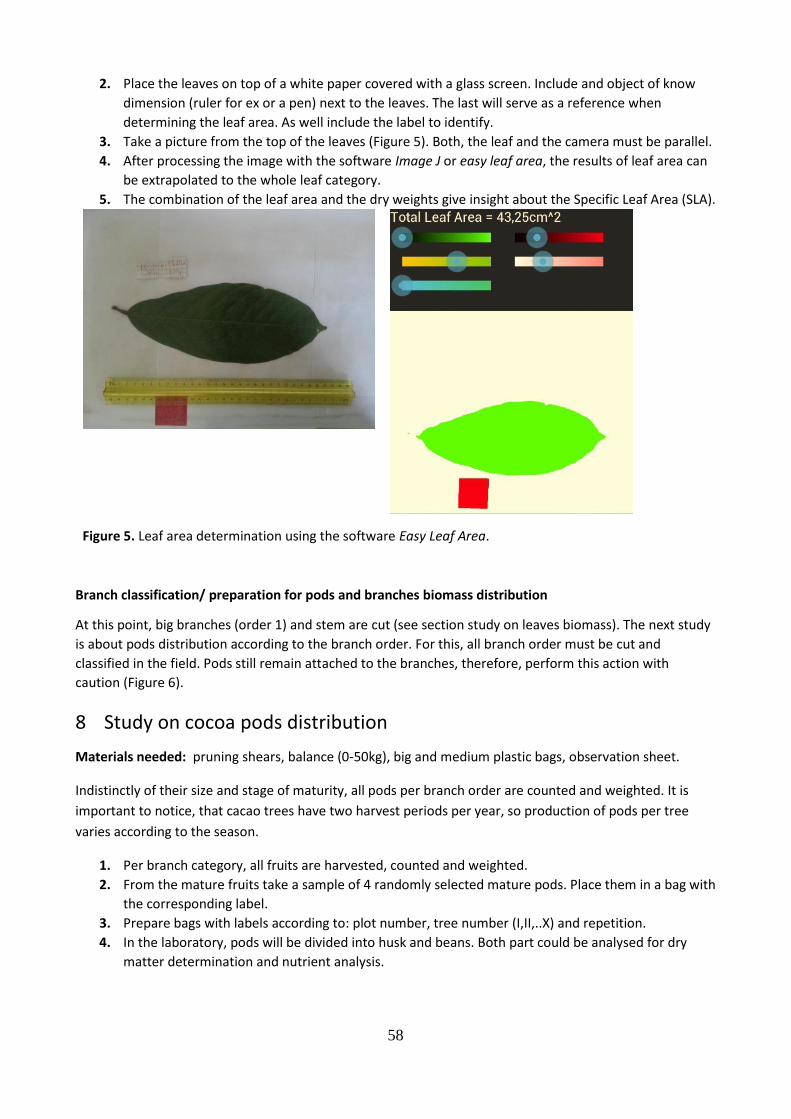
58
2. Place the leaves on top of a white paper covered with a glass screen. Include and object of know
dimension (ruler for ex or a pen) next to the leaves. The last will serve as a reference when
determining the leaf area. As well include the label to identify.
3. Take a picture from the top of the leaves (Figure 5). Both, the leaf and the camera must be parallel.
4. After processing the image with the software Image J or easy leaf area, the results of leaf area can
be extrapolated to the whole leaf category.
5. The combination of the leaf area and the dry weights give insight about the Specific Leaf Area (SLA).
Figure 5. Leaf area determination using the software Easy Leaf Area.
Branch classification/ preparation for pods and branches biomass distribution
At this point, big branches (order 1) and stem are cut (see section study on leaves biomass). The next study
is about pods distribution according to the branch order. For this, all branch order must be cut and
classified in the field. Pods still remain attached to the branches, therefore, perform this action with
caution (Figure 6).
8 Study on cocoa pods distribution
Materials needed: pruning shears, balance (0-50kg), big and medium plastic bags, observation sheet.
Indistinctly of their size and stage of maturity, all pods per branch order are counted and weighted. It is
important to notice, that cacao trees have two harvest periods per year, so production of pods per tree
varies according to the season.
1. Per branch category, all fruits are harvested, counted and weighted.
2. From the mature fruits take a sample of 4 randomly selected mature pods. Place them in a bag with
the corresponding label.
3. Prepare bags with labels according to: plot number, tree number (I,II,..X) and repetition.
4. In the laboratory, pods will be divided into husk and beans. Both part could be analysed for dry
matter determination and nutrient analysis.
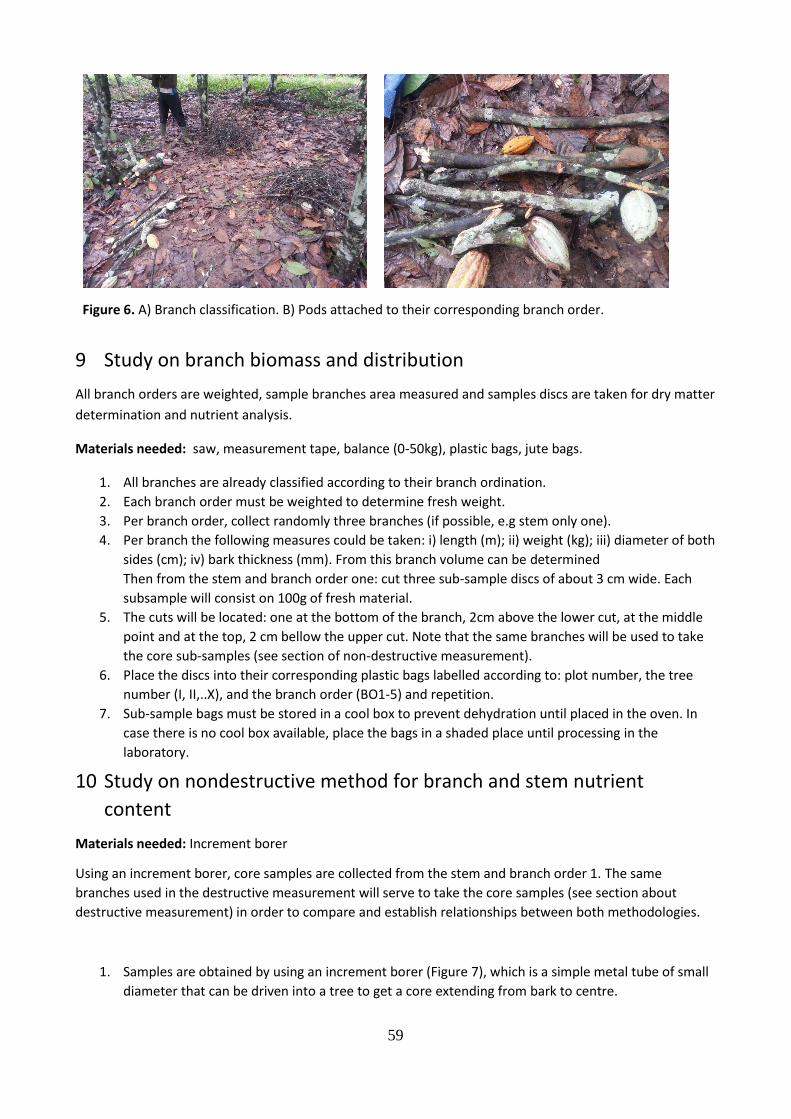
59
Figure 6. A) Branch classification. B) Pods attached to their corresponding branch order.
9 Study on branch biomass and distribution
All branch orders are weighted, sample branches area measured and samples discs are taken for dry matter
determination and nutrient analysis.
Materials needed: saw, measurement tape, balance (0-50kg), plastic bags, jute bags.
1. All branches are already classified according to their branch ordination.
2. Each branch order must be weighted to determine fresh weight.
3. Per branch order, collect randomly three branches (if possible, e.g stem only one).
4. Per branch the following measures could be taken: i) length (m); ii) weight (kg); iii) diameter of both
sides (cm); iv) bark thickness (mm). From this branch volume can be determined
Then from the stem and branch order one: cut three sub-sample discs of about 3 cm wide. Each
subsample will consist on 100g of fresh material.
5. The cuts will be located: one at the bottom of the branch, 2cm above the lower cut, at the middle
point and at the top, 2 cm bellow the upper cut. Note that the same branches will be used to take
the core sub-samples (see section of non-destructive measurement).
6. Place the discs into their corresponding plastic bags labelled according to: plot number, the tree
number (I, II,..X), and the branch order (BO1-5) and repetition.
7. Sub-sample bags must be stored in a cool box to prevent dehydration until placed in the oven. In
case there is no cool box available, place the bags in a shaded place until processing in the
laboratory.
10 Study on nondestructive method for branch and stem nutrient
content
Materials needed: Increment borer
Using an increment borer, core samples are collected from the stem and branch order 1. The same
branches used in the destructive measurement will serve to take the core samples (see section about
destructive measurement) in order to compare and establish relationships between both methodologies.
1. Samples are obtained by using an increment borer (Figure 7), which is a simple metal tube of small
diameter that can be driven into a tree to get a core extending from bark to centre.
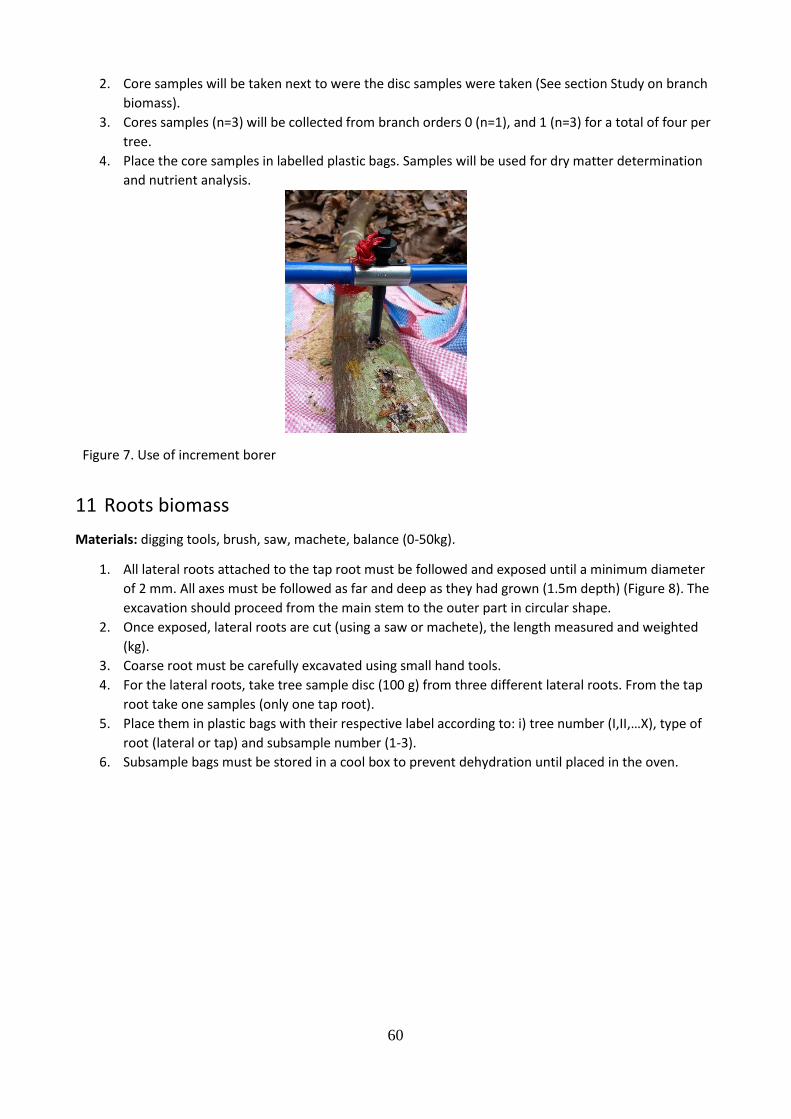
60
2. Core samples will be taken next to were the disc samples were taken (See section Study on branch
biomass).
3. Cores samples (n=3) will be collected from branch orders 0 (n=1), and 1 (n=3) for a total of four per
tree.
4. Place the core samples in labelled plastic bags. Samples will be used for dry matter determination
and nutrient analysis.
Figure 7. Use of increment borer
11 Roots biomass
Materials: digging tools, brush, saw, machete, balance (0-50kg).
1. All lateral roots attached to the tap root must be followed and exposed until a minimum diameter
of 2 mm. All axes must be followed as far and deep as they had grown (1.5m depth) (Figure 8). The
excavation should proceed from the main stem to the outer part in circular shape.
2. Once exposed, lateral roots are cut (using a saw or machete), the length measured and weighted
(kg).
3. Coarse root must be carefully excavated using small hand tools.
4. For the lateral roots, take tree sample disc (100 g) from three different lateral roots. From the tap
root take one samples (only one tap root).
5. Place them in plastic bags with their respective label according to: i) tree number (I,II,…X), type of
root (lateral or tap) and subsample number (1-3).
6. Subsample bags must be stored in a cool box to prevent dehydration until placed in the oven.
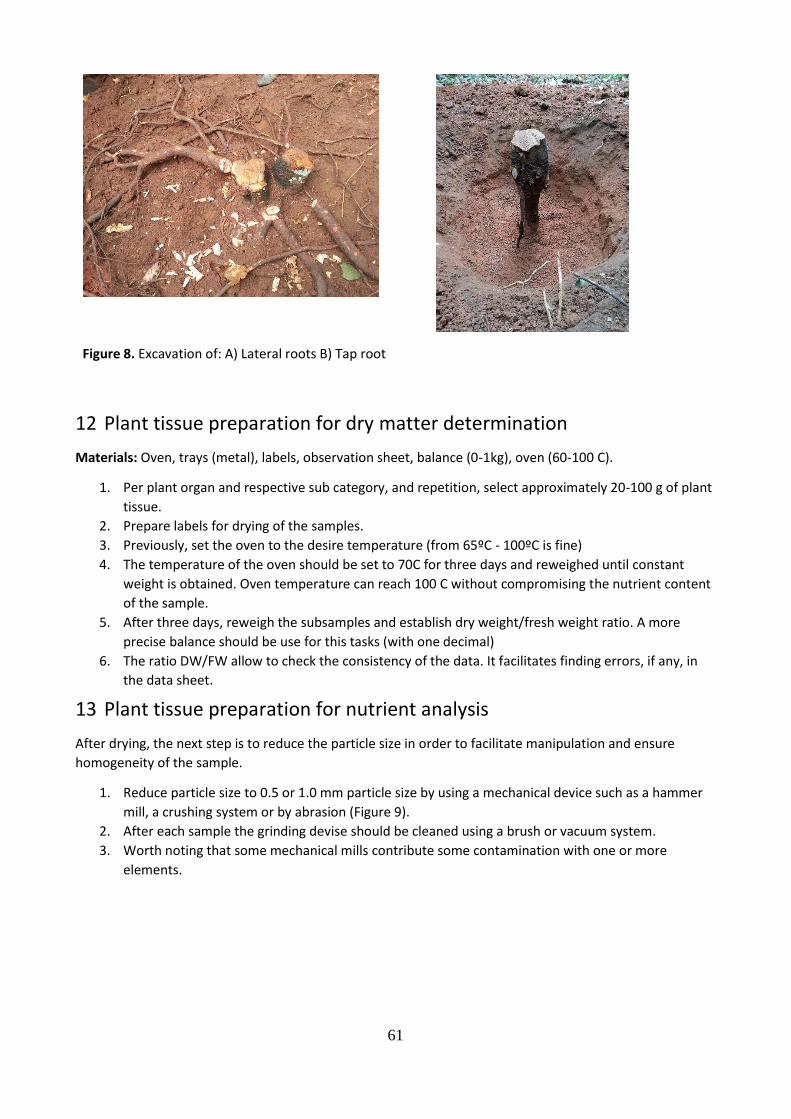
61
Figure 8. Excavation of: A) Lateral roots B) Tap root
12 Plant tissue preparation for dry matter determination
Materials: Oven, trays (metal), labels, observation sheet, balance (0-1kg), oven (60-100 C).
1. Per plant organ and respective sub category, and repetition, select approximately 20-100 g of plant
tissue.
2. Prepare labels for drying of the samples.
3. Previously, set the oven to the desire temperature (from 65ºC - 100ºC is fine)
4. The temperature of the oven should be set to 70C for three days and reweighed until constant
weight is obtained. Oven temperature can reach 100 C without compromising the nutrient content
of the sample.
5. After three days, reweigh the subsamples and establish dry weight/fresh weight ratio. A more
precise balance should be use for this tasks (with one decimal)
6. The ratio DW/FW allow to check the consistency of the data. It facilitates finding errors, if any, in
the data sheet.
13 Plant tissue preparation for nutrient analysis
After drying, the next step is to reduce the particle size in order to facilitate manipulation and ensure
homogeneity of the sample.
1. Reduce particle size to 0.5 or 1.0 mm particle size by using a mechanical device such as a hammer
mill, a crushing system or by abrasion (Figure 9).
2. After each sample the grinding devise should be cleaned using a brush or vacuum system.
3. Worth noting that some mechanical mills contribute some contamination with one or more
elements.
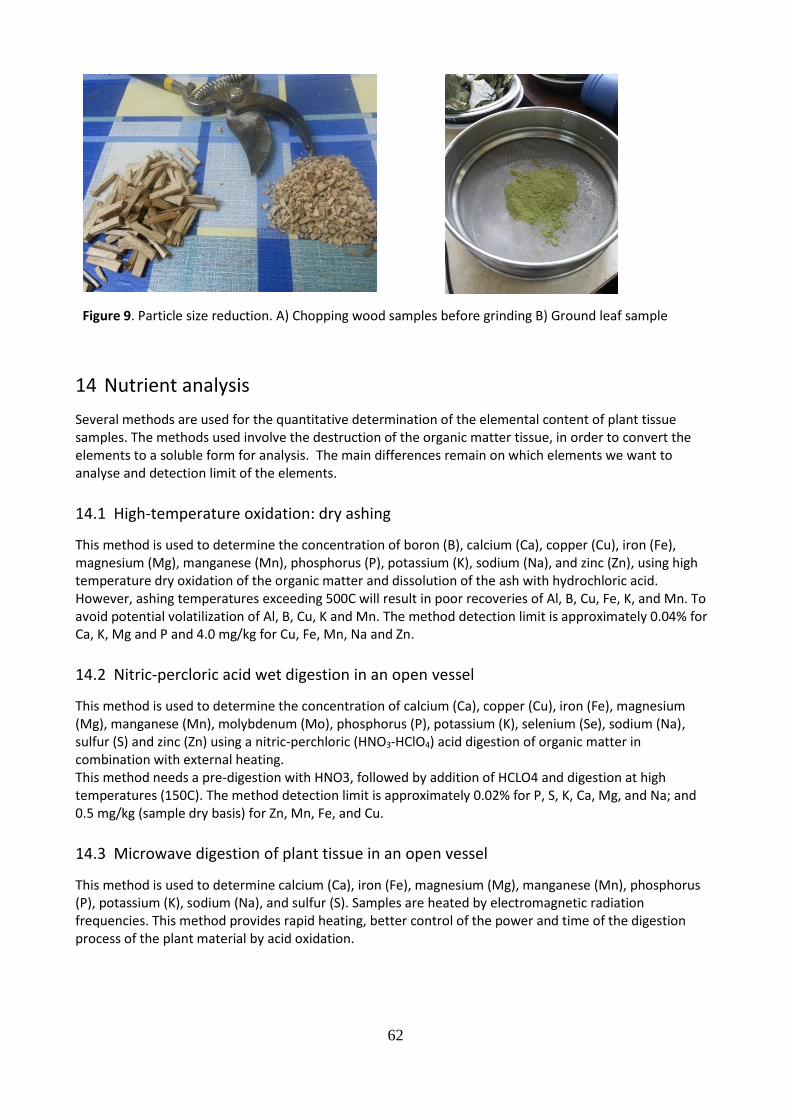
62
Figure 9. Particle size reduction. A) Chopping wood samples before grinding B) Ground leaf sample
14 Nutrient analysis
Several methods are used for the quantitative determination of the elemental content of plant tissue samples. The methods used involve the destruction of the organic matter tissue, in order to convert the elements to a soluble form for analysis. The main differences remain on which elements we want to analyse and detection limit of the elements.
14.1 High-temperature oxidation: dry ashing
This method is used to determine the concentration of boron (B), calcium (Ca), copper (Cu), iron (Fe), magnesium (Mg), manganese (Mn), phosphorus (P), potassium (K), sodium (Na), and zinc (Zn), using high temperature dry oxidation of the organic matter and dissolution of the ash with hydrochloric acid. However, ashing temperatures exceeding 500C will result in poor recoveries of Al, B, Cu, Fe, K, and Mn. To avoid potential volatilization of Al, B, Cu, K and Mn. The method detection limit is approximately 0.04% for Ca, K, Mg and P and 4.0 mg/kg for Cu, Fe, Mn, Na and Zn.
14.2 Nitric-percloric acid wet digestion in an open vessel
This method is used to determine the concentration of calcium (Ca), copper (Cu), iron (Fe), magnesium (Mg), manganese (Mn), molybdenum (Mo), phosphorus (P), potassium (K), selenium (Se), sodium (Na), sulfur (S) and zinc (Zn) using a nitric-perchloric (HNO3-HClO4) acid digestion of organic matter in combination with external heating. This method needs a pre-digestion with HNO3, followed by addition of HCLO4 and digestion at high temperatures (150C). The method detection limit is approximately 0.02% for P, S, K, Ca, Mg, and Na; and 0.5 mg/kg (sample dry basis) for Zn, Mn, Fe, and Cu.
14.3 Microwave digestion of plant tissue in an open vessel
This method is used to determine calcium (Ca), iron (Fe), magnesium (Mg), manganese (Mn), phosphorus (P), potassium (K), sodium (Na), and sulfur (S). Samples are heated by electromagnetic radiation frequencies. This method provides rapid heating, better control of the power and time of the digestion process of the plant material by acid oxidation.
63
14.4 Microwave digestion of plant tissue in an close vessel
Determination of the concentrations of boron (B), calcium (Ca), copper (Cu), iron (Fe) magnesium (Mg), manganese (Mn), molybdenum (Mo), phosphorus (P), potassium (K), sodium (Na), sulfur (S), and zonc (Zn), using a nitric acid/hydrogen peroxide (HNO3/H2O2) digestion mixture in combination with microwave heating in closed Teflon vessels. The method has a detection limit of approximately 0.01% for Ca, K, Mg, and P and 0.2 mgl g for B, Cu, Fe, Mn, Mo, and Zn
14.5 Plant tissue analysis
The digested sample can be analysed by either atomic absorption spectrometry (AAS) or inductively coupled plasma atomic emission spectrometry (ICP-AES).
9.2 Literature review for protocol development
In order to provide a consistent methodology to quantify biomass and the nutrient allocation and concentration among the different plant organs, a protocol was developed based on a literature review.
9.2.1 Cocoa leaves
Leaf appearance in cocoa trees In cacao, shoot growth, and thus leaf appearance is characterized by alternate periods of growth
and dormancy of the apical bud (Niemenak et al., 2010) Leaves start to grow at the same time, this
is referred to as a leaf flush (Wood and Lass, 2008) The growth period is characterized by the
expansion and the elongation of leaves. Contrary, during dormancy shoot length remain constant
and leaves do not expand (Niemenak et al., 2010). Environmental conditions like temperature and
soil moisture can affect the flush cycle (Wood and Lass, 2008). Nonetheless, the growth rhythm is
considered endogenous, and controlled by hormonal activity (ABO‐HAMED et al., 1983, Almeida
and Valle, 2007)
Leaf categories in cocoa trees Cocoa leaves can be classified into different types, according to their flush status. (Almeida and
Valle, 2007) and (Orchard et al., 1980) indicate that cocoa leaves can be classified into two types:
i) leaves from the current flush (LCF) and ii) leaves from the previous flushes (LPF). Leaves in
senescence could also be considered as another type of leaf. Leaves from the current flush are
characterized by their reddish to pale green color and of soft texture. In fact, the apparent
absence of green color in young leaves is due to the fact that chloroplasts are few and small at the
beginning. (Lee et al., 1987) indicate that the changes in color, from reddish to light green, in
young cocoa leaves, resulted in varying level of different pigments, e.g. anthocyanin, that initially
mask the chlorophyll content. (Baker et al., 1975) specified that the photosynthetic capacity and
the chlorophyll content of leaves increase in parallel during the flushing. Leaves from the previous
flushes are fully expanded, dark green and hardened. Leaves in senescence are in transition from
green to yellow and finally brown. According to(Wood and Lass, 2008) nutrient translocation from
64
older leaves to newly produced leaves is an important mechanisms in cocoa nutrient cycle. The
rate at which leaves are produced and old leaves are lost when flushing occurs, provide an insight
into the nutritional status of cocoa plants (Wood and Lass, 2008)
Effect of light intensity on cocoa leaves The position of the leaves within the canopy is a factor to take into consideration. According to
(Wood and Lass, 2008) the light intensity affects the number of stomata per unit of area as well as
the size and thickness of leaves. Also the authors indicate that those leaves that develop under
shade are larger and greener compared to those that grown in full sun. In their study, (Miyaji et
al., 1997) classified the leaves according to their position in the canopy: upper leaves (>220cm),
middle leaves (150-220cm) and lower leaves (0-150cm). In this study, the authors found
differences regarding the relative light intensity (%) reaching the canopy in relation to the leaves
position. Also, the study suggests that leaves located in the upper canopy present the highest
number of emerged leaves but also the highest number of fallen leaves. Whereas leaves
positioned in the lower canopy presented the greatest longevity. The last is attributed to a lower
respiration rate due to a lower incidence of irradiance (Miyaji et al., 1997).
Determining nutrient status (N), through non-destructive measurements Non-destructive, in situ optical techniques in order to provide a relative indication of chlorophyll
concentration have been widely used. The model SPAD-502 is a chlorophyll meter that is
commonly used. Nonetheless, in vitro measurements for chlorophyll determination in a
spectrophotometer are more accurate (Parry et al., 2014). A problem arises when using in situ
chlorophyll meter is that the lecture of the meter is not a direct indication of the chlorophyll
content. There is not a linear relation between the transmission and the Chl content. For this
reason it is necessary to develop a curve between the optical Chl value obtained with the SPAD
meter and the actual Chl value measured in the laboratory (Parry et al., 2014).Though, they unify
curves from several crops ( annual and deciduous) in order to obtain a generalized curve relating
the measured SPAD units and the absolute Chl content measured in the laboratory (Fig 3). The
authors of this study suggest that leaves to sample must be from multiple ages, of green color
intensity and diverse positions within the canopy.
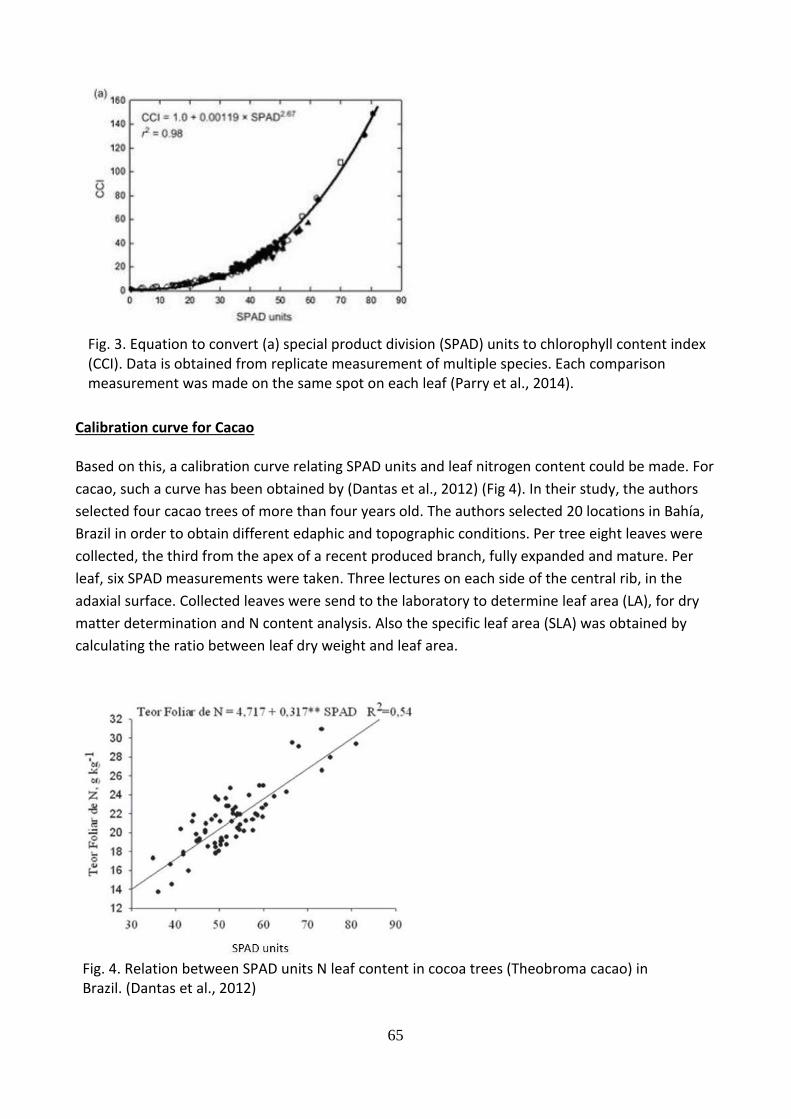
65
Fig. 3. Equation to convert (a) special product division (SPAD) units to chlorophyll content index (CCI). Data is obtained from replicate measurement of multiple species. Each comparison measurement was made on the same spot on each leaf (Parry et al., 2014).
Calibration curve for Cacao Based on this, a calibration curve relating SPAD units and leaf nitrogen content could be made. For
cacao, such a curve has been obtained by (Dantas et al., 2012) (Fig 4). In their study, the authors
selected four cacao trees of more than four years old. The authors selected 20 locations in Bahía,
Brazil in order to obtain different edaphic and topographic conditions. Per tree eight leaves were
collected, the third from the apex of a recent produced branch, fully expanded and mature. Per
leaf, six SPAD measurements were taken. Three lectures on each side of the central rib, in the
adaxial surface. Collected leaves were send to the laboratory to determine leaf area (LA), for dry
matter determination and N content analysis. Also the specific leaf area (SLA) was obtained by
calculating the ratio between leaf dry weight and leaf area.
Fig. 4. Relation between SPAD units N leaf content in cocoa trees (Theobroma cacao) in Brazil. (Dantas et al., 2012)
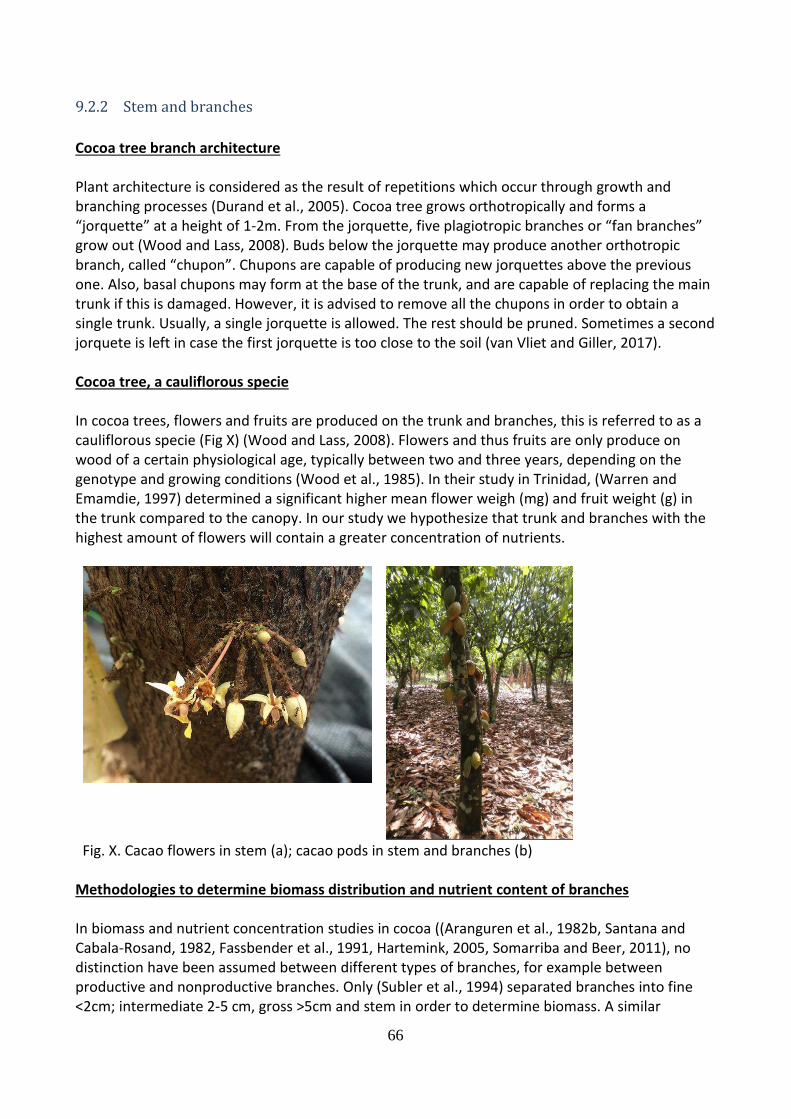
66
9.2.2 Stem and branches
Cocoa tree branch architecture Plant architecture is considered as the result of repetitions which occur through growth and branching processes (Durand et al., 2005). Cocoa tree grows orthotropically and forms a “jorquette” at a height of 1-2m. From the jorquette, five plagiotropic branches or “fan branches” grow out (Wood and Lass, 2008). Buds below the jorquette may produce another orthotropic branch, called “chupon”. Chupons are capable of producing new jorquettes above the previous one. Also, basal chupons may form at the base of the trunk, and are capable of replacing the main trunk if this is damaged. However, it is advised to remove all the chupons in order to obtain a single trunk. Usually, a single jorquette is allowed. The rest should be pruned. Sometimes a second jorquete is left in case the first jorquette is too close to the soil (van Vliet and Giller, 2017). Cocoa tree, a cauliflorous specie In cocoa trees, flowers and fruits are produced on the trunk and branches, this is referred to as a cauliflorous specie (Fig X) (Wood and Lass, 2008). Flowers and thus fruits are only produce on wood of a certain physiological age, typically between two and three years, depending on the genotype and growing conditions (Wood et al., 1985). In their study in Trinidad, (Warren and Emamdie, 1997) determined a significant higher mean flower weigh (mg) and fruit weight (g) in the trunk compared to the canopy. In our study we hypothesize that trunk and branches with the highest amount of flowers will contain a greater concentration of nutrients.
Fig. X. Cacao flowers in stem (a); cacao pods in stem and branches (b)
Methodologies to determine biomass distribution and nutrient content of branches In biomass and nutrient concentration studies in cocoa ((Aranguren et al., 1982b, Santana and Cabala-Rosand, 1982, Fassbender et al., 1991, Hartemink, 2005, Somarriba and Beer, 2011), no distinction have been assumed between different types of branches, for example between productive and nonproductive branches. Only (Subler et al., 1994) separated branches into fine <2cm; intermediate 2-5 cm, gross >5cm and stem in order to determine biomass. A similar
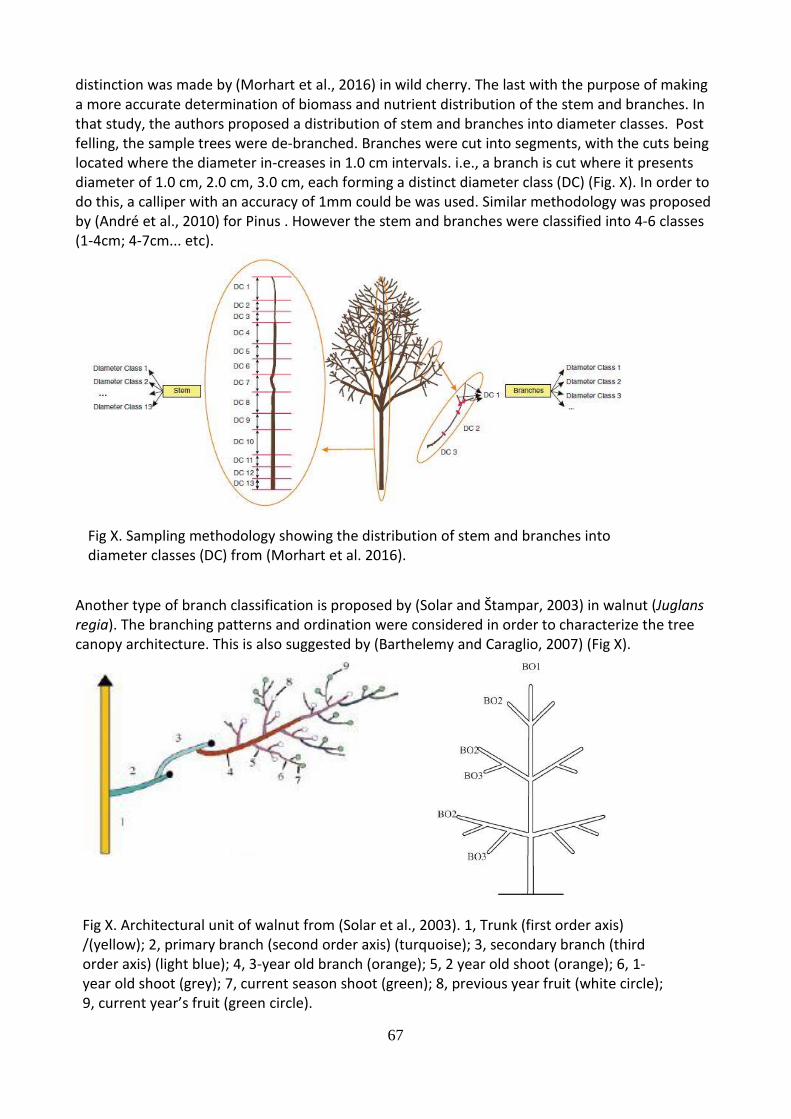
67
distinction was made by (Morhart et al., 2016) in wild cherry. The last with the purpose of making a more accurate determination of biomass and nutrient distribution of the stem and branches. In that study, the authors proposed a distribution of stem and branches into diameter classes. Post felling, the sample trees were de-branched. Branches were cut into segments, with the cuts being located where the diameter in-creases in 1.0 cm intervals. i.e., a branch is cut where it presents diameter of 1.0 cm, 2.0 cm, 3.0 cm, each forming a distinct diameter class (DC) (Fig. X). In order to do this, a calliper with an accuracy of 1mm could be was used. Similar methodology was proposed by (André et al., 2010) for Pinus . However the stem and branches were classified into 4-6 classes (1-4cm; 4-7cm... etc).
Fig X. Sampling methodology showing the distribution of stem and branches into diameter classes (DC) from (Morhart et al. 2016).
Another type of branch classification is proposed by (Solar and Štampar, 2003) in walnut (Juglans regia). The branching patterns and ordination were considered in order to characterize the tree canopy architecture. This is also suggested by (Barthelemy and Caraglio, 2007) (Fig X).
Fig X. Architectural unit of walnut from (Solar et al., 2003). 1, Trunk (first order axis) /(yellow); 2, primary branch (second order axis) (turquoise); 3, secondary branch (third order axis) (light blue); 4, 3-year old branch (orange); 5, 2 year old shoot (orange); 6, 1-year old shoot (grey); 7, current season shoot (green); 8, previous year fruit (white circle); 9, current year’s fruit (green circle).
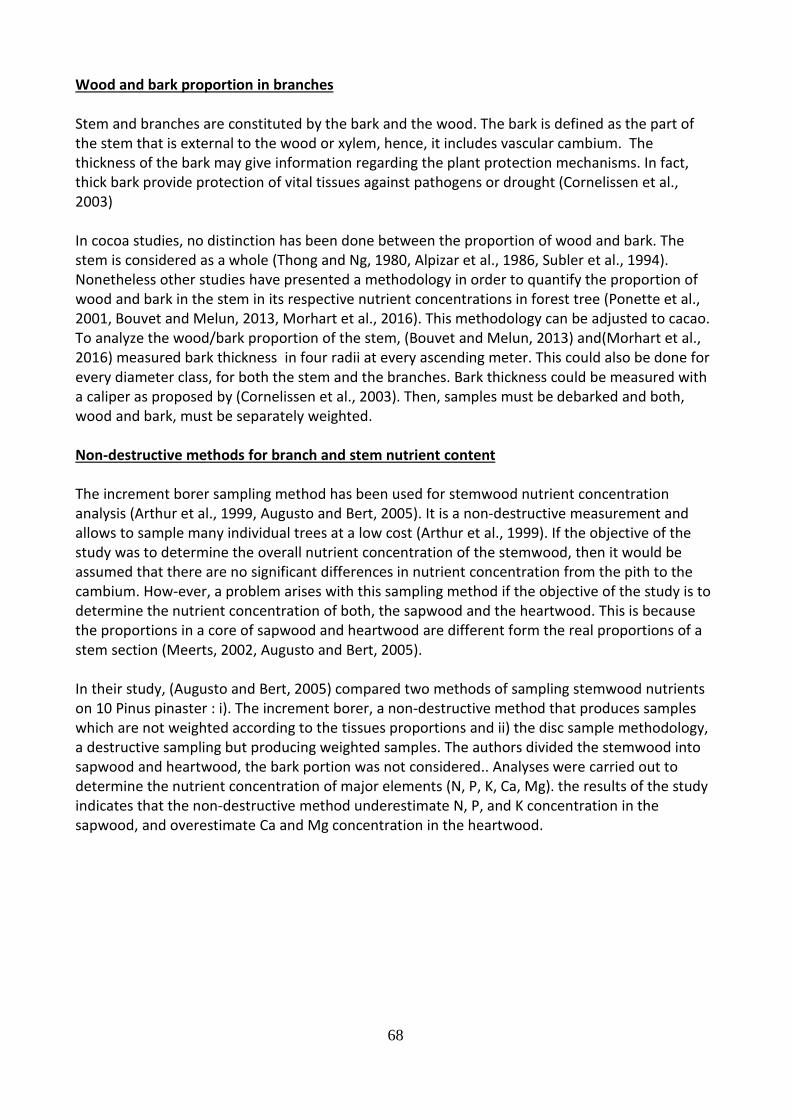
68
Wood and bark proportion in branches Stem and branches are constituted by the bark and the wood. The bark is defined as the part of the stem that is external to the wood or xylem, hence, it includes vascular cambium. The thickness of the bark may give information regarding the plant protection mechanisms. In fact, thick bark provide protection of vital tissues against pathogens or drought (Cornelissen et al., 2003) In cocoa studies, no distinction has been done between the proportion of wood and bark. The stem is considered as a whole (Thong and Ng, 1980, Alpizar et al., 1986, Subler et al., 1994). Nonetheless other studies have presented a methodology in order to quantify the proportion of wood and bark in the stem in its respective nutrient concentrations in forest tree (Ponette et al., 2001, Bouvet and Melun, 2013, Morhart et al., 2016). This methodology can be adjusted to cacao. To analyze the wood/bark proportion of the stem, (Bouvet and Melun, 2013) and(Morhart et al., 2016) measured bark thickness in four radii at every ascending meter. This could also be done for every diameter class, for both the stem and the branches. Bark thickness could be measured with a caliper as proposed by (Cornelissen et al., 2003). Then, samples must be debarked and both, wood and bark, must be separately weighted. Non-destructive methods for branch and stem nutrient content The increment borer sampling method has been used for stemwood nutrient concentration analysis (Arthur et al., 1999, Augusto and Bert, 2005). It is a non-destructive measurement and allows to sample many individual trees at a low cost (Arthur et al., 1999). If the objective of the study was to determine the overall nutrient concentration of the stemwood, then it would be assumed that there are no significant differences in nutrient concentration from the pith to the cambium. How-ever, a problem arises with this sampling method if the objective of the study is to determine the nutrient concentration of both, the sapwood and the heartwood. This is because the proportions in a core of sapwood and heartwood are different form the real proportions of a stem section (Meerts, 2002, Augusto and Bert, 2005). In their study, (Augusto and Bert, 2005) compared two methods of sampling stemwood nutrients on 10 Pinus pinaster : i). The increment borer, a non-destructive method that produces samples which are not weighted according to the tissues proportions and ii) the disc sample methodology, a destructive sampling but producing weighted samples. The authors divided the stemwood into sapwood and heartwood, the bark portion was not considered.. Analyses were carried out to determine the nutrient concentration of major elements (N, P, K, Ca, Mg). the results of the study indicates that the non-destructive method underestimate N, P, and K concentration in the sapwood, and overestimate Ca and Mg concentration in the heartwood.
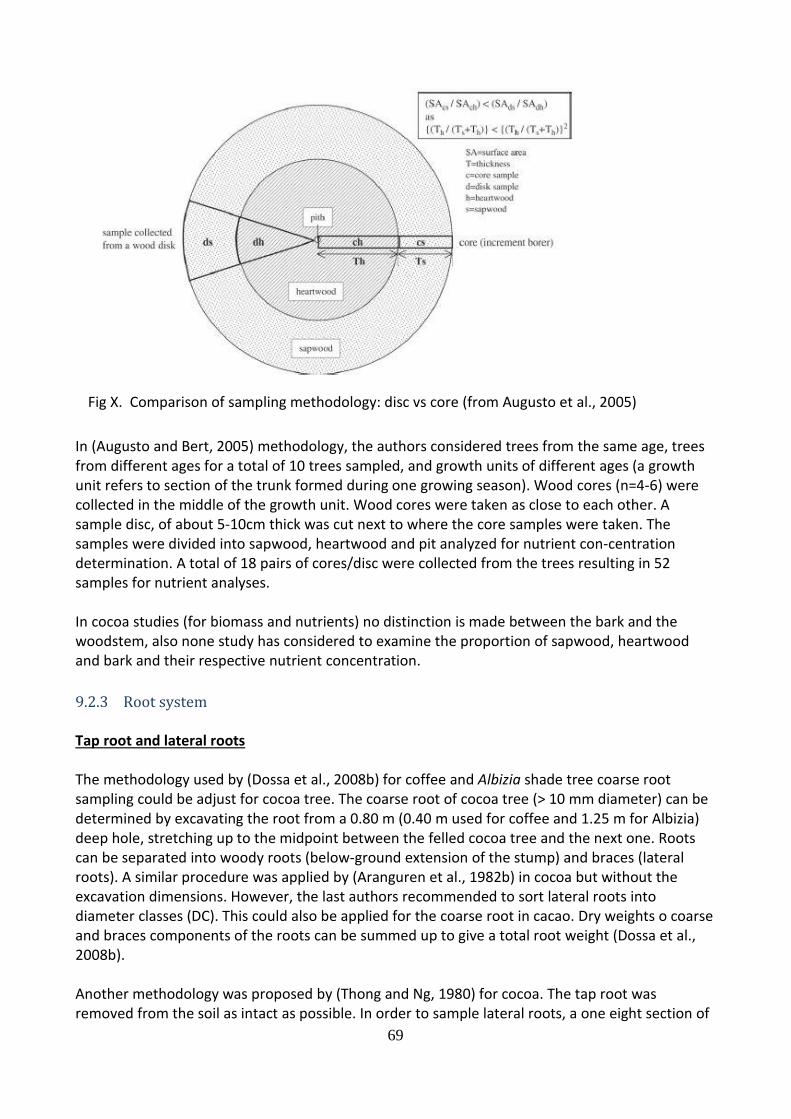
69
Fig X. Comparison of sampling methodology: disc vs core (from Augusto et al., 2005)
In (Augusto and Bert, 2005) methodology, the authors considered trees from the same age, trees from different ages for a total of 10 trees sampled, and growth units of different ages (a growth unit refers to section of the trunk formed during one growing season). Wood cores (n=4-6) were collected in the middle of the growth unit. Wood cores were taken as close to each other. A sample disc, of about 5-10cm thick was cut next to where the core samples were taken. The samples were divided into sapwood, heartwood and pit analyzed for nutrient con-centration determination. A total of 18 pairs of cores/disc were collected from the trees resulting in 52 samples for nutrient analyses. In cocoa studies (for biomass and nutrients) no distinction is made between the bark and the woodstem, also none study has considered to examine the proportion of sapwood, heartwood and bark and their respective nutrient concentration.
9.2.3 Root system
Tap root and lateral roots The methodology used by (Dossa et al., 2008b) for coffee and Albizia shade tree coarse root sampling could be adjust for cocoa tree. The coarse root of cocoa tree (> 10 mm diameter) can be determined by excavating the root from a 0.80 m (0.40 m used for coffee and 1.25 m for Albizia) deep hole, stretching up to the midpoint between the felled cocoa tree and the next one. Roots can be separated into woody roots (below-ground extension of the stump) and braces (lateral roots). A similar procedure was applied by (Aranguren et al., 1982b) in cocoa but without the excavation dimensions. However, the last authors recommended to sort lateral roots into diameter classes (DC). This could also be applied for the coarse root in cacao. Dry weights o coarse and braces components of the roots can be summed up to give a total root weight (Dossa et al., 2008b). Another methodology was proposed by (Thong and Ng, 1980) for cocoa. The tap root was removed from the soil as intact as possible. In order to sample lateral roots, a one eight section of
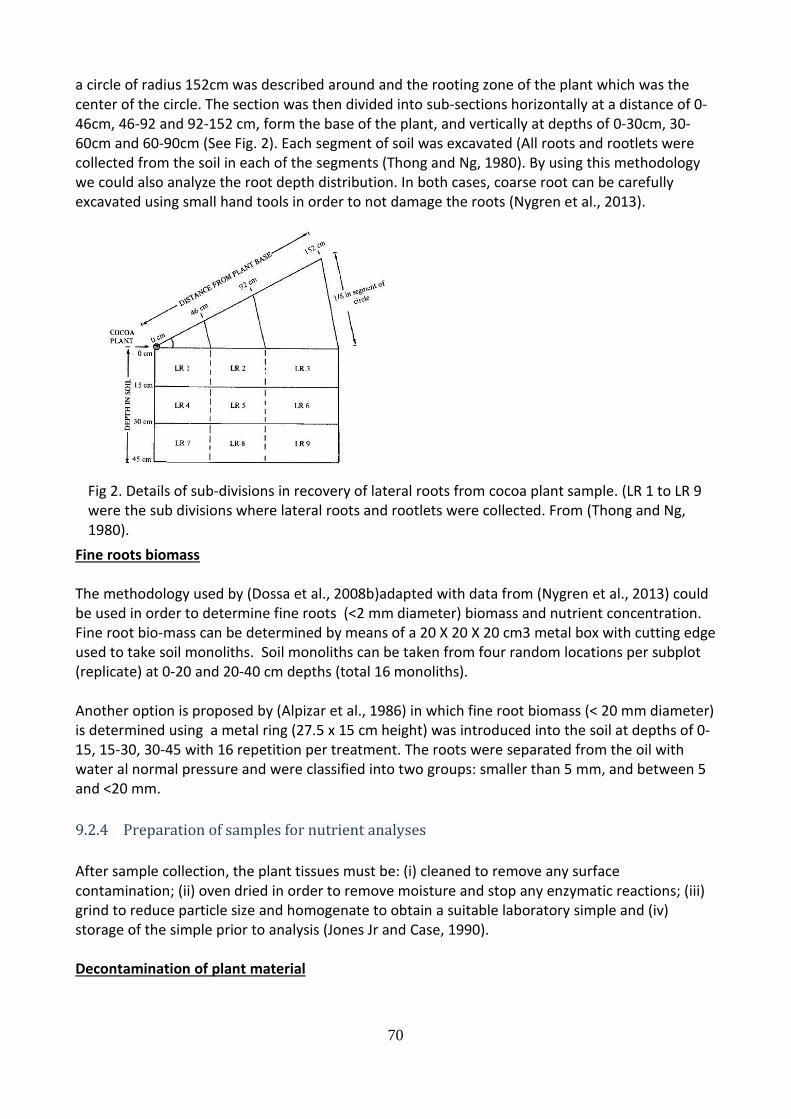
70
a circle of radius 152cm was described around and the rooting zone of the plant which was the center of the circle. The section was then divided into sub-sections horizontally at a distance of 0-46cm, 46-92 and 92-152 cm, form the base of the plant, and vertically at depths of 0-30cm, 30-60cm and 60-90cm (See Fig. 2). Each segment of soil was excavated (All roots and rootlets were collected from the soil in each of the segments (Thong and Ng, 1980). By using this methodology we could also analyze the root depth distribution. In both cases, coarse root can be carefully excavated using small hand tools in order to not damage the roots (Nygren et al., 2013).
Fig 2. Details of sub-divisions in recovery of lateral roots from cocoa plant sample. (LR 1 to LR 9 were the sub divisions where lateral roots and rootlets were collected. From (Thong and Ng, 1980).
Fine roots biomass The methodology used by (Dossa et al., 2008b)adapted with data from (Nygren et al., 2013) could be used in order to determine fine roots (<2 mm diameter) biomass and nutrient concentration. Fine root bio-mass can be determined by means of a 20 X 20 X 20 cm3 metal box with cutting edge used to take soil monoliths. Soil monoliths can be taken from four random locations per subplot (replicate) at 0-20 and 20-40 cm depths (total 16 monoliths). Another option is proposed by (Alpizar et al., 1986) in which fine root biomass (< 20 mm diameter) is determined using a metal ring (27.5 x 15 cm height) was introduced into the soil at depths of 0-15, 15-30, 30-45 with 16 repetition per treatment. The roots were separated from the oil with water al normal pressure and were classified into two groups: smaller than 5 mm, and between 5 and <20 mm.
9.2.4 Preparation of samples for nutrient analyses
After sample collection, the plant tissues must be: (i) cleaned to remove any surface contamination; (ii) oven dried in order to remove moisture and stop any enzymatic reactions; (iii) grind to reduce particle size and homogenate to obtain a suitable laboratory simple and (iv) storage of the simple prior to analysis (Jones Jr and Case, 1990). Decontamination of plant material
71
Plant tissue material may be contaminated with dust and soil particles or with spray residues, whether applied for nutritional, or biocide purposes (Jones Jr and Case, 1990)(Jones et al.,1990).. These sources of contamination may affect the results of nutrient analysis. Therefore they must be removed when the plant organ material is fresh. In the case of dust and soil particles, they can be removed by mechanical wiping or brushing. Spray residues, can be removed by washing the plant tissue organs in a 0.1 to 0.3% detergent solution (non-phosphate) followed by rinsing in pure water (Kalra, 1997).The washing procedure must be performed quickly to avoid nutrient leaching, specially of K and Cl. Unless the plant organs tissues are visually contaminated with foreign substances, it is not necessary to perform the washing process. Oven drying After decontamination, plant samples must be immediately dried in order to minimize biological and chemical changes. If drying is postponed, losses in weight may occur do to respiration, affecting the fresh weight to dry weight ratio. The temperature during the drying process should be sufficiently high to destroy the enzymes responsible for decomposition and for moisture removal, however below the temperature of thermal decomposition. The last is stated to be at about 80C (Kalra, 1997, Jones Jr and Case, 1990), though, in the literature is not mentioned if the thermal decomposition has any effect on the nutrient content of the plant organ samples. Yet recommended drying temperatures are between 65C and 105 C with periods of 72h and 24h respectively (Baker et al., 1975). Particle size reduction Particle size reduction provides of the dried plant organs samples, facilitates manipulation and ensures homogeneity (Jones Jr and Case, 1990) Plant tissue samples are reduced to 0.5 to 1.0 mm particle size(Kalra, 1997), using mechanical devices (Jones Jr and Case, 1990). These mechanical devices use either a cutting action, like the commonly used Wiley or hammer type mills, or a crushing actions using ball mills, or by abrasion in cyclone mills (Jones Jr and Case, 1990). The grinding device should be cleaned using a brush or vacuum system after grinding each sample. Worth noting that most mechanical mills contribute some contamination with one or more elements. In order to reduce such contamination, the use of stainless steel for cutting and sieving surfaces is recommended (Kalra, 1997). Storage After particle size reduction, sample should be stored in appropriate conditions in order to maintain sample integrity for further analytical work (Campbell et al., 1998). The samples should be placed in a container and securely sealed. Samples should be stored in a cool and dry place. For long term storage, samples should be stored under refrigerated (4C) conditions until the analysis can be performed (Jones et al.,1990; Campbell et al., 1998). Laboratory analysis Several methods are used for the quantitative determination of the elemental content of plant tissue samples. The methods used involve the destruction of the organic matter tissue, in order to convert the elements to a soluble form for analysis. Next I provide a summary of the methods.
72
High-temperature oxidation: dry ashing This method is used to determine the concentration of boron (B), calcium (Ca), copper (Cu), iron (Fe), magnesium (Mg), manganese (Mn), phosphorus (P), potassium (K), sodium (Na), and zinc (Zn), using high temperature dry oxidation of the organic matter and dissolution of the ash with hydrochloric acid (Kalra, 1997). However, ashing temperatures exceeding 500C will result in poor recoveries of Al, B, Cu, Fe, K, and Mn. To avoid potential volatilization of Al, B, Cu, K and Mn. The method detection limit is approximately 0.04% for Ca, K, Mg and P and 4.0 mg/kg for Cu, Fe, Mn, Na and Zn. Nitric-percloric acid wet digestion in an open vessel This method is used to determine the concentration of calcium (Ca), copper (Cu), iron (Fe), magnesium (Mg), manganese (Mn), molybdenum (Mo), phosphorus (P), potassium (K), selenium (Se), sodium (Na), sulfur (S) and zinc (Zn) using a nitric-perchloric (HNO3-HClO4) acid digestion of organic matter in combination with external heating (Campbell et al., 1998). This method needs a pre-digestion with HNO3, followed by addition of HCLO4 and digestion at high temperatures (150C). The method detection limit is approximately 0.02% for P, S, K, Ca, Mg, and Na; and 0.5 mg/kg (sample dry basis) for Zn, Mn, Fe, and Cu (Campbell et al., 1998). Microwave digestion of plant tissue in an open vessel This method is used to determine calcium (Ca), iron (Fe), magnesium (Mg), manganese (Mn), phosphorus (P), potassium (K), sodium (Na), and sulfur (S). Samples are heated by electromagnetic radiation frequencies. This method provides rapid heating, better control of the power and time of the digestion process of the plant material by acid oxidation (Campbell et al., 1998). Microwave digestion of plant tissue in an close vessel Determination of the concentrations of boron (B), calcium (Ca), copper (Cu), iron (Fe) magnesium (Mg), manganese (Mn), molybdenum (Mo), phosphorus (P), potassium (K), sodium (Na), sulfur (S), and zinc (Zn), using a nitric acid/hydrogen peroxide (HNO3/H2O2) digestion mixture in combination with microwave heating in closed Teflon vessels. The method has a detection limit of approximately 0.01% for Ca, K, Mg, and P and 0.2 mg/kg for B, Cu, Fe, Mn, Mo, and Zn (Campbell et al., 1998). Plant tissue analysis The digested sample can be analyzed by either atomic absorption spectrometry (AAS) or inductively coupled plasma atomic emission spectrometry (ICP-AES) (Campbell et al., 1998).
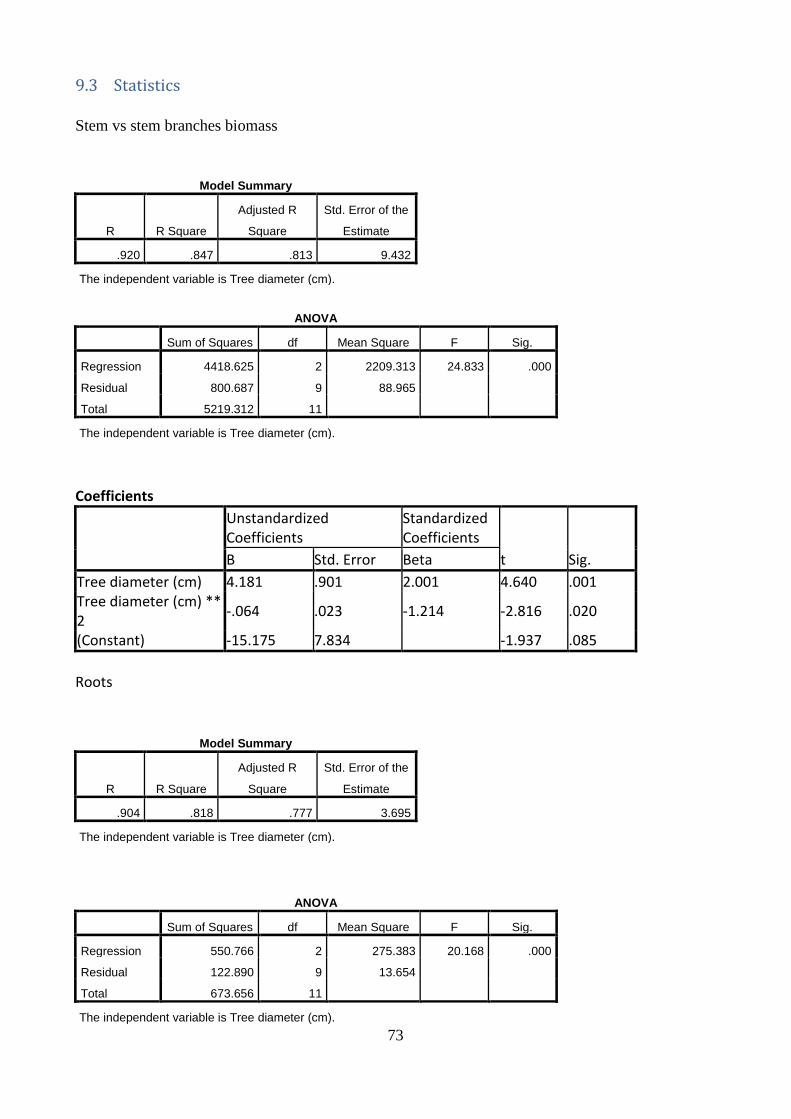
73
9.3 Statistics
Stem vs stem branches biomass
Model Summary
R R Square
Adjusted R
Square
Std. Error of the
Estimate
.920 .847 .813 9.432
The independent variable is Tree diameter (cm).
ANOVA
Sum of Squares df Mean Square F Sig.
Regression 4418.625 2 2209.313 24.833 .000
Residual 800.687 9 88.965
Total 5219.312 11
The independent variable is Tree diameter (cm).
Coefficients
Unstandardized Coefficients
Standardized Coefficients
t Sig. B Std. Error Beta
Tree diameter (cm) 4.181 .901 2.001 4.640 .001 Tree diameter (cm) ** 2
-.064 .023 -1.214 -2.816 .020
(Constant) -15.175 7.834 -1.937 .085
Roots
Model Summary
R R Square
Adjusted R
Square
Std. Error of the
Estimate
.904 .818 .777 3.695
The independent variable is Tree diameter (cm).
ANOVA
Sum of Squares df Mean Square F Sig.
Regression 550.766 2 275.383 20.168 .000
Residual 122.890 9 13.654
Total 673.656 11
The independent variable is Tree diameter (cm).
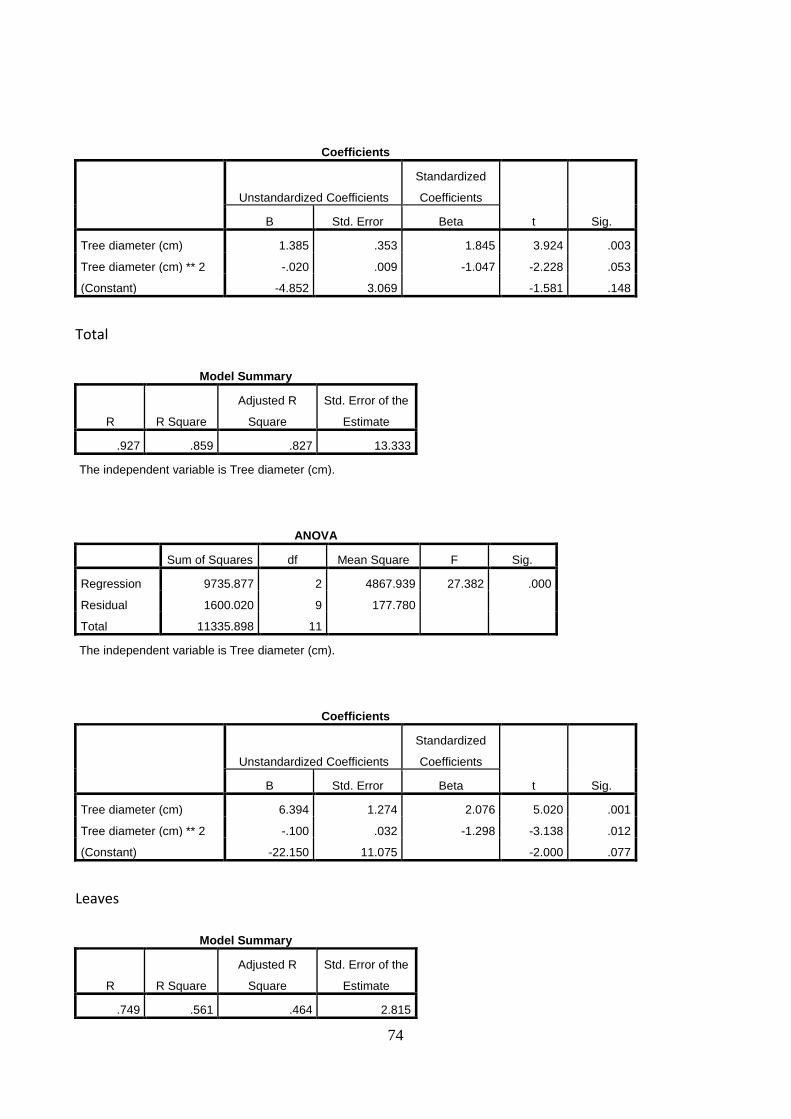
74
Coefficients
Unstandardized Coefficients
Standardized
Coefficients
t Sig. B Std. Error Beta
Tree diameter (cm) 1.385 .353 1.845 3.924 .003
Tree diameter (cm) ** 2 -.020 .009 -1.047 -2.228 .053
(Constant) -4.852 3.069 -1.581 .148
Total
Model Summary
R R Square
Adjusted R
Square
Std. Error of the
Estimate
.927 .859 .827 13.333
The independent variable is Tree diameter (cm).
ANOVA
Sum of Squares df Mean Square F Sig.
Regression 9735.877 2 4867.939 27.382 .000
Residual 1600.020 9 177.780
Total 11335.898 11
The independent variable is Tree diameter (cm).
Coefficients
Unstandardized Coefficients
Standardized
Coefficients
t Sig. B Std. Error Beta
Tree diameter (cm) 6.394 1.274 2.076 5.020 .001
Tree diameter (cm) ** 2 -.100 .032 -1.298 -3.138 .012
(Constant) -22.150 11.075 -2.000 .077
Leaves
Model Summary
R R Square
Adjusted R
Square
Std. Error of the
Estimate
.749 .561 .464 2.815
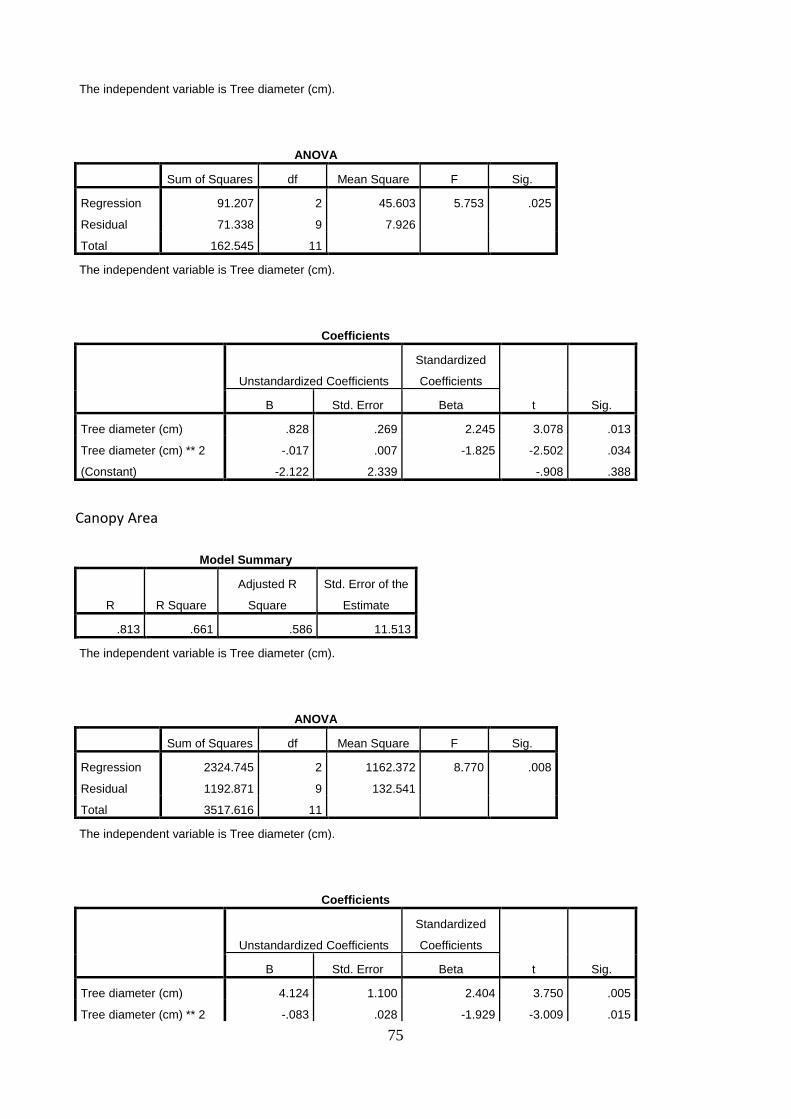
75
The independent variable is Tree diameter (cm).
ANOVA
Sum of Squares df Mean Square F Sig.
Regression 91.207 2 45.603 5.753 .025
Residual 71.338 9 7.926
Total 162.545 11
The independent variable is Tree diameter (cm).
Coefficients
Unstandardized Coefficients
Standardized
Coefficients
t Sig. B Std. Error Beta
Tree diameter (cm) .828 .269 2.245 3.078 .013
Tree diameter (cm) ** 2 -.017 .007 -1.825 -2.502 .034
(Constant) -2.122 2.339 -.908 .388
Canopy Area
Model Summary
R R Square
Adjusted R
Square
Std. Error of the
Estimate
.813 .661 .586 11.513
The independent variable is Tree diameter (cm).
ANOVA
Sum of Squares df Mean Square F Sig.
Regression 2324.745 2 1162.372 8.770 .008
Residual 1192.871 9 132.541
Total 3517.616 11
The independent variable is Tree diameter (cm).
Coefficients
Unstandardized Coefficients
Standardized
Coefficients
t Sig. B Std. Error Beta
Tree diameter (cm) 4.124 1.100 2.404 3.750 .005
Tree diameter (cm) ** 2 -.083 .028 -1.929 -3.009 .015
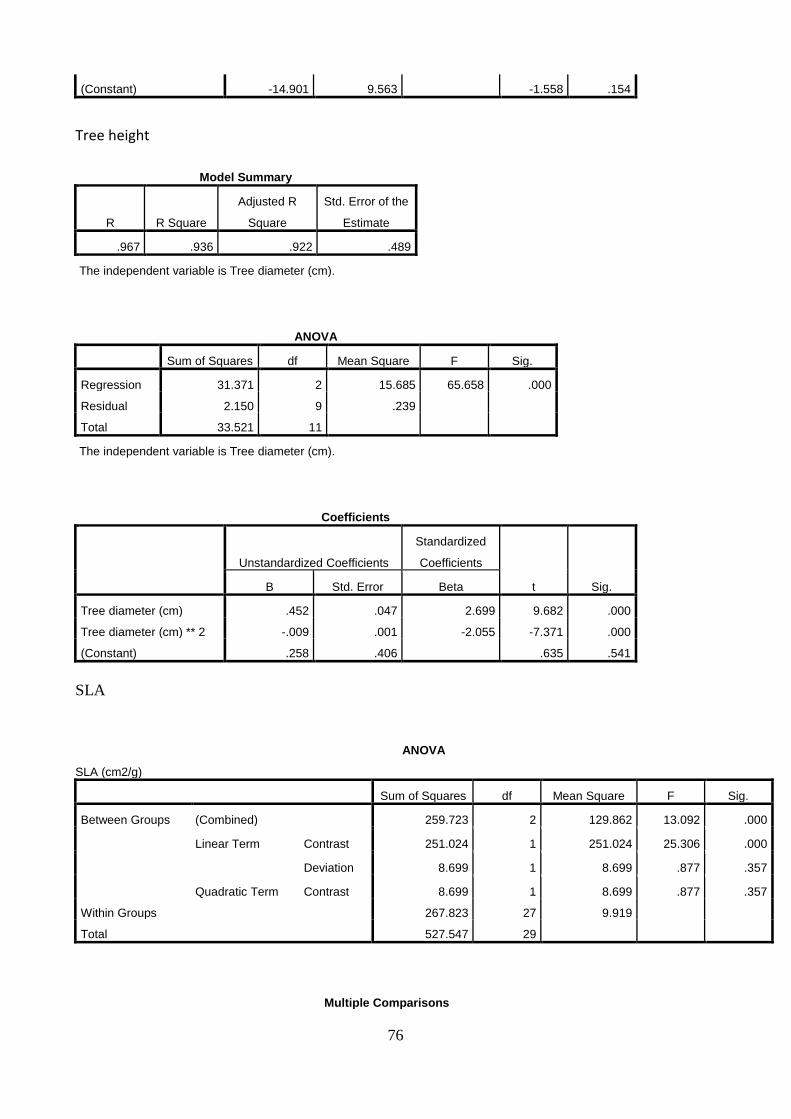
76
(Constant) -14.901 9.563 -1.558 .154
Tree height
Model Summary
R R Square
Adjusted R
Square
Std. Error of the
Estimate
.967 .936 .922 .489
The independent variable is Tree diameter (cm).
ANOVA
Sum of Squares df Mean Square F Sig.
Regression 31.371 2 15.685 65.658 .000
Residual 2.150 9 .239
Total 33.521 11
The independent variable is Tree diameter (cm).
Coefficients
Unstandardized Coefficients
Standardized
Coefficients
t Sig. B Std. Error Beta
Tree diameter (cm) .452 .047 2.699 9.682 .000
Tree diameter (cm) ** 2 -.009 .001 -2.055 -7.371 .000
(Constant) .258 .406 .635 .541
SLA
ANOVA
SLA (cm2/g)
Sum of Squares df Mean Square F Sig.
Between Groups (Combined) 259.723 2 129.862 13.092 .000
Linear Term Contrast 251.024 1 251.024 25.306 .000
Deviation 8.699 1 8.699 .877 .357
Quadratic Term Contrast 8.699 1 8.699 .877 .357
Within Groups 267.823 27 9.919
Total 527.547 29
Multiple Comparisons
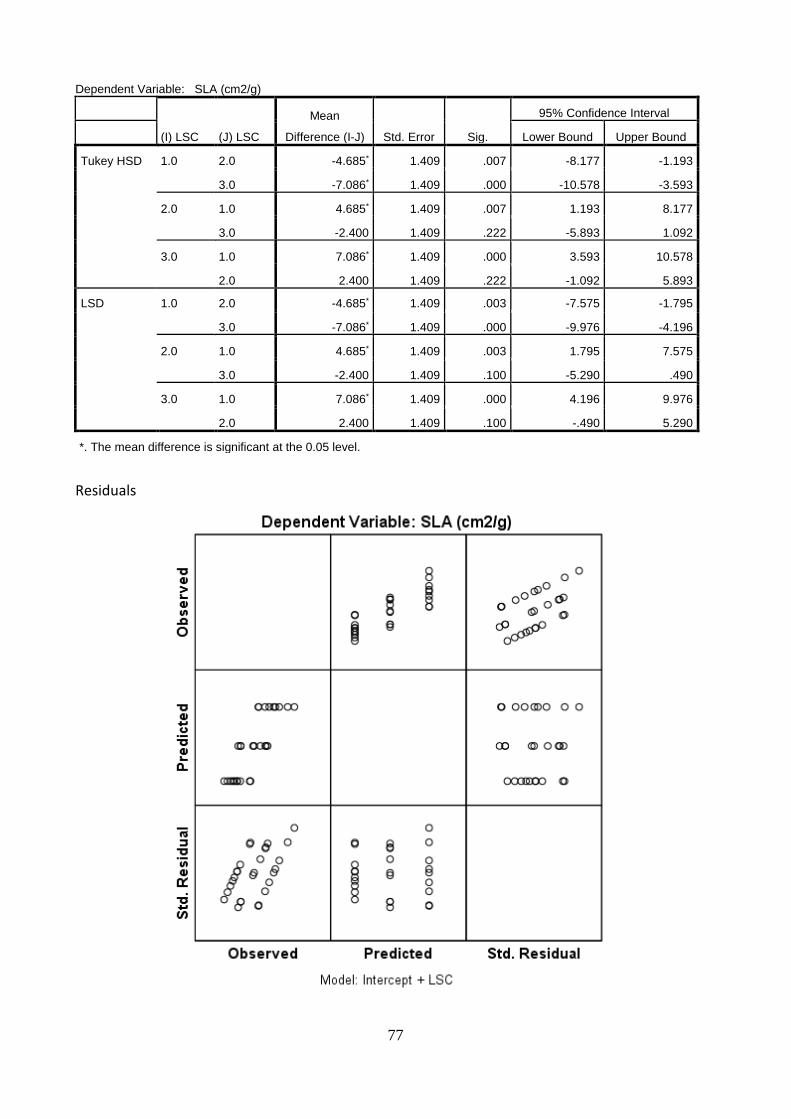
77
Dependent Variable: SLA (cm2/g)
(I) LSC (J) LSC
Mean
Difference (I-J) Std. Error Sig.
95% Confidence Interval
Lower Bound Upper Bound
Tukey HSD 1.0 2.0 -4.685* 1.409 .007 -8.177 -1.193
3.0 -7.086* 1.409 .000 -10.578 -3.593
2.0 1.0 4.685* 1.409 .007 1.193 8.177
3.0 -2.400 1.409 .222 -5.893 1.092
3.0 1.0 7.086* 1.409 .000 3.593 10.578
2.0 2.400 1.409 .222 -1.092 5.893
LSD 1.0 2.0 -4.685* 1.409 .003 -7.575 -1.795
3.0 -7.086* 1.409 .000 -9.976 -4.196
2.0 1.0 4.685* 1.409 .003 1.795 7.575
3.0 -2.400 1.409 .100 -5.290 .490
3.0 1.0 7.086* 1.409 .000 4.196 9.976
2.0 2.400 1.409 .100 -.490 5.290
*. The mean difference is significant at the 0.05 level.
Residuals

78