Investor Presentation Q1-3 2019 FINAL - Semperit · 2020-01-27 · From reported to operating...
36
SEMPERIT GROUP Q1-3 2019 / Q3 2019 INVESTOR PRESENTATION 1
Transcript of Investor Presentation Q1-3 2019 FINAL - Semperit · 2020-01-27 · From reported to operating...
SEMPERIT GROUP Q1-3 2019 / Q3 2019INVESTOR PRESENTATION
1

Highlights (p.2)
Management agenda (p.23)
Agenda
Appendix (p.26)
2 Investor Presentation Q1-3 2019 I 19 December 2019 I Investor Relations
Operational highlights (p.5)
Financial performance (p.12)

Target by end of 2020
(run rate 2021):
10%EBITDA margin
Transformation programme shows material impact, with Group EBITDA significantly above last year’s levels
3
Reduced complexity and higher quality of order book clearly supportive … … however, economic downturn and decreasing order books will impact coming quarters Outlook uncertain due to limited visibility
1) Q1-3’18: adjusted for the negative one-off effect of € 4m from closure of Sempertrans site in China.2) Q1-3’19: adjusted for the positive one-off effect of € 4m due to release of provision in Sempermed for Brazilian court case for tax liabilities.
Q1-3 2018
652.2
Q1-3 2019
670.3
-2.7%
Revenue in € m
Q1-3 2018
6.3%
9.3%
Q1-3 2018
6.8%
Q1-3 2019
8.6%
Q1-3 2019
41.945.8
60.456.4
+44.1%+23.1%
EBITDA marginEBITDA in € m
Revenue –2.7% for Group -1.5% for Industrial Sector -4.9% for Medical Sector
EBITDA +23.1%2) vs. adj. Q1-3’181)
for Group +25.3% for Industrial Sector
(vs. adjusted Q1-3’181)) Medical Sector turning positive
for the second quarter in a row 8.6%2) EBITDA margin
encouraging 1) 2)
Investor Presentation Q1-3 2019 I 19 December 2019 I Investor Relations

Key topics Q1-3 2019
4
Revenue decreased by 2.7% to € 652.2m– Industrial Sector down only by 1.5% to
€ 426.2m– Medical Sector: revenue decline reduced
to -4.9% yoy to € 226.0m
Adj. EBITDA € 56.4m, +23.1% vs. adj. € 45.8m Q1-3’18,
Adj. EBIT € 29.0m, +65.7% vs. adj. € 17.5m Q1-3’18
Net Profit € -34.1m vs € -72.9m Q1-3’18
Capex € 25.1m vs. € 57.7m in Q1-3’18
Semperit Group continues to improve at EBITDA level– SemperMove10 delivers tangible
improvements – Profitability level of the first nine months
significantly increased yoy– All four segments profitable, including
Sempermed (positive for consecutive second quarter at EBITDA level)
Focus points – Group – Slowdown of the global economy is expected to have
adverse effects – Lower order books across all segments – proactive
measures taken – Strategy project SemperGrowth200 has been
initiated – Limited short-term visibility – especially H1 2020
remains under pressure
Focus points – Sempermed – Stronger price competition in deteriorating market
environments and low plant utilization at Sempermed and all other Industrial segments
– Market predominantly driven through higher level of automation with strong CAPEX by major peers
– Current order intake and booking situation significantly lower than in H1 2019
– Keeping up the pace would require higher CAPEX –which might become unreasonably high
– Strategic options are being examined

Highlights (p.2)
Management agenda (p.23)
Agenda
Appendix (p.26)
5
Operational highlights (p.5)
Financial performance (p.12)
Investor Presentation Q1-3 2019 I 19 December 2019 I Investor Relations

Revenue development Q1-3 2019
in € m
6
Semperflex: Almost unchanged despite reduced market demand due to destocking
Sempertrans: Decrease due to lower volumes as a result of focus shift to quality of order book and product profitability
Semperform: Stable despite reduced market demand
Sempermed: Lower sales due to strategic change in production portfolio (focus on Nitrile) and reduced outsourcing, thus less traded goods
Revenue development
1) All percentage numbers imply year-on-year percentage change for Q1-3'19.
-11.5-6.0
Q1-3 2018
-0.3
SempertransSemperflex
-0.3
Semperform Sempermed Q1-3 2019
670.3 652.2-2.7%
174.7m 103.3m 148.2m 226.0mRevenueQ1-3 2019 ►
-5.4% -0.2%
Industrial Sector
Medical Sector
-4.9%1)
-1.5%1)
-0.2%
Investor Presentation Q1-3 2019 I 19 December 2019 I Investor Relations

Industrial Sector EBITDA Q1-3 and Q3 2019
7
1) Q1-3’18 and Q2’18 EBITDA adjusted by € 4m due to closure of Sempertrans site in China.
IndustrialSector
13.8
Q1-3’18
17.5
74.7
Q1-3’19
59.6
Quarterly development with a clearly positive trend despite seasonal headwind in Industrial Sector: Q3’19 yoy EBITDA +23.3% or € 4.1m
Strong improvement in Industrial Sector:
+25.3% EBITDA yoy, +€ 15.1m
Q1-3’19 result already above FY 2018
1)
13.3
17.315.3
Q1
19.017.9
16.1
Q2
23.0
12.6
Q3
11.6
Q4
18.8
24.5
28.2
22.0
15.6
EBITDA ’18 marginEBITDA ’18 in € mEBITDA ’19 in € m EBITDA ’19 margin
1)
Investor Presentation Q1-3 2019 I 19 December 2019 I Investor Relations

Revenue almost unchanged despite reduced market demand due to destocking
EBITDA in Q1-3’19 slightly improved yoy, while EBTIDA margin nearly unchanged
Size of order book decreased significantly compared to Q1-3’18 – competitive pressure expected to increase further
Ongoing destocking and partially lower demand of customer base expected to have a negative impact on sales and EBITDA in the coming quarters
Sem
perf
lex
Semperflex Q1-3 2019
Q1-3 2019 vs. Q1-3 2018
8
17.4%
13.7
Q1’18
23.4%
14.9
23.8%
Q2’18
22.8%
9.3
Q3’18
10.9
19.8%
Q4’18 Q3’19
13.9
Q1’19
14.5
24.4%
Q2’19
10.8
20.1%
Semperflex
in € m
175
175
39
38
Revenue comparable period
Revenue current period
EBITDAcurrent period
EBITDA comparable period
EBITDA in € mEBITDA margin
Q1-3'18 vs Q1-3’19: +3.4% EBITDA yoy, € +1.3m
Investor Presentation Q1-3 2019 I 19 December 2019 I Investor Relations

Successful turnaround after closure of Sempertrans sites (FRA & CHN), improved operational performance and quality of order book
Significant increase in EBITDA yoy 2)
Strong improvement of EBITDA margin from 3.3% in Q1-3’18 to 12.3% in Q1-3’19
Order book slightly under pressure due to reduced market demand especially in European lignite industry
Sem
pert
rans
Sempertrans Q1-3 2019
9
Sempertrans
2.1%
0.5
6.4%
1.4%
Q2’18Q1’18
2.40.8
Q3’180.7
2.1%
Q1’19Q4’18 Q3’19
2.7
9.0%
5.4
14.2%
Q2’19
4.6
13.1%EBITDA in € mEBITDA margin
Q1-3'18 vs Q1-3’19: >100% EBITDA yoy, € +9.1m
1) Q1-3'18 EBITDA: adjusted by € 4m due to closure of Sempertrans site in China.2) Q1-3’19 EBITDA: positive effects of € 1.3m profit from sale of assets of closed factory in China, and + € 1.7 m insurance claim.
Q1-3 2019 vs. Q1-3 2018
103
109
4
EBITDAcurrent period
Revenue current period
Revenue comparable period
EBITDA comparable period
1)
1)
in € m
13
Investor Presentation Q1-3 2019 I 19 December 2019 I Investor Relations
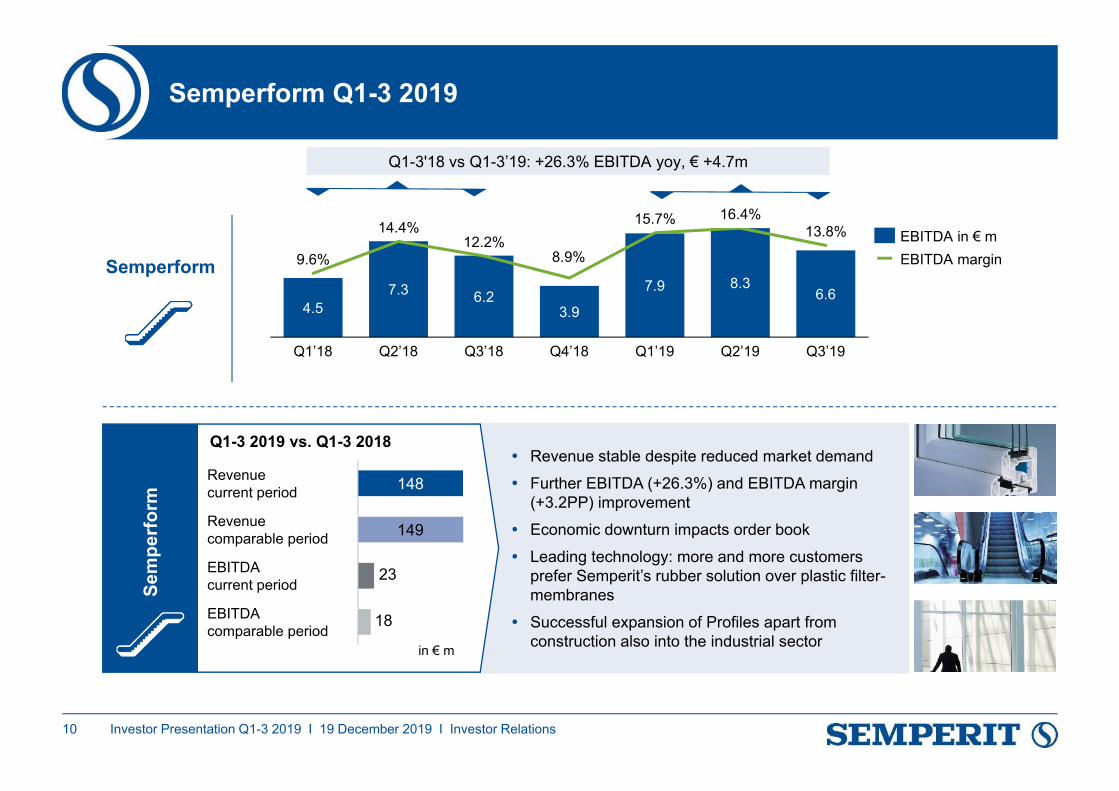
Revenue stable despite reduced market demand Further EBITDA (+26.3%) and EBITDA margin
(+3.2PP) improvement Economic downturn impacts order book Leading technology: more and more customers
prefer Semperit’s rubber solution over plastic filter-membranes
Successful expansion of Profiles apart from construction also into the industrial sector
Sem
perf
orm
Semperform Q1-3 2019
10
Q1-3 2019 vs. Q1-3 2018
6.24.5
9.6%
Q1’18
14.4%
7.3
Q2’18
15.7%12.2%
Q3’18
3.9
Q4’18
8.9%
7.9
Q1’19
8.3
16.4%
Q2’19
6.6
13.8%
Q3’19
Semperform
in € m
148
149
EBITDAcurrent period
Revenue current period
Revenue comparable period
EBITDA comparable period
EBITDA in € mEBITDA margin
Q1-3'18 vs Q1-3’19: +26.3% EBITDA yoy, € +4.7m
23
18
Investor Presentation Q1-3 2019 I 19 December 2019 I Investor Relations

Lower revenue level mainly driven by strategic change in production portfolio (focus on Nitrile) and reduced outsourcing
Ongoing operational improvements resulted in higher profitability
Order book declining mainly due to inventory streamlining by key business customers and increasingly difficult market conditions
Sem
perm
ed
Q1-3 2019 vs. Q1-3 2018
-1.1%
Q2’19
-1.3
1.4
2.3%1.8%
Q1’18-4.2%
-1.7%
Q3’18Q2’18
-0.9-3.1
Q4’18
0.8%
-0.9
-1.2%
Q1’19
0.61.8
Q3’19
in € m
226
238
2
-1
Revenue current period
EBITDAcurrent period
Revenue comparable period
EBITDA comparable period
EBITDA marginEBITDA in € m
Q1-3'18 vs Q1-3’19: >100% EBITDA yoy, € +2.3m
Medical Sector / Sempermed segment Q1-3 2019
11
MedicalSector
Sempermed
1) Q1-3’19 and Q3’19 EBITDA adjusted for € 4m due to release of provision in Sempermed for Brazilian court case for tax liabilities
1)
1)
Investor Presentation Q1-3 2019 I 19 December 2019 I Investor Relations
Highlights (p.2)
Management agenda (p.23)
Agenda
Appendix (p.26)
12
Operational highlights (p.5)
Financial performance (p.12)
Investor Presentation Q1-3 2019 I 19 December 2019 I Investor Relations
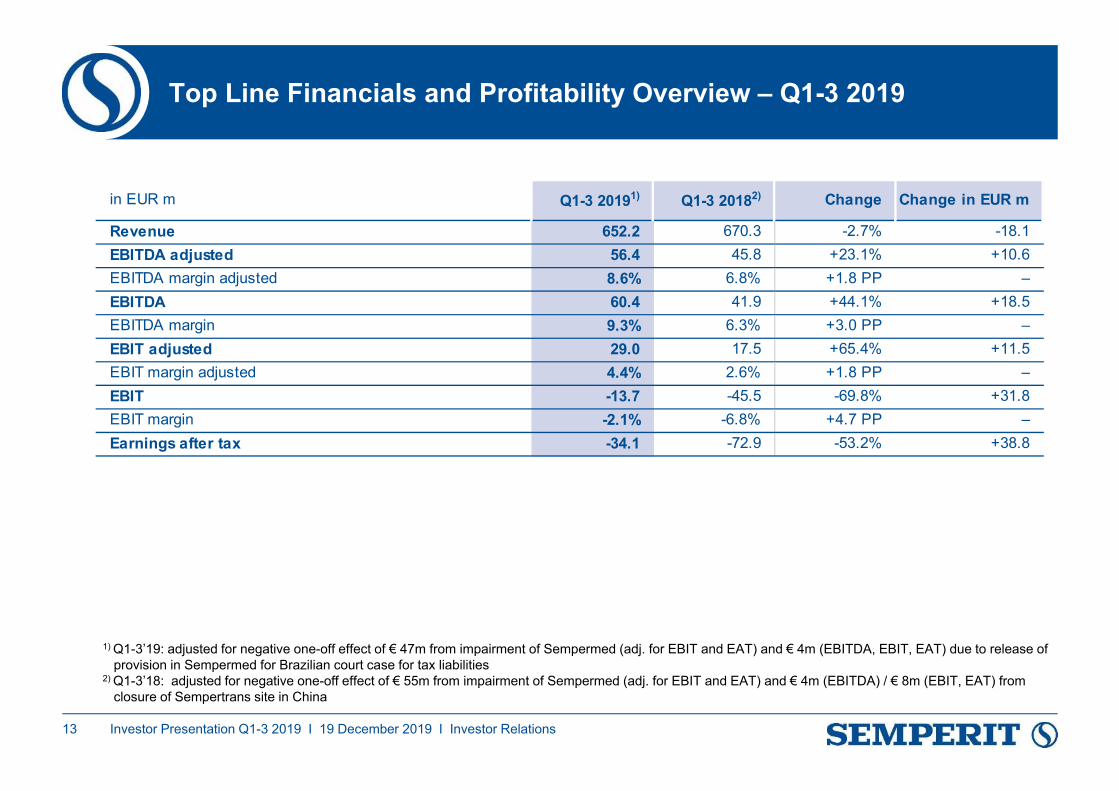
Top Line Financials and Profitability Overview – Q1-3 2019
13
1) Q1-3’19: adjusted for negative one-off effect of € 47m from impairment of Sempermed (adj. for EBIT and EAT) and € 4m (EBITDA, EBIT, EAT) due to release of provision in Sempermed for Brazilian court case for tax liabilities
2) Q1-3’18: adjusted for negative one-off effect of € 55m from impairment of Sempermed (adj. for EBIT and EAT) and € 4m (EBITDA) / € 8m (EBIT, EAT) from closure of Sempertrans site in China
in EUR m Q1-3 20191) Q1-3 20182) Change Change in EUR m
Revenue 652.2 670.3 -2.7% -18.1EBITDA adjusted 56.4 45.8 +23.1% +10.6EBITDA margin adjusted 8.6% 6.8% +1.8 PP –EBITDA 60.4 41.9 +44.1% +18.5EBITDA margin 9.3% 6.3% +3.0 PP –EBIT adjusted 29.0 17.5 +65.4% +11.5EBIT margin adjusted 4.4% 2.6% +1.8 PP –EBIT -13.7 -45.5 -69.8% +31.8EBIT margin -2.1% -6.8% +4.7 PP –Earnings after tax -34.1 -72.9 -53.2% +38.8
Investor Presentation Q1-3 2019 I 19 December 2019 I Investor Relations

Revenue development H1 2019
SemperflexQ1-3 2018
-0.3 -6.0
Sempertrans
-0.3
Semperform
-11.5
Sempermed Q1-3 2019
670.3 652.2
-2.7%
in € m
-5.4%1) -0.2%1)
14
174.7m 103.3m 148.2m 226.0mRevenueQ1-3 2019 ►
1) All percentage numbers imply year-on-year percentage change for Q1-3'2019.
Industrial Sector
Medical Sector
-4.9%1)
-1.5%1)
-0.2%1)
Revenue development Q1-3 2019
Investor Presentation Q1-3 2019 I 19 December 2019 I Investor Relations

From reported to operating EBITDA / EBIT Q1-3 2019
15
EBITDA reported
(final)
EBITDA adjusted
(final)
4.0
One-Off: Sempermed
provision reversal (Brazil)
52.456.4
EBITDA: due positive decision on November 12th 2019 of the Brazilian courts with regards to tax liabilities EUR 4.0 m were released from provisions (effective in the segment Sempermed, recognised as a one-off item) – reported figures are adjusted accordingly
EBIT: Impairment losses at EUR 46.8 m were recognised in the segment Sempermed in Q3’19 due to the significant increase of the competitive environment – thus reported EBIT amounts to EUR -13.7 m, while adjusted EBIT reaches EUR 29.0 m
1) Q1-3’19 EBITDA: Sempertrans positive effects of € 1.3m profit from sale of assets of closed factory in China, and + € 1.7 m insurance claim – reported figures not adjusted
EBIT reported
(final)
4.0One-Off:
Sempermed provision
reversal (Brazil)
46.8
One-Off: Sempermed Impairment
EBIT adjusted
(final)
29.0
-13.7
EBITDA EBIT
1)
Investor Presentation Q1-3 2019 I 19 December 2019 I Investor Relations

Adjusted EBITDA development Q1-3 2019
+2.3
Q1-3 2018 Semperform
+1.3
+9.1
SempermedSemperflex Sempertrans
+4.756.4
-6.8
Corporate Q1-3 2019
45.8
+23.1%
16
45.8madj. EBITDA Q1-3 2018 -13.0m38.0m 3.6m 18.0m -0.8m
adj. EBITDAQ1-3 2019 -19.8m 56.4m39.3m 12.7m 22.7m 1.5m
adj. EBITDA margin Q1-3 2019
– 8.6%22.5% 12.3% 15.3% 0.7%
in € m
1) Q1-3’18: adjusted for the negative one-off effect of € 4m from closure of Sempertrans site in China2) Q1-3’19: adjusted for the positive one-off effect of € 4m due to release of provision in Sempermed for Brazilian court case for tax liabilities.
1)1) 2)
Investor Presentation Q1-3 2019 I 19 December 2019 I Investor Relations

Sempermove10 shows material impact:Consistent yoy EBITDA improvement for 7th consecutive quarter
17
Despite seasonal decline Q3’19 outperforms best quarter of 2018 (Q2) Q1-3 2019 EBITDA exceeds FY 2018 level
Q1-3 2018
6.3%
Q1-3 2018
41.9
6.8%9.3%
Q1-3 2019
8.6%
Q1-3 2019
45.8
60.456.4
+44.1%+23.1%
EBITDA margin EBITDA in € m
1)
1) Q1-3 2018 and Q2 2018 EBITDA adjusted by € 4m due to closure of Sempertrans site in China.2) Q1-3 2019 and Q3 2019 EBITDA adjusted by € 4m due to release of provision in Sempermed for Brazilian court case for tax liabilities.
10.1%
Q1 Q4
7.1%7.5%7.7%
Q2
5.9%
8.0%
Q3
2.2%
15.8 16.5 17.0
22.7
13.1
17.3
4.5
EBITDA margin 2018EBITDA, in EURm 2018
EBITDA margin 2019EBITDA, in EURm 2019
1) 2) 2)
Investor Presentation Q1-3 2019 I 19 December 2019 I Investor Relations
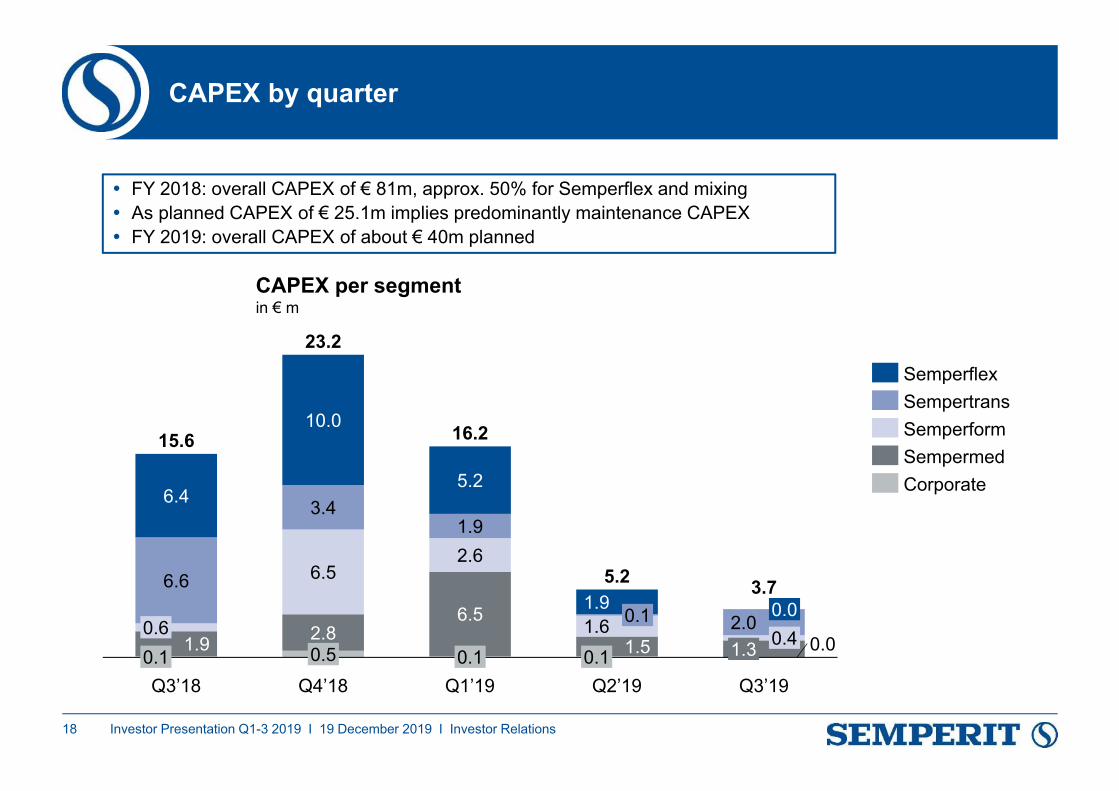
CAPEX by quarter
6.6
15.6
0.6
10.0
0.11.9
3.4
1.6
6.5
2.8
23.2
0.0
0.5 0.0
Q4’18
5.26.4
1.9
6.5
0.1Q1’19
16.2
1.90.11.50.1
Q2’19Q3’18
1.32.0
0.4
Q3’19
5.2 3.72.6
CAPEX per segmentin € m
18
Semperform
Semperflex
Sempermed
Sempertrans
Corporate
FY 2018: overall CAPEX of € 81m, approx. 50% for Semperflex and mixing As planned CAPEX of € 25.1m implies predominantly maintenance CAPEX FY 2019: overall CAPEX of about € 40m planned
Investor Presentation Q1-3 2019 I 19 December 2019 I Investor Relations

Working Capital Overview
Components of Working Capitalin € m
162.8
163.4
123.7
150.4
-105.3
112.6
30 Sept 2018
-67.7
101.6
31 Dec 2018
150.6
-78.4
31 March 2019
147.1
177.9184.3
Inventories
114.1
-83.3
30 June 2019
136.0
109.8
-82.5
30 Sept 2019
Trade receivables
Trade payables
181.2184.8
19.0%1)
19
1) Trade Working Capital in % of LTM revenues
20.6%1) 21.0%1) 21.0%1) 20.5%1)
Investor Presentation Q1-3 2019 I 19 December 2019 I Investor Relations
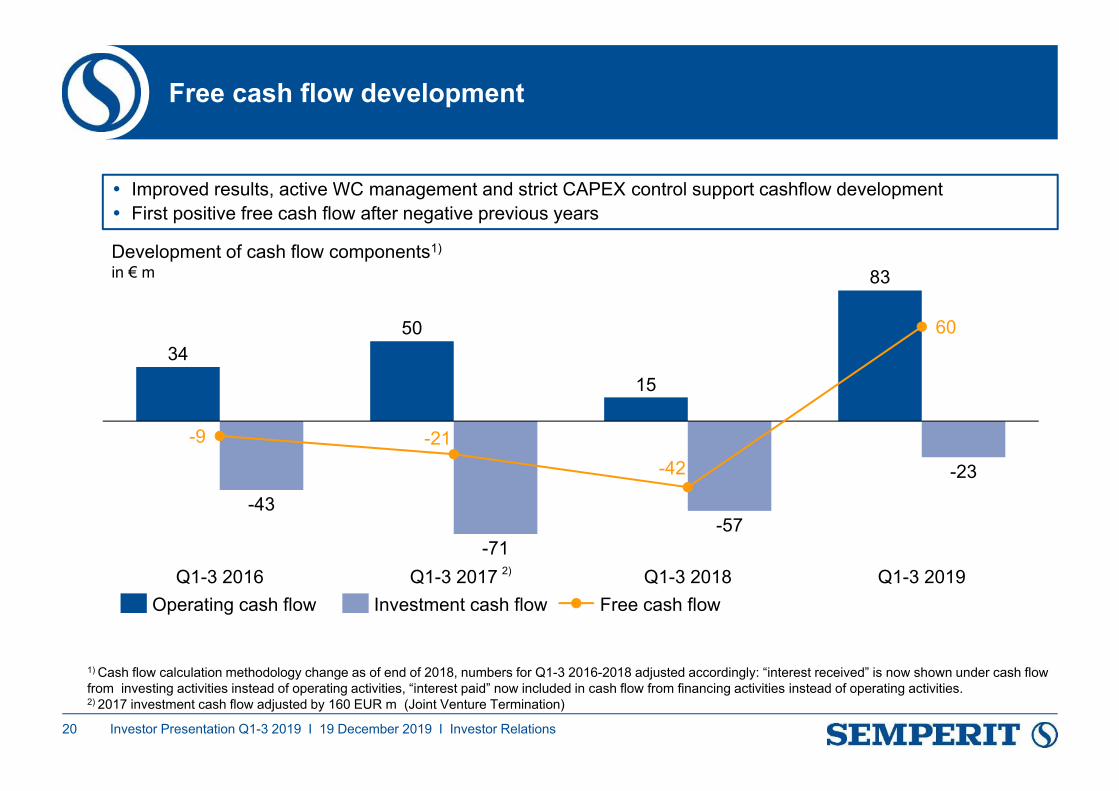
Free cash flow development
20
3450
15
83
-43
-71-57
-23
-9 -21-42
60
Q1-3 2017Q1-3 2016 Q1-3 2019Q1-3 2018Operating cash flow Investment cash flow Free cash flow
2)
1) Cash flow calculation methodology change as of end of 2018, numbers for Q1-3 2016-2018 adjusted accordingly: “interest received” is now shown under cash flow from investing activities instead of operating activities, “interest paid” now included in cash flow from financing activities instead of operating activities. 2) 2017 investment cash flow adjusted by 160 EUR m (Joint Venture Termination)
Improved results, active WC management and strict CAPEX control support cashflow development First positive free cash flow after negative previous years
Development of cash flow components1)
in € m
Investor Presentation Q1-3 2019 I 19 December 2019 I Investor Relations

Balance sheet structure and financial profile
Balance sheet 30/09/2019: € 750mBalance sheet 31/12/2018: € 769m
22711020
5
102
160
Assets30/09/’19
319
136
122
150
26
369
8
Assets31/12/’18
150
225
6418
285
Equity & Liabilities30/09/’19
122
869
13
330
Equity & Liabilities31/12/’18
Fixedassets
Inventories
Trade receivables
Cash and cash equivalents
Current assets
21
Equity (incl. hybrid capital)
Liabilities from redeemable non-controlling interestsProvisions incl. social capital
Other liabilities incl. deferred taxes
Corporate Schuldschein loan
Liabilities to banks
Balance sheet structure
Cash and cash equivalents of € 160m
Financial liabilities: Corporate Schuldschein loan of € 225m Liabilities to banks of € 8m
Net debt of € 73.2m down by € 39.5m since end of Dec. 2018 Net debt / EBITDA of 1.1x,
compared to 2.4x as of end of Dec. 2018
Hybrid capital of € 130.0m strengthens equity
Equity ratio of 37.9% vs. 42.9% Dec. 2018
Financial profile as of 30 September 2019
Assets heldfor sale
Investor Presentation Q1-3 2019 I 19 December 2019 I Investor Relations

Financial Policy Framework
Focus on Value Management
1) Working capital to last twelve months revenue.
22
EBITDA margin of 10% at Group levelby end of 2020 (run rate 2021)
Net debt/EBITDA < 3.5x
Working Capitalto revenue < 25%,focus to stay closer to 20%1)
Total Capex of about € 40min FY 2019 mostly for maintenance
% Equity ratio of >30%
€ €
Investor Presentation Q1-3 2019 I 19 December 2019 I Investor Relations
Highlights (p.2)
Management agenda (p.23)
Agenda
Appendix (p.26)
23
Operational highlights (p.5)
Financial performance (p.12)
Investor Presentation Q1-3 2019 I 19 December 2019 I Investor Relations

Management agenda 2019
24
Safeguard SemperMove10
Address global economic downturn…
… and take proactive initiatives
Finalise strategic transformation plan
Develop strategic options for Sempermed
Investor Presentation Q1-3 2019 I 19 December 2019 I Investor Relations
Contact and financial calendar
Investor Relations Semperit Financial Calendar 2020
25
DisclaimerThe information provided in this presentation does not constitute an offer for the sale of securities nor an invitation to submit an offer to purchase shares of Semperit AG Holding, but exclusively serves information purposes.The terms “Semperit” or “Semperit Group” in this presentation refer to the group; “Semperit AG Holding” or “Semperit Aktiengesellschaft Holding” is used to refer to the parent company (individual company).We have prepared this presentation and verified the information it contains with the greatest possible care. Nevertheless, rounding, typesetting and printing errors cannot be ruled out. Rounding of differences in the summation rounded amounts and percentages may arise from the automatic processing of data.The forecasts, plans and forward-looking statements contained in this presentation are based on the knowledge and information available and the assessments made at the time that this presentation was prepared. As is true of all forward-looking statements, these statements are subject to risk and uncertainties. As a result, actual events may deviate significantly from these expectations. No liability whatsoever is assumed for the accuracy of projections or for the achievement of planned targets or for any other forward-looking statements. Words such as “expect,” “want”, “believe,” “anticipate,” “includes,” “plan,” “assumes,” “estimate,” “projects,” “intends,” “should,” “will,” “shall,” or variations of such words are generally part of forward-looking statements.Furthermore, there is no guarantee that the contents are complete. Statements referring to people are valid for both men and women.
Judit Helenyi, Investor Relations
+43 1 79777 - 310www.semperitgroup.com/en/irModecenterstrasse 22 1031 Vienna, Austria
20.03.2020 Publication of 2019 annual financial statements21.04.2020 Annual general meeting, Vienna27.04.2020 Dividend payment day20.05.2020 Report on Q1 202014.08.2020 Half-year financial report 2020 19.11.2020 Report on Q1-3 2020
Investor Presentation Q1-3 2019 I 19 December 2019 I Investor Relations

Highlights (p.2)
Management agenda (p.23)
Agenda
Appendix (p.26)
26
Operational highlights (p.5)
Financial performance (p.12)
Investor Presentation Q1-3 2019 I 19 December 2019 I Investor Relations

Sectors and Group Q1-3 2019 vs Q1-3 2018
27
1) Including Corporate Center costs (Holding, supporting functions, special projects): EBITDA: € -19.8m in Q1-3 2019 (€ -13.0m in Q1-3 2018) 2) Q1-3 2018 adjusted for negative one-off effect of € 4m (EBITDA); Q1-3 2019 adjusted for negative one-off effect of € 47m from impairment of Sempermed (adj. for EBIT) and € 4m (EBITDA, EBIT) due to
release of provision in Sempermed for Brazilian court case for tax liabilities
in EUR m Q1-3 2019 Q1-3 2018 % Q1-3 2019 Q1-3 2018 % Q1-3 2019 Q1-3 2018 %Revenue 426.2 432.7 -1.5% 226.0 237.5 -4.9% 652.2 670.3 -2.7%EBITDA 74.7 55.8 +34.0% 5.6 -0.8 – 60.4 41.9 +44.1%EBITDA margin 17.5% 12.9% +4.6 PP 2.5% -0.3% +2.8 PP 9.3% 6.3% +3.0 PPAdj. EBITDA1) 74.7 59.6 +25.3% 1.5 -0.8 – 56.4 45.8 +23.1%Adj. EBITDA margin2) 17.5% 13.8% +3.8 PP 0.7% -0.3% +1.0 PP 8.6% 6.8% +1.8 PPEBIT 55.0 35.3 +55.7% -47.2 -66.4 -28.8% -13.7 -45.5 -69.8%EBIT margin 12.9% 8.2% +4.7 PP -20.9% -27.9% +7.0 PP -2.1% -6.8% +4.7 PPAdj. EBIT2) 55.0 43.2 +27.4% -4.5 -11.2 -59.5% 29.0 17.5 +65.4%Adj. EBIT margin2) 12.9% 10.0% +2.9 PP -1.7% -4.7% +3.0 PP 4.4% 2.6% +1.8 PP
Industrial Sector Medical Sector Semperit Group1)
Investor Presentation Q1-3 2019 I 19 December 2019 I Investor Relations
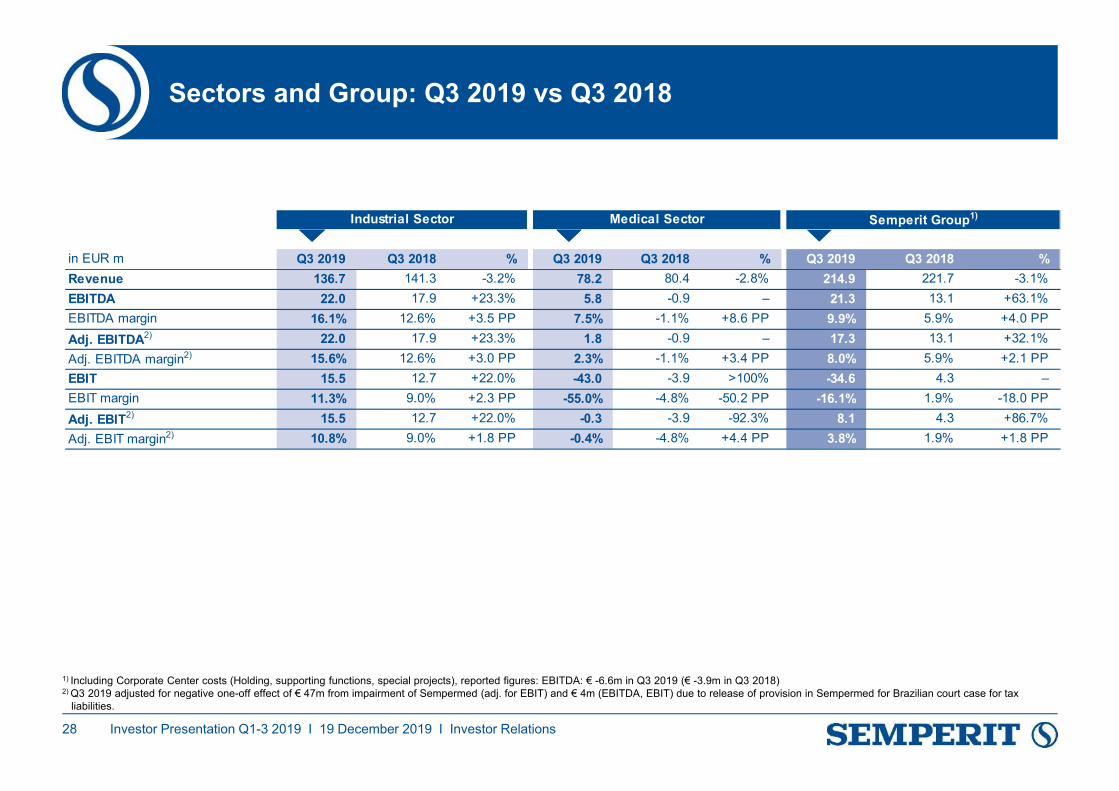
1) Including Corporate Center costs (Holding, supporting functions, special projects), reported figures: EBITDA: € -6.6m in Q3 2019 (€ -3.9m in Q3 2018)2) Q3 2019 adjusted for negative one-off effect of € 47m from impairment of Sempermed (adj. for EBIT) and € 4m (EBITDA, EBIT) due to release of provision in Sempermed for Brazilian court case for tax
liabilities.
Sectors and Group: Q3 2019 vs Q3 2018
28
in EUR m Q3 2019 Q3 2018 % Q3 2019 Q3 2018 % Q3 2019 Q3 2018 %Revenue 136.7 141.3 -3.2% 78.2 80.4 -2.8% 214.9 221.7 -3.1%EBITDA 22.0 17.9 +23.3% 5.8 -0.9 – 21.3 13.1 +63.1%EBITDA margin 16.1% 12.6% +3.5 PP 7.5% -1.1% +8.6 PP 9.9% 5.9% +4.0 PPAdj. EBITDA2) 22.0 17.9 +23.3% 1.8 -0.9 – 17.3 13.1 +32.1%Adj. EBITDA margin2) 15.6% 12.6% +3.0 PP 2.3% -1.1% +3.4 PP 8.0% 5.9% +2.1 PPEBIT 15.5 12.7 +22.0% -43.0 -3.9 >100% -34.6 4.3 –EBIT margin 11.3% 9.0% +2.3 PP -55.0% -4.8% -50.2 PP -16.1% 1.9% -18.0 PPAdj. EBIT2) 15.5 12.7 +22.0% -0.3 -3.9 -92.3% 8.1 4.3 +86.7%Adj. EBIT margin2) 10.8% 9.0% +1.8 PP -0.4% -4.8% +4.4 PP 3.8% 1.9% +1.8 PP
Industrial Sector Medical Sector Semperit Group1)
Investor Presentation Q1-3 2019 I 19 December 2019 I Investor Relations

Semperit Group adj. where applicable
1) Figures for 2016 without profit contribution from SSC and adj. for JV transaction. 2) Q1 2017 adj. for positive one-off effects from JV transaction of € 85m. Figures for Q2, Q3 and Q4 2017 restructuring expenses/closure in France (€ 11m) and valuation adjustment in IT (€ 4m EBITDA),
expenses resulting from tax audit in Austria (€ 5m, mainly for refund of energy supply charge).3) Q2 2018 adjusted for negative one-off effects from closure of Sempertrans site in China (€ 4m for EBITDA).4) Q3 2019 adjusted for negative one-off effect of € 47m from impairment of Sempermed (adj. for EBIT) and € 4m (EBITDA, EBIT) due to release of provision in Sempermed for Brazilian court case for tax
liabilities.
29
EBITDA adj. per quarter
16.5
4.5
Q1’19Q3’18
13.1
Q4’18
17.3
Q3’194)Q2’19
22.7
Revenue 852.4 229.3 232.3 208.4 204.2 874.2 220.9 227.6 221.7 208.2 878.5 212.9 224.4 214.9EBITDA 74.7 9.6 12.9 10.4 2.9 35.8 15.8 17.0 13.1 4.5 50.3 16.5 22.7 17.3EBITDA margin 8.8% 4.2% 5.6% 5.0% 1.4% 4.1% 7.1% 7.5% 5.9% 2.2% 5.7% 7.7% 10.1% 8.0%
EBIT 41.1 1.6 4.6 1.7 -8.7 -0.8 6.0 7.2 4.3 -2.2 15.4 7.8 13.1 8.1EBIT margin 4.8% 0.7% 2.0% 0.8% -4.3% -0.1% 2.7% 3.2% 1.9% -1.0% 1.7% 3.7% 5.8% 3.8%
Q22019
Q32019
adj.4)
Semperit Group adj. where applicable
Q42018
FY2018
Q12019
Q32017
adj.2)
Q42017
adj.2)
FY2017
adj.2)
Q12018
Q22018
adj.3)
Q32018 in EUR m
FY2016
adj.1)
Q12017
adj.2)
Q22017
adj.2)
EBIT adj. per quarter
Q3’18 Q1’19Q4’18 Q3’194)Q2’19
4.3
7.8
-2.2
13.1
8.1
Investor Presentation Q1-3 2019 I 19 December 2019 I Investor Relations

Semperflex and Sempertrans (adj. where applicable)
1) Values for 2016 restated, the business unit Sheeting was reclassified from segment Semperflex to segment Semperform.2) Q1 2017 adj. for positive one-off effects from JV transaction of € 85m. Figures for Q2, Q3 and Q4 2017 restructuring expenses/closure in France (€ 11m) and valuation adjustment in IT (€ 4m EBITDA),
expenses resulting from tax audit in Austria (€ 5m, mainly for refund of energy supply charge).3) Q2 2018 adjusted for negative one-off effects from closure of Sempertrans site in China (€ 4m for EBITDA).
30
Semperflex (Hoses)
Revenue 184.9 53.5 53.2 46.8 52.5 206.1 58.8 62.8 53.4 55.1 230.0 61.1 59.7 53.8EBITDA 43.4 11.7 10.5 8.7 10.5 41.4 13.7 14.9 9.3 10.9 48.9 13.9 14.5 10.8EBITDA margin 23.5% 21.8% 19.8% 18.6% 19.9% 20.1% 23.4% 23.8% 17.4% 19.8% 21.3% 22.8% 24.3% 20.1%
EBIT 35.3 9.6 8.6 6.8 7.8 32.7 11.1 12.3 6.9 8.1 38.4 11.1 11.5 7.7EBIT margin 19.1% 18.0% 16.1% 14.5% 14.8% 15.9% 18.9% 19.7% 12.9% 14.8% 16.7% 18.2% 19.2% 14.3%
Q32019
Q22019
Q12019
Q32018
Q42018
FY2018
Q22017
adj.2)
Q32017
adj.2)
Q42017 adj.2)
FY2017
adj.2)
Q12018
Q22018
adj.3)in EUR m
FY20161)
Q12017
adj.2)
Sempertrans (Conveyor belts)
Revenue 148.4 41.3 36.8 35.7 32.1 146.0 34.6 37.0 37.6 35.5 144.8 30.4 37.8 35.1EBITDA 15.9 0.6 -2.4 -1.4 -2.1 -5.3 0.5 0.8 2.4 0.7 4.4 2.7 5.4 4.6EBITDA margin 10.7% 1.4% -6.4% -3.9% -6.6% -3.6% 1.4% 2.1% 6.4% 2.1% 3.0% 9.0% 14.2% 13.1%
EBIT 12.1 -0.3 -3.3 -2.2 -3.0 -8.9 -0.4 -0.1 1.6 -0.4 0.7 1.8 3.8 3.6EBIT margin 8.2% -0.8% -8.9% -6.3% -9.6% -6.1% -1.1% -0.2% 4.3% -1.1% 0.5% 6.0% 10.0% 10.4%
Q32019
Q12019
Q22019
Q12018
Q22018
adj.3)
Q32018
Q42018
FY2018
FY2016
Q12017
adj.2)
Q22017
adj.2)
Q32017
adj.2)
Q42017
adj.2)
FY2017
adj.2)in EUR m
Investor Presentation Q1-3 2019 I 19 December 2019 I Investor Relations

Semperform and Sempermed (adj. where applicable)
1) Values for 2016 restated, the business unit Sheeting was reclassified from segment Semperflex to segment Semperform2) Adj. for negative one-off effects in Q4 2016 and without profit contribution from SSC for FY 20163) Q1 2017 Sempermed adj. for positive one-off effects from JV transaction of € 78m for EBITDA. 4) Adj. for expenses resulting from tax audit in Austria, mainly for refund of energy supply charge (€ 2m for Semperform, € 2m for Sempermed)5) Q3 2019 adjusted for negative one-off effect of € 47m from impairment of Sempermed (adj. for EBIT) and € 4m (EBITDA, EBIT) due to release of provision in Sempermed for Brazilian court case for tax
liabilities.
31
Semperform (Window and door profiles, Handrails)
Revenue 173.1 45.3 50.1 46.9 42.7 185.0 47.5 50.7 50.3 43.7 192.2 49.9 50.5 47.8EBITDA 30.2 5.0 7.8 5.2 3.6 21.5 4.5 7.3 6.2 3.9 21.9 7.9 8.3 6.6EBITDA margin 17.4% 10.9% 15.5% 11.0% 8.5% 11.6% 9.6% 14.4% 12.2% 8.9% 11.4% 15.7% 16.4% 13.8%
EBIT 22.5 3.0 5.8 3.2 1.3 13.3 2.4 5.1 4.2 1.5 13.2 5.4 5.9 4.2EBIT margin 13.0% 6.6% 11.5% 6.8% 3.0% 7.2% 5.0% 10.1% 8.4% 3.4% 6.9% 10.9% 11.6% 8.7%
Q32019
Q12019
Q22019
Q12018
Q22018
Q32018
Q42018
FY2018
FY20161)
Q12017
Q22017
Q32017
adj.4)
Q42017
FY2017
adj.4)in EUR m
Sempermed (Gloves)
Revenue 346.0 89.2 92.2 78.8 76.9 337.1 80.0 77.1 80.4 73.9 311.5 71.5 76.4 78.2EBITDA 3.4 0.0 1.7 1.6 -1.5 1.8 1.4 -1.3 -0.9 -3.1 -3.9 -0.9 0.6 1.8EBITDA margin 1.0% ±0.0% 1.9% 2.0% -2.0% 0.5% 1.8% -1.7% -1.1% -4.2% -1.3% -1.2% 0.8% 2.3%
EBIT -10.1 -2.8 -1.2 -1.5 -6.7 -12.1 -2.2 -5.1 -3.9 -3.1 -14.3 -2.8 -1.4 -0.3EBIT margin -2.9% -3.1% -1.3% -1.8% -8.6% -3.6% -2.8% -6.6% -4.8% -4.2% -4.6% -3.9% -1.9% -0.4%
Q32019
adj.5)
Q12019
Q22019
FY2018
Q12018
Q22018adj.
Q32018
Q42018
FY2016
adj.2)
Q12017
adj.3)
Q22017
adj.3)
Q32017
adj.4)
Q42017
FY2017
adj.3) 4)in EUR m
Investor Presentation Q1-3 2019 I 19 December 2019 I Investor Relations

Key figures 2008-2018
1) 2011 restated (see Annual Report 2012, Notes 2.18), 2010 not restated. 2) Attributable to shareholders of Semperit AG Holding from ordinary shares, excluding interest from hybrid capital. 3) 2014 and 2015 restated. 4) 2016 without profit contribution from SSC / Thai glove JV, impairment Sempermed and trade tax / levies in Brazil. 5) 2017 adjusted for positive one-off effects from JV transaction of € 85m (€ 65m for net profit) and negative one-off effects from impairment at Sempermed (€ 26m adj. EBIT, EAT only), from restructuring expenses in France (€ 11m), valuation adjustment in IT (€ 4m EBITDA, € 3m EBIT) and expenses resulting from tax audit in Austria (€ 5m, mainly for refund of energy supply charge). 6) 2018 adjusted for negative one-off effects from closure of Sempertrans site in China (€ 4m for EBITDA, € 8m for EBIT and EAT) and for impairment of Sempermed of € 55m (adj. for EBIT and EAT only).
32
Key performance figures
in EUR m 2008 2009 20101) 20111) 2012 2013 20143) 20153) 2016 adj.4)
2017 adj.5)
2018 adj.6)
Revenue 655.3 588.1 689.4 820.0 828.6 906.3 858.3 914.7 852.4 874.2 878.5EBITDA 87.9 102.8 112.3 110.0 108.7 132.5 101.9 96.2 74.7 35.8 50.3EBITDA margin 13.4% 17.5% 16.3% 13.4% 13.1% 14.6% 11.9% 10.5% 8.8% 4.1% 5.7%EBIT 58.7 69.6 82.3 80.4 72.5 87.8 63.8 66.7 41.1 -0.8 15.4EBIT margin 9.0% 11.8% 11.9% 9.8% 8.8% 9.7% 7.4% 7.3% 4.8% -0.1% 1.7%Earnings after tax 44.9 38.8 45.4 51.8 46.2 54.9 37.8 46.4 15.2 -43.9 -17.3EPS2), in EUR 1.83 1.89 2.21 2.52 2.25 2.65 1.85 2.26 0.74 -2.13 -1.07Gross cash flow 78.0 92.6 91.0 89.4 85.6 116.2 89.9 55.7 48.1 32.2 37.4Return on equity 12.9% 12.5% 12.9% 13.6% 11.4% 13.3% 8.6% 12.8% 4.6% -15.8% -4.2%
Balance sheet key figures
in EUR m 2008 2009 20101) 20111) 2012 2013 20143) 20153) 2016 2017 2018
Balance sheet total 485.5 531.5 593.5 616.7 824.5 852.1 826.3 937.8 1034.5 853.2 768.8Equity2) 291.9 310.6 351.1 379.4 406.2 411.5 443.8 363.3 329.3 278.5 329.5Equity ratio 60.1% 58.4% 59.2% 61.5% 49.3% 48.3% 53.7% 38.7% 31.8% 32.6% 42.9%Investments in tangible and intangible assets
27.6 22.7 52.5 45.1 41.2 49.7 67.4 71.8 65.1 74.5 80.8
Employees, at balance sheet date, FTEs
7,064 6,649 7,019 8,025 9,577 10,276 6,888 7,053 6,974 6,838 6,773
Investor Presentation Q1-3 2019 I 19 December 2019 I Investor Relations

Overview price indices Butadiene
50
100
150
200
250
300
350
400
450
500
550Price indices Butadiene as main raw material for synthetic rubber / latex
Butadiene Europe Butadiene Korea
ø 2016
ø 2017ø 2018
Price movements for raw materials1) became highly unpredictable
1) Selected raw materials are shown for illustration purposes only. Indices based on 01/01/2016 = 100
33
ø YTD 2019
Investor Presentation Q1-3 2019 I 19 December 2019 I Investor Relations
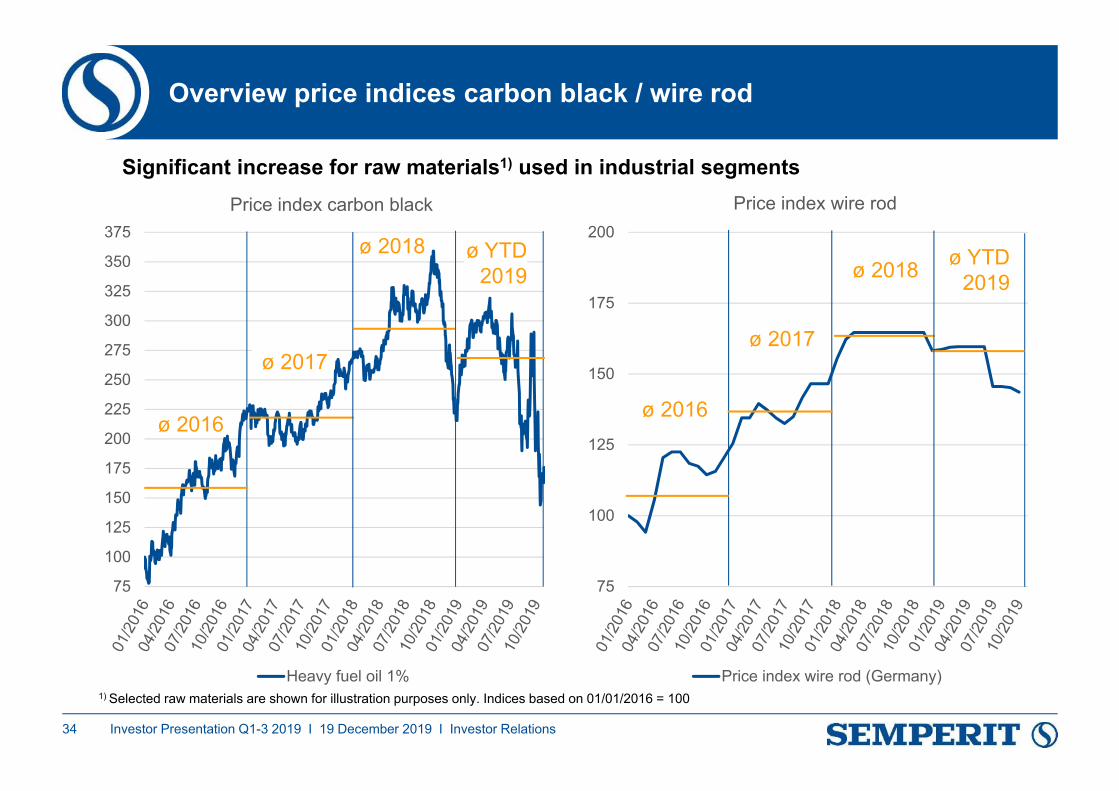
Overview price indices carbon black / wire rod
75
100
125
150
175
200
225
250
275
300
325
350
375Price index carbon black
Heavy fuel oil 1%
ø 2016
ø 2017
ø 2018
Significant increase for raw materials1) used in industrial segments
1) Selected raw materials are shown for illustration purposes only. Indices based on 01/01/2016 = 100
75
100
125
150
175
200
Price index wire rod
Price index wire rod (Germany)
ø 2016
ø 2017
ø 2018
34
ø YTD 2019
ø YTD 2019
Investor Presentation Q1-3 2019 I 19 December 2019 I Investor Relations

Product / market position / segment overview, FY 2018
Semperflex Sempertrans Semperform
Hydraulic hoses Conveyor belts Profiles / HandrailsProducts and market
position
Industrial Sector
Sempermed
Examination gloves
Among the top 10 glovemakers in the world
Leading position in Europe
Medical Sector
1) Revenue in % of Group revenue. 2) Group figure includes corporate center of € -21m, 140 employees. 3) Employees in % of Group employees.
Group
Semperit Group
€ 230m / 26%1)
€ 49m
1,776 / 27%3)
€ 145m / 17%1)
€ 4m
878 / 13%3)
€ 192m / 22%1)
€ 22m
1000 / 15%3)
€ 312m / 35%1)
€ -4m
2,979 / 44%3)
€ 878m
€ 50m2)
6,7732)
Industrial hoses Surgical gloves
Leading position in construction (profiles, piping, gaskets) and infrastructure (handrails, sheave liners, rail track) business with European focus
One of the leading providers for heavy duty steel and textile cord belts
# 3 position globally / leader in hose only
# 2 - 3 position in Europe
35
Revenue
EBITDA adj.
Employees

> 54%
< 46%
B & C Holding Österreich GmbH, Vienna, AustriaFree Float
Semperit is listed on the Vienna Stock Exchange since 1890
Total of 20,573,434 shares
B & C Holding Österreich GmbH is part of B & C Privatstiftung, an Austrian based private foundation / trust
Primary focus of B & C is pursuing the foundation’s mission to “foster Austrian entrepreneurship”
Semperit benefits from a supportive ownership structure with long-term commitment from B & C
Shareholder structure
Shareholder Structure
36 Investor Presentation Q1-3 2019 I 19 December 2019 I Investor Relations