Investment-Grade Looks Softer and High-Yield Looks Firmer … · metric, June 20’s composite...
28
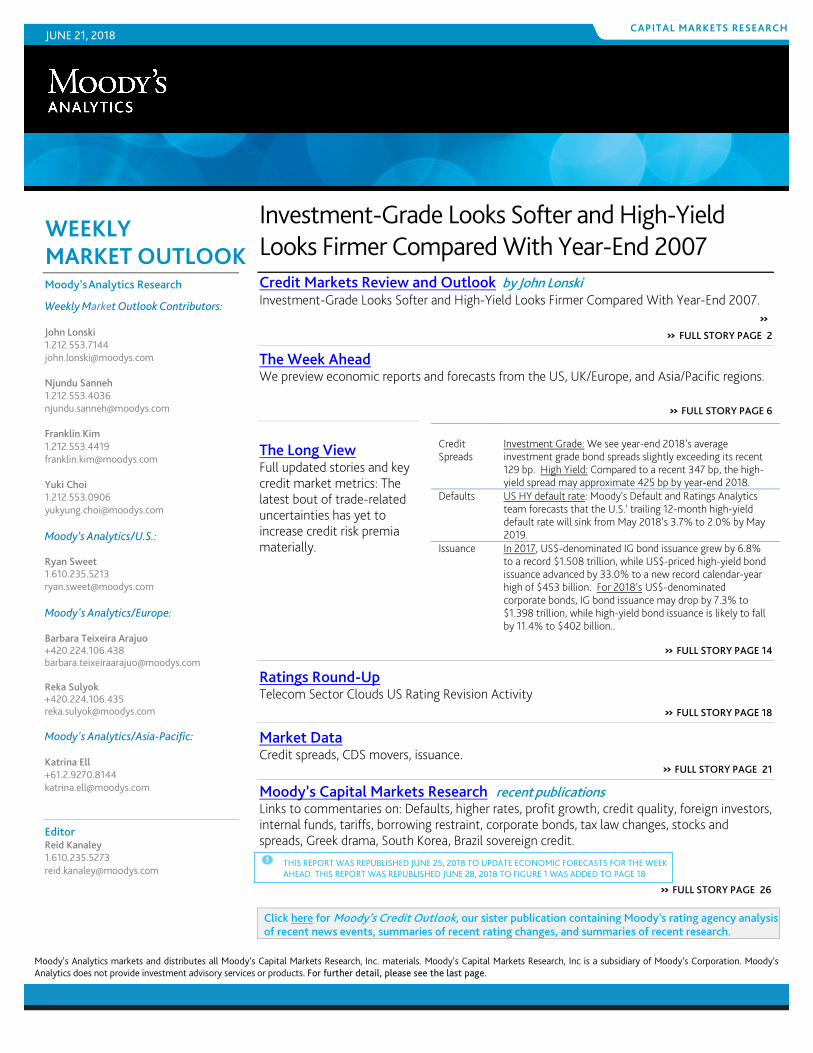
JUNE 21, 2018 CAPITAL MARKETS RESEARCH Moody’s Analytics markets and distributes all Moody’s Capital Markets Research, Inc. materials. Moody’s Capital Markets Research, Inc is a subsidiary of Moody’s Corporation. Moody’s Analytics does not provide investment advisory services or products. For further detail, please see the last page. Investment-Grade Looks Softer and High-Yield Looks Firmer Compared With Year-End 2007 Credit Markets Review and Outlook by John Lonski Investment-Grade Looks Softer and High-Yield Looks Firmer Compared With Year-End 2007. » » FULL STORY PAGE 2 The Week Ahead We preview economic reports and forecasts from the US, UK/Europe, and Asia/Pacific regions. » FULL STORY PAGE 6 The Long View Full updated stories and key credit market metrics: The latest bout of trade-related uncertainties has yet to increase credit risk premia materially. » FULL STORY PAGE 14 Ratings Round-Up Telecom Sector Clouds US Rating Revision Activity » FULL STORY PAGE 18 Market Data Credit spreads, CDS movers, issuance. » FULL STORY PAGE 21 Moody’s Capital Markets Research recent publications Links to commentaries on: Defaults, higher rates, profit growth, credit quality, foreign investors, internal funds, tariffs, borrowing restraint, corporate bonds, tax law changes, stocks and spreads, Greek drama, South Korea, Brazil sovereign credit. THIS REPORT WAS REPUBLISHED JUNE 25, 2018 TO UPDATE ECONOMIC FORECASTS FOR THE WEEK AHEAD. THIS REPORT WAS REPUBLISHED JUNE 28, 2018 TO FIGURE 1 WAS ADDED TO PAGE 18 » FULL STORY PAGE 26 Credit Spreads Investment Grade: We see year-end 2018’s average investment grade bond spreads slightly exceeding its recent 129 bp. High Yield: Compared to a recent 347 bp, the high- yield spread may approximate 425 bp by year-end 2018. Defaults US HY default rate: Moody's Default and Ratings Analytics team forecasts that the U.S.' trailing 12-month high-yield default rate will sink from May 2018’s 3.7% to 2.0% by May 2019. Issuance In 2017, US$-denominated IG bond issuance grew by 6.8% to a record $1.508 trillion, while US$-priced high-yield bond issuance advanced by 33.0% to a new record calendar-year high of $453 billion. For 2018’s US$-denominated corporate bonds, IG bond issuance may drop by 7.3% to $1.398 trillion, while high-yield bond issuance is likely to fall by 11.4% to $402 billion.. Click here for Moody’s Credit Outlook, our sister publication containing Moody’s rating agency analysis of recent news events, summaries of recent rating changes, and summaries of recent research. Moody’s Analytics Research Weekly Market Outlook Contributors: John Lonski 1.212.553.7144 [email protected] Njundu Sanneh 1.212.553.4036 [email protected] Franklin Kim 1.212.553.4419 [email protected] Yuki Choi 1.212.553.0906 [email protected] Moody’s Analytics/U.S.: Ryan Sweet 1.610.235.5213 [email protected] Moody's Analytics/Europe: Barbara Teixeira Arajuo +420.224.106.438 [email protected] Reka Sulyok +420.224.106.435 [email protected] Moody's Analytics/Asia-Pacific: Katrina Ell +61.2.9270.8144 [email protected] Editor Reid Kanaley 1.610.235.5273 [email protected]
Transcript of Investment-Grade Looks Softer and High-Yield Looks Firmer … · metric, June 20’s composite...
WEEKLY MARKET OUTLOOK
JUNE 21, 2018
CAPITAL MARKETS RESEARCH
Moody’s Analytics markets and distributes all Moody’s Capital Markets Research, Inc. materials. Moody’s Capital Markets Research, Inc is a subsidiary of Moody’s Corporation. Moody’s Analytics does not provide investment advisory services or products. For further detail, please see the last page.
Investment-Grade Looks Softer and High-Yield Looks Firmer Compared With Year-End 2007
Credit Markets Review and Outlook by John Lonski Investment-Grade Looks Softer and High-Yield Looks Firmer Compared With Year-End 2007.
» » FULL STORY PAGE 2
The Week Ahead We preview economic reports and forecasts from the US, UK/Europe, and Asia/Pacific regions.
» FULL STORY PAGE 6
The Long View Full updated stories and key credit market metrics: The latest bout of trade-related uncertainties has yet to increase credit risk premia materially.
» FULL STORY PAGE 14
Ratings Round-Up Telecom Sector Clouds US Rating Revision Activity
» FULL STORY PAGE 18
Market Data Credit spreads, CDS movers, issuance.
» FULL STORY PAGE 21
Moody’s Capital Markets Research recent publications Links to commentaries on: Defaults, higher rates, profit growth, credit quality, foreign investors, internal funds, tariffs, borrowing restraint, corporate bonds, tax law changes, stocks and spreads, Greek drama, South Korea, Brazil sovereign credit.
THIS REPORT WAS REPUBLISHED JUNE 25, 2018 TO UPDATE ECONOMIC FORECASTS FOR THE WEEK AHEAD. THIS REPORT WAS REPUBLISHED JUNE 28, 2018 TO FIGURE 1 WAS ADDED TO PAGE 18
» FULL STORY PAGE 26
Credit Spreads
Investment Grade: We see year-end 2018’s average investment grade bond spreads slightly exceeding its recent 129 bp. High Yield: Compared to a recent 347 bp, the high-yield spread may approximate 425 bp by year-end 2018.
Defaults US HY default rate: Moody's Default and Ratings Analytics team forecasts that the U.S.' trailing 12-month high-yield default rate will sink from May 2018’s 3.7% to 2.0% by May 2019.
Issuance In 2017, US$-denominated IG bond issuance grew by 6.8% to a record $1.508 trillion, while US$-priced high-yield bond issuance advanced by 33.0% to a new record calendar-year high of $453 billion. For 2018’s US$-denominated corporate bonds, IG bond issuance may drop by 7.3% to $1.398 trillion, while high-yield bond issuance is likely to fall by 11.4% to $402 billion..
Click here for Moody’s Credit Outlook, our sister publication containing Moody’s rating agency analysis of recent news events, summaries of recent rating changes, and summaries of recent research.
Moody’s Analytics Research
Weekly Market Outlook Contributors: John Lonski 1.212.553.7144 [email protected] Njundu Sanneh 1.212.553.4036 [email protected] Franklin Kim 1.212.553.4419 [email protected] Yuki Choi 1.212.553.0906 [email protected] Moody’s Analytics/U.S.: Ryan Sweet 1.610.235.5213 [email protected] Moody's Analytics/Europe: Barbara Teixeira Arajuo +420.224.106.438 [email protected] Reka Sulyok +420.224.106.435 [email protected] Moody's Analytics/Asia-Pacific: Katrina Ell +61.2.9270.8144 [email protected]
Editor Reid Kanaley 1.610.235.5273 [email protected]
CAPITAL MARKETS RESEARCH
2 JUNE 21, 2018 CAPITAL MARKETS RESEARCH / MARKET OUTLOOK / MOODYS.COM
Credit Markets Review and Outlook
Credit Markets Review and Outlook By John Lonski, Chief Economist, Moody’s Capital Markets Research, Inc.
Investment-Grade Looks Softer and High-Yield Looks Firmer Compared With Year-End 2007
Since June 14’s close, or immediately prior to the latest bout of trade-related stress, the cumulative 0.8% decline by the market value of US common stock has been shallower than the accompanying 2.7% drop by the blue-chip Dow Jones Industrial Average. By comparison, China’s Shanghai Composite stock price index incurred a much deeper setback of 5.5%.
The latest installment of trade friction has yet to roil all financial markets. The recent VIX of 14.2 points remained well below its long-term median of 15.9 points notwithstanding heightened financial market volatility.
In addition, the Moody’s average expected default frequency (EDF) metric for US/Canadian high-yield issuers—an estimate of the high-yield market’s default risk—dipped from June 14’s 2.28% to June 20’s 2.10%. The average high-yield EDF now trails each of its previous month-long averages going back to the 2.07% of August 2014, which also serves as the metric’s bottom for the current upturn.
Despite heightened worry surrounding a possible trade war and reflecting a still very low high-yield EDF metric, June 20’s composite high-yield spread of 347 bp hardly differed from the 345 bp of June 14. Moreover, Barclays Capital’s 148 bp Baa corporate bond yield spread of June 18 barely rose from June 14’s 144 bp.
Medium-Grade Dominates Dollar Amount of Corporate Bonds Outstanding Approximately 60% of the number of rated issuers are graded speculative. However, in terms of the dollar amount of outstanding US corporate bonds, medium-grade’s 56% share tops both high-grade’s 27% and high-yield’s 17%. The wide gap between the share of the number of issuers rated speculative-grade and the share of the amount outstanding corporate bonds graded speculative brings attention to the comparatively small size of many high-yield companies. Even after adding the high-yield group’s estimated $1.45 trillion of outstanding loans to high-yield bonds outstanding, this expanded version of high-yield debt would approximate only 37% of the total outstandings of US corporate bonds.
The far majority of unrated companies are below-investment-grade with or without a formal credit rating. Thus, little more than an increase in the number of rated businesses will necessarily increase the percent of rated companies graded speculative. In turn, the rise in the share of the number of rated businesses graded speculative since 2007 may largely be the offshoot of a higher percentage of outstanding businesses receiving a credit rating, as opposed to being the byproduct of a sharp increase in the number of fallen-angel downgrades from investment- to speculative-grade.
Since June 2009’s end to the Great Recession, the outstandings of medium-grade US corporate bonds (rated either A3 or Baa) advanced at an average annualized pace of 10% to the record $4.049 trillion of 2018’s first quarter. The same serial comparison has high-grade corporate bonds (rated A2 or higher) shrinking by 2.6% annualized, on average, to $1.943 trillion, and high-yield bonds rising by 2.8% annualized to $1.267 trillion. In fact, high-yield’s share of the amount of outstanding US corporate bonds has dipped from the 18% of 2007’s final quarter to the 17% of 2018’s first quarter.
First quarter 2018’s year-to-year percent changes were up 9.7% to $4.049 trillion for medium-grade, up 5% to $1.943 trillion for high-grade, and down 1.5% to $1.267 trillion for high-yield.

CAPITAL MARKETS RESEARCH
3 JUNE 21, 2018 CAPITAL MARKETS RESEARCH / MARKET OUTLOOK / MOODYS.COM
Credit Markets Review and Outlook
89Q4 91Q2 92Q4 94Q2 95Q4 97Q2 98Q4 00Q2 01Q4 03Q2 04Q4 06Q2 07Q4 09Q2 10Q4 12Q2 13Q4 15Q2 16Q4 18Q2$100$350$600$850
$1,100$1,350$1,600$1,850$2,100$2,350$2,600$2,850$3,100$3,350$3,600$3,850$4,100
High Grade: [A2-Aaa] Medium Grade: [Baa3-A3] High-Yield: [C-Ba1]
Figure 1: Medium-Grade's Share of Rated US Corporate Bonds Outstanding Jumps Up From 31% of 1996-2005 to Q1-2018's 56% $ billions (excludes private ABS and MBS)source: Moody's Analytics
Outstandings of Investment-Grade Bonds Show Single-A Catching Up With Baa The current business cycle upturn’s 4.2% average annualized increase by the outstandings of US investment-grade corporate bonds to the $5.992 trillion of 2018’s first quarter differed considerably across the broad rating categories. Unlike the 5.5% average annualized contraction for the outstandings of bonds graded either Aaa or Aa to $628 billion, single-A rated bonds rose by 3.1% annually to $2.666 trillion, while Baa-grade obligations advanced by 10.5% to $2.697 trillion.
Moreover, the latest year-to-year percent changes show yet another setback of 0.7% for the Aaa/Aa category, as the growth of single-A outstandings quickened to 13.1%, while the growth of the Baa group slowed to 5.7%. Though first-quarter 2018’s 8.1% yearly increase by the outstandings of investment-grade corporate bonds differed considerably from the 1.5% contraction of high-yield outstandings, the outstanding loans of US high-yield issuers probably again grew faster than 10% year-to-year.
$100
$350
$600
$850
$1,100
$1,350
$1,600
$1,850
$2,100
$2,350
$2,600
89Q4 91Q2 92Q4 94Q2 95Q4 97Q2 98Q4 00Q2 01Q4 03Q2 04Q4 06Q2 07Q4 09Q2 10Q4 12Q2 13Q4 15Q2 16Q4 18Q2
Aaa & Aa Single-A Baa
Figure 2: Current Upturn's Average Annual Growth Rates for Outstanding US Investment-Grade Corporate Bonds Are -5.5% for Aaa/Aa, 3.1% for Single-A, and 10.5% for Baaoutstandings in $ billions (excludes ABS and MBS)source: Moody's Analytics

CAPITAL MARKETS RESEARCH
4 JUNE 21, 2018 CAPITAL MARKETS RESEARCH / MARKET OUTLOOK / MOODYS.COM
Credit Markets Review and Outlook
$640 Billion of Outstanding Baa3 Corporates Now Tops $628 Billion of Aaa/Aa Grade Bonds The lowest rung of the investment-grade credit ratings ladder is labeled Baa3. On average, only 0.28% of issuers rated Baa3 over the next 12 months. However, 2.28% of Baa3-grade issuers default over the next five years, on average. Also, issuers rated Baa3 have the greatest vulnerability to a fallen-angel downgrade that lowers an issuer rating from investment- to speculative-grade, where the latter is also referred to as high-yield. On average, 10% of Baa3-rated issuers are downgraded to Ba1 (the highest speculative-grade rating category) over a yearlong span. By contrast, a smaller 6.5%, on average, are upgraded to Baa2—the next highest investment-grade rating category.
Prior to 2008-2009’s financial crisis, the outstandings of US corporate bonds rated Baa3 peaked at the $295 billion 2007’s third quarter and had barely dipped to $294 billion as of 2007’s final quarter. More recently, after cresting the record high $670 billion of 2017’s second quarter, the outstandings of Baa3-grade corporate bonds has since eased to the $640 billion of 2018’s first quarter. In view of how most companies wish to avoid a fallen-angel downgrade and given the age of the current business cycle upturn, companies having a Baa3 bond rating might opt for relatively conservative financial management. Such companies might be expected to proceed cautiously with capital spending, employee compensation, acquisitions, stock buybacks, and dividends.
0
1
$0
$75
$150
$225
$300
$375
$450
$525
$600
$675
87Q4 89Q4 91Q4 93Q4 95Q4 97Q4 99Q4 01Q4 03Q4 05Q4 07Q4 09Q4 11Q4 13Q4 15Q4 17Q4
Recessions are shaded Baa3 US Corporate Bonds Outstanding: $ billions
Figure 3: Outstandings of Baa3-Rated Corporate Bonds Drop from Q2-2017's Zenith,but Double Q4-2007's Mark sources: BEA, Moody's Analytics
High-Yield Outstandings Have Yet to Mimic Behavior Prior to Great Recession The modest 2.8% average annualized rise by the outstandings of US high-yield corporate bonds for the current upturn to date has been led by the 7.3% increase of bonds graded either Ba3, B1 or B2 to $495 billion followed by the 4.9% growth of Ba1/Ba2 rated bonds to $401 billion. Lagging far behind was the 1.6% average annual rise by the riskier B3/Caa segment of the high-yield bond market to $361 billion. First-quarter 2018’s year-to-year percent changes showed a 9.6% advance for the Ba1/Ba2 group, as well as declines of 7.1% for bonds rated Ba3, B1 or B2 and 2.3% for the B3/Caa segment.
By contrast both the ratings distribution of outstanding high-yield corporate bonds and the accompanying percent changes were far more ominous prior to the start of the Great Recession. For example, the outstandings of 2007’s final quarter showed the least risky Ba1/Ba2 slice of the high-yield market plunging by 34.2% annually to $165 billion. At the other extreme, the high-risk bonds rated either B3 or Caa soared higher by 27% annually to $316 billion. Meanwhile, the high-yield bond market’s midsection carrying either a Ba3, B1, or B2 rating advanced by 21.4% annually to $414 billion.

CAPITAL MARKETS RESEARCH
5 JUNE 21, 2018 CAPITAL MARKETS RESEARCH / MARKET OUTLOOK / MOODYS.COM
Credit Markets Review and Outlook
89Q4 91Q2 92Q4 94Q2 95Q4 97Q2 98Q4 00Q2 01Q4 03Q2 04Q4 06Q2 07Q4 09Q2 10Q4 12Q2 13Q4 15Q2 16Q4 18Q2$0
$50
$100
$150
$200
$250
$300
$350
$400
$450
$500
$550
$600Ba1 & Ba2 Ba3 & B1 & B2 B3 & Caa
Figure 4: Current Recovery's Average Annual Growth Rates for Outstandings of US High-Yield Corporate Bonds Are 4.9% for Ba1/Ba2, 7.3% for Ba3/B1/B2 , and 1.6% for B3/Caaoutstandings in $ billions (excludes ABS and MBS)source: Moody's Analytics
Bonds Outstanding From Financial Institutions Lag Behind Those From Nonfinancial Corporations First-quarter 2018’s $9.074 trillion of outstanding taxable US corporate bonds consisted of $5.426 trillion of obligations from nonfinancial companies and $3.648 trillion of bonds from financial institutions. The latest estimate of financial-institution bonds was led by the $1.433 trillion from holding companies, followed by the $772 billion from finance companies and the $445 billion from real estate investment trusts (REITs). All of the tallies exclude private ABS and MBS bonds, which approximated $1.157 trillion during 2018’s first-quarter.
The average annual growth rate for outstanding US corporate bonds slowed from the 5.5% of 2002-2007’s business cycle upturn to the 4.7% of the current upturn to date. However, the deceleration was far from uniform. Unlike the pronounced slowing by the average annual growth rate of outstanding financial company bonds from the previous recovery’s ultimately destabilizing 11.3% to the current upturn’s 2.6%, the average annual increase of nonfinancial-corporate bonds outstanding quickened from 1.8% to 6.4%, respectively. Among financial institutions, average annual growth rates for outstanding bonds slowed from 2002-2007’s 15.1% to 2% since June 2009 for holding companies and from 22.3% to 13.4%, respectively, for REITs. Meanwhile, after expanding by 9.3% annually, on average, during 2002-2007, the outstandings of finance company bonds have shrunk by 1.2% annualized since June 2009.
For the year-ended March 2018, the 3.7% annual rise by US corporate bonds outstanding was the offshoot of a 4.3% increase for nonfinancial corporations and a 2.9% gain for financial institutions. The overall growth rate hardly budged from the 3.6% rise of the year-ended March 2017, or when nonfinancial-corporate bonds grew by a faster 5.2% and financial institution bonds edged up by 1.4%.
After climbing up from 26% at the end of 1983-1990’s recovery to 34% at the end of the 1991-2000 upturn, financial institutions’ share of outstanding US corporate bonds soared to 46% prior to the start of the Great Recession. As of 2018’s first quarter, financial institutions supplied a still historically large 40% of outstanding US corporate bonds.
The $5.992 trillion of outstanding US corporate bonds rated investment-grade by Moody’s Investors Service approximated 66% of first-quarter 2018’s $9.074 trillion of outstanding US corporate bonds. That share is up from fourth-quarter 2015’s current cycle low of 58%, but well under the record high 81% of 2007’s second quarter. The latter had been skewed higher by the heavy net bond issuance of mostly investment-grade financial institutions. Ultimately, the credit ratings of many investment-grade financial companies would be lowered.

The Week Ahead
CAPITAL MARKETS RESEARCH
6 JUNE 21, 2018 CAPITAL MARKETS RESEARCH / MARKET OUTLOOK / MOODYS.COM
The Week Ahead – U.S., Europe, Asia-Pacific
THE U.S. By Ryan Sweet of Moody’s Analytics
Trade Rhetoric Echoes in Financial Markets Trade will dominate the headlines as the deadlines for implementing U.S. tariffs on some imported China goods draw closer. Rhetoric could remain heated and will remain a focus of financial markets. The U.S. economic calendar is busier than last week. We look for a small improvement in new-home sales, but overall the recent housing data have been disappointing. Durable goods orders likely fell, but the weakness should be isolated to transportation. There will likely be a small downward revision to first quarter GDP growth. For the Fed, the key will be the May core PCE deflator. We think that the core PCE deflator increased 0.18%, raising year-over-year growth from 1.8% to 1.9%.
MONDAY, JUNE 25
Business confidence (week ended June 22; 10:00 a.m. EDT) Forecast: N/A Global business sentiment is upbeat. Businesses remain most optimistic about equipment investment, the availability of credit, and the demand for office space. Sales are also solid. U.S. businesses continue to feel the best, likely buoyed by corporate tax cuts, while South American businesses are the least optimistic. Any softness in the survey is largely in regard to expectations about business prospects towards the end of the year. This may be due to building concerns around the Trump administration’s trade policies. Businesses’ biggest concern is around regulatory and legal issues, although it is receding with about one-third of respondents saying the issues are their greatest worry. Worries about the cost and availability of labor are on the rise and are now the top concerns of nearly one-fourth of respondents. The four-week moving average in our global business sentiment survey was little changed, at 36.5 in the week ended June 15.
New-home sales (May; 10:00 a.m. EDT) Forecast: 670,000 annualized units We look for new-home sales to have risen from 662,000 annualize units in April to 670,000 in May. This would put new-home sales above their first quarter average of 655,000 annualized units. The housing-related data have been mixed, but the small gain in new-home sales in May would put them at the high end of the range recently.
The Week Ahead
CAPITAL MARKETS RESEARCH
7 JUNE 21, 2018 CAPITAL MARKETS RESEARCH / MARKET OUTLOOK / MOODYS.COM
TUESDAY, JUNE 26
Consumer confidence (June; 10:00 a.m. EDT) Forecast: We will release our forecast on Monday.
WEDNESDAY, JUNE 27
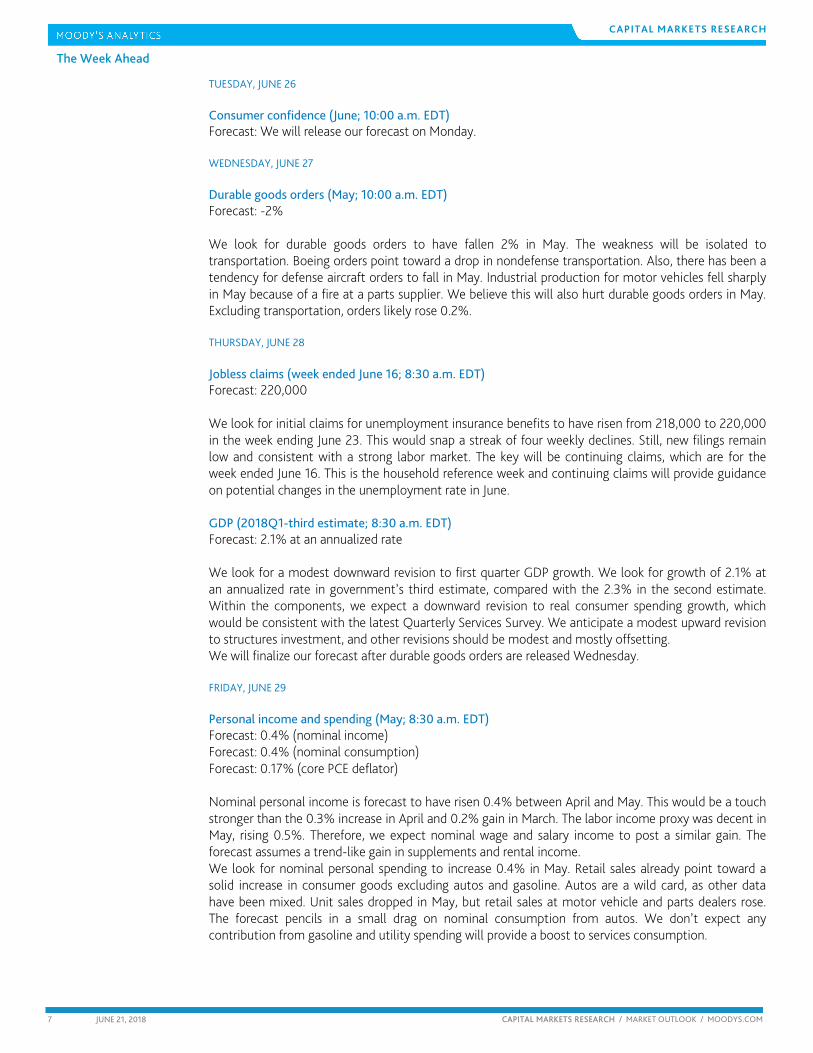
Durable goods orders (May; 10:00 a.m. EDT) Forecast: -2% We look for durable goods orders to have fallen 2% in May. The weakness will be isolated to transportation. Boeing orders point toward a drop in nondefense transportation. Also, there has been a tendency for defense aircraft orders to fall in May. Industrial production for motor vehicles fell sharply in May because of a fire at a parts supplier. We believe this will also hurt durable goods orders in May. Excluding transportation, orders likely rose 0.2%.
THURSDAY, JUNE 28
Jobless claims (week ended June 16; 8:30 a.m. EDT) Forecast: 220,000 We look for initial claims for unemployment insurance benefits to have risen from 218,000 to 220,000 in the week ending June 23. This would snap a streak of four weekly declines. Still, new filings remain low and consistent with a strong labor market. The key will be continuing claims, which are for the week ended June 16. This is the household reference week and continuing claims will provide guidance on potential changes in the unemployment rate in June.
GDP (2018Q1-third estimate; 8:30 a.m. EDT) Forecast: 2.1% at an annualized rate We look for a modest downward revision to first quarter GDP growth. We look for growth of 2.1% at an annualized rate in government’s third estimate, compared with the 2.3% in the second estimate. Within the components, we expect a downward revision to real consumer spending growth, which would be consistent with the latest Quarterly Services Survey. We anticipate a modest upward revision to structures investment, and other revisions should be modest and mostly offsetting. We will finalize our forecast after durable goods orders are released Wednesday.
FRIDAY, JUNE 29
Personal income and spending (May; 8:30 a.m. EDT) Forecast: 0.4% (nominal income) Forecast: 0.4% (nominal consumption) Forecast: 0.17% (core PCE deflator) Nominal personal income is forecast to have risen 0.4% between April and May. This would be a touch stronger than the 0.3% increase in April and 0.2% gain in March. The labor income proxy was decent in May, rising 0.5%. Therefore, we expect nominal wage and salary income to post a similar gain. The forecast assumes a trend-like gain in supplements and rental income. We look for nominal personal spending to increase 0.4% in May. Retail sales already point toward a solid increase in consumer goods excluding autos and gasoline. Autos are a wild card, as other data have been mixed. Unit sales dropped in May, but retail sales at motor vehicle and parts dealers rose. The forecast pencils in a small drag on nominal consumption from autos. We don’t expect any contribution from gasoline and utility spending will provide a boost to services consumption.

The Week Ahead
CAPITAL MARKETS RESEARCH
8 JUNE 21, 2018 CAPITAL MARKETS RESEARCH / MARKET OUTLOOK / MOODYS.COM
We think that the core PCE deflator increased 0.18% in May, raising year-over-year growth from 1.8% to 1.9%.
EUROPE By Barbara Teixeira Arajuo of the Europe staff of Moody’s Analytics in London and Prague
Energy Prices Are Boosting Euro Zone Inflation The week ahead will bring preliminary euro zone CPI figures for June, and we are confident they will show that inflation in the currency area remained steady at 1.9% at the end of the second quarter, after having jumped by 0.7 percentage point in May. A further rise in energy prices is likely to have offset a small correction in services inflation, while risks are tilted to the upside because core goods inflation likely gained some ground too. The rise in energy inflation will remain a key feature of the CPI report over the next few months. The price of a Brent barrel has soared since March and is now reading in euro terms around 54% higher than in June 2017, compared with 43% in May, which should help push energy inflation up to as much as 7.5% at the end of the quarter, from 6.1% in May. Base effects will ensure that the sector’s contribution to inflation remains high in July and August, and this should help push the CPI headline to just over 2% at the start of the third quarter.
The contribution to the headline of the other components of noncore inflation will remain elevated as well. First, alcohol and tobacco inflation surged in March because of the tax hike in France, and should remain elevated until base effects kick in next year. Second, food inflation is also supposed to rise slightly over the next few months, in line with the recent rise in food producer prices, even if a small decline in June is warranted following May’s jump.
Regarding core inflation, we are penciling in a small correction in services inflation following the Easter-related jump in airfares, accommodation and package holiday prices in May. We expect the gauge to edge back to 1.4%, after it jumped by 0.6 percentage point to 1.6% in May. We look for core goods inflation to accelerate too, likely to 0.4% from 0.3% previously. Weakness in nonindustrial goods inflation has been a main theme in the latest CPI releases, and the sector’s inflation rate remains well below trend. The main reasons for the disappointing figures have been persistent deflation in healthcare goods in France, and drops in clothing and shoe prices in most major countries. Our view is that a lagged effect from the stronger euro last year could be depressing durables and semidurables prices, though we are still penciling in a recovery in coming months.
We have long advocated that the trend in the euro zone’s inflation rate is to the upside this year. First, we expect that the headline will jump past the European Central Bank’s 2% target by summer, provided that oil prices hold at their current levels of around $75 per Brent barrel. And the rise in oil prices will support not only energy inflation but also the core rate, since transportation prices are sensitive to the price of fuel. Elsewhere in the core, we expect that the tight labour market combined with the ongoing recovery will help gradually lift services inflation to around 1.8% at the end of the year. Core goods inflation will also accelerate, notably now that the euro depreciated and is now reading around 4% higher against the dollar in year-ago terms, down from an average of 15% at the start of the year.
We thus maintain our forecast that inflation pressures will continue to pick up this year, with the core rate reaching 1.4% by year’s end. This will allow for the ECB to carry on with its plan of ending its asset-purchase programme in December—the ECB will reduce its monthly purchases from €30 billion to €15 billion from October, and end them in December. The bank’s new enhanced forward guidance suggests that rates won’t be raised until the third quarter of next year, and we are penciling in only a small increase in the deposit rate in the fourth quarter of 2019.

The Week Ahead
CAPITAL MARKETS RESEARCH
9 JUNE 21, 2018 CAPITAL MARKETS RESEARCH / MARKET OUTLOOK / MOODYS.COM
Key indicators Units Moody's Analytics Last
Wed @ 5:00 p.m. France: Job Seekers for May mil, SA 3.43 3.43
Thur @ 8:00 a.m. Spain: Retail Sales for May % change 0.2 -0.3
Thur @ 10:00 a.m. Euro Zone: Business and Consumer Sentiment for June index 112.2 112.5
Fri @ 12:05 a.m. U.K.: Consumer Confidence for June index -7.0 -7.0
Fri @ 7:45 a.m. France: Household Consumption Survey for May % change 1.8 -1.5
Fri @ 8:00 a.m. Germany: Retail Sales for May % change -0.2 2.3
Fri @ 9:00 a.m. Germany: Unemployment for June % 5.2 5.2
Fri @ 9:30 a.m. U.K.: GDP Expenditure Breakdown for Q1 % change 0.1 0.4
Fri @ 10:00 a.m. Euro Zone: Preliminary Consumer Price Index for May % change 1.9 1.9
MONDAY, JUNE 25 No major economic indicators are scheduled for release.
TUESDAY, JUNE 26 No major economic indicators are scheduled for release.
WEDNESDAY, JUNE 27
France: Job Seekers (May; 5:00 p.m. BST) Although weaker economic growth at the start of the year is adding some friction to France’s labour market, it is still moving in the right direction. We expect the number of job seekers held relatively steady at 3.43 million in May after the slight uptick in April. Weaker business confidence and a slowdown in manufacturing have been limiting monthly declines, but the number of job seekers is still sliding notably on a year-ago basis. Ongoing reforms will likely continue to boost the nation’s relatively rigid labour market and send the unemployment rate lower this year following the unexpected uptick in the first quarter.
THURSDAY, JUNE 28
Spain: Retail Sales (May; 8:00 a.m. BST) Spain's seasonally adjusted retail sales likely bounced back by 0.2% m/m in May, partially reversing the 0.3% drop from the previous month. Consumer confidence strengthened in May to 0.5 point from -0.7 previously. Yet, with rising oil prices, that boost is unlikely to translate into an acceleration in the near future. Empirical evidence also shows that consumption is more responsive to job creation than to the rise in real wages: Last year, retail performance was supported by a stellar labour absorption even though pay gains were lagging. Projecting more incremental gains in employment, retail should pull back this year.
FRIDAY, JUNE 29
France: Household Consumption Survey (May; 7:45 a.m. BST) French household expenditure on goods likely rose by 1.8% m/m in May, fully reversing the 1.5% decline in April. This should have pushed the yearly rate up to 1%, following a meagre 0.2% rise previously, though it should remain slightly below the 1.4% average increase for the previous year. Driving the headline the most was likely a jump in nonfood spending following an unexpected decline in April, though food spending is expected to have increased and the Easter boost to food products corrected. Elsewhere, energy production is expected to have recovered following a weather-related plunge in April, though the rise won’t fully offset April’s 5.4%. That’s because temperatures in May remained as much as 2 °C above their seasonal norms over the month, following 2.7 °C in April, keeping demand for heating depressed. The flip side is that the warm weather likely boosted footfall demand for clothing.
The Week Ahead
CAPITAL MARKETS RESEARCH
10 JUNE 21, 2018 CAPITAL MARKETS RESEARCH / MARKET OUTLOOK / MOODYS.COM
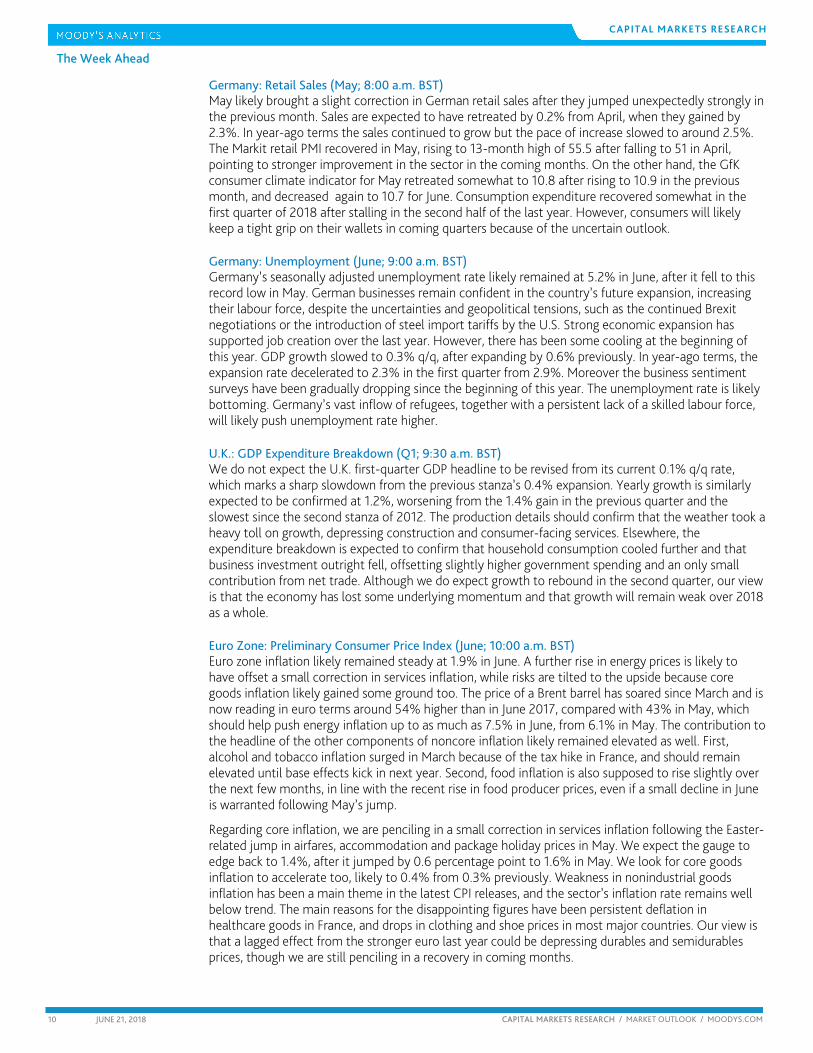
Germany: Retail Sales (May; 8:00 a.m. BST) May likely brought a slight correction in German retail sales after they jumped unexpectedly strongly in the previous month. Sales are expected to have retreated by 0.2% from April, when they gained by 2.3%. In year-ago terms the sales continued to grow but the pace of increase slowed to around 2.5%. The Markit retail PMI recovered in May, rising to 13-month high of 55.5 after falling to 51 in April, pointing to stronger improvement in the sector in the coming months. On the other hand, the GfK consumer climate indicator for May retreated somewhat to 10.8 after rising to 10.9 in the previous month, and decreased again to 10.7 for June. Consumption expenditure recovered somewhat in the first quarter of 2018 after stalling in the second half of the last year. However, consumers will likely keep a tight grip on their wallets in coming quarters because of the uncertain outlook.
Germany: Unemployment (June; 9:00 a.m. BST) Germany’s seasonally adjusted unemployment rate likely remained at 5.2% in June, after it fell to this record low in May. German businesses remain confident in the country’s future expansion, increasing their labour force, despite the uncertainties and geopolitical tensions, such as the continued Brexit negotiations or the introduction of steel import tariffs by the U.S. Strong economic expansion has supported job creation over the last year. However, there has been some cooling at the beginning of this year. GDP growth slowed to 0.3% q/q, after expanding by 0.6% previously. In year-ago terms, the expansion rate decelerated to 2.3% in the first quarter from 2.9%. Moreover the business sentiment surveys have been gradually dropping since the beginning of this year. The unemployment rate is likely bottoming. Germany’s vast inflow of refugees, together with a persistent lack of a skilled labour force, will likely push unemployment rate higher.
U.K.: GDP Expenditure Breakdown (Q1; 9:30 a.m. BST) We do not expect the U.K. first-quarter GDP headline to be revised from its current 0.1% q/q rate, which marks a sharp slowdown from the previous stanza’s 0.4% expansion. Yearly growth is similarly expected to be confirmed at 1.2%, worsening from the 1.4% gain in the previous quarter and the slowest since the second stanza of 2012. The production details should confirm that the weather took a heavy toll on growth, depressing construction and consumer-facing services. Elsewhere, the expenditure breakdown is expected to confirm that household consumption cooled further and that business investment outright fell, offsetting slightly higher government spending and an only small contribution from net trade. Although we do expect growth to rebound in the second quarter, our view is that the economy has lost some underlying momentum and that growth will remain weak over 2018 as a whole.
Euro Zone: Preliminary Consumer Price Index (June; 10:00 a.m. BST) Euro zone inflation likely remained steady at 1.9% in June. A further rise in energy prices is likely to have offset a small correction in services inflation, while risks are tilted to the upside because core goods inflation likely gained some ground too. The price of a Brent barrel has soared since March and is now reading in euro terms around 54% higher than in June 2017, compared with 43% in May, which should help push energy inflation up to as much as 7.5% in June, from 6.1% in May. The contribution to the headline of the other components of noncore inflation likely remained elevated as well. First, alcohol and tobacco inflation surged in March because of the tax hike in France, and should remain elevated until base effects kick in next year. Second, food inflation is also supposed to rise slightly over the next few months, in line with the recent rise in food producer prices, even if a small decline in June is warranted following May’s jump.
Regarding core inflation, we are penciling in a small correction in services inflation following the Easter-related jump in airfares, accommodation and package holiday prices in May. We expect the gauge to edge back to 1.4%, after it jumped by 0.6 percentage point to 1.6% in May. We look for core goods inflation to accelerate too, likely to 0.4% from 0.3% previously. Weakness in nonindustrial goods inflation has been a main theme in the latest CPI releases, and the sector’s inflation rate remains well below trend. The main reasons for the disappointing figures have been persistent deflation in healthcare goods in France, and drops in clothing and shoe prices in most major countries. Our view is that a lagged effect from the stronger euro last year could be depressing durables and semidurables prices, though we are still penciling in a recovery in coming months.

The Week Ahead
CAPITAL MARKETS RESEARCH
11 JUNE 21, 2018 CAPITAL MARKETS RESEARCH / MARKET OUTLOOK / MOODYS.COM
ASIA-PACIFIC By Katrina Ell and the Asia-Pacific staff of Moody’s Analytics in Sydney
Japan’s May Activity Data Should Show Improvement
Japan’s May activity data are in the spotlight and should generally show spots of improvement after the difficult March quarter. Industrial production has recovered from softness early in 2018, with particular strength in transport equipment, machinery and metals production of late. Industrial production is likely to remain relatively firm in coming months, with a slowdown expected in the second half of this year as a buildup of inventories and an easing tech cycle slow gains.
The labour market is a continued source of strength. In April the labour market remained firm and we expect a continuation of that in May. The unemployment rate likely held steady at 2.5% in May for a fourth consecutive month. April employment continued to rise at a solid pace, with the job offering ratio remaining elevated at 1.6. Although the tight labour market is encouraging, firmer wage growth remains elusive. Japan's retail sales likely rose 1.4% y/y in May following the 1.6% gain in April. Retail sales growth remains in a cyclical downturn but the nominal series is enjoying renewed signs of lift thanks to higher fuel prices; in April fuel sales surged by 11.2% y/y.
Bank Indonesia isn't one to wait on the sidelines. In May the central bank increased the policy rate by 25 basis points to 4.5%, the first rate hike in four years, to shore up the currency and guard against capital outflows, which have gathered momentum amid heightened financial market volatility and major central banks offshore tightening policy settings. We don't anticipate another hike in June, but we'll keep a close watch as policymakers hint at the likely outcome a few days prior to the board meeting.
New Zealand’s central bank is much more of a steady ship and will keep the Official Cash Rate at 1.75% at its June meeting. The Reserve Bank of New Zealand noted in May that expansionary policy will remain in place for a "considerable period." We maintain our view that interest rate normalization will begin early in 2019, but this could be pushed out further, given that recent domestic policy changes have pushed inflation lower than our baseline.
Key indicators Units Moody's Analytics Last
Tues @ 7:00 a.m. South Korea Consumer price index for June Index 107.3 107.9
Wed @ 8:45 a.m. New Zealand Foreign trade for May NZ$ mil 153 263
Thurs @ 7:00 a.m. New Zealand Monetary policy for June % 1.75 1.75
Thurs @ 9:50 a.m. Japan Retail sales for May % change yr ago 1.4 1.6
Thurs @ Unknown Indonesia Monetary policy for June % 4.5 4.5
Fri @ 9:00 a.m. South Korea Retail sales for May % change -1.6 -1.0
Fri @ 9:30 a.m. Japan Unemployment rate for May % 2.5 2.5
Fri @ 9:50 a.m. Japan Industrial production for May % change 0.7 0.3
Fri @ 3:00 p.m. Japan Consumer confidence for June Index 43.2 43.8
Fri @ 5:30 p.m. Thailand Private consumption for May % change yr ago 4.3 5.5
Fri @ 5:30 p.m. Thailand Foreign trade for May US$ bil 1.1 0.2
MONDAY, JUNE 25 No major economic indicators are scheduled for release.
TUESDAY, JUNE 26
South Korea: Consumer Sentiment Index (June; 7:00 a.m. AEST; Monday, 9:00 p.m. GMT) South Korean consumer sentiment improved modestly in May. Sentiment had fallen to a one-year low in April, as consumers were slightly less positive about economic conditions, income and prospective spending. Although the improvement in consumer sentiment is welcome news, sentiment remains well below earlier highs. The labour market remains weak, with the unemployment rate ticking back up to a multiyear high of 4% in its latest reading. Sentiment likely slipped to 107.3 in June.

The Week Ahead
CAPITAL MARKETS RESEARCH
12 JUNE 21, 2018 CAPITAL MARKETS RESEARCH / MARKET OUTLOOK / MOODYS.COM
WEDNESDAY, JUNE 27
New Zealand: Foreign Trade (May; 8:45 a.m. AEST; Tuesday, 10:45 p.m. GMT) New Zealand's trade balance likely recorded a NZ$153 million surplus in May, after a NZ$263 million surplus in April and a NZ$156 million deficit in March. April's positive trade balance benefited from a surge in kiwifruit shipments, which were up 82% to a record high thanks to solid demand across the major markets, including China, the EU and Japan. April is the first month of the kiwi export season and we expect some cooling in May. New Zealand's other important export products continue to do well including dairy and meat, with the former enjoying stronger global prices. Goods imports reached a record high for an April month thanks to crude oil, a reflection of higher global prices, and similar strength is expected in May.
THURSDAY, JUNE 28
New Zealand: Monetary Policy (June; 7:00 a.m. AEST; Wednesday, 9:00 p.m. GMT) The Reserve Bank of New Zealand has its feet firmly planted on the sidelines and will keep the Official Cash Rate at 1.75%. The central bank struck a firmly neutral tone at its May meeting and we don't expect any notable changes in June. The RBNZ noted in May that expansionary policy will remain in place for a "considerable period." We maintain our view that interest rate normalization will begin early in 2019, but this could be pushed out further, given that recent domestic policy changes, including cuts to higher education fees, have pushed inflation lower than our baseline. The economy remains on a broadly improving trend, with employment and consumption ticking over at a reasonable pace.
Japan: Retail Sales (May; 9:50 a.m. AEST; Wednesday, 11:50 p.m. GMT) Japan's retail sales likely rose 1.4% y/y in May, following the 1.6% gain in April. Retail sales growth remains in a cyclical downturn but the nominal series is enjoying renewed signs of lift thanks to higher fuel prices; in April fuel sales surged by 11.2% y/y. Although the labour market is as strong as it has been in years, consumer spending has been relatively restrained as wage growth continues to disappoint expectations. Still, job gains should continue to support retail sales in coming months.
Indonesia: Monetary Policy (June; Unknown) Bank Indonesia isn't one to wait on the sidelines; May's monetary policy meeting confirmed this reputation. BI increased the policy rate by 25 basis points to 4.5%, the first rate hike in four years, to shore up the currency and guard against capital outflows, which have gathered momentum amid heightened financial market volatility and major central banks offshore tightening policy settings. Large foreign ownership of government debt means Indonesia is vulnerable to global risk aversion. It has been an eventful run for the central bank so far this year, which shifted from an easing to a neutral bias in January. We don't anticipate another hike in June, but we'll keep a close watch as policymakers hint at the likely outcome a few days prior to the board meeting.
FRIDAY, JUNE 29
South Korea: Retail Sales (May; 9:00 a.m. AEST; Thursday, 11:00 p.m. GMT) South Korean retail sales fell in April, as sales at department stores, supermarkets and convenience stores all declined. The only bright spot was nonstore retail sales, which edged up likely as a result of online sales. Some pullback was to be expected in April, as the labour market has weakened of late. The unemployment rate ticked back up to a multiyear high of 4% in its latest reading, with job growth still anemic. Meanwhile, consumer sentiment is well below earlier highs. We expect retail sales fell a further 1.6% in May.
Japan: Employment Situation (May; 9:30 a.m. AEST; Thursday, 11:30 p.m. GMT) Japan's unemployment rate likely held steady at 2.5% in May for a fourth consecutive month. In April the labour market remained firm and we expect a continuation of that in May. April employment continued to rise at a solid pace, with the job offering ratio remaining elevated at 1.6. Although the tight labour market is encouraging, firmer wage growth remains elusive, undermining consumer

The Week Ahead
CAPITAL MARKETS RESEARCH
13 JUNE 21, 2018 CAPITAL MARKETS RESEARCH / MARKET OUTLOOK / MOODYS.COM
spending and ultimately resulting in the Bank of Japan dropping its explicit target to lift inflation about 2% in the foreseeable future.
Japan: Industrial Production (May; 9:50 a.m. AEST; Thursday, 11:50 p.m. GMT) Japanese industrial production edged up 0.3% m/m in April, and we expect ongoing expansion with a 0.7% gain in May. Industrial production has recovered from softness early in 2018, with particular strength in transport equipment, machinery and metals production of late. Industrial production is likely to remain relatively firm in coming months, with a slowdown expected in the second half of this year as a buildup of inventories and an easing tech cycle slow gains.
Japan: Consumer Confidence (June; 3:00 p.m. AEST; 5:00 a.m. GMT) Japanese consumers perked up somewhat in May, with the consumer confidence index edging up to 43.8 from 43.6 in the prior month. We expect slightly cooler conditions in June with the index forecast to hit 43.2 as global trade tensions, particularly between the U.S. and China, add to uncertainty about future economic conditions. It was encouraging to see that consumers’ willingness to buy durable goods firmed in May, but confidence about income growth continued to slide. The latter is not surprising, given consumers have experienced little, if any, wage growth in recent years. Despite the tight labour market, wages have yet to meet expectations and rise on a decent and sustained basis.
Thailand: Private Consumption (May; 5:30 p.m. AEST; 7:30 a.m. GMT) Private consumption grew by a four-month high in April, thanks to surge in car sales and strong growth in services spending. However, consumers at the low end of the income scale continue to struggle, with motorcycle sales slipping in April from a year earlier. Nonetheless, consumer confidence has perked up of late, which is providing some lift to consumer spending. The booming tourism sector is also helping, with tourist arrivals up 15% y/y in the first quarter. Arrivals from China have risen significantly, thanks to the introduction of new routes from China. We expect private consumption grew 4.3% in May.
Thailand: Foreign Trade (May; 5:30 p.m. AEST; 7:30 a.m. GMT) Thailand’s trade surplus narrowed significantly in April, even as export growth improved to a three-month high. Exports were again driven by strong external demand for electronics, as well as an improvement in automobile-related exports. But it was the surge in imports that shrank the trade surplus to US$234 million, down from US$3 billion in March. The surge in imports was mainly driven by consumer goods and raw materials and intermediate goods. Meanwhile, capital goods imports were relatively soft, which is a concern since private investment has lagged in recent years. Thailand’s trade surplus likely increased to US$1.1 billion in May.

CAPITAL MARKETS RESEARCH
14 JUNE 21, 2018 CAPITAL MARKETS RESEARCH / MARKET OUTLOOK / MOODYS.COM
The Long View
The Long View
The latest bout of trade-related uncertainties has yet to increase credit risk premia materially. By John Lonski, Chief Economist, Moody’s Capital Markets Research Group, June 21, 2018 CREDIT SPREADS As measured by Moody's long-term average corporate bond yield, the recent investment grade corporate bond yield spread of 129 bp exceeds its 122-point mean of the two previous economic recoveries. This spread is more likely to be wider, as opposed to narrower, a year from now.
The recent high-yield bond spread of 347 bp is less than might be inferred from the spread’s macroeconomic drivers and the long-term Baa industrial company bond yield spread. The adverse implications for liquidity of possibly significantly higher interest rates merit consideration.
DEFAULTS After setting its current cycle high at January 2017’s 5.8% and subsequently bottoming at January 2018’s 3.3%, May’s U.S. high-yield default rate equaled 3.7%. Moody's Default and Ratings Analytics team expects the default rate will average 2.0% during Q1-2019.
US CORPORATE BOND ISSUANCE Yearlong 2017’s US$-denominated bond issuance rose by 6.8% annually for IG, to $1.508 trillion and soared by 33.0% to $453 billion for high yield. Across broad rating categories, 2017’s newly rated bank loan programs from high-yield issuers sank by 26.2% to $72 billion for Baa, advanced by 50.6% to $319 billion for Ba, soared by 56.0% to $293 billion for programs graded single B, and increased by 28.1% to $25.5 billion for new loans rated Caa.
First-quarter 2017’s worldwide offerings of corporate bonds showed annual percent increases of 7.7% for IG and 110.6% for high-yield, wherein US$-denominated offerings advanced by 17.1% for IG and by 98.3% for high yield.
Second-quarter 2017’s worldwide offerings of corporate bonds showed an annual percent decline of 6.3% for IG and an increase of 8.3% for high-yield, wherein US$-denominated offerings fell by 6.4% for IG and grew by 5.8% for high yield.
Third-quarter 2017’s worldwide offerings of corporate bonds showed an annual percent decline of 1.6% for IG and an increase of 6.6% for high-yield, wherein US$-denominated offerings dipped by 0.7% for IG and grew by 4.3% for high yield.
Fourth-quarter 2017 revealed year-over-year advances for worldwide offerings of corporate bonds of 17.6% for IG and 77.5% for high-yield, wherein US$-denominated offerings posted increases of 21.0% for IG and 56.7% for high yield.
First-quarter 2018’s worldwide offerings of corporate bonds incurred year-over-year setbacks of 6.3% for IG and 18.6% for high-yield, wherein US$-denominated offerings posted sank by 14.4% for IG and 20.8% for high yield.
For yearlong 2016, worldwide corporate bond offerings rose by 2.3% annually for IG (to $2.402 trillion) and sank by 7.8% for high yield (to $426 billion). During yearlong 2017, worldwide corporate bond offerings increased by 4.0% annually (to $2.499 trillion) for IG and advance by 41.2% for high yield (to $602 billion). The projected annual percent changes for 2018’s worldwide corporate bond offerings are +1.3% for IG and -11.8% for high yield.
The financing of acquisitions and shareholder compensation will stand out among 2016’s uses of funds obtained via bond issues and newly-rated bank loan programs. Companies will resort to acquisitions and divestitures in order to better cope with the US’s subpar recovery. To the degree companies fear significantly higher bond yields, pre-fundings will rise.
CAPITAL MARKETS RESEARCH
15 JUNE 21, 2018 CAPITAL MARKETS RESEARCH / MARKET OUTLOOK / MOODYS.COM
The Long View
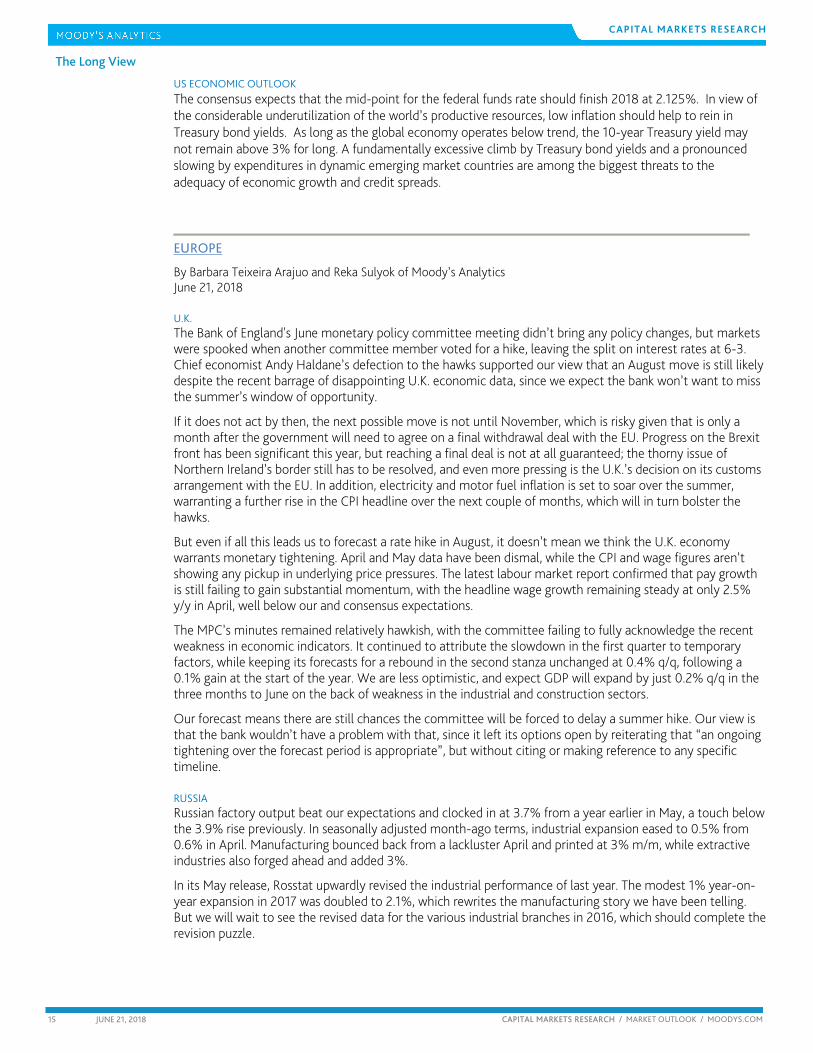
US ECONOMIC OUTLOOK The consensus expects that the mid-point for the federal funds rate should finish 2018 at 2.125%. In view of the considerable underutilization of the world’s productive resources, low inflation should help to rein in Treasury bond yields. As long as the global economy operates below trend, the 10-year Treasury yield may not remain above 3% for long. A fundamentally excessive climb by Treasury bond yields and a pronounced slowing by expenditures in dynamic emerging market countries are among the biggest threats to the adequacy of economic growth and credit spreads.
EUROPE
By Barbara Teixeira Arajuo and Reka Sulyok of Moody’s Analytics June 21, 2018
U.K. The Bank of England's June monetary policy committee meeting didn’t bring any policy changes, but markets were spooked when another committee member voted for a hike, leaving the split on interest rates at 6-3. Chief economist Andy Haldane’s defection to the hawks supported our view that an August move is still likely despite the recent barrage of disappointing U.K. economic data, since we expect the bank won’t want to miss the summer’s window of opportunity.
If it does not act by then, the next possible move is not until November, which is risky given that is only a month after the government will need to agree on a final withdrawal deal with the EU. Progress on the Brexit front has been significant this year, but reaching a final deal is not at all guaranteed; the thorny issue of Northern Ireland’s border still has to be resolved, and even more pressing is the U.K.’s decision on its customs arrangement with the EU. In addition, electricity and motor fuel inflation is set to soar over the summer, warranting a further rise in the CPI headline over the next couple of months, which will in turn bolster the hawks.
But even if all this leads us to forecast a rate hike in August, it doesn’t mean we think the U.K. economy warrants monetary tightening. April and May data have been dismal, while the CPI and wage figures aren’t showing any pickup in underlying price pressures. The latest labour market report confirmed that pay growth is still failing to gain substantial momentum, with the headline wage growth remaining steady at only 2.5% y/y in April, well below our and consensus expectations.
The MPC’s minutes remained relatively hawkish, with the committee failing to fully acknowledge the recent weakness in economic indicators. It continued to attribute the slowdown in the first quarter to temporary factors, while keeping its forecasts for a rebound in the second stanza unchanged at 0.4% q/q, following a 0.1% gain at the start of the year. We are less optimistic, and expect GDP will expand by just 0.2% q/q in the three months to June on the back of weakness in the industrial and construction sectors.
Our forecast means there are still chances the committee will be forced to delay a summer hike. Our view is that the bank wouldn’t have a problem with that, since it left its options open by reiterating that “an ongoing tightening over the forecast period is appropriate”, but without citing or making reference to any specific timeline.
RUSSIA Russian factory output beat our expectations and clocked in at 3.7% from a year earlier in May, a touch below the 3.9% rise previously. In seasonally adjusted month-ago terms, industrial expansion eased to 0.5% from 0.6% in April. Manufacturing bounced back from a lackluster April and printed at 3% m/m, while extractive industries also forged ahead and added 3%.
In its May release, Rosstat upwardly revised the industrial performance of last year. The modest 1% year-on-year expansion in 2017 was doubled to 2.1%, which rewrites the manufacturing story we have been telling. But we will wait to see the revised data for the various industrial branches in 2016, which should complete the revision puzzle.

CAPITAL MARKETS RESEARCH
16 JUNE 21, 2018 CAPITAL MARKETS RESEARCH / MARKET OUTLOOK / MOODYS.COM
The Long View
This isn’t the first time Rosstat has delivered a surprise upward revision. In March 2017, the new report erased most of the industrial slack, stating that the drop in 2015 was a much smaller 1.3% than the steep 5.4% decline reported earlier. But back then, Rosstat said that this was because of a methodological change. It adopted the EU classifications for products and industrial branches and recalculated the industrial index accordingly.
This time is different. Rosstat provided no convincing reason rooted in accounting changes for the extraordinary revision. True, the statistical office warned that early reports have a pessimistic bias because factories tend to understate their results. This is why the national accounts data may offer more precise, though lagged, information on the health of manufacturing.
We find the erratic changes deeply problematic. At a minimum, the expectation of further upward revisions erodes the predictive power of the industrial data on GDP. But more concerning is that we can never be sure if such revisions are meant to create a base for a favourable GDP revision. And as we have seen, the revisions could go both ways. Last year, a thorough historical revision of the national accounts prompted a reassessment of industry. But a sizable revision of factory output affecting the history of GDP is not unprecedented either.
In any case, the seasonally adjusted manufacturing PMI dipped below the expansion threshold to 49.8 in May, down from 51.3 in April, indicating that a slowdown is imminent. If that is true, it is bad news for GDP because industry is still the main driver of Russian GDP growth.
ASIA PACIFIC By Katrina Ell of Moody’s Analytics June 21, 2018
CHINA Trade tensions between the U.S. and China have intensified at an alarming rate. The situation is quickly evolving, but the latest barbs have the Trump administration proposing to introduce tariffs on an additional $200 billion in Chinese goods imports, following the $50 billion set to be implemented from 6 July. China hit back by proposing an additional $50 billion in tariffs on U.S. goods imports, with threats of additional action. The U.S. has been in the driver’s seat, escalating the magnitude of intended tariffs on Chinese goods to prompt important structural changes in its trade relationship. China has been retaliating with just enough to match the U.S. tariffs, rather than escalating the situation.
China holds important bargaining chips in this high stakes game that it has not yet used. So far, China has proposed tariffs only on U.S. goods imports, but targeting the services sector is where the economic pain could be felt long term. The U.S. services trade surplus with China was $38 billion in 2016, up from $16.5 billion in 2011. Although this still pales in comparison with the $370 billion deficit in goods, global demand is shifting from goods to services. This trend is well entrenched in China as the drivers change from urbanization and basic manufactured goods to consumption and more complex services. Well-established expertise in various industries means that the U.S. is in good stead to meet the rising needs of China so long as Beijing remains open to it. In particular, China could restrict enrollments into U.S. universities or restrict tourist flows, both important income streams for the U.S. Tourism represented 63% of U.S. services exports to China in 2015.
Tensions have intensified Since the trade tensions have intensified, anecdotal evidence suggests that U.S. firms are finding it more difficult to obtain regulatory approval for various business activities, and that their goods have taken longer to clear customs. China has used this under-the-radar approach in the past. For instance, when the South Korean-Japanese conglomerate Lotte Group agreed to sell land to the South Korean government for a U.S. missile defense system, operations at several of the company stores in China were suspended for alleged fire safety violations. The firm has since pulled out of China, but is still incurring losses due to an inability to sell all its units. A backlash was felt in other areas, including Chinese consumers shunning Korean automotives and cancelling planned tourism to South Korea. The Bank of Korea estimated that the incident shaved 0.4 percentage point from South Korea’s GDP growth in 2017.

CAPITAL MARKETS RESEARCH
17 JUNE 21, 2018 CAPITAL MARKETS RESEARCH / MARKET OUTLOOK / MOODYS.COM
The Long View
Another strategy could be to devalue the yuan. A lower exchange rate would help competitiveness across all markets and could partially absorb some of the tariffs’ impact on goods shipped to the U.S. It would also fan U.S. frustrations, as the government has threatened to label China a “currency manipulator” in the past.
Restricting aircraft imports is another option. Aerospace exports to China were $16.3 billion in 2017, according to Teal Group. Boeing is the largest exporter to China and would be hurt if China pushed ahead with the proposed 25% tariff on some aircraft. In November, Boeing announced it had signed an agreement to sell 300 planes to China worth $37 billion, but it is not clear how much of this represented new business; the company had previously noted that 25% of new jetliners were being delivered to Chinese customers. This remains an option, although it wouldn’t benefit China since substitution of airliners isn't easy.
The North Korea option China could also inflict pain via North Korea. China is North Korea’s most important ally and largest trading partner, and it has encouraged Pyongyang to the negotiating table partly by adhering to the unilaterally imposed sanctions on North Korea as never before. Knowing the economic power that Beijing holds, China could encourage North Korea to be less amiable in its promise to denuclearize and work towards peace on the Korean Peninsula, which would rattle financial markets and broader economic sentiment.
A less likely bargaining chip is that Beijing could sell some of its holdings of U.S. Treasuries. In theory, this could tighten U.S. financial conditions beyond what is already occurring via monetary policy. China is the largest holder of U.S. Treasuries. In January, unnamed Chinese officials reportedly threatened to stop or slow U.S. Treasury purchases, and financial markets took the whispers seriously, causing bond yields to increase even though the claim was later rubbished by China's foreign exchange regulator. In practice, China doesn't have a lot of options to substantially diversify away from otherwise desirable U.S. Treasuries.

18 JUNE 21, 2018 CAPITAL MARKETS RESEARCH / MARKET OUTLOOK / MOODYS.COM
CAPITAL MARKETS RESEARCH Ratings Round-Up
Ratings Round-Up By Njundu Sanneh
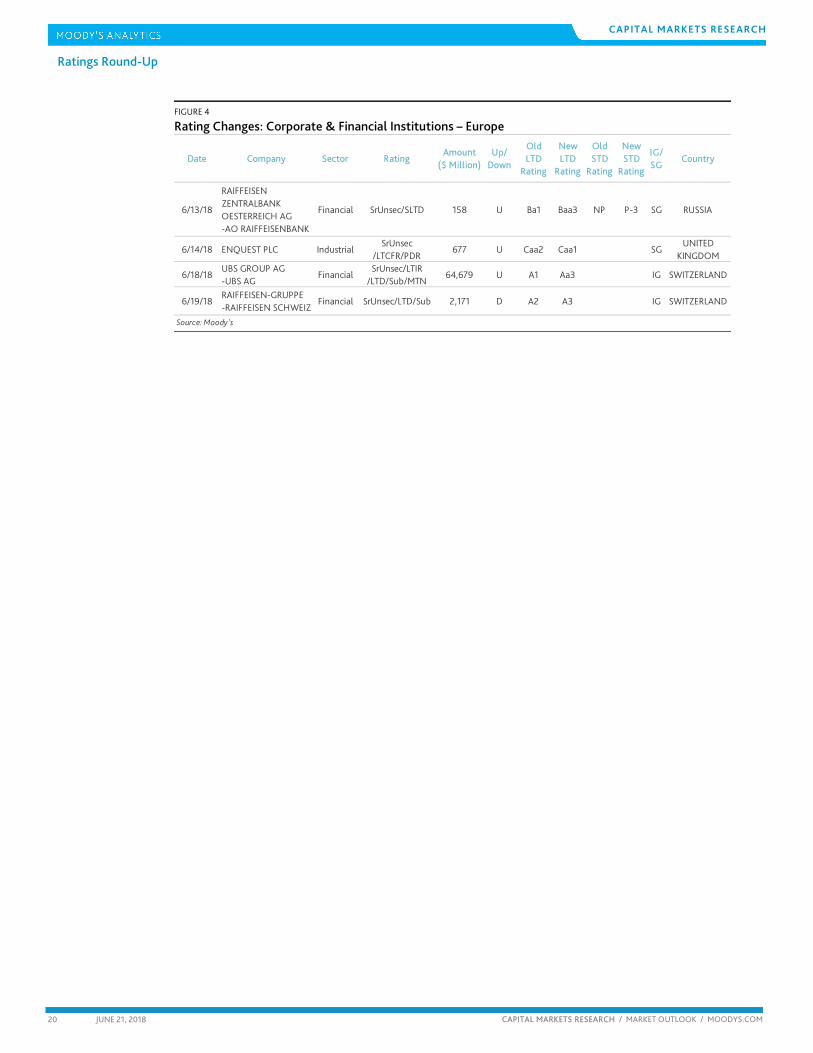
Telecom Sector Clouds US Rating Revision Activity The downgrades in the telecommunications sector paced the negative skew in the past week’s rating changes for the US. The sector is in the midst of a major merger-and-acquisition activity in addition to the escalating capital spending that has earned the industry a negative outlook. The completion of the acquisition of Time Warner by AT&T Inc. (one of the downgraded entities) in the past week has intensified the M&A activity within the industry, with content distributors and content providers trying to link up. Comcast is in a heated battle with Disney to buy Fox. Sky is also likely to attract more suitors as the mega mergers continue. The marriages within the sector are likely to result in pressure on the balance sheets as the bidding wars increase the premium on the target companies. AT&T was downgraded on June 15 following the completion of its acquisition of Time Warner and we expect to see more such rating actions in the sector as balance sheet leverage increases with the pricey acquisitions. The power generation sector and lodging and cruise sectors were among the upgraded companies. Royal Caribbean Cruises was upgraded as the trends in bookings, onboard spending and expansion with more new ships will benefit the company’s performance in the near to midterm. In Europe, rating revisions activity was sparse, but the contribution of upgrades to total rating changes rose substantially to 75% from last week’s 28%. Financial firms accounted for three of the four rating changes and two of the three upgrades. Swiss banks UBS Ag and Raiffeisen Gruppe were among the noteworthy entities on the European rating revisions list.
FIGURE 1
Rating Changes - US Corporate & Financial Institutions: Favorable as % of Total Actions
0.0
0.2
0.4
0.6
0.8
1.0
0.0
0.2
0.4
0.6
0.8
1.0
Apr01 Feb04 Dec06 Oct09 Aug12 Jun15 Apr18
By Count of Actions By Amount of Debt Affected
* Trailing 3-month average
Source: Moody's

19 JUNE 21, 2018 CAPITAL MARKETS RESEARCH / MARKET OUTLOOK / MOODYS.COM
CAPITAL MARKETS RESEARCH Ratings Round-Up
FIGURE 2
Rating Key
BCF Bank Credit Facility Rating MM Money-MarketCFR Corporate Family Rating MTN MTN Program RatingCP Commercial Paper Rating Notes NotesFSR Bank Financial Strength Rating PDR Probability of Default RatingIFS Insurance Financial Strength Rating PS Preferred Stock RatingIR Issuer Rating SGLR Speculative-Grade Liquidity Rating
JrSub Junior Subordinated Rating SLTD Short- and Long-Term Deposit RatingLGD Loss Given Default Rating SrSec Senior Secured Rating LTCF Long-Term Corporate Family Rating SrUnsec Senior Unsecured Rating LTD Long-Term Deposit Rating SrSub Senior SubordinatedLTIR Long-Term Issuer Rating STD Short-Term Deposit Rating
FIGURE 3
Rating Changes: Corporate & Financial Institutions – US
Date Company Sector RatingAmount
($ Million)Up/
Down
Old LTD
Rating
New LTD
Rating
IG/SG
6/13/18 METRO-GOLDWYN-MAYER INC. Industrial LTCFR/PDR D Ba2 Ba3 SG
6/13/18 BLACKROCK, INC. FinancialSrUnsec/LTIR
/Sub/PS5,013 U A1 Aa3 IG
6/14/18TRIDENT HOLDING COMPANY, LLC -NEW TRIDENT HOLDCORP, INC.
Industrial SrSec/BCF/LTCFR D Caa2 Caa3 SG
6/14/18 BLUE RACER MIDSTREAM, LLC Industrial SrUnsec 850 U B3 B2 SG
6/15/18 AT&T INC. Industrial SrUnsec/BCF 134,176 D Baa1 Baa2 IG
6/15/18 COMFORT HOLDING, LLC IndustrialSrSec/BCF
/LTCFR/PDRD B3 Caa1 SG
6/15/18 LIFESCAN GLOBAL CORPORATION Industrial SrSec/BCF D B1 B2 SG
6/18/18 AES CORPORATION (THE) UtilitySrUnsec/BCF /LTCFR/PDR
3,324 U Ba2 Ba1 SG
6/18/18 ROYAL CARIBBEAN CRUISES LTD. Industrial SrUnsec 1,750 U Baa3 Baa2 IG
6/18/18 TALEN ENERGY SUPPLY, LLC UtilitySrUnsec/SrSec
/BCF/LTCFR/PDR2,661 D B3 Caa1 SG
6/18/18 MURRAY ENERGY CORPORATION Industrial SrSec 1,249 D Caa2 Caa3 SG
6/18/18 ASP MCS ACQUISITION CORP. IndustrialSrSec/BCF
/LTCFR/PDRD B2 B3 SG
6/18/18 CAPITAL SERVICES-APTIM CORP. Industrial SrSec/LTCFR/PDR 515 D B3 Caa2 SG
6/19/18 CLEAN HARBORS, INC. Industrial SrSec/BCF 850 D Baa3 Ba1 IG
6/19/18BROOKFIELD ASSET MANAGEMENT INC. -TERRAFORM POWER OPERATING LLC
Industrial SrUnsec/LTCFR/PDR 1,500 U B2 B1 SG
6/19/18 U.S. CONCRETE, INC. Industrial SrUnsec/LTCFR/PDR 600 D B2 B3 SG
6/19/18 WINDSTREAM SERVICES, LLC IndustrialSrSec/SrUnsec
/BCF/LTCFR/PDR4,096 D B3 Caa1 SG
6/19/18 PREGIS HOLDING I CORPORATION Industrial SrSec/BCF U B3 B2 SG
6/19/18 UNITI GROUP INC. IndustrialSrSec/SrUnsec
/BCF/LTCFR/PDR2,260 D B2 B3 SG
Source: Moody's
20 JUNE 21, 2018 CAPITAL MARKETS RESEARCH / MARKET OUTLOOK / MOODYS.COM
CAPITAL MARKETS RESEARCH Ratings Round-Up
FIGURE 4
Rating Changes: Corporate & Financial Institutions – Europe
Date Company Sector RatingAmount
($ Million)Up/
Down
Old LTD
Rating
New LTD
Rating
Old STD
Rating
New STD
Rating
IG/SG
Country
6/13/18
RAIFFEISEN ZENTRALBANK OESTERREICH AG -AO RAIFFEISENBANK
Financial SrUnsec/SLTD 158 U Ba1 Baa3 NP P-3 SG RUSSIA
6/14/18 ENQUEST PLC IndustrialSrUnsec
/LTCFR/PDR677 U Caa2 Caa1 SG
UNITED KINGDOM
6/18/18UBS GROUP AG -UBS AG
FinancialSrUnsec/LTIR
/LTD/Sub/MTN64,679 U A1 Aa3 IG SWITZERLAND
6/19/18RAIFFEISEN-GRUPPE -RAIFFEISEN SCHWEIZ
Financial SrUnsec/LTD/Sub 2,171 D A2 A3 IG SWITZERLAND
Source: Moody's

21 JUNE 21, 2018 CAPITAL MARKETS RESEARCH / MARKET OUTLOOK / MOODYS.COM
CAPITAL MARKETS RESEARCH Market Data
Market Data
0
200
400
600
800
0
200
400
600
800
2003 2004 2005 2006 2007 2008 2009 2010 2011 2012 2013 2014 2015 2016 2017 2018
Spread (bp) Spread (bp) Aa2 A2 Baa2
Source: Moody'sSource: Moody's
Figure 1: 5-Year Median Spreads-Global Data (High Grade)
Source: Moody'sSource: Moody's
Figure 1: 5-Year Median Spreads-Global Data (High Grade)
0
400
800
1,200
1,600
2,000
0
400
800
1,200
1,600
2,000
2003 2004 2005 2006 2007 2008 2009 2010 2011 2012 2013 2014 2015 2016 2017 2018
Spread (bp) Spread (bp) Ba2 B2 Caa-C
Source: Moody's
Figure 2: 5-Year Median Spreads-Global Data (High Yield)
Spreads
22 JUNE 21, 2018 CAPITAL MARKETS RESEARCH / MARKET OUTLOOK / MOODYS.COM
CAPITAL MARKETS RESEARCH Market Data
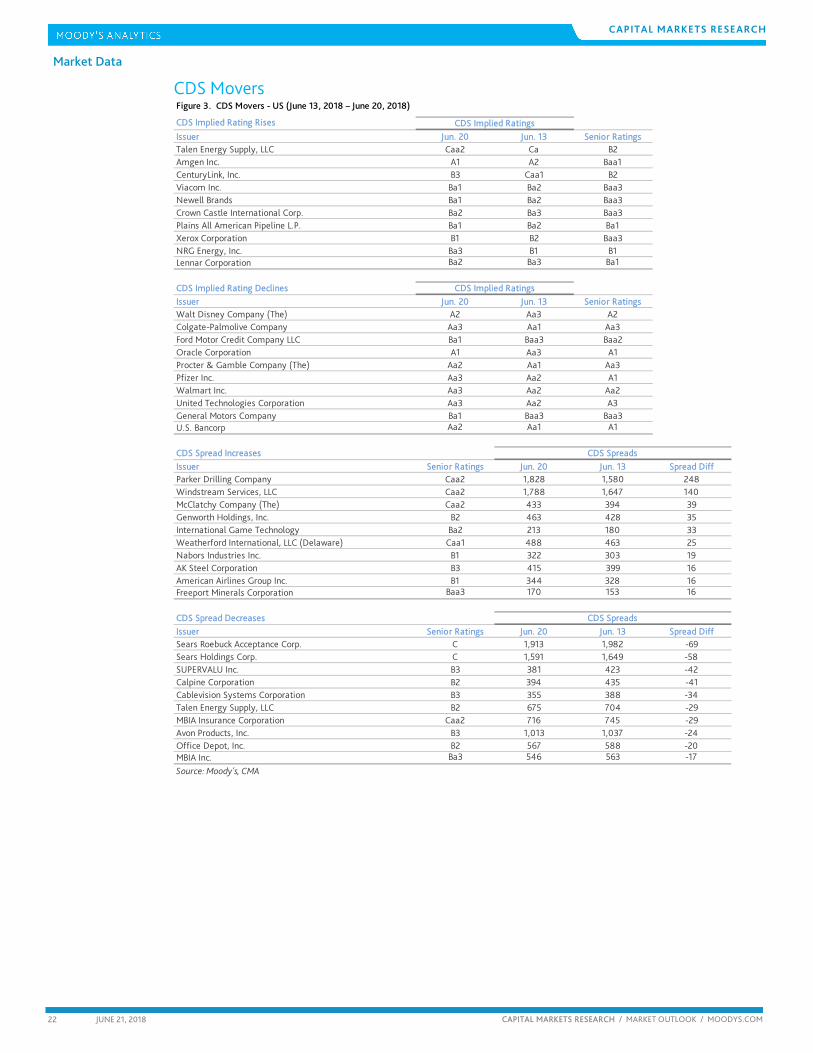
CDS Movers CDS Implied Rating Rises
Issuer Jun. 20 Jun. 13 Senior RatingsTalen Energy Supply, LLC Caa2 Ca B2Amgen Inc. A1 A2 Baa1CenturyLink, Inc. B3 Caa1 B2Viacom Inc. Ba1 Ba2 Baa3Newell Brands Ba1 Ba2 Baa3Crown Castle International Corp. Ba2 Ba3 Baa3Plains All American Pipeline L.P. Ba1 Ba2 Ba1Xerox Corporation B1 B2 Baa3NRG Energy, Inc. Ba3 B1 B1Lennar Corporation Ba2 Ba3 Ba1
CDS Implied Rating DeclinesIssuer Jun. 20 Jun. 13 Senior RatingsWalt Disney Company (The) A2 Aa3 A2Colgate-Palmolive Company Aa3 Aa1 Aa3Ford Motor Credit Company LLC Ba1 Baa3 Baa2Oracle Corporation A1 Aa3 A1Procter & Gamble Company (The) Aa2 Aa1 Aa3Pfizer Inc. Aa3 Aa2 A1Walmart Inc. Aa3 Aa2 Aa2United Technologies Corporation Aa3 Aa2 A3General Motors Company Ba1 Baa3 Baa3U.S. Bancorp Aa2 Aa1 A1
CDS Spread IncreasesIssuer Senior Ratings Jun. 20 Jun. 13 Spread DiffParker Drilling Company Caa2 1,828 1,580 248Windstream Services, LLC Caa2 1,788 1,647 140McClatchy Company (The) Caa2 433 394 39Genworth Holdings, Inc. B2 463 428 35International Game Technology Ba2 213 180 33Weatherford International, LLC (Delaware) Caa1 488 463 25Nabors Industries Inc. B1 322 303 19AK Steel Corporation B3 415 399 16American Airlines Group Inc. B1 344 328 16Freeport Minerals Corporation Baa3 170 153 16
CDS Spread DecreasesIssuer Senior Ratings Jun. 20 Jun. 13 Spread DiffSears Roebuck Acceptance Corp. C 1,913 1,982 -69Sears Holdings Corp. C 1,591 1,649 -58SUPERVALU Inc. B3 381 423 -42Calpine Corporation B2 394 435 -41Cablevision Systems Corporation B3 355 388 -34Talen Energy Supply, LLC B2 675 704 -29MBIA Insurance Corporation Caa2 716 745 -29Avon Products, Inc. B3 1,013 1,037 -24Office Depot, Inc. B2 567 588 -20MBIA Inc. Ba3 546 563 -17
Source: Moody's, CMA
CDS Spreads
CDS Implied Ratings
CDS Implied Ratings
CDS Spreads
Figure 3. CDS Movers - US (June 13, 2018 – June 20, 2018)

23 JUNE 21, 2018 CAPITAL MARKETS RESEARCH / MARKET OUTLOOK / MOODYS.COM
CAPITAL MARKETS RESEARCH Market Data
CDS Implied Rating Rises
Issuer Jun. 20 Jun. 13 Senior RatingsItaly, Government of B1 B2 Baa2Belgium, Government of Aaa Aa1 Aa3Barclays Bank PLC A3 Baa1 A2BNP Paribas A2 A3 Aa3Credit Agricole Corporate and Investment Bank A2 A3 A1Commerzbank AG Baa2 Baa3 Baa1UniCredit S.p.A. Ba1 Ba2 Baa1NatWest Markets N.V. A1 A2 Baa2UniCredit Bank Austria AG Baa3 Ba1 Baa1Telecom Italia S.p.A. Ba3 B1 Ba1
CDS Implied Rating DeclinesIssuer Jun. 20 Jun. 13 Senior RatingsOld Mutual Plc A1 Aa1 Ba1Unipol Gruppo S.p.A. B2 Ba3 Ba1Landesbank Hessen-Thueringen GZ A2 A1 A1Natixis A1 Aa3 A2Allied Irish Banks, p.l.c. A2 A1 Ba1Volkswagen Aktiengesellschaft Baa3 Baa2 A3Sanofi Aa2 Aa1 A1Bank of Ireland Aa2 Aa1 Baa1Compagnie de Saint-Gobain SA Baa1 A3 Baa2Swiss Reinsurance Company Ltd A1 Aa3 Aa3
CDS Spread IncreasesIssuer Senior Ratings Jun. 20 Jun. 13 Spread DiffGalapagos Holding S.A. Caa3 1,605 1,534 71Boparan Finance plc Caa1 555 496 60CMA CGM S.A. B3 659 604 55Unipol Gruppo S.p.A. Ba1 207 162 45Vedanta Resources plc B2 424 407 17Old Mutual Plc Ba1 41 28 13RCI Banque Baa1 117 107 10Evraz Group S.A. Ba3 224 215 9Care UK Health & Social Care PLC Caa1 126 116 9Volkswagen Aktiengesellschaft A3 82 74 8
CDS Spread DecreasesIssuer Senior Ratings Jun. 20 Jun. 13 Spread DiffAstaldi S.p.A. Caa1 1,579 1,669 -90Italy, Government of Baa2 191 207 -16Altice Finco S.A. B3 430 446 -16Sunrise Communications Holdings S.A. B1 87 102 -16Assicurazioni Generali S.p.A Baa2 111 124 -13Matalan Finance plc Caa1 728 740 -12Intesa Sanpaolo S.p.A. Baa1 135 145 -10Telecom Italia S.p.A. Ba1 164 174 -10Casino Guichard-Perrachon SA Ba1 348 359 -10Leonardo S.p.a. Ba1 179 189 -10
Source: Moody's, CMA
CDS Spreads
CDS Implied Ratings
CDS Implied Ratings
CDS Spreads
Figure 4. CDS Movers - Europe (June 13, 2018 – June 20, 2018)

24 JUNE 21, 2018 CAPITAL MARKETS RESEARCH / MARKET OUTLOOK / MOODYS.COM
CAPITAL MARKETS RESEARCH Market Data
Issuance
0
600
1,200
1,800
2,400
0
600
1,200
1,800
2,400
Jan Feb Mar Apr May Jun Jul Aug Sep Oct Nov Dec
Issuance ($B) Issuance ($B)2015 2016 2017 2018
Source: Moody's / Dealogic
Figure 5. Market Cumulative Issuance - Corporate & Financial Institutions: USD Denominated
0
200
400
600
800
1,000
0
200
400
600
800
1,000
Jan Feb Mar Apr May Jun Jul Aug Sep Oct Nov Dec
Issuance ($B) Issuance ($B)2015 2016 2017 2018
Source: Moody's / Dealogic
Figure 6. Market Cumulative Issuance - Corporate & Financial Institutions: Euro Denominated
25 JUNE 21, 2018 CAPITAL MARKETS RESEARCH / MARKET OUTLOOK / MOODYS.COM
CAPITAL MARKETS RESEARCH Market Data
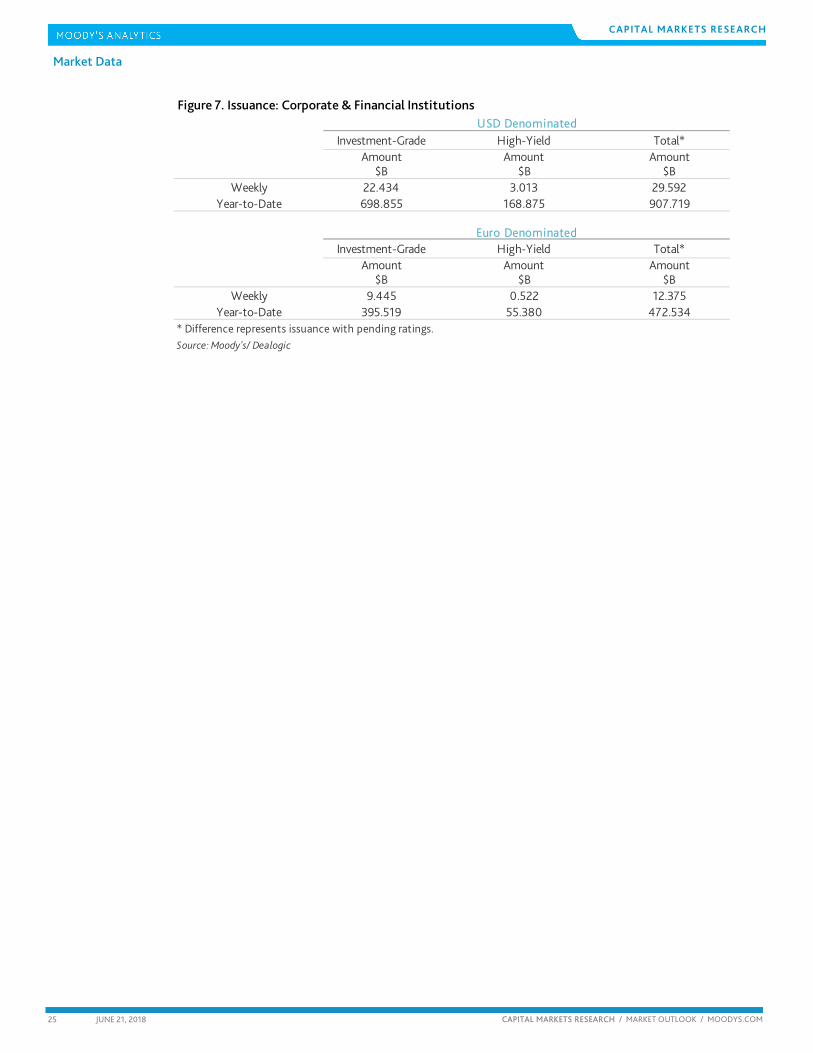
Investment-Grade High-Yield Total*Amount Amount Amount
$B $B $BWeekly 22.434 3.013 29.592
Year-to-Date 698.855 168.875 907.719
Investment-Grade High-Yield Total*Amount Amount Amount
$B $B $BWeekly 9.445 0.522 12.375
Year-to-Date 395.519 55.380 472.534* Difference represents issuance with pending ratings.Source: Moody's/ Dealogic
USD Denominated
Euro Denominated
Figure 7. Issuance: Corporate & Financial Institutions
26 JUNE 21, 2018 CAPITAL MARKETS RESEARCH / MARKET OUTLOOK / MOODYS.COM
CAPITAL MARKETS RESEARCH
Moody’s Capital Markets Research recent publications
Fewer Defaults Strongly Favor a Higher Equity Market (Capital Markets Research)
Higher Interest Rates Will Be the Source of Their Own Demise (Capital Markets Research)
Low Utilization Rate Favors Profits Growth and Fewer Defaults (Capital Markets Research)
Equities Giveth and Taketh Away from Credit Quality (Capital Markets Research)
M&A both Enhances and Diminishes Corporate Credit Quality (Capital Markets Research)
Loan Default Rate May Approach Bond Default Rate (Capital Markets Research)
Outstandings Now Show Leveraged Loans Topping High-Yield Bonds (Capital Markets Research)
Profits Growth Curbs Defaults (Capital Markets Research)
Debt-to-Profits Outperforms Debt-to-GDP (Capital Markets Research)
Foreign Investors Ease Burden of U.S.' Elevated Leverage (Capital Markets Research)
Default Rate Defies Record Ratio of Corporate Debt to GDP (Capital Market Research)
Internal Funds Outrun Corporate Debt by Widest Margin since 2011 (Capital Markets Research)
Tariffs Warn of Even Faster Price Inflation and Slower Growth (Capital Markets Research)
Borrowing Restraint Elsewhere Makes Room for Federal Debt Surge (Capital Markets Research)
Declining Default Rate Offsets Drag of Higher Interest Rates (Capital Markets Research)
Corporate Bonds Beg to Differ with Their Equity Brethren (Capital Markets Research)
Topics CreditEdge - Bank Default Risk Improves in 2017
Higher Yields and Lower Equities Might Yet Swell Credit Risk (Capital Markets Research)
High-Yield Bond Issuance Thrives Despite Tax Law Changes (Capital Markets Research)
Surging Equities and Thinner Spreads Favor Higher Treasury Yields (Capital Markets Research)
Sovereign & Supranational: Greece's Sovereign EDF Implies Upbeat Next Act in Greek Economic Drama
Sovereign & Supranational: South Korea's Sovereign Credit Risk: Calmer Against a Friendlier Backdrop
Stocks and Spreads May Transcend Higher Treasury Yields (Capital Markets Research)
Sovereign & Supranational: Brazil's Sovereign Credit Risk at Year's Best
Profits Growth and Benign Default Outlook May Offset Higher Interest Rates (Capital Markets Research)
Benign Credit Outlook Comes With Blemishes (Capital Markets Research)
Sovereign & Supranational: EDFs for Greece and Spain Lowest in Years
Dangers Lurk Amid 2018's Positive Outlook (Capital Markets Research)
High-Yield Borrowing May Slow Following 2017's Boom (Capital Markets Research)
These and others are also available at: http://www.moodys.com/cmrg

27 JUNE 21, 2018 CAPITAL MARKETS RESEARCH / MARKET OUTLOOK / MOODYS.COM
CAPITAL MARKETS RESEARCH
To order reprints of this report (100 copies minimum), please call 212.553.1658.
Report Number: 1131130 Contact Us
Editor Reid Kanaley
Americas: 1.212.553.4399
Europe: +44 (0) 20.7772.5588
Asia: 813.5408.4131
28 JUNE 21, 2018 CAPITAL MARKETS RESEARCH / MARKET OUTLOOK / MOODYS.COM
CAPITAL MARKETS RESEARCH
© 2018 Moody’s Corporation, Moody’s Investors Service, Inc., Moody’s Analytics, Inc. and/or their licensors and affiliates (collectively, “MOODY’S”). All rights reserved.
CREDIT RATINGS ISSUED BY MOODY'S INVESTORS SERVICE, INC. (“MIS”) AND ITS AFFILIATES ARE MOODY’S CURRENT OPINIONS OF THE RELATIVE FUTURE CREDIT RISK OF ENTITIES, CREDIT COMMITMENTS, OR DEBT OR DEBT-LIKE SECURITIES, AND CREDIT RATINGS AND RESEARCH PUBLICATIONS PUBLISHED BY MOODY’S (“MOODY’S PUBLICATIONS”) MAY INCLUDE MOODY’S CURRENT OPINIONS OF THE RELATIVE FUTURE CREDIT RISK OF ENTITIES, CREDIT COMMITMENTS, OR DEBT OR DEBT-LIKE SECURITIES. MOODY’S DEFINES CREDIT RISK AS THE RISK THAT AN ENTITY MAY NOT MEET ITS CONTRACTUAL, FINANCIAL OBLIGATIONS AS THEY COME DUE AND ANY ESTIMATED FINANCIAL LOSS IN THE EVENT OF DEFAULT. CREDIT RATINGS DO NOT ADDRESS ANY OTHER RISK, INCLUDING BUT NOT LIMITED TO: LIQUIDITY RISK, MARKET VALUE RISK, OR PRICE VOLATILITY. CREDIT RATINGS AND MOODY’S OPINIONS INCLUDED IN MOODY’S PUBLICATIONS ARE NOT STATEMENTS OF CURRENT OR HISTORICAL FACT. MOODY’S PUBLICATIONS MAY ALSO INCLUDE QUANTITATIVE MODEL-BASED ESTIMATES OF CREDIT RISK AND RELATED OPINIONS OR COMMENTARY PUBLISHED BY MOODY’S ANALYTICS, INC. CREDIT RATINGS AND MOODY’S PUBLICATIONS DO NOT CONSTITUTE OR PROVIDE INVESTMENT OR FINANCIAL ADVICE, AND CREDIT RATINGS AND MOODY’S PUBLICATIONS ARE NOT AND DO NOT PROVIDE RECOMMENDATIONS TO PURCHASE, SELL, OR HOLD PARTICULAR SECURITIES. NEITHER CREDIT RATINGS NOR MOODY’S PUBLICATIONS COMMENT ON THE SUITABILITY OF AN INVESTMENT FOR ANY PARTICULAR INVESTOR. MOODY’S ISSUES ITS CREDIT RATINGS AND PUBLISHES MOODY’S PUBLICATIONS WITH THE EXPECTATION AND UNDERSTANDING THAT EACH INVESTOR WILL, WITH DUE CARE, MAKE ITS OWN STUDY AND EVALUATION OF EACH SECURITY THAT IS UNDER CONSIDERATION FOR PURCHASE, HOLDING, OR SALE.
MOODY’S CREDIT RATINGS AND MOODY’S PUBLICATIONS ARE NOT INTENDED FOR USE BY RETAIL INVESTORS AND IT WOULD BE RECKLESS FOR RETAIL INVESTORS TO CONSIDER MOODY’S CREDIT RATINGS OR MOODY’S PUBLICATIONS IN MAKING ANY INVESTMENT DECISION. IF IN DOUBT YOU SHOULD CONTACT YOUR FINANCIAL OR OTHER PROFESSIONAL ADVISER.
ALL INFORMATION CONTAINED HEREIN IS PROTECTED BY LAW, INCLUDING BUT NOT LIMITED TO, COPYRIGHT LAW, AND NONE OF SUCH INFORMATION MAY BE COPIED OR OTHERWISE REPRODUCED, REPACKAGED, FURTHER TRANSMITTED, TRANSFERRED, DISSEMINATED, REDISTRIBUTED OR RESOLD, OR STORED FOR SUBSEQUENT USE FOR ANY SUCH PURPOSE, IN WHOLE OR IN PART, IN ANY FORM OR MANNER OR BY ANY MEANS WHATSOEVER, BY ANY PERSON WITHOUT MOODY’S PRIOR WRITTEN CONSENT.
All information contained herein is obtained by MOODY’S from sources believed by it to be accurate and reliable. Because of the possibility of human or mechanical error as well as other factors, however, all information contained herein is provided “AS IS” without warranty of any kind. MOODY'S adopts all necessary measures so that the information it uses in assigning a credit rating is of sufficient quality and from sources MOODY'S considers to be reliable including, when appropriate, independent third-party sources. However, MOODY’S is not an auditor and cannot in every instance independently verify or validate information received in the rating process or in preparing the Moody’s Publications.
To the extent permitted by law, MOODY’S and its directors, officers, employees, agents, representatives, licensors and suppliers disclaim liability to any person or entity for any indirect, special, consequential, or incidental losses or damages whatsoever arising from or in connection with the information contained herein or the use of or inability to use any such information, even if MOODY’S or any of its directors, officers, employees, agents, representatives, licensors or suppliers is advised in advance of the possibility of such losses or damages, including but not limited to: (a) any loss of present or prospective profits or (b) any loss or damage arising where the relevant financial instrument is not the subject of a particular credit rating assigned by MOODY’S.
To the extent permitted by law, MOODY’S and its directors, officers, employees, agents, representatives, licensors and suppliers disclaim liability for any direct or compensatory losses or damages caused to any person or entity, including but not limited to by any negligence (but excluding fraud, willful misconduct or any other type of liability that, for the avoidance of doubt, by law cannot be excluded) on the part of, or any contingency within or beyond the control of, MOODY’S or any of its directors, officers, employees, agents, representatives, licensors or suppliers, arising from or in connection with the information contained herein or the use of or inability to use any such information.
NO WARRANTY, EXPRESS OR IMPLIED, AS TO THE ACCURACY, TIMELINESS, COMPLETENESS, MERCHANTABILITY OR FITNESS FOR ANY PARTICULAR PURPOSE OF ANY SUCH RATING OR OTHER OPINION OR INFORMATION IS GIVEN OR MADE BY MOODY’S IN ANY FORM OR MANNER WHATSOEVER.
MIS, a wholly-owned credit rating agency subsidiary of Moody’s Corporation (“MCO”), hereby discloses that most issuers of debt securities (including corporate and municipal bonds, debentures, notes and commercial paper) and preferred stock rated by MIS have, prior to assignment of any rating, agreed to pay to MIS for appraisal and rating services rendered by it fees ranging from $1,500 to approximately $2,500,000. MCO and MIS also maintain policies and procedures to address the independence of MIS’s ratings and rating processes. Information regarding certain affiliations that may exist between directors of MCO and rated entities, and between entities who hold ratings from MIS and have also publicly reported to the SEC an ownership interest in MCO of more than 5%, is posted annually at www.moodys.com under the heading “Shareholder Relations — Corporate Governance — Director and Shareholder Affiliation Policy.”
For Australia only: Any publication into Australia of this document is pursuant to the Australian Financial Services License of MOODY’S affiliate, Moody’s Investors Service Pty Limited ABN 61 003 399 657AFSL 336969 and/or Moody’s Analytics Australia Pty Ltd ABN 94 105 136 972 AFSL 383569 (as applicable). This document is intended to be provided only to “wholesale clients” within the meaning of section 761G of the Corporations Act 2001. By continuing to access this document from within Australia, you represent to MOODY’S that you are, or are accessing the document as a representative of, a “wholesale client” and that neither you nor the entity you represent will directly or indirectly disseminate this document or its contents to “retail clients” within the meaning of section 761G of the Corporations Act 2001. MOODY’S credit rating is an opinion as to the creditworthiness of a debt obligation of the issuer, not on the equity securities of the issuer or any form of security that is available to retail clients. It would be dangerous for “retail clients” to make any investment decision based on MOODY’S credit rating. If in doubt you should contact your financial or other professional adviser.
For Publications Issued by Moody’s Capital Markets Research, Inc. only:
The statements contained in this research report are based solely upon the opinions of Moody’s Capital Markets Research, Inc. and the data and information available to the authors at the time of publication of this report. There is no assurance that any predicted results will actually occur. Past performance is no guarantee of future results.
The analysis in this report has not been made available to any issuer prior to publication.
When making an investment decision, investors should use additional sources of information and consult with their investment advisor. Investing in securities involves certain risks including possible fluctuations in investment return and loss of principal. Investing in bonds presents additional risks, including changes in interest rates and credit risk.
Moody's Capital Markets Research, Inc., is a subsidiary of MCO. Please note that Moody’s Analytics, Inc., an affiliate of Moody’s Capital Markets Research, Inc. and a subsidiary of MCO, provides a wide range of research and analytical products and services to corporations and participants in the financial markets. Customers of Moody’s Analytics, Inc. may include companies mentioned in this report. Please be advised that a conflict may exist and that any investment decisions you make are your own responsibility. The Moody’s Analytics logo is used on certain Moody’s Capital Markets Research, Inc. products for marketing purposes only. Moody’s Analytics, Inc. is a separate company from Moody’s Capital Markets Research, Inc.