INVESTING IN EARLY CHILDHOOD DEVELOPMENT...Vidya Putcha is a research consultant with the Center for...
44
INVESTING IN EARLY CHILDHOOD DEVELOPMENT WHAT IS BEING SPENT, AND WHAT DOES IT COST? Vidya Putcha Jacques van der Gaag GLOBAL ECONOMY & DEVELOPMENT WORKING PAPER 81 | FEBRUARY 2015 Global Economy and Development at BROOKINGS
Transcript of INVESTING IN EARLY CHILDHOOD DEVELOPMENT...Vidya Putcha is a research consultant with the Center for...

INVESTING IN EARLY CHILDHOOD DEVELOPMENTWHAT IS BEING SPENT, AND WHAT DOES IT COST?
Vidya Putcha Jacques van der Gaag
GLOBAL ECONOMY & DEVELOPMENT
WORKING PAPER 81 | FEBRUARY 2015
Global Economyand Developmentat BROOKINGS

Global Economyand Developmentat BROOKINGS
Vidya Putcha is a research consultant with the Center
for Universal Education at the Brookings Institution.
Jacques van der Gaag is a nonresident senior fel-
low with the Center for Universal Education at the
Brookings Institution.
Acknowledgements:
We would like to thank Tamar Manuelyan Atinc, Emily Gustafsson-Wright, Alain Mingat, Mariavittoria Ballota and
Jan van Ravens for their very helpful feedback and review of this paper. We would also like to thank Amanda
Epstein Devercelli, Harold Alderman, Caridad Araujo, Sunita Kosaraju, Florencia Lopez-Boo, Julian Cristia,
Quentin Wodon and Pia Britto for their valuable inputs.


CONTENTS
Introduction . . . . . . . . . . . . . . . . . . . . . . . . . . . . . . . . . . . . . . . . . . . . . . . . . . . . . . . . . . . . . . . . . . . . . . . . . . .1
What Do We Mean by ECD? . . . . . . . . . . . . . . . . . . . . . . . . . . . . . . . . . . . . . . . . . . . . . . . . . . . . . . . . . . . . . 3
A Framework for Understanding ECD Financing . . . . . . . . . . . . . . . . . . . . . . . . . . . . . . . . . . . . . . . . . . . 4
Expenditures on ECD-Related Services . . . . . . . . . . . . . . . . . . . . . . . . . . . . . . . . . . . . . . . . . . . . . . . . . . . 6
Data Sources . . . . . . . . . . . . . . . . . . . . . . . . . . . . . . . . . . . . . . . . . . . . . . . . . . . . . . . . . . . . . . . . . . . . . . 6
Spending in High-Income Countries . . . . . . . . . . . . . . . . . . . . . . . . . . . . . . . . . . . . . . . . . . . . . . . . . . 7
Spending in Low- and Middle-Income Countries . . . . . . . . . . . . . . . . . . . . . . . . . . . . . . . . . . . . . . . . 9
Financing ECD Services at Scale . . . . . . . . . . . . . . . . . . . . . . . . . . . . . . . . . . . . . . . . . . . . . . . . . . . . . . . . 14
Case Study 1: Scaling Up ECD through Earmarked Revenue: Colombia’s National Payroll Tax . . . . . . . . . . . . . . . . . . . . . . . . . . . . . . . . . . . . . . . . . . . . . . . . . . . . . 15
Case Study 2: Scaling Up ECD through Federal and State Transfers to Municipalities: The Experience of Brazil . . . . . . . . . . . . . . . . . . . . . . . . . . . . . . . . . . . . . . . . . . . . . . . . . . . . . . . . . . . 16
Case Study 3: Scaling Up ECD through Provider and Family Subsidies: Experience Expanding Grade R for Disadvantaged Students in South Africa . . . . . . . . . . . . . . . . . . . . . . . . 16
Case Study 4: Scaling Up ECD through Provider and Input Subsidies: Block Grants in Indonesia . . . . . . . . . . . . . . . . . . . . . . . . . . . . . . . . . . . . . . . . . . . . . . . . . . . . . . . . . . .17
A Note on Spending, Financing Arrangements and Outcomes . . . . . . . . . . . . . . . . . . . . . . . . . . . .17
The Costs of ECD Interventions . . . . . . . . . . . . . . . . . . . . . . . . . . . . . . . . . . . . . . . . . . . . . . . . . . . . . . . . . 18
Methodological Issues Arising in Cost Estimations . . . . . . . . . . . . . . . . . . . . . . . . . . . . . . . . . . . . 18
Variations in Costs Arising from Program Differences . . . . . . . . . . . . . . . . . . . . . . . . . . . . . . . . . 18
The Relationship between Cost and Quality . . . . . . . . . . . . . . . . . . . . . . . . . . . . . . . . . . . . . . . . . . 20
Global Studies of Program Costs . . . . . . . . . . . . . . . . . . . . . . . . . . . . . . . . . . . . . . . . . . . . . . . . . . . . 21
New Initiatives to Better Understand ECD Costing . . . . . . . . . . . . . . . . . . . . . . . . . . . . . . . . . . . . . . . . 22
The UNICEF Regional Prototype . . . . . . . . . . . . . . . . . . . . . . . . . . . . . . . . . . . . . . . . . . . . . . . . . . . . 22
The World Bank’s Early Learning Partnership . . . . . . . . . . . . . . . . . . . . . . . . . . . . . . . . . . . . . . . . . 22
The World Bank Africa Region’s Scaling Up Nutrition Project . . . . . . . . . . . . . . . . . . . . . . . . . . . 24
The World Bank’s Strategic Impact Evaluation Fund . . . . . . . . . . . . . . . . . . . . . . . . . . . . . . . . . . . 24
The Inter-American Development Bank’s Budget Analysis . . . . . . . . . . . . . . . . . . . . . . . . . . . . . . 24
Conclusion and Recommendations . . . . . . . . . . . . . . . . . . . . . . . . . . . . . . . . . . . . . . . . . . . . . . . . . . . . . . 26
The Way Forward . . . . . . . . . . . . . . . . . . . . . . . . . . . . . . . . . . . . . . . . . . . . . . . . . . . . . . . . . . . . . . . . . . 26
Annex 1: The Case of the US . . . . . . . . . . . . . . . . . . . . . . . . . . . . . . . . . . . . . . . . . . . . . . . . . . . . . . . . . . . . 28
Annex 2: The Availability of Unit Cost Estimates for Basic ECD Services . . . . . . . . . . . . . . . . . . . . . 30
Endnotes . . . . . . . . . . . . . . . . . . . . . . . . . . . . . . . . . . . . . . . . . . . . . . . . . . . . . . . . . . . . . . . . . . . . . . . . . . . . 34

LIST OF TABLES
Table 1: 25 Essential Interventions in Early Childhood . . . . . . . . . . . . . . . . . . . . . . . . . . . . . . . . . . . . . . 3
Table 2: A Comparison of Preprimary Coverage Rates and Financing Arrangements . . . . . . . . . . 10
Table 3: Preschool Attendance and Household Spending on Preschool in Selected Samples of Urban Slum Areas . . . . . . . . . . . . . . . . . . . . . . . . . . . . . . . . . . . . . . . . . . . . . . . . . . . . 11
Table 4: Child Health Expenditures in Uganda, Tanzania and Kenya, 2009–10 . . . . . . . . . . . . . . . . . 12
Table 5: Overview of Unit Costs of Roving Caregiver Programs . . . . . . . . . . . . . . . . . . . . . . . . . . . . . 20
Table 6: Elements Characterizing Operation, Cost and Financing, by Types of Services . . . . . . . . 23
Table 7: Costing/Expenditure Analysis Initiatives . . . . . . . . . . . . . . . . . . . . . . . . . . . . . . . . . . . . . . . . . 25
Annex 2: The Availability of Unit Cost Estimates for Basic ECD Services . . . . . . . . . . . . . . . . . . . . . 30
LIST OF FIGURES
Figure 1: Factors in ECD Financing . . . . . . . . . . . . . . . . . . . . . . . . . . . . . . . . . . . . . . . . . . . . . . . . . . . . . . . 5
Figure 2: Number of Countries with Data on Preprimary Spending in the UIS Database, by Income Category, 2010 . . . . . . . . . . . . . . . . . . . . . . . . . . . . . . . . . . . . . . . . . . . . . . . . . . . . . . 6
Figure 3: Average Benefits to Households with Children in 10 OECD Countries (in real 2000 US PPP Dollars) . . . . . . . . . . . . . . . . . . . . . . . . . . . . . . . . . . . . . . . . . . . . . . . . . . 8
Figure 4: Relationship between a Country’s Income and Its Expenditures on Preprimary Education . . . . . . . . . . . . . . . . . . . . . . . . . . . . . . . . . . . . . . . . . . . . . . . . . . . . . . . . . 9
Figure 5: Sources of Financing for Child Health in Uganda, Tanzania and Kenya, 2009–10 . . . . . . 12
Figure 6 . The Central Government’s Social Expenditures in Turkey, by Age Group, 2008 . . . . . . . 13
Figure 7: Unit Costs (in 2010 International Dollars) of Breastfeeding Promotion and Complementary Feeding Education, by WHO Subregion . . . . . . . . . . . . . . . . . . . . . . . . . . . 19
Figure A1 . Composition of Federal Expenditures (2011) on Children by Age Group . . . . . . . . . . . . . 29

INVESTING IN EARLY CHILDHOOD DEVELOPMENT: WHAT IS BEING SPENT, WHAT DOES IT COST? 1
INVESTING IN EARLY CHILDHOOD DEVELOPMENTWHAT IS BEING SPENT, AND WHAT DOES IT COST?
Vidya Putcha and Jacques van der Gaag
In the developing world, more than 200 million chil-
dren under the age of five years are at risk of not
reaching their full human potential because they
suffer from the negative consequences of poverty,
nutritional deficiencies and inadequate learning op-
portunities.1 Given these risks, there is a strong case
for early childhood development (ECD) interventions
in nutrition, health, education and social protection,
which can produce long-lasting benefits throughout
the life cycle.2 The results from the 2012 round of
the Program for International Student Assessment
(PISA)—an international, large-scale assessment that
measures 15-year-olds’ performance in mathematics,
reading and science literacy—demonstrate the ben-
efits of ECD: Students in the countries that belong
to the Organization for Economic Cooperation and
Development (OECD) who had the benefit of being
enrolled for more than one year in preprimary school
scored 53 points higher in mathematics (the equiva-
lent of more than one year of schooling), compared
with students who had not attended preprimary
school.3 Although there is much evidence that ECD
programs have a great impact and are less costly than
educational interventions later in life, very few ECD
initiatives are being scaled up in developing countries.
For example, in 2010, only 15 percent of children in
low-income countries—compared with 48 percent
worldwide—were enrolled in preprimary education
programs.4 Furthermore, even though the literature
points to larger beneficial effects of ECD for poorer
children, within developing countries, disadvantaged
families are even less likely to be among those en-
rolled in ECD programs. For instance, in Ghana, chil-
dren from wealthy families are four times more likely
than children from poor households to be enrolled in
preschool programs.5
One of the major barriers to scaling up ECD interven-
tions is financing. In order to address financing issues,
both policymakers and practitioners need a better un-
derstanding of what is currently being spent on ECD
interventions, what high-quality interventions cost,
and what outcomes these interventions can produce.
If stakeholder groups are made more aware of the
costs of ECD interventions, they may be able to sup-
port decisionmaking on investments in ECD, to better
INTRODUCTION

2 GLOBAL ECONOMY AND DEVELOPMENT PROGRAM
estimate gaps in financing, and to work toward secur-
ing stable funding for scaling up service provision and
for quality enhancement. One of the weakest areas of
ECD policy planning is in the realm of financial plan-
ning.6 Good data are scarce on ECD spending and the
costs of ECD interventions that are useful for program
budgeting and planning; but these data are valuable
for a number of reasons, including the fact that they
support analyses of what different inputs cost and
thus can facilitate considering various alternative
modalities for service delivery. In this paper, we focus
on what data are available to gain a clearer picture of
what is being spent on ECD and what it costs to deliver
basic ECD interventions in developing countries.
ECD interventions come in many varieties, and there-
fore we first define the package of ECD interventions
that have been deemed essential. Then we outline
a framework for better understanding ECD financ-
ing, which combines a top-down approach analyzing
expenditures and a bottom-up approach analyzing
the costs of delivering individual interventions. We
comment on the general methodological issues stem-
ming from these approaches and the limitations of
the data that have been produced. Next, we delve
into the available data and discuss the different fund-
ing sources and financing mechanisms that countries
utilize to deliver ECD services and what patterns exist
in spending. We provide a brief overview of how many
public and private resources in both developed and
developing countries are invested in young children,
and in which specific subsectors. Although these
data on spending illustrate the flows and help us un-
derstand how much is being allocated and by whom,
the data are limited, and this top-down approach
still leaves us with many unanswered questions.
Therefore, we turn our attention to the actual costs
of individual ECD interventions, which help us further
understand what ECD spending can “buy” in different
countries. We identify some trends in the actual costs
of delivering these services, although there are a
number of methodological issues vis-à-vis costing and
the services delivered, which lead to wide variations
between and within countries and make it difficult to
compare programs over time.
Finally, we look at a number of initiatives that are cur-
rently under way to collect better data on ECD costs
and expenditures, which will be useful for countries in
planning programs and identifying funding sources.
These initiatives are sponsored by organizations such
as UNICEF, Save the Children, the World Bank and the
Inter-American Development Bank. Given the gaps in
the available data that we identify and the interven-
tions currently under way, we conclude with recom-
mendations for increasing the knowledge base in this
area for use in policymaking and planning.

INVESTING IN EARLY CHILDHOOD DEVELOPMENT: WHAT IS BEING SPENT, WHAT DOES IT COST? 3
We start by clarifying what we mean by necessary
ECD interventions. In the forthcoming Stepping up
ECD: Investing in Young Children for High Returns,
the World Bank identifies five periods during the early
years for which the delivery of a basic package of
services is essential.7 These packages of intervention
include the family support package, the pregnancy
package, the birth package, the child health and de-
velopment package, and the preschool package. In
total, 25 essential interventions are identified during
these five periods, which include, among others, ante-
natal visits, birth registration, deworming and prepri-
mary education. These packages span the education,
health, nutrition and social protection sectors. As we
move to a discussion of the costs of ECD, we refer to
these 25 essential interventions, which are outlined in
table 1. Although we focus on these 25 essential inter-
ventions, we acknowledge the ongoing debate about
essential ECD services and the specificity of context
in identifying what interventions are necessary in a
given country.
WHAT DO WE MEAN BY ECD?
Table 1: 25 Essential Interventions in Early Childhood
Stage Intervention
1. Family support package (conception to 6 years)
Maternal educationPlanning for family size and spacing Education about early stimulation, growth, and developmentSocial assistance transfer programsPrevention and treatment of parental depressionParental leave and adequate childcareChild protection servicesAccess to health careMicronutrient supplementation and fortificationAccess to safe waterAdequate sanitationHand washing
2. Pregnancy package (conception to birth)
Antenatal careIron and folic acid supplements for pregnant mothersCounseling on adequate diet for pregnant mothers
3. Birth package (birth to 6 months
Skilled attendance at deliveryBirth registrationExclusive breastfeeding
4. Child health and development package (birth to 5–6 years)
ImmunizationsAdequate, nutritious and safe dietTherapeutic zinc supplements for diarrheaPrevention and treatment of acute malnutritionDeworming
5. Preschool package (3 to 6 years)
Preprimary educationContinuity to primary
Source: D. A. Debissa, R. Sayre, Q. Wodon, L. Elder, L. Rawlings, & J. Lombardi., Stepping Up Early Childhood Development: Investing in Young Children for High Returns (Washington: World Bank, 2014).

4 GLOBAL ECONOMY AND DEVELOPMENT PROGRAM
Given that the ECD package to which we are referring
encompasses a range of services that span a number
of sectors, comparing patterns in financing across
countries is challenging.8 We begin with funding
sources for ECD, both public and private. Public fund-
ing may come from central governments, state and
local agencies for education, social protection and
health agencies, integrated programs, or a combina-
tion of these. Private funding may come from house-
holds; from donations by independent entities such
as church groups, nongovernmental organizations
(NGOs) and private companies; and from loans and
grants from donor agencies, such as the World Bank.9
Public and private funding for ECD services are often
interdependent; for example, public funding may only
be available for a narrow portion of the population
with low incomes, requiring private investments for
wealthier families. Programs that receive public fund-
ing may also require private supplements in the form
of user fees.
In addition to looking at sources of funding for ECD,
we want to gain a clearer understanding of what is be-
ing financed. We also want to address various mecha-
nisms that may be utilized to allocate funding for
ECD services. Higher-level government agencies may
provide block grants to lower-level government agen-
cies for the delivery of services. When a grant is made,
there may also be requirements for local governments
to match the grant funding or to raise additional
funds to supplement the grant.10 Or, for example, in
the case of Colombia, a national payroll tax is used
to raise funds for ECD services. Colombia’s central
government then channels funding to public provid-
ers through budget line allocation. In addition, funds
may be allocated to families in the form of vouchers
or allocated to service providers. Several indirect poli-
cies and mechanisms also influence how much public
and private entities spend on ECD services and how
much families receive.11 These policies include, among
others, eligibility rules, amounts required for copay-
ments, parental leave policies and tax regulations.12
Expenditures on education, health, nutrition and so-
cial protection programs tell us which general areas
receive funding. These spending patterns give us an
understanding of priorities and what realistic expecta-
tions may be for future spending. However, spending
on services in these sectors often occurs at multiple
layers of government, complicating the picture. It may
be challenging to calculate expenditures at each level
of government because funding may be transferred
from one level of government to another, causing
double counting. Donors may provide assistance to
governments, and this may be wrongly attributed.13
At the same time, the budgets from which data on ex-
penditures are extracted may include only allocations
rather than actual spending, which in reality may be
far less. Countries may also lack systems to report
information on expenditures, leading to inaccurate re-
porting. In addition, limited financial transparency in a
country can also lead to inaccurate reporting.14 There
may be a substantial leakage of funds allocated as
they pass to service providers. For example, a Public
Expenditure Tracking Survey in Uganda found that
only 13 percent of nonwage recurrent expenditures for
primary education actually reached primary schools.15
Moreover, we not only want to know what is being
spent on these services; we also want a better idea of
the interventions toward which they are directed and
the subgroups that are being reached.
Data on the costs of specific interventions can help in
generating estimates for what is necessary to invest
in providing a particular service. Unit costs, when
combined with information on the coverage of a cer-
A FRAMEWORK FOR UNDERSTANDING ECD FINANCING

INVESTING IN EARLY CHILDHOOD DEVELOPMENT: WHAT IS BEING SPENT, WHAT DOES IT COST? 5
tain service, can help identify what may be required to
scale up an intervention to reach a specified number
of people who lack access. A number of issues arise
in generating and analyzing cost data. For example,
there are different categories of costs that can be
considered, such as investment costs, which may be
related to the physical infrastructure required, such
as a building where preprimary education is deliv-
ered. Operational costs, which include the day-to-day
expenses of delivering services—for example, staff
salaries—also need to be considered. Other costs that
may be considered include those that families incur
as they access services. These types of expenses may
include transportation to and from service facilities
or for supplies such as school uniforms. In addition
to these direct costs, families may need to forgo pay
for work when they attend a health facility to receive
various services.16 And in considering costs, in addition
to varying methodologies, other factors may lead to
wide-ranging estimates between and within countries.
These factors may include program size and quality,
the use of unpaid volunteer labor, the cost of living in
a particular locality where a service is being delivered
and the duration of a program. Figure 1 lays out the
framework described in this section for how we can
organize expenditure and cost data to better under-
stand ECD financing.
Figure 1: Factors in ECD Financing
Expenditure data (examples)• Household spending on
preprimary education
• Central government spending on cash transfer program
Cost data (examples)• Unit cost of
preprimary program
• Unit cost of antenatal visits
Public funding• Central
governments
• Local governments
Private funding• Households
• Corporations
• Donors
Health• Antenatal care
• Immunizations
Education• Preprimary education
• Parenting programs
Social protection• Cash transfers
• Programs for orphans or children with disabilities
Nutrition• Micronutrient
supplementation
• Breastfeeding promotion
ECD Interventions

6 GLOBAL ECONOMY AND DEVELOPMENT PROGRAM
EXPENDITURES ON ECD-RELATED SERVICES
In this section, we discuss in further depth sources of
funding for ECD activities, specific allocations made
for delivering the services encompassed in the basic
package, and actual spending on this basic pack-
age. We start out with a discussion of high-income
countries, after which we turn our focus to low- and
middle-income countries. We end this section with a
comment on the relationship between spending and
outcomes.
Data Sources
We start with a brief review of which expenditure data
are systematically available. Because expenditure data
from private sources are largely unavailable, our focus
is on public spending. In the case of preprimary edu-
cation, the OECD and UNESCO Institute for Statistics
(UIS) collect some data on spending. For 2010, the
UIS database reports government expenditures on
preprimary education as a percentage of gross do-
mestic product (GDP) for 90 countries, out of the 228
included in the database. More than half the countries
for which these data were available were high-income
or upper-middle-income countries. Figure 2 provides a
breakdown of the number of countries by income cat-
egory (using the World Bank’s classification method)
for which the UIS reports these data.
The OECD also collects data on preprimary expen-
ditures for OECD members and other countries that
belong to the Group of Twenty. Among available sys-
tematic sources on preprimary spending, data are
Figure 2: Number of Countries with Data on Preprimary Spending in the UIS Database, by Income Category, 2010
Sources: Authors’ calculations using the UIS database and the World Bank’s income classification criteria—except for those countries for which the UIS reports nil or negligible data on preprimary spending.
3137%
2529%
1720%
1214%
High income Upper middle income Lower middle income Low income

INVESTING IN EARLY CHILDHOOD DEVELOPMENT: WHAT IS BEING SPENT, WHAT DOES IT COST? 7
relatively thin for low- and lower-middle-income coun-
tries. For data on health expenditures, National Health
Accounts (with Child Health Subaccounts) provide fig-
ures on aggregate spending on child health services.
Although these expenditure figures do not exclusively
reflect the basic ECD package of services to which
we are referring, they do shed some light on the re-
sources allocated among various funding sources
for child health. In some cases, Health Accounts
have been constructed with the World Health
Organization’s (WHO’s) technical support or through
support from the Health Systems 20/20 projects of
the US Agency for International Development. These
data are available for a number of different years for
various countries. Because there is no single reposi-
tory of data, it is difficult to obtain the exact number
of countries in a single year for which these data have
been collected. Systematic collection of data is limited
for spending related to a basic ECD package in the
health, education, nutrition and social protection sec-
tors across countries.
Spending in High-Income Countries
According to OECD data, public expenditures on prep-
rimary education accounts for 0.6 percent of the
OECD member countries’ collective GDP. However,
there is variation between countries; for example,
in Australia and Turkey, 0.1 percent or less of GDP is
spent on preprimary education, but 0.8 percent or
more is spent in Denmark, Iceland, Israel, Luxembourg,
Russia and Spain. These differences in spending docu-
mented can largely be explained by the amount of pri-
vate education that is accounted for in these figures,
enrollment rates, legal entitlements and costs, and
starting ages for primary education. Overall, com-
pared with primary, secondary and postsecondary
nontertiary education, preprimary institutions secure
the largest proportion of funds from private sources.17
In a comparative study, Garfinkel and colleagues show
that unit costs for early childhood education (ECE)
across nine rich countries for which data could be ob-
tained, range from $2,010 in the Netherlands (1999)
to $4,030 in Germany (2000). The overall average
across these countries was $2,469.18 Although these
figures help us to better understand what amount
of public expenditures is directed toward preprimary
education at an overall level, it is difficult to use these
data to recommend an appropriate level of spending.
Although no single institution or data source system-
atically collects information on high-income countries’
spending on ECD services other than preprimary
education, comparative studies do exist that look at
spending by age group—though they are also ham-
pered by both conceptual and data problems. Starting
with a narrow definition of expenditures that includes
“cash benefits for families” and “services to families,”
the US spends very little on children compared with
other OECD countries. For the period 1985–2000, per
child in the age group 0–15, the US spent an average
of just 2.4 percent of GDP.19 That puts the US all but
last in a group of 20 OECD countries. Sweden spends
the most, at 22.9 percent of GDP per capita. and Spain
spends the least, at 1.6 percent. However, this picture
changes quite dramatically when tax credits—and,
especially, education expenditures—are included in
the definition of “expenditures on children.” Then the
US ends up in the middle, with 29.6 percent of GDP
per capita spent on the 0–15 age group, while Sweden
stays at the top, with 54.1 percent.
Another big category of expenditures is health care.
A careful study by Julia Isaacs that includes health
expenditures shows that among 10 OECD countries for
which data were available, the US leads when it comes
to government spending on family benefits, educa-
tion, and health; see figure 3.20

8 GLOBAL ECONOMY AND DEVELOPMENT PROGRAM
We see that in the US, education expenditures make
up the single largest component of social expendi-
tures for households with children, with health care
a strong second. In some countries, cash and near-
cash transfers are significantly larger than in the US.
The most recent data available from the OECD show
that, on average, public spending on children age 0–5
years equals 25 percent of the median household
income.21 This percentage increases rapidly for older
children, when expenditures on primary and second-
ary education are included. Expenditures on ECD as
a percentage of all social (public) spending vary from
38 percent in the Czech Republic to about 10 percent
in Switzerland, with the US being second from last, at
11 percent (2007).
Great care needs to be taken when interpreting those
data because they only include central government
spending and non–central government expenditures
are not captured. Still, the variation across countries
is remarkably large. In Hungary, benefits for children
age 0–5—such as cash benefits, tax breaks, and child
care—total almost 70 percent of median household
income, while for Switzerland, the US, Chile and South
Korea such public spending is about 10 percent of me-
dian income. (For a more detailed discussion of expen-
ditures on children in the US, see annex 1.)
Although we are severely hampered by definitional
problems and a lack of data, we can nonetheless
make three generalizations from this brief overview
Figure 3: Average Benefits to Households with Children in 10 OECD Countries (in real 2000 US PPP Dollars)
Note: Garfinkel, Rainwater, Smeeding (2004), table 2. Data are from 2000 (United States, Sweden, Germany, Finland), 1999 (United Kingdom, the Netherlands), 1997 (Canada, Belgium) and 1994 (Australia, France).Source: J. Isaacs, A Comparative Perspective on Public Spending on Children (Washington: Brookings Institution Press, 2009).
0
Uni
ted
Stat
es
Swed
en
Can
ada
Belg
ium
Ger
man
y
Uni
ted
King
dom
Fran
ce
Finl
anad
Net
herla
nds
Aust
ralia
2,000
4,000
6,000
8,000
10,000
12,000Cash and near cash transfers Education Health

INVESTING IN EARLY CHILDHOOD DEVELOPMENT: WHAT IS BEING SPENT, WHAT DOES IT COST? 9
of public spending on children in high-income coun-
tries. First of all, we note the large variations across
countries. Clearly, countries differ in their judgment
of how much the state should provide for children and
how much should be left to households. Expenditure
data from households are largely lacking. Second, the
categories of spending we identified in high-income
countries are very similar across countries: income
support, health and nutrition, and education. And
third, at least for the US, income support and nutri-
tional inputs are relatively stable for the entire age
range from 0 to 5 years, health expenditures are rela-
tively large in the 0–2 age group, and early preschool
costs are an important component for the 3–5 age
group.
Spending in Low- and Middle-Income Countries
In general, we find that government spending on ECD,
specifically reflected in preprimary allocations and
child health services, is minimal in low- and middle-
income countries. In figure 5, we plot the relationship
between income and expenditures on preprimary
education for all countries for which data were avail-
able in 2010. As figure 5 shows, there is a small posi-
tive relationship between a country’s GDP per capita
and its expenditures on preprimary education, but at
every level of income, the variation among countries
is large.
Figure 4: Relationship between a Country’s Income and Its Expenditures on Preprimary Education
Sources: UNESCO Institute for Statistics data; World Bank data.
Exen
ditu
res
on p
repr
imar
y ed
ucat
ion
as a
% o
f GD
P
00 1 2
Log GDP per capita (2010)
R2 = 0.0698
3 4 5 6
0.2
0.4
0.6
0.8
1
1.2
1.4
1.6
1.8
2

10 GLOBAL ECONOMY AND DEVELOPMENT PROGRAM
Table 2 presents information on the coverage of
preprimary education and aspects of the financing ar-
rangements in place for a selected group of low- and
middle-income countries. These data demonstrate
that the share of public funding for preprimary pro-
grams varies across countries, as do the correspond-
ing coverage rates. For example, India and Indonesia
have similar coverage rates, but differ vastly in their
primary sources of funding for preprimary education,
as private funding appears to play a more important
role in Indonesia.22 (One obvious limitation of the ap-
proach of considering overall coverage rates is that
access to services for the most disadvantaged is ob-
scured.) From these data, we conclude that countries
face different circumstances in mobilizing funds for
ECD. Valerio and Garcia identify three factors that
influence resource mobilization for ECD: a country’s
ability to mobilize public resources through politi-
cal capital for ECD, institutional factors that enable
a country to mobilize resources at various levels of
government, and a country’s ability to draw on pri-
vate resources for ECD, which is related to its relative
wealth and the perceived value of ECD.23 This is dem-
onstrated further by a recent report benchmarking
early education across the world, which found that
in many countries where significant efforts are being
made to provide preschool opportunities for all fami-
lies, they are being made despite budgetary difficul-
ties and relatively lower average per capita incomes.24
Table 2: A Comparison of Preprimary Coverage Rates and Financing Arrangements
Country Age Group (years) Coverage (%) Funding Sources (%) Public Funding as % of
GDPIndia 3–5 40 (2006) Public share: 73
Private share: 23 (2003)2.25
Indonesia 5–6 44 (2007) Public share: 5 Private share: 95 (2002)
0.01 (2002)
Jordan 4–5 32 (2007) Public share: 1 Private share: 99 (2002)
Minimally public funded
Mexico 3–5 114 (2007) Public share: 1 Private share: 99 (2002)
0.52
Turkey 3–5 16 (2007) Public share: 99 Private share: 1 (2004)
0.01 (2004)
Source: Adapted from “Comparing Costs of Early Childhood Care and Education Programs: An International Perspective,” by H. Levin and H. Schwartz, Hacienda Pública Española 201 (2012): 39–66.
Household spending on preprimary education can be
significant, even in low- and middle-income countries.
This spending may be allocated to either private or
public programs. For example, though enrollment in
private preprimary education is low in India, public
ECD services require a significant level of cost shar-
ing.25 It appears that households can play a central
role in providing resources for preprimary programs.
A recent four-country scoping study conducted by
the UBS Optimus Foundation found that in one ur-
ban slum area in Kenya, 75 percent of students are
enrolled in preschool, compared with 25 percent in
rural areas. It was estimated in this sample in Kenya
that preschool related costs average $18 per child
per month, accounting for 12 percent of self-reported
household income. Table 3 presents the results of the

INVESTING IN EARLY CHILDHOOD DEVELOPMENT: WHAT IS BEING SPENT, WHAT DOES IT COST? 11
Table 3: Preschool Attendance and Household Spending on Preschool in Selected Samples of
Urban Slum Areas
City Preschool Attendance RatePrivate Preschool Attendance Rate, Among All Preschool Attendees (%)
Household Spending on Preschool-Related Costs
Lagos 70% of 3-year-olds; 90% of 4–6-year-olds attend preschool or primary school
82 $27 per month per child
Accra 70% of 3-year-olds; 90% of 4–6-year-olds attend preschool or primary school
91 $38 per month per child
Nairobi 80% of 4–5-year-olds 94 $18 per month
Johannesburg 60% of 3- and 4-year-olds; 80% of 5- and 6-year-olds attend preschool or primary school
71% of pre-grade R students attend private preschools (pre-grade R targets 3- to 5-year-olds)
$51 per month per child
Sources: UBS Optimus Foundation, “What’s Going on with Nairobi’s Preschoolers?” Optimus Impact, issue 1 (October 2013); UBS Optimus Foundation, “Exploring Early Education Programs in Peri-Urban Settings in Africa: Summary Findings from Johannesburg, South Africa,” Optimus Impact, issue 2 (December 2013); UBS Optimus Foundation, “Exploring Early Education Programs in Peri-Urban Settings in Africa: Summary Findings from Lagos, Nigeria.” Optimus Impact, issue 4 (February 2014); UBS Optimus Foundation, “Exploring Early Education Programs in Peri-Urban Settings in Africa: Summary Findings from Accra, Ghana,” Optimus Impact, issue 3 (January 2014).
scoping study. The parents who were included in this
sample prioritized academic achievement for their
children and believed it to be important in preparation
for primary school, and thus they were motivated to
spend on it.26
Private household spending on preprimary education
raises the issue of the affordability of programs. In
many countries, private preprimary options are very
costly (although private options are not necessarily
higher quality). For example, the average annual cost
of full-day private preschool is almost 67 percent of
per capita income in South Africa and 114 percent of
per capita income in Ghana. Public funding is clearly
important for reaching children at all income levels. In
order to do so, governments may utilize a variety of
financing mechanisms. They may fund programs that
are at no cost to families or provide families or provid-
ers with subsidies.27 Below, we look more closely at
examples of specific financing models that countries
have utilized to enhance access to ECD services.
Next, we consider expenditures on health and nutri-
tion services in low- and middle-income countries.
Data from National Health Accounts’ (NHA) exercises
highlight total health expenditures and the amount
allocated to child health within overall spending es-
timates. Table 4 shows some data from recent NHAs
conducted in Tanzania, Kenya and Uganda. For these
three countries, $20–40 was spent per child on health
in one year by private, public and donor sources of
financing. What is clear is that the amount of health
expenditures dedicated to children under 5 years of
age is disproportionately low compared with this age
group’s share in the overall population.

12 GLOBAL ECONOMY AND DEVELOPMENT PROGRAM
Table 4: Child Health Expenditures in Uganda, Tanzania and Kenya, 2009–10
Measure Uganda Tanzania Kenya Child health expenditures as a % of total health expenditures 14 9.40 8
Percentage of population under 5 years of age 20 15
Child health expenditures as a % of GDP 0.80
Total child health expenditures per child $39 $22 $20
Sources: Department of Policy and Planning, Ministry of Health and Social Welfare, United Republic of Tanzania. Tanzania National Health Accounts Year 2010 with Sub-Accounts for HIV and AIDS, Malaria, Reproductive, and Child Health. (Dar es Salaam: United Republic of Tanzania, 2012).; Ministry of Medical Services, Ministry of Public Health and Sanitation, Republic of Kenya. Kenya National Health Accounts 2009-10. (Nairobi: Republic of Kenya, 2013).; Ministry of Health, Republic of Uganda. National Health Accounts: FY 2008-9 and FY 2009-10. (Kampala: Republic of Uganda, 2013).
Figure 5: Sources of Financing for Child Health in Uganda, Tanzania and Kenya, 2009–10
Sources: Department of Policy and Planning, Ministry of Health and Social Welfare, United Republic of Tanzania. Tanzania National Health Accounts Year 2010 with Sub-Accounts for HIV and AIDS, Malaria, Reproductive, and Child Health. (Dar es Salaam: United Republic of Tanzania, 2012).; Ministry of Medical Services, Ministry of Public Health and Sanitation, Republic of Kenya. Kenya National Health Accounts 2009-10. (Nairobi: Republic of Kenya, 2013).; Ministry of Health, Republic of Uganda. National Health Accounts: FY 2008-9 and FY 2009-10. (Kampala: Republic of Uganda, 2013).
0%
20%
40%
60%
80%
100%
Uganda Tanzania Kenya
Private sources of funding for total child health expendituresDonor contribution to total child health expendituresPublic contribution to total child health expenditures
INVESTING IN EARLY CHILDHOOD DEVELOPMENT: WHAT IS BEING SPENT, WHAT DOES IT COST? 13
Figure 6 displays the breakdown of expenditures com-
ing from public, donor and private sources as identi-
fied in the NHA exercises. Note that the public share is
relatively low in each of these countries.
When we look further at what health services coun-
tries are spending on, we find that little spending is
on preventive services (which account for many of the
interventions highlighted in the basic ECD package).
For example, in Tanzania, only 3.9 percent of expen-
ditures on child health were for preventive or public
health services, while this figure stood at 20 percent
in Uganda.28
Piecing together public expenditure data on educa-
tion and health tells us that spending on children is
disproportionately low in comparison with their share
in the population. Although systematic expenditure
data across sectors on children for low- and middle-
income countries is difficult to find, a study of Turkey,
a middle-income country, found that in 2008, only 6
percent of social expenditures at the central govern-
ment level—which include spending on health, educa-
tion and social protection—accrued to the population
between ages 0–6.29 On the other hand, 25% of ex-
penditure accrued to the population between the ages
45-64 Figure 7 provides a breakdown of social expen-
ditures by age group in Turkey according to this study.
Figure 6. The Central Government’s Social Expenditures in Turkey, by Age Group, 2008
Source: Jesko Hentschel, Meltem Aran, Raif Can, Francisco Ferreira, Jeremie Gingouz, and Arzu Uraz, Life Chances in Turkey: Expanding Opportunities for the Next Generation (Washington: World Bank, 2010).
Ages 0-66.5%
Ages 7-1421.0%
Ages 15-2422.2%
Ages 25-4411.6%
Ages 45-6425.3%
Ages 65+13.4%

14 GLOBAL ECONOMY AND DEVELOPMENT PROGRAM
FINANCING ECD SERVICES AT SCALE
ECD services may be financed through public or pri-
vate sources of funding or a combination of the two. A
country may take a number of approaches in financ-
ing ECD; however, the model utilized will influence the
affordability, equity and efficiency of ECD opportuni-
ties. Grunn identifies several financing models, which
vary based on the origin of funds and the role that
public, private and voluntary actors play in delivering
services with those funds.30 Public funding for ECD
may originate at the central or local levels and may be
directed to providers (i.e., supply financing) or house-
holds (demand financing). Funds may be raised from
general revenues or specifically earmarked taxes, as
is the case in Colombia. In the case of “direct public
supply,” the central government funds and directly
provides the services. In Brazil, the model is “de-
central public supply,” as public funding flows from
the central to the municipal governments and the mu-
nicipal governments provide services directly. In other
cases of supply financing, funds may also be provided
by the government in lump sums or on a per capita
basis to providers, as is the case in South Africa.
Conversely, public funds may be directed to private
providers specifically for inputs, such as teachers,
health workers, training, textbooks, vaccines or infra-
structure. For example, in Indonesia, an ECD program
uses a form of input subsidies, which are directed in
part to teacher training.
At the same time, publicly financed ECD programs
may be available to families based on income, which
is the case in the US, where the Head Start program is
targeted to low-income households (annex 1 provides
more information on the Head Start program). Public
funds may be targeted to families and utilized to off-
set fees for ECD in cofinancing arrangements. This
model is utilized in Sweden, where fees depend on
parents’ income and are capped at a certain amount
per month.31 The four case studies here give snap-
shots of various aspects of ECD financing models in
Colombia, South Africa, Indonesia and Brazil.

INVESTING IN EARLY CHILDHOOD DEVELOPMENT: WHAT IS BEING SPENT, WHAT DOES IT COST? 15
Case Study 1: Scaling Up ECD through Earmarked Revenue: Colombia’s National
Payroll Tax
In 1968, the Colombian Institute for Family Welfare (ICBF) was developed as a semiautonomous
agency affiliated with the Ministry of Health. The ICBF provides integrated services, which include
child care, parent education, protective services and nutritional supplements for pregnant and lac-
tating women, preschools and schools.32 One of the main programs that the ICBF supports is the
Hogares Comunitarios de Bienestar (HCBs), through which children under the age of 6 are offered
care, food and early stimulation in community mothers’ adapted homes.33 The HCBs spend $353.7
per year per child, of which most is spent on food and stipends for the community mothers. In addi-
tion, parents pay fees of around $8.10 per month. This program reaches 1.2 million children across
the country, and it specifically targets vulnerable, low-income populations.
The ICBF was able to finance ECD activities by mobilizing support for the introduction of a 2 percent
national payroll tax in 1974, which was increased to 3 percent in 1988. This payroll tax demands that
all private and public institutions allocate 3 percent of their payrolls to the ICBF. In 2004, the ICBF
received $540,547,000 in tax income, which was close to 0.6 percent of GDP.34
The payroll tax has enabled Colombia to expand investments in vulnerable children. Although we
can look to the payroll tax as a success in mobilizing resources for the scaling up of ECD, it has faced
difficulties such as opposition from private sector leaders. In addition, several ministries within
the country are envious of the payroll tax received by the ICBF, which has increased competition
regarding ECD policies and programs. Although a recent evaluation found that the program has a
substantive impact on children’s nutritional status, because the program targets the most vulner-
able children, many children attending HCBs are still stunted according to international standards.35
These challenges suggest the need for a strong ECD policy, which clearly defines roles among sec-
tors and allows for coordination, while also improving the quality of programs, such as the HCBs.

16 GLOBAL ECONOMY AND DEVELOPMENT PROGRAM
Case Study 2: Scaling Up ECD through Federal and State Transfers to Municipalities:
The Experience of Brazil
In Brazil, municipal governments are primarily responsible for early childhood, primary and lower
secondary education,, while the federal and state governments have primary responsibility for
higher levels of education. Municipalities are required to spend at least 25 percent of revenue on
education, and over 95 percent of public ECE financing is disbursed by municipal governments.36
Municipal governments pay into a state fund, which is then redistributed to municipalities based
on the number of enrolled public school students. If the funds redistributed do not reach a certain
minimum threshold, the federal government makes up the difference. Thus, a significant share of
municipalities’ expenditures on ECE originates from transfers from state and federal governments.
Municipalities in 2010 were guaranteed to receive $873 for each child enrolled in a public full-day
crèche and $912 for each child in a full-day preschool. Municipal expenditures per child vary across
regions, and in some regions are less than the guaranteed minimum that the federal government
ensures. This gap in expenditures suggests that financial barriers are not the only obstacles to pro-
viding ECD opportunities, and that issues related to parental demand may also play a role.
Case Study 3: Scaling Up ECD through Provider and Family Subsidies: Experience
Expanding Grade R for Disadvantaged Students in South Africa
In South Africa, the preprimary or “reception year” (known as Grade R) for age 5 students has been
substantially scaled up. Although there were some classes in operation before 2001, Grade R be-
came official through policy in 2001. As a result, enrollment in Grade R in public schools increased
from 226,630 in 2000 to 487,525 in 2008, covering 49 percent of eligible children. In addition,
another 200,000 children were estimated to be registered in Grade R classes at community-based
facilities.37 In 2012, the gross enrollment ratio for preprimary education in South Africa was 76 per-
cent.38
Grade R is funded via two different mechanisms. First, provincial governments fund grants to com-
munity-based ECD centers on a per learner basis, reaching areas where other ECD opportunities
are unavailable. Funding via this mechanism was slated to reach a maximum of 135,000 children.
Second, Grade R in public primary schools is financed by a poverty-targeted grant-in-aid per stu-
dent, which ranges from $0.20 to $0.60 per student per day for 200 school days. Up to 30 students
in a school can receive this subsidy, which is spent on educator costs, learning materials, training,
furniture, nutrition and educational equipment. In addition to funding Grade R, means-tested sub-
sidies are provided for students ages 0 to 4 to attend ECD centers. Although these mechanisms
have helped in reaching vulnerable children, additional financing is necessary.39 In 2005–6, it was
estimated that ECD accounted for only 0.7 percent of the total education budget, which must be
increased in order to improve the quality of services and reach more children.

INVESTING IN EARLY CHILDHOOD DEVELOPMENT: WHAT IS BEING SPENT, WHAT DOES IT COST? 17
Case Study 4: Scaling Up ECD through Provider and Input Subsidies: Block Grants in
Indonesia
Since 2002, the Ministry of National Education (MONE) in Indonesia has funded block grants to
encourage private sector participation in ECD provision. These grants are used as seed funds by
private and nonprofit organizations to expand their operations. These grants support both formal
and nonformal ECD programs. Between 2002 and 2005, the MONE Directorate of Early Childhood
Education provided continuing block grants to 4,000 ECE institutions and new block grants to
3,000 new initiatives. The grants varied in amount—for example, for kindergarten and child care
programs, grants totaled $3,000, whereas grants for informal health services, known as Poysandu
programs, totaled $300. These grants only supported a portion of provider costs.
Since 2007, the World Bank has supported a project in 3,000 villages in 50 districts to support
ECE development. (An impact evaluation was conducted alongside this project.)40 The project has
three components: (1) community sensitization to importance and benefits of ECE development
and training on how to submit a proposal for using project funds; (2) block grants of $18,000 over
three years to set up and operate two ECE development centers; and (3) teacher training of 200
hours each to one teacher and one child development worker per center. A recent impact evaluation
found that the combination of raising community awareness and the opening of additional centers
led to an enrollment rate that was 5.6 percentage points higher in treatment villages. In addition,
children who enrolled in ECE development programs showed significantly higher levels of physical,
socioemotional and cognitive development than those who did not.
A Note on Spending, Financing Arrangements and Outcomes
Expenditures on ECD are low overall, and targets must
be raised. Vargas-Baron suggests that nations should
devote at least 0.5 to 1 percent of GDP to parent and
ECE and at least 0.3 to 0.5 percent to maternal and
child health care.41 At the same time, it is recognized
that cross-country recommendations about spending
and effective financing arrangements are difficult to
make, given the limited comparability of data, which
has been demonstrated in this paper, as well as vary-
ing country contexts. No single financing strategy will
be effective for all countries in achieving particular
enrollment levels or outcomes later in life. For ex-
ample, in Kenya, private sources of funding are the
most prevalent for preprimary programs because
households bear 95 percent of the costs. However,
the country’s overall gross enrollment rate was 51 per-
cent in 2009.42 In other countries, such as the United
Kingdom, families are the largest contributor of fund-
ing for ECD programs, yet it enjoys full enrollment.43
However, this high enrollment is made possible by a fi-
nancing model in which child tax credits and child care
allowances are provided on a means-tested basis to
parents.44 In addition to making the case that higher
spending is needed, as well as efforts to explore
various financing models for delivering ECD, the wide
variation of definitional and conceptual issues that
we encounter make a case for initiatives that more
systematically analyze government spending on ECD
services, which in turn will enable policymakers to bet-
ter identify sources of funding and financing options.

18 GLOBAL ECONOMY AND DEVELOPMENT PROGRAM
In this next section, we turn to a discussion of the
costs of delivering essential services in early child-
hood. This section considers methodological issues
in estimating costs, as well as what factors influence
variation in the data, as mentioned in an earlier sec-
tion. Annex 2 demonstrates the data on unit costs
for the 25 essential interventions identified and com-
ments on the general availability of cost data for each
specific intervention.
Methodological Issues Arising in Cost Estimations
Methodological issues in estimating costs may lead to
variation in unit costs identified for programs. For ex-
ample, programs may utilize voluntary labor or teach-
ers who are paid low salaries, which may be dealt with
in different ways in cost calculation. In addition, com-
plications arising from how to treat capital and costs
related to program development may also contribute
to this variation.45
For example, a recent study undertaken by the Inter-
American Development Bank (IDB) identified the costs
of programs delivering child care services to children
ages 0 to 3 through institutional and community mo-
dalities and parenting support programs. Based on
financial information about the programs’ income
and expenditures, wages paid to employees, and the
fees charged to the families utilizing the services,
the study researchers estimated the annual cost per
child of these programs.46 The average annual cost
per child of the child care service programs studied
was $1,239, although this figure ranged from a low
of $26 to a high of $3,264 for individual programs.
Accurately estimating the actual cost of delivering
such programs was complicated by the fact that many
staff members worked on a volunteer basis or only
received small stipends. For example, in 27.6 percent
of child care programs in this sample, staff were either
volunteers or worked for only a stipend. Staff working
on a volunteer basis were even more prevalent in the
parenting programs identified in this sample, as only
16.7 percent of the staff members in the parenting
programs analyzed had an employment relationship
with the programs. (The range of costs per child for
the parenting programs in this sample were between
$13 and $599.47) Another issue encountered was that
some programs collect contributions from parents,
although they may not be officially allowed to do so,
given the arrangements of the public funding they
receive.
Variations in Costs Arising from Program Differences
In addition, variation in cost estimates may reflect the
quality of program inputs. For example, staff salaries
are often the costliest part of preprimary programs,
making child/staff ratios and a country’s per capita
GDP indicators of overall cost.48 Similarly, in terms
of health services, antenatal care is more expensive
in Ghana if a trained doctor administers services as
opposed to another type of health care worker.49 In
the IDB study described above, it was found that pro-
grams with higher standards and requirements for ed-
ucation were more expensive, because they needed to
offer higher staff salaries.50 In the Roving Caregivers
Programs (RCPs) in the Caribbean Islands, staff wages
were found to increase as the program became more
integrated within governments, given higher stan-
dards for the wages of government officials in com-
parison with those of NGO workers.
THE COSTS OF ECD INTERVENTIONS

INVESTING IN EARLY CHILDHOOD DEVELOPMENT: WHAT IS BEING SPENT, WHAT DOES IT COST? 19
Other factors that may influence costs include the
area where services are being delivered. For example,
Bhutta and colleagues found that the unit costs for a
selected number of child and maternal nutrition inter-
ventions were higher in Africa compared with other
regions due to the higher labor costs and the extra
travel time required there to deliver services.51 Extra
time for delivery using outreach was required due
to lower population densities in many areas and the
lower coverage of primary care facilities. Conversely,
it is possible that some aspects of programs are less
costly in rural areas due to the lower wages paid
to staff. Figure 7 shows the unit costs estimated
for various subregions (as defined by the WHO) for
breastfeeding promotion and complementary feed-
ing education interventions. One of the assumptions
made by the researchers in estimating these costs
was that the base delivery platform for delivering
these services was outreach programs in Sub-Saharan
Africa, and primary health clinics in other regions.
Figure 7: Unit Costs (in 2010 International Dollars) of Breastfeeding Promotion and Complementary Feeding Education, by WHO Subregion
Source: Z. Bhutta, J. Das, A. Rizvi, Lancet Nutrition Interventions Review Group, Maternal and Child Nutrition Study Group et al., “Evidence-Based Interventions for Improvement of Maternal and Child Nutrition: What Can Be Done and at What Cost?” 2013, http://thousanddays.org/wp-content/uploads/2013/06/Nutrition2_p40_65.pdf.
0Breastfeeding promotion Complementary feeding education
2
4
6
8
10
12
14
16
18
Uni
t Cos
ts (i
n 20
10 In
tern
atio
nal D
olla
rs)
Africa (high child, high adult mortality)
Africa (high child, very high adult mortality)
Southeast Asia (low child, low adult mortality)
Southeast Asia (high child, very high adult mortality)
Americas (high child, high adult mortality)
Eastern Mediterranean (high child, high adult mortality)
Western Pacific (low child, low adult mortality)

20 GLOBAL ECONOMY AND DEVELOPMENT PROGRAM
In addition, program size has an impact on costs.
For instance, small-scale ECD programs may have
higher unit costs.52 A cost analysis of the RCPs for five
Caribbean Islands found that the cost per child of the
parenting initiative was $900 per child in Dominica,
where 187 children were enrolled in the program, but
$58 in Jamaica, where 1,410 children were enrolled
(table 6). One reason for this reduction in unit costs
was that overhead costs decreased per child as the
number of children participating increased.53 It should
be noted, however, that reaching the same scale is
not possible in all programs. For example, Dominica’s
rugged terrain makes it difficult for rovers in the RCP
to reach as many children as are reached in Jamaica.
Another factor allowing for a reduction in overhead
costs in Jamaica is the institutional arrangement of
the RCP, which is conducted in collaboration with an
NGO, which has enabled cost sharing.
Table 5: Overview of Unit Costs of Roving Caregiver Programs
Country Total Cost (per year, 2008 US dollars) No. of Children Unit Cost (per child per
year, 2008 US dollars)Dominica 168,460 187 900
St. Lucia 174,822 294 594
Grenada 194,464 299 650
St. Vincent and Grenadines 149,723 360 416
Jamaica 82,377 1,410 58
Total 769,846 2,550 302
Total (excluding Jamaica) 687,469 1,140 603
Source: J. van Spijk, M. Groot Bruinderink, W. Janssens and J. van der Gaag, “Cost-Benefit Analysis of the Roving Caregivers Programme: A Study on the Costs and Benefits of RCP in Dominica, Grenada, Jamaica, St. Lucia and St. Vincent and the Grenadines,” Amsterdam Institute for International Development, 2010.
Program duration is also one of the main factors
contributing to variation in unit costs of preprimary
programs. Due to the differing number of hours of the
program, programs of equal quality in terms of train-
ing, teacher pay and class size may differ by a factor
of 4 for unit cost.54
The Relationship between Cost and Quality
So far, our discussion of the costs of ECD services has
identified quality to be a factor influencing variability
in the data both between and within countries. Higher-
quality inputs appear to cost more—for example, a
study looking at the costs of various components of
ECD programs in Latin America and the Caribbean
describes this relationship. In the sample of programs
studied, those requiring a minimum level of education
for staff members paid higher salaries, which were
necessary to attract such individuals.55 Although it
may be fairly straightforward to suggest that higher-
quality inputs cost more, we want to understand
whether cost influences the quality of the services
provided and outcomes attained.
A study by the University of Colorado—Cost, Quality,
and Child Outcomes in Child Care Centers—analyzed
child care centers in four states of the US and ex-

INVESTING IN EARLY CHILDHOOD DEVELOPMENT: WHAT IS BEING SPENT, WHAT DOES IT COST? 21
plored this relationship between cost and quality.56
The researchers collected in-depth financial infor-
mation on child care centers, as well as program
characteristics. In addition, they used observation
instruments to assess the quality of care provided for
children and teacher involvement, and also conducted
individual child assessments to identify development
outcomes. In terms of cost and quality, the study
found that even average-quality care was costly to
provide. For example, providing what was identified
as “mediocre care” required $409 per month for 45
hours of care per week. In this study, states with more
stringent licensing standards had fewer poor-quality
centers, although these standards may have reduced
the availability of a center’s care or increased its cost.
At the same time, the study found that even though
better-quality services cost more to provide, the dif-
ference in cost is not large.
Given these data, we understand the need for the
quality of service delivery to be considered carefully.
As we are identifying the costs of providing certain
benefits to children and families, we need to keep in
mind that even if a certain amount of money is spent
on delivering a service, there are a number of other
factors that influence the quality of the service pro-
vided and the outcome. In the University of Colorado
study, for example, it was found that child care in one
in eight centers threatened the health and safety of
children. Factors other than specific costs, such as
the effectiveness of a center’s administrator, were
important in influencing child care quality. In addition,
the study found that child care centers were able to
balance the costs of quality of inputs in order to keep
costs down. The study found that centers reduce the
amount of hours of labor employed if the wage rate of
that type of labor increases and substitute between
different categories of staff to produce the same
amount of services of the same quality. Although
many of these results indicate a complex, nonlinear
relationship between cost and quality, it cannot be
ignored that access to resources can improve quality.
For example, in this study, centers that received more
in-kind donations or funding from diverse sources
were able to use those resources to increase their
quality.
Global Studies of Program Costs
In addition to those cost estimates resulting from
the work of individual researchers, there have been
global initiatives researching the costs of ECD inter-
ventions. For example, the Disease Control Priorities
Project provides policy recommendations to reduce
the global disease burden by focusing on the question
of the cost-effectiveness of interventions in health
and nutrition. The upcoming third edition of the proj-
ect’s publication, Disease Control Priorities Project
3, will expand on the cost-effectiveness work done
through the two earlier editions, and will include cost-
effectiveness research in a number of areas, including
maternal and child health and nutrition.57
Another initiative, the Copenhagen Consensus, brings
researchers together to identify solutions to global
development challenges by focusing on the cost-
effectiveness of investments. In various papers pub-
lished through this project, cost data and research on
cost-effectiveness of interventions have been com-
piled for a number of interventions that are included
in basic ECD package that we have defined, including
micronutrient supplementation, deworming, access to
safe water and immunizations.58

22 GLOBAL ECONOMY AND DEVELOPMENT PROGRAM
In order to address financing constraints, which limit
the scaling up of ECD services, we need systematic
data collection on spending. Although the data cur-
rently available are limited, fortunately, a number of
promising initiatives have been recently completed
and others are under way to better understand the
costs of and financing needs for providing ECD ser-
vices at scale. Some approaches start with identifying
the costs of delivering individual interventions, while
others look more closely at overall spending levels.
(Annex 2 lists the interventions and the current status
of available cost data.)
The UNICEF Regional Prototype
The UNICEF Regional Prototype study in West and
Central Africa, collects data on the costs of prepri-
mary and parenting programs (where available) and
develops various scenarios for scaling up. The coun-
tries currently involved include Sierra Leone, Togo
and Cape Verde. Combining data from the Ministry of
Education in Sierra Leone on the enrollment of chil-
dren in preschool programs (13 percent overall) and
the distribution among the different types of institu-
tions providing the service (which influence the cost
make-up) and data on program costs collected from
a sample of programs, Mingat estimates the aggre-
gate costs for preschool at the country level in 2010.59
These estimates are developed by simulating all the
costs of the resources needed for each type of institu-
tion delivering the service. Costs considered include
the salaries of different types of staff (trained teach-
ers, untrained teachers, helpers and support staff),
pedagogical consumables and social activities. Table 7
provides the framework utilized in analyzing the costs
of these programs. This framework is very compre-
hensive, including both public and private sources of
funding and using a detailed breakdown of the various
cost categories.
Given estimates that in 2010, 1.6 percent of Sierra
Leone’s recurrent budget for the education sector
was spent on ECD and the country’s current level of
political support for ECD, Mingat estimates that 6–7
percent of public recurrent spending could be mobi-
lized for ECD in 2025. Furthermore, the total capital
cost of the ECD program is estimated in different
scale-up scenarios, which vary the amount of public
recurrent resources that could be mobilized for ECD
programs in 2025 and the coverage rate that could
be achieved. In these various scenarios, quality is also
varied. For example, the scenarios vary the number of
trained teachers, number of years of preschool and
number of days over the year that the program is ad-
ministered. This scale-up plan will help policymakers
in Sierra Leone understand the financing gap they
face and their different options for increasing the cov-
erage of ECD services.60
The World Bank’s Early Learning Partnership
The World Bank’s Early Learning Partnership in the
institution’s Africa region is developing costed im-
plementation plans, in coordination with UNICEF in
some countries, that consider the scaling up of the
ECD services presently available in various countries.
Considering these ECD services, the plans will iden-
tify a range of service delivery models and costs per
unit in order to identify financial and other needs for
potential scaling up. The audience for these costed
implementation plans includes policymakers as well
as external funders, such as foundations. This work
will pay special attention to urban areas, as well as
services delivered at the level of municipalities. An
initial part of the process includes conducting surveys
in small samples of center-based programs to better
identify the costs involved.
NEW INITIATIVES TO BETTER UNDERSTAND ECD COSTING

INVESTING IN EARLY CHILDHOOD DEVELOPMENT: WHAT IS BEING SPENT, WHAT DOES IT COST? 23
Table 6: Elements Characterizing Operation, Cost and Financing, by Types of ServicesFormal
Com
mun
ity
TotalPublic
Private
Mission Individual
Enrollment3,161 14,161 15,318 4,222 36,862
Paid by Paid by Paid by Paid by Paid by
Source of financing Govt Users Total Govt Users Total Govt Users Total Users Govt Users Total
TeachersTrained 85 0 85 379 0 379 61 349 410 0 525 349 874Unqualified 51 0 51 228 0 228 0 247 247 181 279 428 707Total 135 0 135 607 0 607 0 657 657 181 742 838 1,580
Student teacher ratio 23.4 23.3 23.3 23.3 23.3Support Staff
Helpers 0 56 56 0 253 253 0 274 274 75 525 349 658Other 0 43 43 0 254 254 0 257 257 60 279 428 614Total 0 99 99 0 507 507 0 531 531 135 742 838 1,272
Student Support Staff Ratio 31.9 27.9 28.8 31.2 29.0Monthly salary cost (000 Le)
Trained teacher 500 500 500 700Unqualified teacher 300 300 400 200Helper 200 200 200 150Other support staff 150 150 150 100
Spending on salaries (millions Le)Teachers
Trained teachers 500 500 500 700Unqualified teacher 300 300 400 200Total spending on teachers 694 0 694 3,095 0 3,095 366 4,117 4,483 651 4,154 4,769 8,923
Support staffHelpers 0 135 135 0 607 607 0 657 657 136 0 1,535 1,534Other support staff 0 179 179 0 912 912 0 955 955 162 0 2,209 2,209
Total spending on support staff 0 314 314 0 1,519 1,519 0 1,611 1,611 298 0 3,743 3,743Total spending on salariesPedagogical consumablesAmount/student/year (Le) 0 9,000 9,000 0 6,000 6,000 0 20,000 20,000 6,000 0 12,075 12,075
Aggregate Amount (million Le) 0 28 28 0 85 85 0 306 306 25 0 445 445Social activities
School mealsCost of meal (Le per day) 0 1,500 1,500 0 1,500 1,500 0 1,500 1,500 1,000 0 1,443 1,443Number of days per year 0 90 90 0 90 90 0 90 90 90 0 90 90% targeted 0 30% 30% 0 30% 30% 0% 30% 30% 30% 0% 30% 30%
Aggregate spending (million Le) 0 128 128 0 574 574 0 620 620 114 0 1,436 1,436Others (ceremonies, sports...)
Amount/student/year 0 100 100 0 100 100 0 200 200 50 0 135.8 135.8Aggregate spending (million Le) 0 316 316 0 1,416 1,416 0 3,064 3,064 211 0 5,007 5,007Total social activities (milion Le) 0 444 444 0 1,990 1,990 0 3,684 3,684 325 0 6,443 6,443Total spending (million Le)
Pedagogical elements 694 343 1,036 3,095 1,604 4,699 366 6,035 6,401 975 4,154 8,957 13,111Social activities 0 444 444 0 1,990 1,990 0 3,684 3,684 325 0 6,443 6,443
Total spending 694 787 1,480 3,095 3,594 6,689 366 9,719 10,085 1,300 4,154 15,400 19,554Spending per student (Le)
Pedagogical component 219,551 108,488 328,039 218,544 113,288 331,832 23,893 393,984 417,877 179,499 112,701 237,101 349,797Social component 0 140,500 140,500 0 140,500 140,500 0 240,500 240,500 77,000 0 174,782 174,782
Total per student spending 219,551 248,988 468,539 218,544 253,788 472,332 23,893 634,484 658,377 256,499 112,701 411,885 524,579
Source: A. Mingat, Technical Note Identifying Scenarios for the Medium-Term Development of ECD Activities in Sierra Leone (New York: UNICEF, 2013).
24 GLOBAL ECONOMY AND DEVELOPMENT PROGRAM
The World Bank Africa Region’s Scaling Up Nutrition Project
At the same time, through the Strengthening Scaling
Up Nutrition Analytics and Planning in Africa proj-
ect, which is supported by the & Melinda Gates
Foundation, country-led planning, costing and moni-
toring activities are under way to scale up nutrition
interventions in six to nine high-burden countries,
including Nigeria, Togo, Zambia and Mali. The costed
scale-up plans for nutrition propose different options
for these countries based on different packages of
interventions, the malnutrition burden at subna-
tional levels, and local epidemiology, and the context.
Recommendations for implementation are then pro-
vided based on cost-effectiveness for a certain level
of public investment. (Cost-effectiveness is measured
in terms of the least cost per disability-adjusted life
years, DALYs, saved and the most number of lives
and DALYs saved annually.) For example, based on the
number of DALYs saved per dollar in these scenarios,
it was recommended that Nigeria scale up a limited
package of interventions in the country’s 16 highest-
burden states.61 Exercises such as this one are use-
ful in identifying funding requirements for nutrition
interventions in ECD and in helping set policy priori-
ties. Beyond identifying financing requirements, fiscal
space analysis conducted in conjunction with costing
exercises can make data the most useful because the
funding required for scaling up may be far lower than
what is available in a country’s budget. Fiscal space
analysis can help identify additional sources of do-
mestic and external financing.
The World Bank’s Strategic Impact Evaluation Fund
Through the Strategic Impact Evaluation Fund (SIEF),
the World Bank is conducting impact evaluations of
projects that aim to improve early childhood nutrition,
health and development outcomes. As part of these
impact evaluations, SIEF is requiring the collection of
cost information to analyze the cost effectiveness of
interventions studied.
The Inter-American Development Bank’s Budget Analysis
Other projects under way include an initiative at the
IDB related to a forthcoming publication on the early
childhood years, taking a top-down approach to ana-
lyzing budget data in ministries that deliver ECD ser-
vices. This project intends to explain overall national
spending on ECD services in 12 Latin American coun-
tries by looking at budget lines in relevant ministries
for education, nutrition, conditional cash transfers
and health. Given the complexity of collecting subna-
tional data, the project is focusing on countries where
ECD services receive greater funding at the national
level. Although there is much heterogeneity in the
data, initial estimates from the program suggest that
countries appropriate over 2 percent of GDP on aver-
age to ECD services. Another recent initiative includes
a paper prepared for the IDB, in which Raquel Bernal
defines a basic benefit package for ECD, which in-
cludes 11 interventions for mothers and children ages
0 to 5. Bernal estimates the costs of providing this
package in Colombia to be $6,119 per child.62 As initia-
tives such as these progress and expand in scale, it will
be possible to answer additional questions about ECD
spending and the costs of delivering services. These
initiatives provide promise for the future availability
of data on costs and spending that can enable more
accurate policy planning forfinancing initiatives. This
and the other initiatives described here are summa-
rized in table 8.

INVESTING IN EARLY CHILDHOOD DEVELOPMENT: WHAT IS BEING SPENT, WHAT DOES IT COST? 25
Table 7: Costing/Expenditure Analysis Initiatives
Organization/Initiative Summary of Work Costs Considered Countries/RegionUNICEF Regional Prototype
Costing of preprimary education and parenting programs in various scale-up scenarios taking into account factors related to quality of inputs as well as amount of financing available for programs
Capital and recurrent costs
Mauritania, Cape Verde, São Tomé and Príncipe, Congo Brazzaville, Togo, Sierra Leone, Guineau Bissau, Niger, Senegal, Guinea
Inter-American Development Bank
Analysis of central government budget allocations to ECD
Costing of home-visting, day-care, and preschool programs
Costs related to elements of structural and process quality
Mauritania, Cape Verde, São Tomé and Príncipe, Congo Brazzaville, Togo, Sierra Leone, Guineau Bissau, Niger, Senegal, Guinea
World Bank Africa Region: Health, Nutrition and Population Sector; Scaling Up Nutrition Project
Costing evidence-based nutrition interventions and developing scale-up plans in conjunction with fiscal space analysis
Nigeria, Togo, Zambia, Mali
World Bank Africa Region: Education Sector; Early Learning Partnership
Costing scale-up plans of ECD services already in place in countries
Gambia, Sierra Leone, Sudan, Uganda, Kenya, Madagascar
World Bank Strategic Impact Evaluation Fund (SIEF)
Costing interventions for which an impact evaluation is under way in early childhood nutrition, health and development
Source: J. van Spijk, M. Groot Bruinderink, W. Janssens and J. van der Gaag, “Cost-Benefit Analysis of the Roving Caregivers Programme: A Study on the Costs and Benefits of RCP in Dominica, Grenada, Jamaica, St. Lucia and St. Vincent and the Grenadines,” Amsterdam Institute for International Development, 2010.

26 GLOBAL ECONOMY AND DEVELOPMENT PROGRAM
The main conclusion that we can draw from this re-
view of the available evidence on costing of and ex-
penditures for ECD may appear to be disheartening:
We have a long way to go before we will have suf-
ficiently robust data to form the basis for producing
reliable estimates about the total costs of scaling up
ECD interventions. For instance, estimates of cost per
child of such a well-defined intervention as preschool-
ing can range from $18 per month (in Kenya) to $51 (in
South Africa). The Head Start program in the US costs
more than $600 per child per month. There are good
explanations for such large differences, including the
income statuses (and thus salary levels) of the coun-
tries, the contents of the programs and the contexts
within which these programs are being implemented.
For example, the RCPs that have been implemented
in the Caribbean are well defined and homogeneous.
Still, their annual costs per child range from $58 to
$900, depending on which island the program is lo-
cated.
A second conclusion is more positive: The need for
more and better ECD cost data is widely recognized,
and good progress is being made on some ongoing
initiatives. Although these initiatives use different
approaches, their results will provide major contribu-
tions to our body of knowledge on ECD costing.
A number of observations are worth repeating.
Although good government data on child-related ex-
penditures are useful, they can tell us little about the
unit costs of providing these services, unless detailed
eligibility and participation data are available. The pic-
ture becomes more complicated when various layers
of governments are involved, and it is still incomplete
unless private expenditures are added. At the same
time, we know that more spending does not always
mean better quality and that priorities and norms re-
garding social contracts vary by country.
Currently, newer forms of ECD financing are being
proposed when looking at various options to scale up
existing ECD interventions. For instance, the Center
for Universal Education (CUE) at Brookings is cur-
rently conducting a study to examine the feasibility of
impact investing mechanisms—in particular, a social
impact bond to address the financing and delivery
constraints for ECD in developing countries. However,
for such options to be viable, the scaling-up ECD
scenarios need to be based on reliable and compre-
hensive cost data that are program specific (and thus
include quality objectives) and context specific.
The Way Forward
Building on the available evidence—and taking note of
the ongoing initiatives by UNICEF, the World Bank, the
IDB and organizations—it seems likely that the way
forward needs to include the following elements:
• Adopt a clear definition of what we mean by “an
ECD program.” The World Bank’s list of 25 essential
interventions already provides a starting point.
• Repeat and expand initiatives such as the UNICEF
Regional Prototype study to include other regions
and settings. Include detailed analyses of the
causes behind the large variations in cost outcome
among programs, countries and regions.
• Encourage national and local governments to pro-
vide breakdowns by age group of health, education,
CONCLUSION AND RECOMMENDATIONS
INVESTING IN EARLY CHILDHOOD DEVELOPMENT: WHAT IS BEING SPENT, WHAT DOES IT COST? 27
nutrition and other relevant program budgets, with
a special focus on the very young.
• Given existing gaps in the data, identify ways to col-
lect information on household expenditures on ECD
services.
• Over time, develop guidelines and benchmarks for
how much countries need to invest in the age group
0 to 5. The level of this (necessary) spending is
likely to vary by the level of income of the country,
while the division of public and private spending will
also be very country specific.
• Hold regular meetings among all the major ac-
tors to learn from the outcomes of the ongoing
initiatives, and gradually develop a comprehensive
framework and methodology for ECD costing that
can produce the data necessary to construct the
budgets for scaling up ECD programs.
• Pilot the costing methodology developed in se-
lected countries and produce case studies based on
the findings.
• Develop new and innovative ways to combine the
public and private resources necessary to make
scaled up ECD programs a reality.
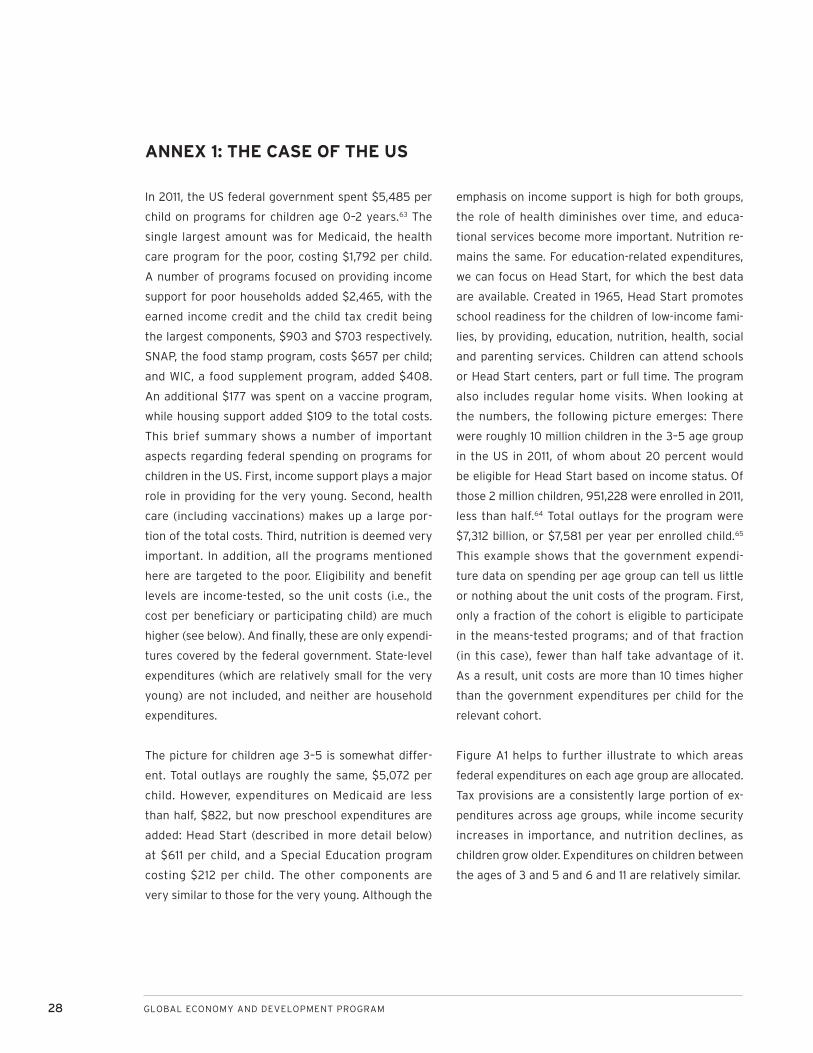
28 GLOBAL ECONOMY AND DEVELOPMENT PROGRAM
In 2011, the US federal government spent $5,485 per
child on programs for children age 0–2 years.63 The
single largest amount was for Medicaid, the health
care program for the poor, costing $1,792 per child.
A number of programs focused on providing income
support for poor households added $2,465, with the
earned income credit and the child tax credit being
the largest components, $903 and $703 respectively.
SNAP, the food stamp program, costs $657 per child;
and WIC, a food supplement program, added $408.
An additional $177 was spent on a vaccine program,
while housing support added $109 to the total costs.
This brief summary shows a number of important
aspects regarding federal spending on programs for
children in the US. First, income support plays a major
role in providing for the very young. Second, health
care (including vaccinations) makes up a large por-
tion of the total costs. Third, nutrition is deemed very
important. In addition, all the programs mentioned
here are targeted to the poor. Eligibility and benefit
levels are income-tested, so the unit costs (i.e., the
cost per beneficiary or participating child) are much
higher (see below). And finally, these are only expendi-
tures covered by the federal government. State-level
expenditures (which are relatively small for the very
young) are not included, and neither are household
expenditures.
The picture for children age 3–5 is somewhat differ-
ent. Total outlays are roughly the same, $5,072 per
child. However, expenditures on Medicaid are less
than half, $822, but now preschool expenditures are
added: Head Start (described in more detail below)
at $611 per child, and a Special Education program
costing $212 per child. The other components are
very similar to those for the very young. Although the
emphasis on income support is high for both groups,
the role of health diminishes over time, and educa-
tional services become more important. Nutrition re-
mains the same. For education-related expenditures,
we can focus on Head Start, for which the best data
are available. Created in 1965, Head Start promotes
school readiness for the children of low-income fami-
lies, by providing, education, nutrition, health, social
and parenting services. Children can attend schools
or Head Start centers, part or full time. The program
also includes regular home visits. When looking at
the numbers, the following picture emerges: There
were roughly 10 million children in the 3–5 age group
in the US in 2011, of whom about 20 percent would
be eligible for Head Start based on income status. Of
those 2 million children, 951,228 were enrolled in 2011,
less than half.64 Total outlays for the program were
$7,312 billion, or $7,581 per year per enrolled child.65
This example shows that the government expendi-
ture data on spending per age group can tell us little
or nothing about the unit costs of the program. First,
only a fraction of the cohort is eligible to participate
in the means-tested programs; and of that fraction
(in this case), fewer than half take advantage of it.
As a result, unit costs are more than 10 times higher
than the government expenditures per child for the
relevant cohort.
Figure A1 helps to further illustrate to which areas
federal expenditures on each age group are allocated.
Tax provisions are a consistently large portion of ex-
penditures across age groups, while income security
increases in importance, and nutrition declines, as
children grow older. Expenditures on children between
the ages of 3 and 5 and 6 and 11 are relatively similar.
ANNEX 1: THE CASE OF THE US

INVESTING IN EARLY CHILDHOOD DEVELOPMENT: WHAT IS BEING SPENT, WHAT DOES IT COST? 29
Figure A1. Composition of Federal Expenditures (2011) on Children by Age Group
Source: S. Edelstein, J. Isaacs, H. Hahn and K. Toran, How Do Public Investments in Children Vary with Age? A Kids’ Share Analysis of Expenditures in 2008 and 2011 by Age Group (Washington: Urban Institute, 2012).
0Age 0-2 Age 3-5 Age 6-11 Age 12-18
10
20
30
40
50
60
70
80
90
100
Income security
Health
Nutrition
Tax provisions
Education and early care
Housing, social services, and training

30 GLOBAL ECONOMY AND DEVELOPMENT PROGRAM
Annex 2: The Availability of Unit Cost Estimates for Basic ECD Services
Basic Service Availability of Unit Cost Data Unit Cost Estimates Source for Unit Cost
EstimatesMaternal education Limited systematic or
context-specific data available or efforts under way
Planning for family size and spacing
Limited systematic or context-specific data available or efforts under way
Education about early stimulation, growth, and development
Some cost estimates available; efforts under way to collect data on parenting programs in select countries through UNICEF regional prototype and World Bank's Early Learning Partnership
$58–900 per child for parenting program in five Caribbean countries
J. van Spijk, M. Groot Bruinderink, W. Janssens and J. van der Gaag, “Cost-Benefit Analysis of the Roving Caregivers Programme: A Study on the Costs and Benefits of RCP in Dominica, Grenada, Jamaica, St. Lucia and St. Vincent and the Grenadines,” Amsterdam Institute for International Development, 2010. Amsterdam Institute for International Development
Social assistance transfer programs
Limited systematic or context-specific data available or efforts under way
Prevention and treatment of parental depression
Limited systematic or context-specific data available or efforts under way
Parental leave and adequate childcare
Limited systematic or context-specific data available or efforts underway
Child protection services
Limited systematic or context-specific data available or efforts under way

INVESTING IN EARLY CHILDHOOD DEVELOPMENT: WHAT IS BEING SPENT, WHAT DOES IT COST? 31
Annex 2: The Availability of Unit Cost Estimates for Basic ECD Services
Basic Service Availability of Unit Cost Data Unit Cost Estimates Source for Unit Cost
EstimatesAccess to health care
Limited systematic or context-specific data available or efforts under way
Micronutrient supplementation and fortification
Regional cost estimates available
$0.06 for salt iodization for all WHO subregions; $0.52–2.85 for vitamin A supplementation for all WHO subregions
Z. Bhutta, J. Das, A. Rizvi, Lancet Nutrition Interventions Review Group, Maternal and Child Nutrition Study Group et al., “Evidence-Based Interventions for Improvement of Maternal and Child Nutrition: What Can Be Done and at What Cost?” 2013, http://thousanddays.org/wp-content/uploads/2013/06/Nutrition2_p40_65.pdf
Access to safe water
Some cost estimates available
$2.26 per month per household for rural water supply intervention
D. Whittington, W. M. Hanemann, C. Sadoff and M. Jeuland, The Challenge of Water and Sanitation, Copenhagen Consensus Challenge Paper (Copenhagen: Copenhagen Consensus Center, 2008)
Adequate sanitation Regional cost estimates available
$26–60 per capita, depending on region for initial investment cost of a pit latrine (for rural areas); $52–160 per capita in initial investment for septic tanks or shallow, small-bore sewage for rural areas
B. Evans, G. Hutton and L. Haller, “Closing the Sanitation Gap: The Case for Better Public Funding of Sanitation and Hygiene,” paper prepared for OECD Roundtable on Sustainable Development, Paris, March 9–10, 2004.
Handwashing Cost may be included in cost of Parenting and social support networks and community education about growth and development
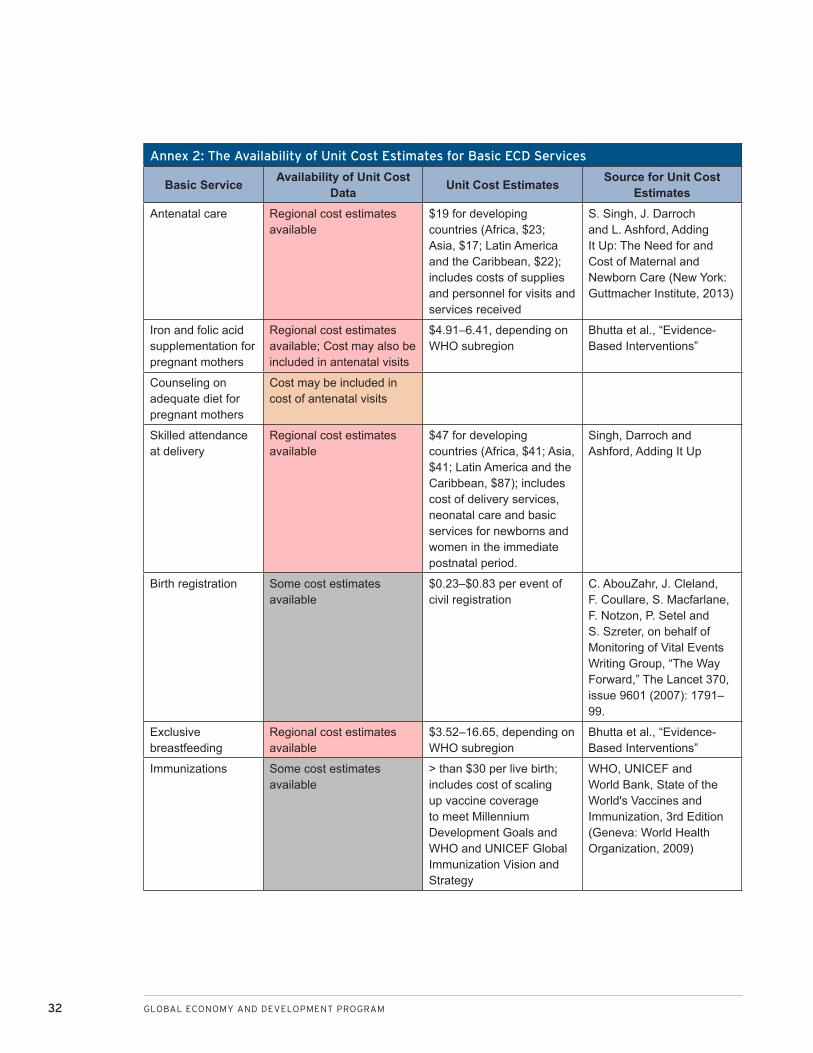
32 GLOBAL ECONOMY AND DEVELOPMENT PROGRAM
Annex 2: The Availability of Unit Cost Estimates for Basic ECD Services
Basic Service Availability of Unit Cost Data Unit Cost Estimates Source for Unit Cost
EstimatesAntenatal care Regional cost estimates
available $19 for developing countries (Africa, $23; Asia, $17; Latin America and the Caribbean, $22); includes costs of supplies and personnel for visits and services received
S. Singh, J. Darroch and L. Ashford, Adding It Up: The Need for and Cost of Maternal and Newborn Care (New York: Guttmacher Institute, 2013)
Iron and folic acid supplementation for pregnant mothers
Regional cost estimates available; Cost may also be included in antenatal visits
$4.91–6.41, depending on WHO subregion
Bhutta et al., “Evidence-Based Interventions”
Counseling on adequate diet for pregnant mothers
Cost may be included in cost of antenatal visits
Skilled attendance at delivery
Regional cost estimates available
$47 for developing countries (Africa, $41; Asia, $41; Latin America and the Caribbean, $87); includes cost of delivery services, neonatal care and basic services for newborns and women in the immediate postnatal period.
Singh, Darroch and Ashford, Adding It Up
Birth registration Some cost estimates available
$0.23–$0.83 per event of civil registration
C. AbouZahr, J. Cleland, F. Coullare, S. Macfarlane, F. Notzon, P. Setel and S. Szreter, on behalf of Monitoring of Vital Events Writing Group, “The Way Forward,” The Lancet 370, issue 9601 (2007): 1791–99.
Exclusive breastfeeding
Regional cost estimates available
$3.52–16.65, depending on WHO subregion
Bhutta et al., “Evidence-Based Interventions”
Immunizations Some cost estimates available
> than $30 per live birth; includes cost of scaling up vaccine coverage to meet Millennium Development Goals and WHO and UNICEF Global Immunization Vision and Strategy
WHO, UNICEF and World Bank, State of the World's Vaccines and Immunization, 3rd Edition (Geneva: World Health Organization, 2009)

INVESTING IN EARLY CHILDHOOD DEVELOPMENT: WHAT IS BEING SPENT, WHAT DOES IT COST? 33
Annex 2: The Availability of Unit Cost Estimates for Basic ECD Services
Basic Service Availability of Unit Cost Data Unit Cost Estimates Source for Unit Cost
EstimatesAdequate, nutritious and safe diet
Some cost estimates available
$5–15 per child per year (not including food)
J. Mason, J. Hunt, D. Parker and U. Jonsson, “Investing in Child Nutrition in Asia,” Asian Development Review 17, nos. 1–2 (1999): 1–32
Therapreutic zinc supplements for diarrhea
Regional cost estimates available
$3.57–5.9, depending on WHO subregion
Bhutta et al., “Evidence-Based Interventions”
Prevention and treatment of acute malnutrition
Regional cost estimates available
$138.72–250.85 for management of severe acute malnutrition, depending on WHO subregion
Bhutta et al., “Evidence-Based Interventions”
Deworming Some cost estimates available
$0.5 for preschoolers S. Horton, H. Alderman and J. Rivera, The Challenge of Hunger and Malnutrition, Copenhagen Consensus Challenge Paper (Copenhagen: Copenhagen Consensus Center, 2008)
Preprimary education
Some cost estimates available; efforts under way to collect data in select countries through UNICEF regional prototype and World Bank's Early Learning Partnership
$26–3,264 per child per year
M. Araujo, F. Lopez Boo and J. Puyana, Overview of Early Childhood Development Services in Latin America and the Caribbean (Washington: Inter-American Development Bank, 2013)
Continuity to primary
Limited systematic or context-specific data available or efforts under way

34 GLOBAL ECONOMY AND DEVELOPMENT PROGRAM
1. P. Engle, M. Black, J. Behrman, M., DeMello, P.
Gertler, I. Kapiri et al., “Strategies to Avoid the
Loss of Developmental Potential in More Than
200 Million Children in the Developing World,” The
Lancet 369 (2007): 8–9, 60–70, 145–57, 229–42.
2. J. Shonkoff, L. Richter, J. van der Gaag and Z.
Bhutta, “An Integrated Scientific Framework for
Child Survival and Early Childhood Development,”
Pediatrics 129, no. 2 (2012): 460–72.
3. Organization for Economic Cooperation and De-
velopment (OECD), PISA 2012 Results in Focus:
What 15-Year-Olds Know and What They Can Do
with What They Know (Paris: OECD, 2013).
4. UNESCO, The Education for All Global Monitoring
Report: Youth and Skills—Putting Education to
Work (Paris: UNESCO, 2012), 39.
5. UNESCO, Expanding Equitable Early Childhood
Care and Education Is an Urgent Need, Policy Pa-
per 03 for the Education for All Global Monitoring
Report (Paris: UNESCO, 2012).
6. E. Vargas-Baron, “Observations on the Financing
of Early Childhood Development at the National
Level,” in Coordinators’ Notebook: An Interna-
tional Resource for Early Childhood, No. 30, ed.
Global Consultative Group on Early Childhood
Care and Development (Toronto: Ryerson Univer-
sity, 2008).
7. D. A. Debissa, R. Sayre, Q. Wodon, L. Elder, L. Raw-
lings and J. Lombardi. Stepping Up Early Child-
hood Development: Investing in Young Children
for High Returns (Washington: World Bank, 2014).
8. P. Britto, P. Engle and C. Super, Handbook of Early
Childhood Development Research and Its Impact
on Global Policy (New York: Oxford University
Press, 2013).
9. C. Belfield, Financing Early Childhood Care and
Education: An International Review, Paper for
2007 Education for All Global Monitoring Report
(Paris: UNESCO, 2006).
10. Ibid.
11. Britto, Engle and Super, Handbook.
12. Belfield, Financing Early Childhood Care.
13. Ibid.
14. H. Levin and H. Schwartz, “Comparing Costs of
Early Childhood Care and Education Programs:
An International Perspective,” Hacienda Pública
Española 201 (2012): 39–66.
15. Emmanuel Ablo and R. Reinikka, Do Budgets Re-
ally Matter? Evidence from Public Spending on
Education and Health in Uganda, Policy Research
Working Paper 1926 (Washington: World Bank,
1998).
16. S. Naudeau, N. Kataoka, A. Valerio, M. Neuman
and L. Elder, Investing in Young Children: An Early
Childhood Development Guide for Policy Dialogue
and Project Preparation (Washington: World Bank,
2010).
17. OECD, Education at a Glance (Paris: OECD, 2013).
18. I. Garfinkel, L. Rainwater and T. Smeeding,. A Re-
examination of Welfare Sates and Inequality in
Rich Nations: How In-Kind Transfers and Indirect
Taxes Change the Story, Journal of Policy Analysis
and Management 25, no. 4 (2006): 897–919.
19. J. Isaacs, A Comparative Perspective on Public
Spending on Children (Washington: Brookings In-
stitution Press, 2009). The data are not available
for narrower age groups.
20. Isaacs, Comparative Perspective.
21. OECD, “Child Well-being Module,” www.oecd.org/
els/social/family/database/CWBM.
22. Levin and Schwartz, “Comparing Costs.”
ENDNOTES

INVESTING IN EARLY CHILDHOOD DEVELOPMENT: WHAT IS BEING SPENT, WHAT DOES IT COST? 35
23. A. Valerio and M. Garcia. , In “Effective Financing.”
In P. Britto, P. Engle, and C. Super (Eds.), Hand-
book of Early Childhood Development Research
and its Impact on Global Policy. (New York City:
Oxford University Press, 2012.)
24. Economist Intelligence Unit, Starting Well: Bench-
marking Early Education across the World (Lon-
don: Economist Intelligence Unit, 2012).
25. Britto, Engle and Super, Handbook.
26. UBS Optimus Foundation, “What’s Going on with
Nairobi’s Preschoolers?” Optimus Impact, issue 1
(October 2013).
27. Economist Intelligence Unit, Starting Well, 21.
28. Department of Policy and Planning, Ministry of
Health and Social Welfare, United Republic of
Tanzania. Tanzania National Health Accounts Year
2010 with Sub-Accounts for HIV and AIDS, Malaria,
Reproductive, and Child Health. (Dar es Salaam:
United Republic of Tanzania, 2012).; Ministry of
Medical Services, Ministry of Public Health and
Sanitation, Republic of Kenya. Kenya National
Health Accounts 2009-10. (Nairobi: Republic of
Kenya, 2013).; Ministry of Health, Republic of
Uganda. National Health Accounts: FY 2008-9
and FY 2009-10. (Kampala: Republic of Uganda,
2013).
29. Jesko Hentschel, Meltem Aran, Raif Can, Fran-
cisco Ferreira, Jeremie Gingouz, and Arzu Uraz,
Life Chances in Turkey: Expanding Opportunities
for the Next Generation (Washington: World Bank,
2010).
30. R. Grunn, Financing Early Childhood Development
(Washington: World Bank, 2008).
31. M. Nordfors, “Sweden Solves Two Problems at
Once,” New York Times, February 28, 2013.
32. E. Vargas-Baron, Payroll Taxes for Child Develop-
ment: Lessons from Colombia, UNESCO Policy
Brief on Early Childhood (Paris: UNESCO, 2006).
33. M. Araujo, F. Lopez Boo and J. Puyana, Overview
of Early Childhood Development Services in Latin
America and the Caribbean (Washington: Inter-
American Development Bank, 2013), 92.
34. Vargas-Baron, Payroll Taxes.
35. O. Attanasio, V. Di Maro and M. Vera-Hernandez,
“Community Nurseries and the Nutritional Status
of Poor Children: Evidence from Colombia,” Eco-
nomic Journal 123 (September 2013): 1025–58.
36. D. Evans and K. Kosec, Early Child Education: Mak-
ing Programs Work for Brazil’s Most Important
Generation (Washington: World Bank, 2012).
37. L. Biersteker, Scaling-Up Early Child Development
in South Africa (Washington.: Brookings Institu-
tion, 2010).
38. These data are from the UIS Database.
39. R. Staples and M. Cochran, Early Childhood Educa-
tion (Westport, Conn.: Praeger, 2007).
40. World Bank, “The Indonesia Early Childhood Edu-
cation and Development (ECED) Project: Findings
and Policy Recommendations,” 2012, http://aid.
dfat.gov.au/aidissues/education/Documents/re-
search-eval-randomised-cluster-control.pdf.
41. Vargas-Baron, “Observations,” 19–20.
42. These are 2009 data from the UNESCO Institute
for Statistics.
43. Britto, Engle and Super, Handbook.
44. Grunn, Financing Early Childhood Development.
45. R. Myers, Costing Early Childhood Care and De-
velopment Programmes (The Hague: Bernard van
Leer Foundation, 2008).
46. Araujo, Lopez Boo and Puyana, Overview, 63.
47. Ibid.
48. J. van Ravens and C. Aggio, Expanding Early
Childhood Care and Education: How Much Does It
Cost? (Amsterdam: Bernard van Leer Foundation,
2008).

36 GLOBAL ECONOMY AND DEVELOPMENT PROGRAM
49. G. B. Overbosch, N. N. N. Nsowah-Nuamah, G. J. M
van de Boom and L. Damnyag, “Determinants of
Antenatal Care Use in Ghana,” Journal of African
Economies 13, no. 2 (2004): 277–301.
50. Araujo, Lopez Boo and Puyana, Overview.
51. Z. Bhutta, J. Das, A. Rizvi, Lancet Nutrition Inter-
ventions Review Group, Maternal and Child Nutri-
tion Study Group et al., “Evidence-Based Inter-
ventions for Improvement of Maternal and Child
Nutrition: What Can Be Done and at What Cost?”
2013, http://thousanddays.org/wp-content/up-
loads/2013/06/Nutrition2_p40_65.pdf.
52. Van Ravens and Aggio, Expanding Early Childhood
Care.
53. J. van Spijk, M. Groot Bruinderink, W. Janssens
and J. van der Gaag, “Cost-Benefit Analysis of the
Roving Caregivers Programme: A Study on the
Costs and Benefits of RCP in Dominica, Grenada,
Jamaica, St. Lucia and St. Vincent and the Grena-
dines,” Amsterdam Institute for International De-
velopment, 2010.
54. Van Ravens and Aggio, Expanding Early Childhood
Care.
55. Araujo, Lopez Boo and Puyana, Overview, 66.
56. Cost, Quality, and Child Outcomes Study Team,
Cost, Quality, and Child Outcomes in Child Care
Centers: Public Report (Denver: Economics De-
partment of University of Colorado at Denver,
1995).
57. Disease Control Priorities Project, Disease Con-
trol Priorities Project 3 (DCP3) (New York: Oxford
University Press for the World Bank, 2014); see
http://www.dcp-3.org/.
58. “Copenhangen Consensus,” 2014, http://www.co-
penhagenconsensus.com/.
59. A. Mingat, 2013. Technical Note Identifying Sce-
narios for the Medium Term Development of ECD
Activities in Sierra Leone. UNICEF
60. A. Mingat, Technical Note Identifying Scenarios
for the Medium-Term Development of ECD Activi-
ties in Sierra Leone (New York: UNICEF, 2013).
61. World Bank, “Scaling-Up Nutrition: What Will It
Cost? Developing Costed Scale-Up Plans in Coun-
tries,” Summary Report of the IUNS Satellite Ses-
sion organized by the World Bank and Bill and Me-
linda Gates Foundation, 2013.
62. Raquel Bernal, “Costos de la política de atención a
la primera infancia in Colombia,” paper prepared
for Inter-American Development Bank, 2013.
63. S. Edelstein, J. Isaacs, H. Hahn and K. Toran, How
Do Public Investments in Children Vary with Age?
A Kids’ Share Analysis of Expenditures in 2008
and 2011 by Age Group (Washington: Urban Insti-
tute, 2012).
64. Kids Count Data Center, “Head Start Enrollment
by Age Group: 2011,” http://datacenter.kidscount.
org.
65. US Department of Health and Human Services,
“Head Start Program Facts, Fiscal Year 2011,”
2014, http://eclkc.ohs.acf.hhs.gov/hslc/mr/fact-
sheets/docs/hs-program-fact-sheet-2011-final.pdf.

The views expressed in this working paper do not necessarily reflect the official position of Brookings, its board or the advisory council members .
© 2015 The Brookings Institution
ISSN: 1939-9383

1775 Massachusetts Avenue, NW Washington, DC 20036 202-797-6000 www.brookings.edu/global