Estimating the Nonresident Parent Population in National ...
26
Kye Lippold March 2014 Posted April 2017 Approximately one-third of all children in the United States live apart from a parent. As policymakers often wish to encourage parents who live apart from their children to contribute financially to their children’s well-being, it is important to understand the demographics and economic situation of nonresident parents. Data on nonresident parents have historically been very limited, but starting in 2010, the US Census Bureau added questions to the Current Population Survey Annual Social and Economic Supplement (ASEC) that can be used to identify nonresident parents and the amount of child support they pay. The purpose of this brief is to provide estimates of nonresident parenthood using the ASEC and two other nationally representative surveys, and discuss differences in these estimates. The other two surveys are the Survey of Income and Program Participation (SIPP) and the National Survey of Family Growth (NSFG). I find that the ASEC identifies significantly fewer nonresident parents than the other two surveys. Specifically, the ASEC identifies 4.3 percent of men between the ages of 15 and 44 as nonresident fathers, while the SIPP identifies between 6.3 and 9.7 percent and the NSFG identifies 11.0 percent. A likely reason for these differences is that the ASEC asks less detailed questions about nonresident parenthood. However, even when a similar set of questions is used, the ASEC identifies significantly fewer nonresident parents than the SIPP. I discuss differences in survey methodology between the ASEC and SIPP that might explain this difference, although further research is necessary to fully explain the discrepancies. INCOME AND BENEFITS POLICY CENTER Estimating the Nonresident Parent Population in National Surveys
Transcript of Estimating the Nonresident Parent Population in National ...

Kye Lippold
March 2014 Posted April 2017
Approximately one-third of all children in the United States live apart from a parent. As
policymakers often wish to encourage parents who live apart from their children to
contribute financially to their children’s well-being, it is important to understand the
demographics and economic situation of nonresident parents. Data on nonresident
parents have historically been very limited, but starting in 2010, the US Census Bureau
added questions to the Current Population Survey Annual Social and Economic
Supplement (ASEC) that can be used to identify nonresident parents and the amount of
child support they pay.
The purpose of this brief is to provide estimates of nonresident parenthood using the ASEC and two
other nationally representative surveys, and discuss differences in these estimates. The other two
surveys are the Survey of Income and Program Participation (SIPP) and the National Survey of Family
Growth (NSFG). I find that the ASEC identifies significantly fewer nonresident parents than the other
two surveys. Specifically, the ASEC identifies 4.3 percent of men between the ages of 15 and 44 as
nonresident fathers, while the SIPP identifies between 6.3 and 9.7 percent and the NSFG identifies 11.0
percent. A likely reason for these differences is that the ASEC asks less detailed questions about
nonresident parenthood. However, even when a similar set of questions is used, the ASEC identifies
significantly fewer nonresident parents than the SIPP. I discuss differences in survey methodology
between the ASEC and SIPP that might explain this difference, although further research is necessary to
fully explain the discrepancies.
I N C O M E A N D B E N E F I T S P O L I C Y C E N T E R
Estimating the Nonresident Parent
Population in National Surveys

2 E S T I M A T I N G T H E N O N R E S I D E N T P A R E N T P O P U L A T I O N I N N A T I O N A L S U R V E Y S
The distribution of demographic characteristics among all nonresident parents identified in the
ASEC is significantly different than that found in the more comprehensive NSFG. In particular, the ASEC
is less likely than the NSFG to identify nonresident fathers who are younger, less educated, never-
married, and members of minority racial and ethnic groups. Nonetheless, when examining nonresident
parents who pay child support, the distribution of demographic characteristics is roughly comparable
across surveys. This suggests that the ASEC should be reweighted when describing the entire
population of nonresident parents.
Background
An estimated one-third of all children in the United States live apart from a parent, and half of all
children will experience parental separation during their childhood.1 The policy response to this
growing phenomenon has been to strengthen the child support enforcement program, making it
difficult for parents who live apart from their children (referred to hereafter as nonresident parents) to
avoid their financial responsibility. Given the extent of parental absence and the strong policy response,
it is important for policymakers to understand who these nonresident parents are, whether they can
afford to pay child support, and how much child support they can afford to pay. However, information
on nonresident parents has historically been scarce due to data limitations.
The primary source of information about nonresident parents has been household surveys, but
starting in the 1980s, studies found that substantially fewer nonresident parents than custodial parents
self-identified in such surveys (Cherlin, Griffith and McCarthy 1983; Sorensen 1998). This difference in
reporting arises from a combination of undercounting of relevant demographic groups, nonparticipation
in household surveys by nonresident parents, and response error (Schaeffer, Seltzer, and Dykema
1998). This led to a focus in the child support policy community of relying solely on the reports of
custodial parents to identify the prevalence of nonresident parenthood and child support obligations,
under the assumption that widespread underreporting made estimates from nonresident parents
themselves unreliable. Therefore, few national surveys in the 1990s provided details on the nonresident
parent population (Sorensen 1998).
However, in the late 1990s, two factors contributed to an increased interest in data on nonresident
parents. First, vice president Al Gore’s focus on fatherhood programs led to a desire to expand the
amount of data collected on male fertility, family formation, and fatherhood (Federal Interagency
Forum on Child and Family Statistics 1998). One example of this shift in data collection was the
expansion of the National Survey of Family Growth (NSFG) from interviews of women only to
interviews of men capturing detail on nonresident parent status and fertility histories.
A second interest in data collection arose from the development of expanded poverty measures,
such as the Supplemental Poverty Measure (SPM) based on recommendations from the National
Academy of Sciences (Citro and Michael 1995). Child support paid by a household is considered a cost
1
Author’s calculations from Kreider and Ellis (2011); Teachman, Tedrow, and Kim (2012).

E S T I M A T I N G T H E N O N R E S I D E N T P A R E N T P O P U L A T I O N I N N A T I O N A L S U R V E Y S 3
subtracted from income when calculating household resources for the SPM, so researchers
constructing SPM measures in household surveys require estimates of nonresident parent status and
child support paid. Thus, the US Census Bureau added questions to the 2010 Annual Social and
Economic Supplement (ASEC) of the Current Population Survey (CPS) that identify nonresident parents
and ask them whether and how much child support they paid. These questions are the first time that a
large annual survey conducted by the US Census Bureau has collected this information. The ASEC
questions were based on the wording of earlier questions in the Survey of Income and Program
Participation (SIPP), but the SIPP has a smaller sample size and did not ask these questions as regularly.
The addition of these questions to the ASEC allows researchers to compare nonresident parent
estimates across national surveys.
One of the early efforts to describe nonresident fathers using survey data was conducted by
Sorensen (1997). She used data from the SIPP and an earlier survey called the National Survey of
Families and Households to identify individuals who self-identified as nonresident fathers. She found
that nonresident fathers were underrepresented in both surveys and thus reweighted the data so that it
better represented this population. Based on either the original and reweighted data, Sorensen found
that nonresident fathers were poorer, on average, than resident fathers, but not as poor as custodial
mothers.
More recently, Stykes, Manning and Brown (2013) have estimated nonresident fatherhood using
the 2011 ASEC, 2008 SIPP, and the 2006–10 National Survey of Family Growth (NSFG). They find that
the NSFG is better able to identify nonresident fathers who are members of minority racial/ethnic
groups and have lower educational attainment. This policy brief expands on their research by including
nonresident parents of both genders, examining more detailed characteristics of nonresident parents
who pay child support, and using a broader array of questions in the SIPP and NSFG to identify
nonresident parents.
Methodology
Data Sources
The data sources used in this study—the ASEC, SIPP, and NSFG—are all probability surveys of the
United States household population. The ASEC and the SIPP interview the civilian noninstitutionalized
population, as well as those Armed Forces individuals living in civilian households. The NSFG interviews
the same household population as the ASEC and SIPP, but limits its sample to men and women aged 15–
44 (with questions on nonresident parenthood asked only for men) (Citro and Michael 1995; US Census
Bureau 2009; Lepkowski et al. 2010). Thus, the three sources provide a very similar universe for
analysis. I perform comparisons for the entire adult household population in the ASEC and SIPP, and for
the male 15–44 year old household population in all three data sources.
I selected the time period of the three surveys to be as similar as possible. The NSFG was conducted
with continuous interviewing from 2006–2010, with results weighted to represent the US population in

4 E S T I M A T I N G T H E N O N R E S I D E N T P A R E N T P O P U L A T I O N I N N A T I O N A L S U R V E Y S
June 2008 (Lepkowski et al. 2013). To approximate a similar period with available data from the other
surveys, I use the 2010 ASEC (assessing nonresident parent status in February through April 2010) and
the 2008 SIPP (with Topical Module 4 questions asked from August to November 2009) (US Census
Bureau 2009).
To put the counts of nonresident parents from these surveys in perspective, the 2010 Current
Population Survey Child Support Supplement (CPS-CSS), a large-scale survey of custodial parents
whose children had parents living outside the household, found 13.7 million custodial parents in the
United States in April 2010, with 11.2 million custodial mothers (Grall 2011). While the number of
nonresident parents identified in the ASEC, SIPP and NSFG may differ from the number of custodial
parents in the CPS-CSS for several reasons (such as multiple-partner fertility and undercounting of
nonresident parents in household surveys),2 these figures provide a baseline for comparison.
Questions Used to Identify Nonresident Parents
In developing my estimates of the nonresident parent (NRP) population, I attempted to capture similar
concepts across the national surveys. The nonresident parent identification question on the ASEC,
included in the March 2010 ASEC experimental poverty module and incorporated into the annual
survey beginning March 2011, reads:
“Does anyone in this household have any children who lived elsewhere with their other parent
or guardian at anytime during [previous year]?”
A follow-up question identifies the specific household members with nonresident children. The answers to these two questions are contained in the variable CHELSEW-YN, with children under 15 coded as “not in universe.” I coded positive responses to this question as indicating nonresident parent status.
Research using the SIPP (e.g., Stykes, Manning, and Brown 2013) traditionally defines NRPs based on their responses to a question in Topical Module 4 (TM4). This question, asked of all persons aged 15 or older and included in the variable EPVCHILD, reads:
“Do you have any children under 21 who lived elsewhere with their other parent or guardian at
anytime during the past 4 months?”
Notably, this question provides explicit upper bounds for the age of the children living elsewhere
(under 21) and a short time period for those children’s nonresidence (the past four months), unlike the
ASEC question that counts all children not resident at any point in the past year. Given that the universe
of positive responses to the SIPP question is a subset of the universe of positive responses to the ASEC
2
For example, incarcerated parents are outside the sampling frame of household surveys, but are nonresident parents (as they do not live with their children). Thus, incarcerated parents would not be identified as nonresident parents in the ASEC, SIPP or NSFG, but the custodial parents of their children would appear in the CPS-CSS.

E S T I M A T I N G T H E N O N R E S I D E N T P A R E N T P O P U L A T I O N I N N A T I O N A L S U R V E Y S 5
question, I would expect ASEC counts of nonresident parents to be slightly higher (holding other
differences between the surveys equal).3
Additionally, I augmented the SIPP TM4 question by referring to other questions on the SIPP to
develop a more comprehensive count of nonresident parents (referred to as the “expanded definition”
of nonresident parenthood, similar to the one used by Sorensen 1997). Specifically, I made use of the
following pieces of information:
In Topical Module 2 (TM2) of the SIPP, male adult (age 15+) respondents are asked “How many
children, if any, has [respondent] ever fathered?” (TFRCHL) and “How many of [respondent]'s
children are living with [respondent] in this household?” (TFRINHH). For individuals who report
fathering more children than are living with them, I selected certain of these individuals as
nonresident parents based on plausible characteristics. I included only individuals who were
born in the United States (to exclude men who are immigrants with children in their home
country) and who do not have allocated values of the fertility variables (AFRCHL = 0 and
ARFINHH = 0). I also required the selected men to be aged no more than 34 plus the number of
nonresident children they reported (i.e., 35 or younger if one nonresident child, 36 or younger if
two nonresident children, etc., up to 39 or younger with five or more nonresident children), in
an attempt to only include men with nonresident children under 18. Any man who had these
characteristics was flagged as a nonresident parent.
In Topical Module 6 (TM6), adult respondents are asked “During the past 12 months, did
[respondent] make payments for the support of [respondent]'s child or children under 21 years
of age who live outside the household?” (ESUPKDYN). I used positive responses to this question
to identify additional nonresident parents, excluding allocated values (so ASUPKDYN = 0). I
also excluded individuals who reported that their payments were both not on behalf of children
under 18 (TSUPNKID > 0 and TSUPLTAD = 0) and that these payments were not part of a legal
agreement (ESUPAGRM = 2); this attempted to exclude individuals paying support to adult
children in college or otherwise away from home but who were not part of the child support
system. Note that TM6 questions in the 2008 SIPP were asked from April to July 2010, so the
12-month look back period primarily refers to 2009.
The 2008 SIPP core files include a question, EHIYNGKD, capturing provision of health
insurance to children under 20 outside the household. I used this variable to identify additional
nonresident parents, assuming all individuals who 1) provided such coverage in the prior year
(i.e., in waves 2, 3, and 4 of the SIPP), without allocated values (AHIYNGKD = 0), and 2) were not
married with a child in the household over 13 years old (as this group was considered more
likely to have children in college) were nonresident parents.
3
Another difference between the surveys is that the 2010 ASEC question does not have imputed or allocated values, while EPVCHILD in the SIPP does include allocation, so would be expected to have slightly higher nonresident parent counts than the ASEC’s unedited self-report. However, only 1 percent of the NRPs identified by EPVCHILD are allocated.

6 E S T I M A T I N G T H E N O N R E S I D E N T P A R E N T P O P U L A T I O N I N N A T I O N A L S U R V E Y S
I used the respondents in the SIPP TM4 as a baseline for nonresident parent status, and used these
additional topical module questions to add nonresident parents to the expanded definition total.
Because not all individuals in TM4 answered questions from TM2 or TM6 (due to attrition in the SIPP
sample), I was unable to augment nonresident parent status for all individuals. Thus, my approach
represents a lower bound for identifying nonresident parents (as my universe is the SIPP population
responding to TM4, rather than those responding to all of TM4, TM2, and TM6).
For the National Survey of Family Growth, I constructed a measure of nonresident fatherhood using
questions asked about each biological and adoptive child reported by the (male) respondent: “Where
does [child name] usually live now?” and “How old is [child name] now? Is [he/she] less than 5 years old, 5
to 18 years old, or 19 years or older?” Each biological or adopted child who is both reported to be less
than 19 and reported as living “with his/her mother” or “living with relatives” and not living with the
respondent part-time was classified as a noncoresidential child; men with one or more such children
were then coded as nonresident parents.4 The NSFG takes a more comprehensive approach to
identifying nonresident fathers than other surveys by specifically probing living arrangements for each
child ever fathered by the respondent (identified by questions asking about children born in each of
several prior marriages or relationships, as well as catch-all questions for other children fathered and
adopted children). I anticipate this more detailed methodology will increase counts of nonresident
parents in the NSFG relative to other surveys. The counts may also differ because my NSFG method
only identifies noncoresidential children under age 19 (rather than under 21 in the SIPP, or of all ages in
the ASEC), but includes noncoresidential children who live with relatives but not the other parent or
guardian.5
Questions Used to Identify Child Support Payment
In the ASEC, child support payments are identified by a simple question asked of nonresident parents:
“In [year], [was/were] [name/you] required to pay child support?” and if yes, “How much child support
did [name/you] pay in [year]?” The resulting value, stored as CHSP_VAL, is used to identify payers. As
the 2010 public use version of this variable is topcoded (US Census Bureau 2010b), with amounts above
$30,000 replaced with the mean of higher amounts, my results will likely understate variation in mean
amounts paid.
4
While the public use variable NUMNCU18 on the NSFG would seem useful for nonresident fatherhood estimates, this variable is more expansive than the ASEC and SIPP definitions of nonresident parenthood, as it includes men whose children are living away at school or on their own (rather than with the other parent or guardian). I include the “living with relatives” category in my definition to capture noncoresidential children who are living with a guardian rather than their mother (although this is an estimate, as the NSFG does not identify children with a non-relative guardian such as children in foster care, and the relatives whom the child lives with are not necessarily legal guardians).
5 While it is possible to identify noncoresidential children aged 18–21 in the NSFG, the questions about child
support were not asked of the fathers of such children, so I did not include them in my definition of NRPs. As a sensitivity analysis, I examined the number of nonresident parents identified under different assumptions for the NSFG; the total number of NRPs was 11 percent lower if I only counted NRPs whose children were living with their mother (rather than with other relatives), 3 percent higher if I included children aged 18–21, and 9 percent lower with both assumptions.

E S T I M A T I N G T H E N O N R E S I D E N T P A R E N T P O P U L A T I O N I N N A T I O N A L S U R V E Y S 7
For the basic SIPP definition of NRPs, I identify child support payments with the SIPP TM4
questions “In the past 4 months, was [respondent] required to pay child support [for these children/for
that child]?” and “How much did [respondent] pay in child support for month [1–4]?” stored in the four
variables TPVCHPA1–TPVCHPA4. Since the SIPP topical module recall period is only four months, I
multiply the reported child support values by three to generate a rough estimate of yearly child support
paid. This estimate will likely be an upper bound for child support paid among those who pay (as it
assumes consistent payment throughout the year), but is probably an underestimate of payments for
those who did not pay in the last four months (as these individuals could have made payments in
previous months that are not captured in the data). Additionally, these variables are topcoded so the
sum of child support paid in the last four months is not more than $6,400, which will tend to understate
mean statistics.
In the SIPP expanded definition, I augment my definition of child support payment with information
from Topical Module 6. The variables TSUPAMPD and TSUPAMAL capture payments made in the last
12 months for the support of children under 21 who live outside the household and that were made as
part of a legal agreement (I exclude informal payments to attempt to approximate the ASEC and TM4
focus on “required” child support). I include these payments only for those I identify as NRPs in my TM6
definition (described above), to avoid including individuals who are supporting an adult child in college
or otherwise making “support” payments that are not child support. I then set child support paid in the
expanded SIPP definition to the maximum value of the TM6 estimates and TM4 yearly estimate
described above (making this estimate a likely upper bound of yearly payment). Again, both TM6
variables are topcoded, which will tend to understate mean amounts paid.
Information on child support paid is limited in the public use NSFG. I employ the variable
CHSUPPYR, which presents the amount of child support paid by the respondent based on responses to
the questions “In the last 12 months, that is, since [time], did you contribute money or child support for
[this child/either of the children/any of the children]’s upbringing?” and “In the last 12 months, how
much did you give?” To focus on “required” child support, I only include the amounts listed as paid for
individuals who answered “yes” to NCAGREE, “Was any of this amount paid as the result of a child
support order?” CHSUPPYR is recoded for public use into four payment categories, so I am unable to
compute average and median statistics for the NSFG, but present the distribution of payments for
comparison.
Methodological Distinctions between the Surveys
Details on differences between the ASEC, SIPP and NSFG are provided in Citro and Michael (1995) and
Stykes, Manning, and Brown (2013). One important area of difference involves proxy reporting; the
ASEC relies on the reports of a single household reference person for details about other household
members’ characteristics, whereas the SIPP attempts to speak with each member of a household
individually (using a reference person only if individual members are unavailable), and the NSFG
specifically interviews only a single member of each household. If proxy reporting can be expected to
reduce the accuracy of information, particularly in reducing reports of potentially socially stigmatized

8 E S T I M A T I N G T H E N O N R E S I D E N T P A R E N T P O P U L A T I O N I N N A T I O N A L S U R V E Y S
characteristics such as nonresident parent status, I would expect proxy reporting to reduce nonresident
parent estimates on the ASEC relative to the other surveys.
The ASEC and SIPP also ask about nonresident parenthood in the context of child support, which
might discourage reports by nonresident parents who are not making regular payments (Stykes.
Manning, and Brown 2013). Additionally, all NSFG interviews are conducted in person, whereas a
substantial proportion of ASEC and SIPP interviews are conducted over the phone (US Census Bureau
2006; US Census Bureau 2009).6 As face-to-face interviews are associated with less bias from socially
desirable reporting than telephone surveys (Holbrook, Green, and Krosnick 2003), the NSFG could be
expected to have higher estimates of nonresident parenthood.
Some additional distinctions to note are that the ASEC asks questions about nonresident parents at
the very end of the questionnaire (US Census Bureau 2010a), which might depress response accuracy
due to respondent fatigue. The SIPP questions also appear late in the survey, coming near the end of
TM4 (which is asked following the core questions) (US Census Bureau 2009, 2011b). The NSFG
questions, by contrast, are asked in the middle of the survey and divided into separate questions for
each of several prior partners (Centers for Disease Control and Prevention 2008), which may increase
cognitive availability of the information.
Finally, the NSFG is a cross-sectional survey interviewing each household once, while the ASEC is
conducted as a supplement to the longitudinal Current Population Survey (so is provided to households
already interviewed between zero and eight times), and the SIPP is fully longitudinal (with most TM4
respondents already having been interviewed for one year at four month intervals). Receiving a survey
as part of a longer sequence might increase accuracy of reports due to greater familiarity with the
interview process, but could also introduce bias if respondents behave differently due to survey
conditioning.
Results
Results for All Nonresident Parents
My estimates of the number and characteristics of nonresident parents of both genders in the 2010
ASEC and 2008 SIPP are presented in tables 1 through 3, with the figures compared in table 4.7 As table
4 indicates, I find significantly more individuals aged 15 or older who report being nonresident parents
in the SIPP TM4 than in the ASEC, and significantly more NRPs in the SIPP expanded definition than
6
In particular, while the initial interviews for the CPS (which makes up the universe for ASEC respondents) and the SIPP generally occur in person, most interviews in later months (such as CPS respondents past their first month in the CPS sample, and SIPP respondents to topical modules) are conducted by telephone.
7 I computed all estimates using standard survey weighting procedures for the three surveys. For the comparisons
between surveys, I used complex survey design information on strata and clustering to compute robust standard errors (using Davern et al.’s method [2006] to generate pseudo-strata and pseudo-PSUs for the public use ASEC). I then used the svy: tab command in Stata software to generate proportions with confidence intervals constrained within the unit interval by a logit transform, and performed t-tests on the appropriate differences.

E S T I M A T I N G T H E N O N R E S I D E N T P A R E N T P O P U L A T I O N I N N A T I O N A L S U R V E Y S 9
when using either the ASEC or TM4 alone. Specifically, I identify 5.4 million NRPs in the ASEC (2.2
percent of the adult population), 7.6 million NRPs in the SIPP TM4 (3.2 percent) and 10.7 million NRPs
in the SIPP expanded definition (4.4 percent). Notably, all of these estimates are lower than the count of
13.7 million custodial parents from the 2010 CPS-CSS (Grall 2011), suggesting all these data sources
and methodologies may experience some undercounting.
One reason that the SIPP may be better able to identify nonresident parents than the ASEC is due
to the reduced use of proxy reporting in the SIPP, which would tend to capture more nonresident
parents (Sykes, Manning, and Brown 2012). To examine this possibility, I also tabulated one-person
households, which by definition cannot have proxy reports. Among these households (tables not
shown), I find the proportions of NRPs are 3.9 percent in the ASEC, 4.7 percent in the SIPP TM4, and 6.1
percent in the expanded SIPP, similar to the differences observed for all households. This analysis
suggests that the differences between the ASEC and SIPP TM4 are not solely due to proxy reporting.
Another hypothesis for the differences is that the more detailed age and time period specifications
for the EPVCHILD question on the SIPP could encourage greater recall of nonresident children. I had
expected to find that the SIPP TM4 would yield a smaller number of nonresident parents than the ASEC
because of these restrictions, but just the opposite occurs; the SIPP TM4 finds more nonresident
parents than the ASEC. It may be that adding these additional parameters to the question provides
more specific cues that encourage recall of nonresident children.
Finally, it may be that differences in survey methodology are contributing to the difference in the
number of nonresident parents identified in the two surveys. Although the ASEC and SIPP have similar
survey methodologies, they are not identical. In particular, the fact that the SIPP TM4 was conducted
after a full year of similar SIPP surveys may have increased respondents’ comfort with the survey
process and thus led to reduced underreporting of nonresident parent status relative to the ASEC.
Despite the greater number of NRPs reported in the SIPP, the characteristics of the NRPs identified
are generally similar. The SIPP sources do report higher levels of education among NRPs, with 39
percent reporting some college education (with no degree) versus 29 percent in the ASEC, and a smaller
proportion in the SIPP reporting a high school degree. However, the SIPP also finds a higher level of
education in the adult population overall (32 percent with some college and no degree versus 27
percent in the ASEC),8 possibly due to differing sample attrition rates by education level (Stykes,
Manning, and Brown 2012). Thus, this population-wide difference in educational attainment between
surveys likely accounts for the difference in NRP educational composition.
The SIPP sources also count a lower proportion of NRPs as black non-Hispanic than the ASEC (16–
17 percent versus 19 percent) and more as “other” races than the ASEC (6–7 percent versus 5 percent).
Slightly more of the NRPs identified in the SIPP expanded definition are male (79 percent) relative to
the ASEC and SIPP TM4 (76 percent), and the SIPP expanded definition identifies more NRPs who are
8
Figures not shown. I use the education variable from the core (wave 4) SIPP rather than TM4 because of Census Bureau corrections to education variables that were released for the core files only (see US Census Bureau 2011a for information on the corrections).

1 0 E S T I M A T I N G T H E N O N R E S I D E N T P A R E N T P O P U L A T I O N I N N A T I O N A L S U R V E Y S
married (40 percent versus 35 or 37 percent) and fewer NRPs who are divorced (29 versus 33 percent)
than the ASEC and SIPP TM4. The age distribution is similar in all sources, although the expanded
definition of the SIPP identifies slightly younger NRPs, with significantly fewer NRPs who are aged 40–
49 than the SIPP TM4 (32 versus 36 percent), and significantly more NRPs who are aged 30–39 than
the ASEC (35 versus 32 percent). These age and gender differences for the expanded definition may be
an artifact of the expanded definition methodology, which adds additional men as NRPs based on their
fertility information only if those men are under 40.
The proportions of NRPs who self-reported that they paid child support differed to a greater degree
across the surveys. The ASEC found 2.7 million nonresident parents (51 percent) reported paying child
support, versus 3.4 million (44 percent) in the SIPP TM4 and 4.5 million (42 percent) in the SIPP
expanded definition—thus, although the ASEC identified fewer nonresident parents, a greater
proportion of those identified paid child support (the SIPP sources did not significantly differ from each
other). However, the distribution of characteristics among payers is very similar for all the surveys; I
found no significant differences by subgroups except for the difference in educational attainment
previously mentioned (with the SIPP respondents reporting higher levels of education than the ASEC; in
the case of payers, the ASEC also finds significantly more have less than a high school degree). This lack
of significant differences may be due in part to the increased imprecision of estimates in the smaller
population of child support payers relative to the entire NRP population, although in almost all cases the
absolute size of the differences is smaller for this population as well. Similarly, I find no significant
differences in mean child support paid between the surveys.
Results for Male Nonresident Parents, Age 15–44
To incorporate the NSFG into my analysis, I computed estimates of the nonresident parent population
for men aged 15–44 (the universe of the child support questions in the NSFG). These results, presented
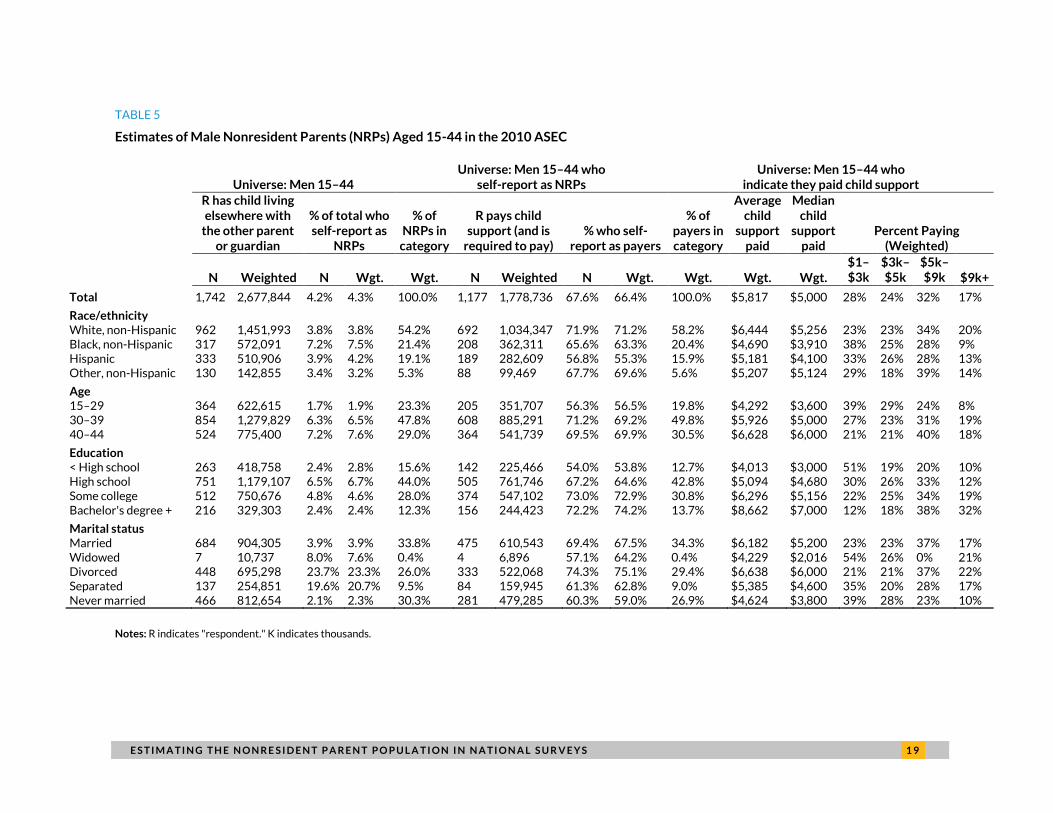
in tables 5 through 10, indicate that 2.7 million of these men (4.3 percent) report as NRPs in the ASEC,
3.9 million (6.3 percent) in the SIPP TM4, 5.9 million (9.7 percent) in the SIPP expanded definition, and
6.9 million (11.0 percent) in the NSFG. This larger estimate for the NSFG matches my expectation that
the NSFG would identify more NRPs due to more comprehensive questions that encourage recall of
children born in multiple prior relationships.
The differences in the composition of the NRP population for young men are roughly similar
between the ASEC and SIPP as they are for the entire population. As before, the SIPP population
reports higher levels of education and has a smaller percentage of black non-Hispanic individuals than
the ASEC. The SIPP expanded definition also finds a smaller share of NRPs who are divorced relative to
the basic TM4 definition, and finds younger NRPs (with proportionally fewer aged 40 or older) relative
to both the ASEC and SIPP TM4.
For the NSFG, a larger proportion of the identified NRPs are Hispanic relative to the other surveys
(26 percent versus 19–20 percent), with fewer white non-Hispanic. The NSFG also finds more black
non-Hispanic respondents than both SIPP definitions. Substantially more NRPs in the NSFG report
having less education than a high school degree (35 percent versus 15 percent in the other surveys), and

E S T I M A T I N G T H E N O N R E S I D E N T P A R E N T P O P U L A T I O N I N N A T I O N A L S U R V E Y S 1 1
fewer report having a bachelor’s degree or more education. The remaining categories of education
differ by survey; the NSFG finds a lower proportion of NRPs with a high school degree than the ASEC,
and a lower proportion with some college education than the SIPP (either definition). While the age and
marital status breakdowns in the NSFG are very similar to the SIPP expanded definition, the NRP
population of the NSFG is younger and more likely to be never married (rather than divorced) relative to
the ASEC or SIPP TM4.
Notably, many of the groups that make up a larger proportion of the NRP population in the NSFG
are those traditionally underreporting nonresident parent status in national surveys, particularly
minority men, never married men, and people with less education (see Sorensen 1998 and Schaeffer et
al. 1998 for discussion of this issue). This suggests the more detailed questions on the NSFG may have
been able to reduce response error among these groups.
I again separately analyzed counts of NRPs in one-person households for the male 15–44 year old
subgroup to isolate the effect of proxy reporting on the estimates. I find similar results to the overall
population, with 10.5 percent of young men in one-person households identifying as NRPs for the ASEC,
13.8 percent for the SIPP TM4, 18.5 percent in the SIPP expanded definition, and 17.1 percent in the
NSFG, although the NSFG estimate was not significantly different from either SIPP estimate. This again
suggests that proxy reporting is not the only cause of differences between the surveys, although it may
be a more important factor among young men relative to the overall population.
With regard to the proportion of young nonresident fathers paying child support, 1.8 million fathers
(66 percent) report payment in the ASEC versus 2.2 million (56 percent) in the SIPP TM4, 2.9 million (49
percent) in the SIPP expanded definition, and 3.2 million (46 percent) in the NSFG. This pattern could be
explained by a greater tendency of individuals who pay child support to accurately report NRP status in
surveys; thus, as more NRPs are captured by more direct reporting and more detailed questions in the
SIPP and NSFG, a greater proportion of those newly identified NRPs are those who do not pay child
support. There are few significant differences in the distribution of payers across surveys, aside from
the previously mentioned differences in education levels; the payers identified in the ASEC are also
older and more likely to be separated than the payers identified in the NSFG, and the SIPP payers are
more likely to be divorced than the NSFG payers.
The mean amounts of child support paid among young men are generally similar, although the
amount reported in the ASEC is lower than for the SIPP TM4 (particularly among men over age 40). This
may occur due to the tendency of the SIPP TM4 measure to overestimate child support among payers,
as mentioned above. While the NSFG provides payment information only in aggregated categories, so
mean figures are not available, the other surveys report more payers with payments in the lowest
category of $1–$3,000 (27–30 percent of each survey’s total, versus 21 percent in the NSFG) rather
than higher payment amounts. Relative to the expanded SIPP definition, the NSFG finds that black,
Hispanic, divorced, married, and older (aged 40 or more) men report higher amounts of child support
paid.

1 2 E S T I M A T I N G T H E N O N R E S I D E N T P A R E N T P O P U L A T I O N I N N A T I O N A L S U R V E Y S
Conclusions
I find that the SIPP identifies more nonresident parents than the ASEC for a similar time period, and the
NSFG identifies even more nonresident parents (in a comparable population of men aged 15–44). I also
find that the SIPP expanded definition, using information from multiple topical modules, provides a
higher estimate for nonresident parents than the SIPP TM4 definition but a slightly lower estimate than
the NSFG. The characteristics of the nonresident parents identified in each survey are roughly similar,
although surveys that identify more nonresident parents find a greater proportion not paying child
support. The NSFG also finds significantly more NRPs in demographic groups that are more often
undercounted or underreported in other data sources, such as those with less education and members
of minority racial/ethnic groups. When examining nonresident parents who pay child support, however,
all surveys produce roughly similar distributions of demographic characteristics.
My results indicate that the counts of NRPs identified in national surveys can be affected by
question wording. The NSFG, which has the most extensive set of questions about nonresident
fatherhood, identified significantly more nonresident fathers than the other surveys. In addition, when
multiple questions are used from different Topical Modules in the SIPP, the number of nonresident
parents identified is significantly higher than when relying solely on TM4, the more typical source of
information about nonresident parenthood.
Nonetheless, other factors besides question wording appear to contribute to differences in the
number of nonresident parents identified in these surveys, because the ASEC and the SIPP TM4 use
very similar questions, and the SIPP finds significantly more nonresident parents than the ASEC. I
examined one possible explanation for the differences—the use of proxy respondents—and found
similar differences occurred even in one-person households. One possibility is that the SIPP questions,
asked as part of a longitudinal survey, are more likely to be accurately answered.
Given that the ASEC suffers from underreporting of nonresident parents and the distribution of
demographic characteristics of nonresident parents found in the ASEC is significantly different from
that found in the NSFG, researchers should consider reweighting ASEC data, as Sorensen (1997) did for
the SIPP, when examining the population of nonresident parents.

E S T I M A T I N G T H E N O N R E S I D E N T P A R E N T P O P U L A T I O N I N N A T I O N A L S U R V E Y S 1 3
References
Centers for Disease Control and Prevention. 2008. “NSFG 2006–08 MALE Questionnaire, Year 3: CAPI-Lite Version.” Hyattsville, MD: National Center for Health Statistics. http://www.cdc.gov/nchs/data/nsfg/NSFG_2006-2010_Y3_MaleCapiLite.pdf.
Cherlin, Andrew, Jeanne Griffith, and James McCarthy. 1983. "A Note on Maritally-Disrupted Men's Reports of Child Support in the June 1980 Current Population Survey." Demography 20(3): 385–89. http://www.jstor.org/stable/2061249.
Citro, Constance F., and Robert T. Michael, eds. 1995. Measuring Poverty: A New Approach. Washington DC: National Academy Press. http://www.census.gov/hhes/povmeas/methodology/nas/report.html.
Davern, Michael, Arthur Jones Jr., James Lepkowski, Gestur Davidson, and Lynn A. Blewett. 2006. “Unstable Inferences? An Examination of Complex Survey Sample Design Adjustments Using the Current Population Survey for Health Services Research.” Inquiry 43(3): 283–297. http://www.jstor.org/stable/29773262.
Federal Interagency Forum on Child and Family Statistics. 1998. NURTURING FATHERHOOD: Improving Data and Research on Male Fertility, Family Formation, and Fatherhood. Washington, DC.
http://web.archive.org/web/20090320074356/http://fatherhood.hhs.gov/CFSForum/front.htm.
Grall, Timothy S. 2011. Custodial Mothers and Fathers and Their Child Support: 2009 (Current Population Reports P60–240). Washington, DC: US Census Bureau. http://www.census.gov/prod/2011pubs/p60-240.pdf.
Holbrook, Allyson L., Melanie C. Green, and Jon A. Krosnick. 2003. "Telephone versus face-to-face interviewing of national probability samples with long questionnaires: Comparisons of respondent satisficing and social desirability response bias." Public Opinion Quarterly 67(1): 79–125.
Kreider, Rose M., and Renee Ellis. 2011. Living Arrangements of Children: 2009 (Current Population Reports P70–126). Washington, DC: US Census Bureau. http://www.census.gov/prod/2011pubs/p70-126.pdf.
Lepkowski, James M., William D. Mosher, Karen E. Davis, Robert M. Groves, and John Van Hoewyk. 2010. “The 2006–2010 National Survey of Family Growth: Sample design and analysis of a continuous survey.” Vital Health Stat 2(150). Hyattsville, MD: National Center for Health Statistics.
http://www.cdc.gov/nchs/data/series/sr_02/sr02_150.pdf.
Lepkowski, James M., William D. Mosher, Robert M. Groves, Brady T. West, James Wagner and Haley Gu. 2013. “Responsive Design, Weighting, and Variance Estimation in the 2006–2010 National Survey of Family Growth.” Vital Health Stat 2(158). Hyattsville, MD: National Center for Health Statistics.
http://www.cdc.gov/nchs/data/series/sr_02/sr02_158.pdf.
Schaeffer, Nora C., Judith A. Seltzer, and Jennifer Dykema. 1998. Methodological and Theoretical Issues in Studying Nonresident Fathers: A Selective Review (NCFF WP-98-02). Philadelphia, PA: National Center on Fathers and Families.
Sorensen, Elaine. 1997. “A National Profile of Nonresident Fathers and Their Ability to Pay Child Support.” Journal of Marriage and Family 59: 785–797. http://www.jstor.org/stable/353782.
———. 1998. “Nonresident Fathers: What We Know And What's Left To Learn?” In NURTURING FATHERHOOD:
Improving Data and Research on Male Fertility, Family Formation, and Fatherhood. Washington, DC: Federal Interagency Forum on Child and Family Statistics. http://web.archive.org/web/20090320083118/http://fatherhood.hhs.gov/CFSForum/apenk.htm.
Stykes, J. Bart, Wendy D. Manning, and Susan L. Brown. 2012. Estimating Nonresident Fatherhood: Evidence from the CPS, NSFG, and SIPP (National Center for Family and Marriage Research Working Paper Series: WP-12-11). Bowling Green, OH: National Center for Family and Marriage Research.
———. 2013. “Nonresident Fathers and Formal Child Support: Evidence from the CPS, NSFG, and SIPP.”
Demographic Research 29(46): 1299-1330. http://www.demographic-research.org/volumes/vol29/46/29-46.pdf.

1 4 E S T I M A T I N G T H E N O N R E S I D E N T P A R E N T P O P U L A T I O N I N N A T I O N A L S U R V E Y S
Teachman, Jay, Lucky Tedrow, and Gina Kim. 2012. “The Demography of Families.” In Handbook of Marriage and the Family, edited by Gary W. Peterson and Kevin R. Bush (39–63). New York: Springer.
US Census Bureau. 2006. Current Population Survey Design and Methodology (Technical Paper 66). Washington, DC. http://www.census.gov/prod/2006pubs/tp-66.pdf.
———. 2009. Survey of Income and Program Participation User’s Guide (3rd ed., Revised). Washington, DC.
https://www2.census.gov/programs-surveys/sipp/guidance/SIPP_USERS_Guide_Third_Edition_2001.pdf.
———. 2010a. “Current Population Survey, 2010 Annual Social and Economic (ASEC) Supplement.”
http://www.census.gov/prod/techdoc/cps/cpsmar10.pdf.
———. 2010b. “Experimental Poverty Measures, 2009: Public-Use Dataset Notes.”
http://www.census.gov/housing/povmeas/pov09/readme.txt.
———. 2011a. “2008 Panel (Waves 2 – 5) and 2004 Panel (Waves 2 – 12) Educational Attainment User Note,
Concerning Variables EEDUCATE, RGED, RCOLLVOC.” SIPP User Notes. https://www.census.gov/programs-surveys/sipp/tech-documentation/user-notes/2008w2_5-2004w2_12-Edu-Attain-User-Note.html.
———. 2011b. “Survey of Income and Program Participation - 2008 Panel: Topical Module Items Booklet: Wave
4.” http://web.archive.org/web/20110725074924/http://www.census.gov:80/sipp/top_mod/2008/quests/2008w4tm.pdf.

E S T I M A T I N G T H E N O N R E S I D E N T P A R E N T P O P U L A T I O N I N N A T I O N A L S U R V E Y S 1 5
TABLE 1
Estimates of Nonresident Parents (NRPs) in the 2010 ASEC
Universe: People 15+ Universe: People who self-report as NRPs Universe: People who indicate they
paid child support
R has child living elsewhere with
the other parent or guardian
% of total who self-report as
NRPs % of NRPs in
category
R pays child support (and is
required to pay)
% who self-report as
payers % of payers in
category
Average child
support paid
Median child
support paid
N Weighted N Wgt. N Wgt. N Weighted N Wgt. N Wgt. Weighted Weighted
Total 3,559 5,373,476 2.2% 2.2% 100.0% 100.0% 1,801 2,737,481 50.6% 50.9% 100.0% 100.0% $6,163 $5,000
Gender
Male 2,644 4,089,440 3.5% 3.5% 74.3% 76.1% 1,649 2,529,488 62.4% 61.9% 91.6% 92.4% $6,388 $5,200 Female 915 1,284,036 1.1% 1.0% 25.7% 23.9% 152 207,992 16.6% 16.2% 8.4% 7.6% $3,427 $2,400
Race/ethnicity
White, non-Hispanic 2,117 3,251,350 2.1% 2.0% 59.5% 60.5% 1,121 1,731,435 53.0% 53.3% 62.2% 63.2% $6,805 $5,200 Black, non-Hispanic 592 1,022,608 3.2% 3.6% 16.6% 19.0% 298 503,142 50.3% 49.2% 16.5% 18.4% $4,891 $4,200 Hispanic 577 826,049 2.2% 2.4% 16.2% 15.4% 254 371,367 44.0% 45.0% 14.1% 13.6% $5,237 $4,200 Other, non-Hispanic 273 273,468 2.0% 1.7% 7.7% 5.1% 128 131,537 46.9% 48.1% 7.1% 4.8% $5,197 $5,124
Age
15–29 514 848,790 1.2% 1.3% 14.4% 15.8% 235 390,097 45.7% 46.0% 13.0% 14.3% $4,088 $3,600 30–39 1,170 1,691,410 4.1% 4.3% 32.9% 31.5% 685 984,414 58.5% 58.2% 38.0% 36.0% $5,611 $4,800 40–49 1,261 1,836,092 4.0% 4.3% 35.4% 34.2% 669 1,003,123 53.1% 54.6% 37.1% 36.6% $6,993 $6,000 50–64 544 878,342 1.5% 1.5% 15.3% 16.3% 201 340,889 36.9% 38.8% 11.2% 12.5% $7,808 $6,000 65+ 70 118,841 0.3% 0.3% 2.0% 2.2% 11 18,958 15.7% 16.0% 0.6% 0.7% $4,100 $2,400
Education
Less than High School 519 801,406 1.6% 1.8% 14.6% 14.9% 215 347,371 41.4% 43.3% 11.9% 12.7% $4,150 $3,360 High school 1,351 2,069,845 3.0% 2.9% 38.0% 38.5% 714 1,087,595 52.8% 52.5% 39.6% 39.7% $5,116 $4,570 Some college 1,090 1,575,392 2.6% 2.5% 30.6% 29.3% 577 839,521 52.9% 53.3% 32.0% 30.7% $6,468 $5,124 Bachelor's degree + 599 926,833 1.5% 1.5% 16.8% 17.2% 295 462,994 49.2% 50.0% 16.4% 16.9% $9,582 $7,200
Marital status
Married 1,379 1,884,722 1.6% 1.5% 38.7% 35.1% 708 936,509 51.3% 49.7% 39.3% 34.2% $6,547 $5,124 Widowed 55 79,934 0.7% 0.6% 1.5% 1.5% 10 16,844 18.2% 21.1% 0.6% 0.6% $5,020 $4,800 Divorced 1,138 1,792,518 7.6% 7.5% 32.0% 33.4% 627 1,019,090 55.1% 56.9% 34.8% 37.2% $6,939 $6,000 Separated 284 486,565 8.1% 8.8% 8.0% 9.1% 116 211,141 40.8% 43.4% 6.4% 7.7% $5,527 $4,800 Never married 703 1,129,737 1.5% 1.5% 19.8% 21.0% 340 553,898 48.4% 49.0% 18.9% 20.2% $4,365 $3,600
Note: R indicates "respondent."

1 6 E S T I M A T I N G T H E N O N R E S I D E N T P A R E N T P O P U L A T I O N I N N A T I O N A L S U R V E Y S
TABLE 2
Estimates of Nonresident Parents (NRPs) in the 2008 SIPP, TM4
Universe: People 15+ Universe: People who self-report as NRPs Universe: People who indicate they
paid child support
R has child living elsewhere with
the other parent or guardian
% of total who self-report as
NRPs % of NRPs in
category
R pays child support (and is
required to pay)
% who self-report as
payers % of payers in
category
Average child
support paid
Median child
support paid
N Weighted N Wgt. N Wgt. N Weighted N Wgt. N Wgt. Weighted Weighted
Total 2,193 7,624,665 3.0% 3.2% 100.0% 100.0% 939 3,382,034 42.8% 44.4% 100.0% 100.0% $6,365 $5,040
Gender
Male 1,629 5,806,533 4.8% 5.0% 74.3% 76.2% 867 3,136,950 53.2% 54.0% 92.3% 92.8% $6,506 $5,280 Female 564 1,818,132 1.5% 1.5% 25.7% 23.8% 72 245,085 12.8% 13.5% 7.7% 7.2% $4,563 $3,288
Race/ethnicity
White, non-Hispanic 1,425 4,676,357 2.8% 2.9% 65.0% 61.3% 646 2,192,446 45.3% 46.9% 68.8% 64.8% $6,813 $5,760 Black, non-Hispanic 340 1,232,134 4.1% 4.5% 15.5% 16.2% 134 513,381 39.4% 41.7% 14.3% 15.2% $5,510 $4,320 Hispanic 262 1,212,663 3.2% 3.6% 11.9% 15.9% 105 508,223 40.1% 41.9% 11.2% 15.0% $5,044 $4,800 Other, non-Hispanic 166 503,511 3.2% 3.2% 7.6% 6.6% 54 167,984 32.5% 33.4% 5.8% 5.0% $7,134 $4,848
Age
15–29 340 1,164,592 1.9% 1.9% 15.5% 15.3% 139 496,462 40.9% 42.6% 14.8% 14.7% $4,393 $3,480 30–39 689 2,446,864 6.2% 6.2% 31.4% 32.1% 332 1,193,172 48.2% 48.8% 35.4% 35.3% $6,125 $4,944 40–49 783 2,763,034 6.1% 6.4% 35.7% 36.2% 330 1,227,510 42.1% 44.4% 35.1% 36.3% $7,072 $5,904 50–64 339 1,119,288 1.9% 2.0% 15.5% 14.7% 128 440,072 37.8% 39.3% 13.6% 13.0% $7,287 $6,000 65+ 42 130,887 0.3% 0.3% 1.9% 1.7% 10 24,818 23.8% 19.0% 1.1% 0.7% $6,028 $5,400
Education
Less than high school 317 1,085,669 2.5% 2.7% 14.5% 14.2% 97 330,621 30.6% 30.5% 10.3% 9.8% $4,636 $3,900 High school 680 2,328,255 3.6% 3.8% 31.0% 30.5% 316 1,117,887 46.5% 48.0% 33.7% 33.1% $5,288 $4,200 Some college 847 2,971,942 3.7% 3.8% 38.6% 39.0% 358 1,310,201 42.3% 44.1% 38.1% 38.7% $6,242 $4,944 Bachelor's degree + 349 1,238,800 2.0% 2.0% 15.9% 16.2% 168 623,325 48.1% 50.3% 17.9% 18.4% $9,472 $8,400
Marital status
Married 837 2,846,238 2.2% 2.3% 38.2% 37.3% 345 1,184,584 41.2% 41.6% 36.7% 35.0% $6,152 $4,800 Widowed 23 88,469 0.5% 0.6% 1.0% 1.2% 9 39,586 39.1% 44.7% 1.0% 1.2% $8,101 $6,720 Divorced 698 2,475,089 9.2% 10.0% 31.8% 32.5% 342 1,264,648 49.0% 51.1% 36.4% 37.4% $7,088 $6,000 Separated 187 648,893 13.0% 13.9% 8.5% 8.5% 68 245,625 36.4% 37.9% 7.2% 7.3% $6,864 $4,845 Never married 448 1,565,975 2.2% 2.1% 20.4% 20.5% 175 647,591 39.1% 41.4% 18.6% 19.1% $5,048 $3,840
Notes: R indicates "respondent." SIPP TM4 payment figures are four-month values multiplied by three.

E S T I M A T I N G T H E N O N R E S I D E N T P A R E N T P O P U L A T I O N I N N A T I O N A L S U R V E Y S 1 7
TABLE 3
Estimates of Nonresident Parents (NRPs) in the 2008 SIPP, Expanded Definition
Universe: People 15+ Universe: People who self-report as NRPs Universe: People who indicate they
paid child support
R has child living elsewhere with
the other parent or guardian
% of total who self-report as
NRPs % of NRPs in
category
R pays child support (and is
required to pay)
% who self-report as
payers % of payers in
category
Average child
support paid
Median child
support paid
N Weighted N Wgt. N Wgt. N Weighted N Wgt. N Wgt. Weighted Weighted
Total 3,048 10,689,551 4.2% 4.4% 100.0% 100.0% 1,262 4,523,550 41.4% 42.3% 100.0% 100.0% $6,047 $4,800
Gender
Male 2,357 8,467,334 6.9% 7.3% 77.3% 79.2% 1,154 4,172,994 49.0% 49.3% 91.4% 92.3% $6,171 $5,000 Female 691 2,222,217 1.8% 1.8% 22.7% 20.8% 108 350,556 15.6% 15.8% 8.6% 7.7% $4,563 $3,600
Race/ethnicity
White, non-Hispanic 1,969 6,455,629 3.9% 3.9% 64.6% 60.4% 866 2,897,539 44.0% 44.9% 68.6% 64.1% $6,467 $5,280 Black, non-Hispanic 477 1,765,466 5.7% 6.5% 15.6% 16.5% 189 730,540 39.6% 41.4% 15.0% 16.1% $5,063 $3,800 Hispanic 386 1,819,131 4.7% 5.4% 12.7% 17.0% 137 681,936 35.5% 37.5% 10.9% 15.1% $5,166 $4,800 Other, non-Hispanic 216 649,325 4.1% 4.1% 7.1% 6.1% 70 213,536 32.4% 32.9% 5.5% 4.7% $6,519 $4,800
Age
15–29 516 1,842,035 2.9% 2.9% 16.9% 17.2% 183 677,670 35.5% 36.8% 14.5% 15.0% $4,074 $3,432 30–39 1,045 3,698,375 9.3% 9.4% 34.3% 34.6% 446 1,582,677 42.7% 42.8% 35.3% 35.0% $5,980 $4,944 40–49 976 3,439,581 7.6% 7.9% 32.0% 32.2% 446 1,633,659 45.7% 47.5% 35.3% 36.1% $6,632 $5,301 50–64 461 1,551,823 2.6% 2.7% 15.1% 14.5% 177 604,726 38.4% 39.0% 14.0% 13.4% $6,850 $6,000 65+ 50 157,737 0.4% 0.4% 1.6% 1.5% 10 24,818 20.0% 15.7% 0.8% 0.5% $6,028 $5,400
Education
Less than high school 416 1,474,159 3.3% 3.6% 13.6% 13.8% 127 448,638 30.5% 30.4% 10.1% 9.9% $4,390 $3,732 High school 941 3,240,157 5.0% 5.3% 30.9% 30.3% 418 1,452,818 44.4% 44.8% 33.1% 32.1% $5,098 $4,320 Some college 1,187 4,195,230 5.1% 5.4% 38.9% 39.2% 490 1,771,926 41.3% 42.2% 38.8% 39.2% $5,942 $4,800 Bachelor's degree + 504 1,780,005 2.8% 2.9% 16.5% 16.7% 227 850,168 45.0% 47.8% 18.0% 18.8% $8,759 $7,620
Marital status
Married 1,252 4,235,692 3.3% 3.4% 41.1% 39.6% 483 1,633,487 38.6% 38.6% 38.3% 36.1% $5,928 $4,800 Widowed 28 101,118 0.6% 0.7% 0.9% 0.9% 10 40,904 35.7% 40.5% 0.8% 0.9% $8,142 $6,720 Divorced 879 3,118,368 11.6% 12.6% 28.8% 29.2% 442 1,630,206 50.3% 52.3% 35.0% 36.0% $6,749 $5,760 Separated 229 829,953 15.9% 17.7% 7.5% 7.8% 87 317,404 38.0% 38.2% 6.9% 7.0% $6,557 $5,000 Never married 660 2,404,420 3.2% 3.3% 21.7% 22.5% 240 901,548 36.4% 37.5% 19.0% 19.9% $4,715 $3,720
Note: R indicates "respondent."

1 8 E S T I M A T I N G T H E N O N R E S I D E N T P A R E N T P O P U L A T I O N I N N A T I O N A L S U R V E Y S
TABLE 4
Estimates of Nonresident Parents (NRPs) in National Surveys
Comparing the ASEC; SIPP TM4; and SIPP, Expanded Definition
Weighted Differences, ASEC vs. SIPP TM4
Weighted Differences, ASEC vs. SIPP Expanded Definition
Weighted Differences, SIPP TM4 vs. SIPP Expanded Definition
% of NRPs
% of payers
Average child
support paid
Median child
support paid
% of NRPs
% of payers
Average child
support paid
Median child
support paid
% of NRPs
% of payers
Average child
support paid
Median child
support paid
Total1
-1.0%* 6.6%* -$202 -$40 -2.2%* 8.6%* $117 $200 -1.3%* 2.0% $319 $240
Gender
Male -0.1% -0.4% -$118 -$80 -3.1%* 0.2% $217 $200 -3.1%* 0.5% $335 $280 Female 0.1% 0.4% -$1,136 -$888 3.1%* -0.2% -$1,136 -$1,200 3.1%* -0.5% $0 -$312
Race/ethnicity
White, non-Hispanic -0.8% -1.6% -$7 -$560 0.1% -0.8% $339 -$80 0.9% 0.8% $346 $480 Black, non-Hispanic 2.9%* 3.2% -$619 -$120 2.5%* 2.2% -$173 $400 -0.4% -1.0% $447 $520
Hispanic -0.5% -1.5% $193 -$600 -1.7% -1.5% $70 -$600 -1.1% 0.0% -$123 $0 Other, non-Hispanic -1.5%* -0.2% -$1,937 $276 -1.0% 0.1% -$1,322 $324 0.5% 0.2% $614 $48
Age
15–29 0.5% -0.4% -$305 $120 -1.4% -0.7% $13 $168 -2.0% -0.3% $319 $48 30–39 -0.6% 0.7% -$515 -$144 -3.1%* 1.0% -$370 -$144 -2.5% 0.3% $145 $0
40–49 -2.1% 0.3% -$79 $96 2.0% 0.5% $362 $699 4.1%* 0.2% $441 $603 50–64 1.7% -0.6% $521 $0 1.8% -0.9% $958 $0 0.2% -0.4% $437 $0
65+ 0.5% 0.0% -$1,928 -$3,000 0.7% 0.1% -$1,928 -$3,000 0.2% 0.2% $0 $0
Education
Less than high school 0.7% 2.9%* -$486 -$540 1.1% 2.8%* -$240 -$372 0.4% -0.1% $246 $168
High school 8.0%* 6.7%* -$172 $370 8.2%* 7.6%* $18 $250 0.2% 0.9% $190 -$120 Some college -9.7%* -8.1%* $226 $180 -9.9%* -8.5%* $526 $324 -0.3% -0.4% $300 $144
Bachelor's degree + 1.0% -1.5% $110 -$1,200 0.6% -1.9% $823 -$420 -0.4% -0.4% $713 $780
Marital status
Married -2.3% -0.8% $394 $324 -4.6%* -1.9% $619 $324 -2.3% -1.1% $224 $0
Widowed 0.3% -0.6% -$3,082 -$1,920 0.5% -0.3% -$3,122 -$1,920 0.2% 0.3% -$40 $0 Divorced 0.9% -0.2% -$148 $0 4.2%* 1.2% $190 $240 3.3%* 1.4% $338 $240
Separated 0.5% 0.5% -$1,336 -$45 1.3% 0.7% -$1,030 -$200 0.7% 0.2% $307 -$155
Never married 0.5% 1.1% -$683 -$240 -1.5% 0.3% -$350 -$120 -2.0% -0.8% $333 $120
Notes: * Significant difference at p < 0.05. 1 Total row presents percent of population who are NRPs or payers; other rows present percentages of NRP or payer population in subgroups.
E S T I M A T I N G T H E N O N R E S I D E N T P A R E N T P O P U L A T I O N I N N A T I O N A L S U R V E Y S 1 9
TABLE 5
Estimates of Male Nonresident Parents (NRPs) Aged 15-44 in the 2010 ASEC
Universe: Men 15–44 Universe: Men 15–44 who
self-report as NRPs Universe: Men 15–44 who
indicate they paid child support
R has child living elsewhere with
the other parent or guardian
% of total who self-report as
NRPs
% of NRPs in
category
R pays child support (and is
required to pay) % who self-
report as payers
% of payers in category
Average child
support paid
Median child
support paid
Percent Paying (Weighted)
N Weighted N Wgt. Wgt. N Weighted N Wgt. Wgt. Wgt. Wgt. $1–$3k
$3k–$5k
$5k–$9k $9k+
Total 1,742 2,677,844 4.2% 4.3% 100.0% 1,177 1,778,736 67.6% 66.4% 100.0% $5,817 $5,000 28% 24% 32% 17%
Race/ethnicity
White, non-Hispanic 962 1,451,993 3.8% 3.8% 54.2% 692 1,034,347 71.9% 71.2% 58.2% $6,444 $5,256 23% 23% 34% 20% Black, non-Hispanic 317 572,091 7.2% 7.5% 21.4% 208 362,311 65.6% 63.3% 20.4% $4,690 $3,910 38% 25% 28% 9% Hispanic 333 510,906 3.9% 4.2% 19.1% 189 282,609 56.8% 55.3% 15.9% $5,181 $4,100 33% 26% 28% 13% Other, non-Hispanic 130 142,855 3.4% 3.2% 5.3% 88 99,469 67.7% 69.6% 5.6% $5,207 $5,124 29% 18% 39% 14%
Age
15–29 364 622,615 1.7% 1.9% 23.3% 205 351,707 56.3% 56.5% 19.8% $4,292 $3,600 39% 29% 24% 8% 30–39 854 1,279,829 6.3% 6.5% 47.8% 608 885,291 71.2% 69.2% 49.8% $5,926 $5,000 27% 23% 31% 19% 40–44 524 775,400 7.2% 7.6% 29.0% 364 541,739 69.5% 69.9% 30.5% $6,628 $6,000 21% 21% 40% 18%
Education
< High school 263 418,758 2.4% 2.8% 15.6% 142 225,466 54.0% 53.8% 12.7% $4,013 $3,000 51% 19% 20% 10% High school 751 1,179,107 6.5% 6.7% 44.0% 505 761,746 67.2% 64.6% 42.8% $5,094 $4,680 30% 26% 33% 12% Some college 512 750,676 4.8% 4.6% 28.0% 374 547,102 73.0% 72.9% 30.8% $6,296 $5,156 22% 25% 34% 19% Bachelor's degree + 216 329,303 2.4% 2.4% 12.3% 156 244,423 72.2% 74.2% 13.7% $8,662 $7,000 12% 18% 38% 32%
Marital status
Married 684 904,305 3.9% 3.9% 33.8% 475 610,543 69.4% 67.5% 34.3% $6,182 $5,200 23% 23% 37% 17% Widowed 7 10,737 8.0% 7.6% 0.4% 4 6,896 57.1% 64.2% 0.4% $4,229 $2,016 54% 26% 0% 21% Divorced 448 695,298 23.7% 23.3% 26.0% 333 522,068 74.3% 75.1% 29.4% $6,638 $6,000 21% 21% 37% 22% Separated 137 254,851 19.6% 20.7% 9.5% 84 159,945 61.3% 62.8% 9.0% $5,385 $4,600 35% 20% 28% 17% Never married 466 812,654 2.1% 2.3% 30.3% 281 479,285 60.3% 59.0% 26.9% $4,624 $3,800 39% 28% 23% 10%
Notes: R indicates "respondent." K indicates thousands.

2 0 E S T I M A T I N G T H E N O N R E S I D E N T P A R E N T P O P U L A T I O N I N N A T I O N A L S U R V E Y S
TABLE 6
Estimates of Male Nonresident Parents (NRPs) Aged 15-44 in the 2008 SIPP, TM4
Universe: Men 15–44 Universe: Men 15–44 who
self-report as NRPs Universe: Men 15–44 who
indicate they paid child support
R has child living elsewhere with
the other parent or guardian
% of total who self-report as
NRPs
% of NRPs in
category
R pays child support (and is
required to pay)
% who self-report as
payers
% of payers in category
Average child
support paid
Median child
support paid
Percent Paying (Weighted)
N Weighted N Wgt. Wgt. N Weighted N Wgt. Wgt. Wgt. Wgt. $1–$3k
$3k–$5k
$5k–$9k $9k+
Total 1,067 3,891,508 6.2% 6.3% 100.0% 592 2,178,578 55.5% 56.0% 100.0% $6,376 $5,040 27% 23% 29% 21%
Race/ethnicity
White, non-Hispanic 670 2,238,258 6.1% 6.0% 57.5% 409 1,399,015 61.0% 62.5% 64.2% $6,888 $5,904 26% 19% 30% 26% Black, non-Hispanic 176 675,688 9.4% 9.3% 17.4% 78 312,199 44.3% 46.2% 14.3% $5,551 $3,840 32% 32% 21% 15% Hispanic 149 739,361 5.3% 6.1% 19.0% 72 354,181 48.3% 47.9% 16.3% $5,001 $4,800 26% 31% 35% 7% Other, non-Hispanic 72 238,200 5.0% 5.3% 6.1% 33 113,184 45.8% 47.5% 5.2% $6,636 $4,800 24% 31% 22% 23%
Age
15–29 257 903,266 2.9% 2.9% 23.2% 128 458,864 49.8% 50.8% 21.1% $4,285 $3,432 43% 32% 19% 6% 30–39 508 1,862,123 9.5% 9.6% 47.9% 309 1,120,197 60.8% 60.2% 51.4% $6,227 $5,184 25% 24% 32% 19% 40–44 302 1,126,118 10.3% 10.9% 28.9% 155 599,517 51.3% 53.2% 27.5% $8,257 $7,200 17% 16% 31% 36%
Education
< High school 168 598,268 4.3% 4.5% 15.4% 63 224,587 37.5% 37.5% 10.3% $4,636 $4,200 37% 27% 26% 10% High school 379 1,359,582 8.4% 8.4% 34.9% 217 776,748 57.3% 57.1% 35.7% $5,388 $4,320 31% 29% 28% 12% Some college 388 1,437,691 7.5% 7.5% 36.9% 226 835,426 58.2% 58.1% 38.3% $6,235 $4,944 28% 22% 29% 21% Bachelor's degree + 132 495,966 3.8% 3.9% 12.7% 86 341,817 65.2% 68.9% 15.7% $10,112 $9,000 6% 11% 34% 49%
Marital status
Married 382 1,328,159 5.8% 5.7% 34.1% 205 716,331 53.7% 53.9% 32.9% $6,177 $5,040 27% 22% 31% 19% Widowed 3 10,550 7.5% 7.8% 0.3% 2 6,192 66.7% 58.7% 0.3% $6,929 $8,400 20% 0% 80% 0% Divorced 288 1,070,582 32.4% 32.2% 27.5% 188 698,337 65.3% 65.2% 32.1% $7,511 $6,480 22% 14% 33% 31% Separated 92 350,564 37.6% 37.4% 9.0% 46 180,535 50.0% 51.5% 8.3% $7,408 $5,700 14% 26% 38% 23% Never married 302 1,131,653 3.2% 3.4% 29.1% 151 577,184 50.0% 51.0% 26.5% $4,922 $3,840 35% 36% 18% 11%
Notes: R indicates "respondent." SIPP TM4 payment figures are four-month values multiplied by three. K indicates thousands.

E S T I M A T I N G T H E N O N R E S I D E N T P A R E N T P O P U L A T I O N I N N A T I O N A L S U R V E Y S 2 1
TABLE 7.
Estimates of Male Nonresident Parents (NRPs) Aged 15-44 in the 2008 SIPP, Expanded Definition
Universe: Men 15–44 Universe: Men 15–44 who
self-report as NRPs Universe: Men 15–44 who
indicate they paid child support
R has child living elsewhere with
the other parent or guardian
% of total who self-report as
NRPs
% of NRPs in
category
R pays child support (and is
required to pay)
% who self-report as
payers
% of payers in category
Average child
support paid
Median child
support paid
Percent Paying (Weighted)
N Weighted N Wgt. Wgt. N Weighted N Wgt. Wgt. Wgt. Wgt. $1–$3k
$3k–$5k
$5k–$9k $9k+
Total 1,626 5,926,975 9.5% 9.7% 100.0% 786 2,881,115 48.3% 48.6% 100.0% $5,982 $4,800 30% 22% 27% 20%
Race/ethnicity
White, non-Hispanic 1,008 3,350,284 9.2% 8.9% 56.5% 533 1,799,809 52.9% 53.7% 62.5% $6,575 $5,454 27% 20% 30% 24% Black, non-Hispanic 275 1,077,942 14.7% 14.9% 18.2% 116 469,998 42.2% 43.6% 16.3% $4,718 $3,600 42% 25% 19% 13% Hispanic 240 1,161,100 8.5% 9.6% 19.6% 93 464,776 38.8% 40.0% 16.1% $4,873 $4,320 34% 27% 29% 10% Other, non-Hispanic 103 337,649 7.2% 7.5% 5.7% 44 146,532 42.7% 43.4% 5.1% $6,260 $4,800 29% 30% 18% 23%
Age
15–29 420 1,534,338 4.8% 4.9% 25.9% 167 625,808 39.8% 40.8% 21.7% $4,023 $3,432 45% 31% 19% 5% 30–39 824 2,992,802 15.4% 15.4% 50.5% 410 1,476,574 49.8% 49.3% 51.3% $6,056 $5,040 28% 22% 31% 20% 40–44 382 1,399,835 13.1% 13.6% 23.6% 209 778,733 54.7% 55.6% 27.0% $7,415 $6,000 24% 16% 28% 32%
Education
< High school 250 908,113 6.3% 6.8% 15.3% 83 314,962 33.2% 34.7% 10.9% $4,415 $4,200 39% 27% 25% 9% High school 572 2,051,146 12.7% 12.7% 34.6% 279 982,870 48.8% 47.9% 34.1% $5,242 $4,520 33% 25% 28% 13% Some college 604 2,231,032 11.7% 11.6% 37.6% 308 1,129,742 51.0% 50.6% 39.2% $5,870 $4,800 32% 22% 25% 21% Bachelor's degree + 200 736,684 5.8% 5.7% 12.4% 116 453,542 58.0% 61.6% 15.7% $8,949 $8,140 15% 14% 31% 41%
Marital status
Married 640 2,196,176 9.7% 9.4% 37.1% 291 998,563 45.5% 45.5% 34.7% $5,876 $4,968 30% 21% 30% 19% Widowed 6 18,549 15.0% 13.8% 0.3% 3 7,511 50.0% 40.5% 0.3% $6,506 $8,400 17% 18% 66% 0% Divorced 383 1,406,770 43.0% 42.3% 23.7% 233 872,117 60.8% 62.0% 30.3% $7,060 $6,000 26% 15% 30% 29% Separated 114 454,840 46.5% 48.5% 7.7% 54 214,326 47.4% 47.1% 7.4% $7,091 $5,700 21% 19% 36% 24% Never married 483 1,850,640 5.2% 5.5% 31.2% 205 788,598 42.4% 42.6% 27.4% $4,617 $3,720 38% 34% 18% 10%
Notes: R indicates "respondent." K indicates thousands.

2 2 E S T I M A T I N G T H E N O N R E S I D E N T P A R E N T P O P U L A T I O N I N N A T I O N A L S U R V E Y S
TABLE 8
Estimates of Male Nonresident Parents (NRPs) Aged 15-44 in the 2006-2010 NSFG
Universe: Men 15–44 Universe: Men 15–44 who
self-report as NRPs Universe: Men 15–44 who
indicate they paid child support
R has child living elsewhere with the
other parent or relatives
% of total who self-report as
NRPs
% of NRPs in
category
R pays child support (and is
required to pay)
% who self-report as
payers
% of payers in category
Average child
support paid
Median child
support paid
Percent Paying (Weighted)
N Weighted N Wgt. Wgt. N Weighted N Wgt. Wgt. Wgt. Wgt. $1–$3k
$3k–$5k
$5k–$9k $9k+
Total 1,235 6,847,166 11.9% 11.0% 100.0% 530 3,177,709 42.9% 46.4% 100.0% N/A N/A 21% 30% 28% 21%
Race/ethnicity
White, non-Hispanic 399 2,853,088 7.6% 7.7% 41.7% 233 1,790,477 58.4% 62.8% 56.3% N/A N/A 17% 34% 29% 20% Black, non-Hispanic 392 1,720,460 22.4% 23.4% 25.1% 159 677,770 40.6% 39.4% 21.3% N/A N/A 26% 20% 29% 25% Hispanic 351 1,761,886 14.6% 14.9% 25.7% 95 464,253 27.1% 26.3% 14.6% N/A N/A 29% 21% 23% 27% Other, non-Hispanic 93 511,733 9.6% 9.0% 7.5% 43 245,210 46.2% 47.9% 7.7% N/A N/A 19% 43% 26% 13%
Age
15–29 346 1,872,171 5.8% 5.9% 27.3% 120 804,077 34.7% 42.9% 25.3% N/A N/A 35% 31% 21% 12% 30–39 589 3,410,846 19.3% 17.4% 49.8% 278 1,672,015 47.2% 49.0% 52.6% N/A N/A 19% 31% 29% 21% 40–44 300 1,564,150 21.0% 14.9% 22.8% 132 701,617 44.0% 44.9% 22.1% N/A N/A 8% 25% 34% 33%
Education
< High school 450 2,416,348 13.1% 13.4% 35.3% 140 748,526 31.1% 31.0% 23.6% N/A N/A 43% 30% 19% 9% High school 430 2,274,036 16.8% 15.2% 33.2% 199 1,260,628 46.3% 55.4% 39.7% N/A N/A 17% 27% 34% 22% Some college 275 1,723,222 10.8% 10.5% 25.2% 148 950,334 53.8% 55.1% 29.9% N/A N/A 14% 35% 27% 24% Bachelor's degree + 80 433,560 4.3% 3.4% 6.3% 43 218,221 53.8% 50.3% 6.9% N/A N/A 0% 26% 28% 47%
Marital status
Married 308 2,425,862 10.9% 10.4% 35.4% 153 1,276,496 49.7% 52.6% 40.2% N/A N/A 19% 28% 32% 21% Widowed 8 36,692 44.4% 66.5% 0.5% 2 7,390 25.0% 20.1% 0.2% N/A N/A 0% 0% 100% 0% Divorced 271 1,376,735 41.4% 38.2% 20.1% 158 777,764 58.3% 56.5% 24.5% N/A N/A 12% 28% 32% 28% Separated 123 575,449 51.7% 53.5% 8.4% 41 161,754 33.3% 28.1% 5.1% N/A N/A 21% 19% 17% 42% Never married 525 2,432,429 7.9% 7.1% 35.5% 176 954,305 33.5% 39.2% 30.0% N/A N/A 31% 36% 21% 12%
Notes: R indicates "respondent." Average and median child support amounts not available for the NSFG. K indicates thousands.

E S T I M A T I N G T H E N O N R E S I D E N T P A R E N T P O P U L A T I O N I N N A T I O N A L S U R V E Y S 2 3
TABLE 9
Estimates of Male Nonresident Parents (NRPs) Aged 15-44 in National Surveys
Comparing the ASEC; SIPP TM4; and SIPP, Expanded Definition
Weighted Differences, ASEC vs. SIPP TM4
Weighted Differences, ASEC vs. SIPP Expanded Definition
Weighted Differences, SIPP TM4 vs. SIPP Expanded
Definition
% of NRPs
% of payers
Average child
support paid
Median child
support paid
% of NRPs
% of payers
Average child
support paid
Median child
support paid
% of NRPs
% of payers
Average child
support paid
Median child
support paid
Total1
-2.0%* 10.4%* -$560* -$40 -5.4%* 17.8%* -$165 $200 -3.3%* 7.4%* $395 $240
Race/ethnicity
White, non-Hispanic -3.3% -6.1%* -$444 -$648 -2.3% -4.3% -$132 -$198 1.0% 1.8% $313 $450 Black, non-Hispanic 4.0%* 6.0%* -$861 $70 3.2% 4.1% -$29 $310 -0.8% -2.0% $833 $240 Hispanic 0.1% -0.4% $180 -$700 -0.5% -0.2% $309 -$220 -0.6% 0.1% $128 $480 Other, non-Hispanic -0.8% 0.4% -$1,429 $324 -0.4% 0.5% -$1,053 $324 0.4% 0.1% $375 $0
Age
15–29 0.0% -1.3% $7 $168 -2.6% -2.0% $269 $168 -2.7% -0.7% $262 $0 30–39 -0.1% -1.7% -$301 -$184 -2.7% -1.5% -$130 -$40 -2.6% 0.2% $170 $144 40–44 0.0% 2.9% -$1,629* -$1,200 5.3%* 3.4% -$787 $0 5.3%* 0.5% $843 $1,200
Education
< High school 0.3% 2.4% -$624 -$1,200 0.3% 1.7% -$402 -$1,200 0.1% -0.6% $222 $0 High school 9.1%* 7.2%* -$295 $360 9.4%* 8.7%* -$149 $160 0.3% 1.5% $146 -$200 Some college -8.9%* -7.6%* $61 $212 -9.6%* -8.5%* $425 $356 -0.7% -0.9% $365 $144 Bachelor's degree + -0.4% -2.0% -$1,450 -$2,000 -0.1% -2.0% -$287 -$1,140 0.3% -0.1% $1,163 $860
Marital status
Married -0.4% 1.4% $5 $160 -3.3% -0.3% $306 $232 -2.9% -1.8% $301 $72 Widowed 0.1% 0.1% -$2,700 -$6,384 0.1% 0.1% -$2,277 -$6,384 0.0% 0.0% $423 $0 Divorced -1.6% -2.7% -$873 -$480 2.2% -0.9% -$422 $0 3.8%* 1.8% $451 $480 Separated 0.5% 0.7% -$2,023 -$1,100 1.8% 1.6% -$1,706 -$1,100 1.3% 0.8% $318 $0 Never married 1.3% 0.5% -$299 -$40 -0.9% -0.4% $7 $80 -2.1% -0.9% $306 $120
Notes: * Significant difference at p < 0.05. 1 Total row presents percent of population who are NRPs or payers; other rows present percentages of NRP or payer population in subgroups.

2 4 E S T I M A T I N G T H E N O N R E S I D E N T P A R E N T P O P U L A T I O N I N N A T I O N A L S U R V E Y S
TABLE 10
Estimates of Male Nonresident Parents (NRPs) Aged 15-44 in National Surveys
Comparing the NSFG to the ASEC; SIPP TM4; and SIPP, Expanded Definition
Weighted Differences, ASEC vs. NSFG
Weighted Differences, SIPP TM4 vs. NSFG
Weighted Differences, SIPP Expanded Definition vs. NSFG
% of NRPs
% of payers
Difference in Percent Paying
% of NRPs
% of payers
Difference in Percent Paying
% of NRPs
% of payers
Difference in Percent Paying
$1–$3k
$3k–$5k
$5k–$9k $9k+
$1–$3k
$3k–$5k
$5k–$9k $9k+
$1–$3k
$3k–$5k
$5k–$9k $9k+
Total1
-6.7%* 20.0%* 7%* -6% 4% -5% -4.7%* 9.6%* 5% -7% 1% 0% -1.4%* 2.2% 9%* -8%* -1% -1%
Race/ethnicity
White, non-Hispanic 12.6%* 1.8% 5% -11% 5% 1% 15.8%* 7.9% 8% -15%* 1% 6% 14.9%* 6.1% 10%* -15%* 1% 4% Black, non-Hispanic -3.8% -1.0% 12% 5% -1% -16%* -7.8%* -7.0% 5% 12% -7% -10% -6.9%* -5.0% 16%* 5% -10% -12%* Hispanic -6.7%* 1.3% 3% 6% 4% -13% -6.7%* 1.7% -3% 11% 12% -19%* -6.1%* 1.5% 4% 7% 5% -16%* Other, non-Hispanic -2.1% -2.1% 10% -24% 13% 1% -1.4% -2.5% 6% -12% -4% 10% -1.8% -2.6% 10% -12% -8% 10%
Age
15–29 -4.1% -5.5% 4% -2% 3% -4% -4.1% -4.2% 7% 1% -2% -6% -1.5% -3.6% 9% 0% -2% -7% 30–39 -2.0% -2.9% 8% -8% 2% -2% -2.0% -1.2% 5% -7% 3% -1% 0.7% -1.4% 8% -9% 2% -1% 40–44 6.1%* 8.4%* 13%* -4% 6% -15% 6.1%* 5.4% 9%* -9% -3% 3% 0.8% 5.0% 16%* -9% -6% -1%
Education
< High school -19.7%* -10.9%* 8% -10% 1% 1% -19.9%* -13.2%* -5% -3% 7% 1% -20.0%* -12.6%* -4% -3% 6% 0% High school 10.8%* 3.2% 13%* -1% -1% -10%* 1.7% -4.0% 14%* 2% -6% -10%* 1.4% -5.6% 16%* -2% -6% -9% Some college 2.9% 0.9% 8% -10% 7% -5% 11.8%* 8.4%* 14%* -12% 2% -4% 12.5%* 9.3%* 18%* -13% -1% -4% Bachelor's degree + 6.0%* 6.9%* 12%* -7% 10% -14% 6.4%* 8.8%* 6%* -15% 7% 3% 6.1%* 8.9%* 15%* -12% 3% -6%
Marital status
Married -1.7% -5.9% 4% -5% 5% -4% -1.3% -7.3% 8% -6% 0% -2% 1.6% -5.5% 11%* -7% -2% -2% Widowed -0.1% 0.2% 54%* 26% -100% 21% -0.3% 0.1% 20% 0% -20% 0% -0.2% 0.0% 17% 18% -34% 0% Divorced 5.9%* 4.9% 9% -7% 5% -7% 7.4%* 7.6%* 11%* -14%* 1% 2% 3.6% 5.8% 14%* -13%* -2% 1% Separated 1.1% 3.9%* 14% 1% 11% -25%* 0.6% 3.2% -7% 6% 21% -20% -0.7% 2.4% 0% 0% 19% -19% Never married -5.2%* -3.1% 8% -8% 3% -2% -6.4%* -3.5% 4% -1% -2% -1% -4.3% -2.7% 7% -3% -2% -2%
Notes: * Significant difference at p < 0.05. K indicates thousands. 1 Total row presents percent of population who are NRPs or payers; other rows present percentages of NRP or payer population in subgroups.

E S T I M A T I N G T H E N O N R E S I D E N T P A R E N T P O P U L A T I O N I N N A T I O N A L S U R V E Y S 2 5
About the Author
Kye Lippold is a research associate in the Income and Benefits Policy Center at the Urban
Institute, having joined in 2010. His research focuses on microsimulation analysis of tax and
transfer programs using the Transfer Income Model as well as studies using large
administrative datasets related to child support and nutrition programs. He is experienced
with nonexperimental program evaluation techniques, including difference-in-difference
analysis, regression discontinuity, and propensity score matching.
Lippold is currently pursuing a PhD in Economics at the University of California, San Diego.

2 6 E S T I M A T I N G T H E N O N R E S I D E N T P A R E N T P O P U L A T I O N I N N A T I O N A L S U R V E Y S
Acknowledgments
This brief was funded by the federal Office of Child Support Enforcement. We are grateful to them and to all our
funders, who make it possible for Urban to advance its mission.
The views expressed are those of the author and should not be attributed to the Urban Institute, its trustees,
or its funders. Funders do not determine research findings or the insights and recommendations of Urban experts.
Further information on the Urban Institute’s funding principles is available at www.urban.org/support.
The author thanks Elaine Sorensen and Laura Wheaton for their helpful comments on drafts.
ABOUT THE URBAN INST ITUTE The nonprofit Urban Institute is dedicated to elevating the debate on social and economic policy. For nearly five decades, Urban scholars have conducted research and offered evidence-based solutions that improve lives and strengthen communities across a rapidly urbanizing world. Their objective research helps expand opportunities for all, reduce hardship among the most vulnerable, and strengthen the effectiveness of the public sector.
Copyright © March 2014. Urban Institute. Permission is granted for reproduction of this file, with attribution to the Urban Institute.
2100 M Street NW Washington, DC 20037
www.urban.org