DQ03DR090 High Pressure Coolant Pump Failure VQ Crankshaft Machining
Investigations of High Service Pump Failure Events and Actions to Prevent Future Failures
Marvin Gnagy, P.E., PresidentPMG Consulting, Inc.
Hall of Fame WorkshopAugust 15, 2019

Investigations of High Service Pump Failure Events and Actions to Prevent Future Failures
Failures of existing turbine pumps Initial investigations of water chemistryChlorine contact clearwell operationsOperating data investigationsChemical feed point relocationResults and follow-up SCADA tuning effortsChanges in operating procedures
Agenda
2

Investigations of High Service Pump Failure Events and Actions to Prevent Future Failures
• 90 mgd capacity• 99 mgd high service
pumping capacity• Ferric sulfate and
sulfuric acid pretreatment in Actiflo
• Lime pH adjustment• Ozonation and
biological filtration• NaOH pH adjustment
and free chlorine disinfection
• Pump to Tampa Bay Water
• Further pH adjustment
• Ammonia feed for chloramination
Scaling Events and Pump Failures
3
Tampa Bay Regional Surface Water Treatment Plant

Investigations of High Service Pump Failure Events and Actions to Prevent Future Failures
Tampa Bay Regional Surface Water Treatment PlantHigh services pump failures occurred about once a month during a 3-year period
Locked up pumps and tripped breakersVarious random failures all six pumps Periods where multiple high service pumps out of service reducing reliability for pumping operationsPlant staff did not see any unusual water quality resultsMaintenance could not determine any electrical issues, but did notice scale build-up and pump shaft and impellersLifted pumps out of service with crane, had pump cleaned and rebuilt periodically with new bearingsAnnual maintenance and cleaning was costing about $75,000
Scaling Events and Pump Failures
4

Investigations of High Service Pump Failure Events and Actions to Prevent Future Failures
Appeared to be direct correlations between water quality changes and scaling events that led to pump failures during 2015-2017
High alkalinity and high calcium levels with associated pH levels greater than 7.9 appeared to result in elevated LSI and CCPP valuesWater quality changes likely resulted in scale development
Pump scale analyzed at Bowser -Morner as predominantly CaCO3
Scale deposited on pump impeller and rotating components causing pump failure
Scaling Events and Pump Failures
5
Investigations of High Service Pump Failure Events and Actions to Prevent Future Failures
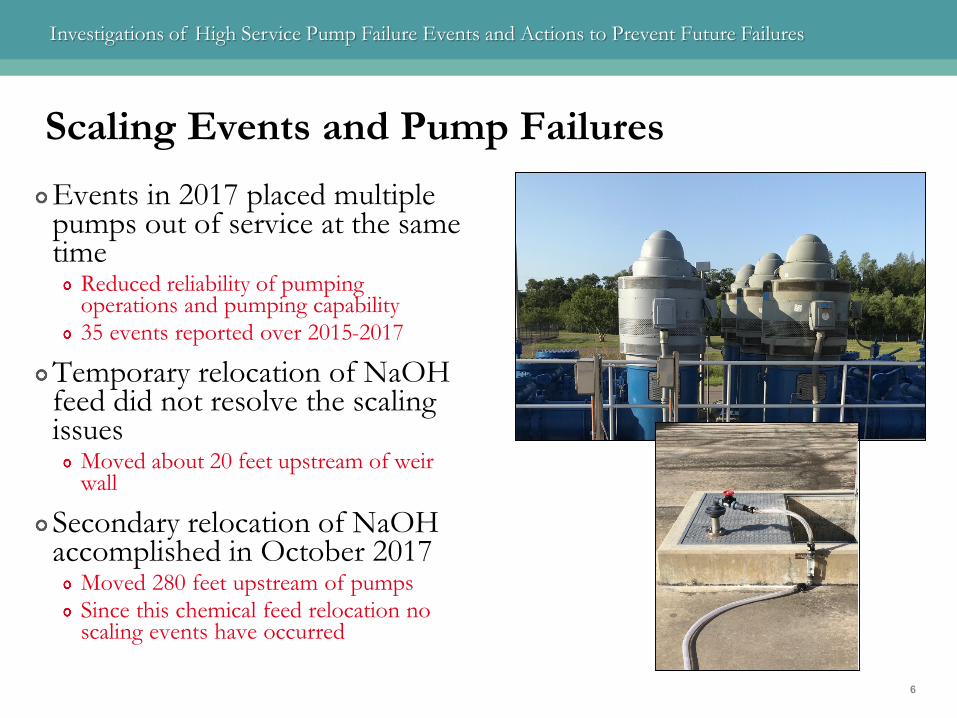
Events in 2017 placed multiple pumps out of service at the same time
Reduced reliability of pumping operations and pumping capability35 events reported over 2015-2017
Temporary relocation of NaOH feed did not resolve the scaling issues
Moved about 20 feet upstream of weir wall
Secondary relocation of NaOH accomplished in October 2017
Moved 280 feet upstream of pumpsSince this chemical feed relocation no scaling events have occurred
Scaling Events and Pump Failures
6

Investigations of High Service Pump Failure Events and Actions to Prevent Future Failures
Cursory review of water quality data did not reveal abnormal water qualityThree separate pump failure events reviewed in more detail during fall periods of similar water temperature
Water quality data reviewed 2015 - 2017Water pHChloridesSulfatesAlkalinityCalciumEquilibrium pH and AlkalinityLSICCPPBayliss curveCSMR (lead and copper impacts)
Scaling Period Evaluations
7
Some scale dissolved in acid, but minor

Investigations of High Service Pump Failure Events and Actions to Prevent Future Failures
• Previous cleaning of scale at weir wall (after 6 years of operation)
• Scale 12-inches thick in some locations
• NaOH discharge lines completed blocked off
Scaling Period Evaluations
8

Investigations of High Service Pump Failure Events and Actions to Prevent Future Failures
Monitoring of individual high service pump discharges Random increased pH up to 9.2 Scaling potential increased according to pH levels Possible channeling of NaOH feed depending on pumps operating Appeared that about 4 days of high pH induced scale build-up and
consequently pump failure Switching pumps slowed scale build-up, but failures kept occurring Water velocity known to impact CaCO3 scale deposits
Scaling Period Evaluations
9

Investigations of High Service Pump Failure Events and Actions to Prevent Future Failures
Chlorine Contact Clearwell Operations
10
Investigations of High Service Pump Failure Events and Actions to Prevent Future Failures
Chlorine Contact Clearwell Operations
11
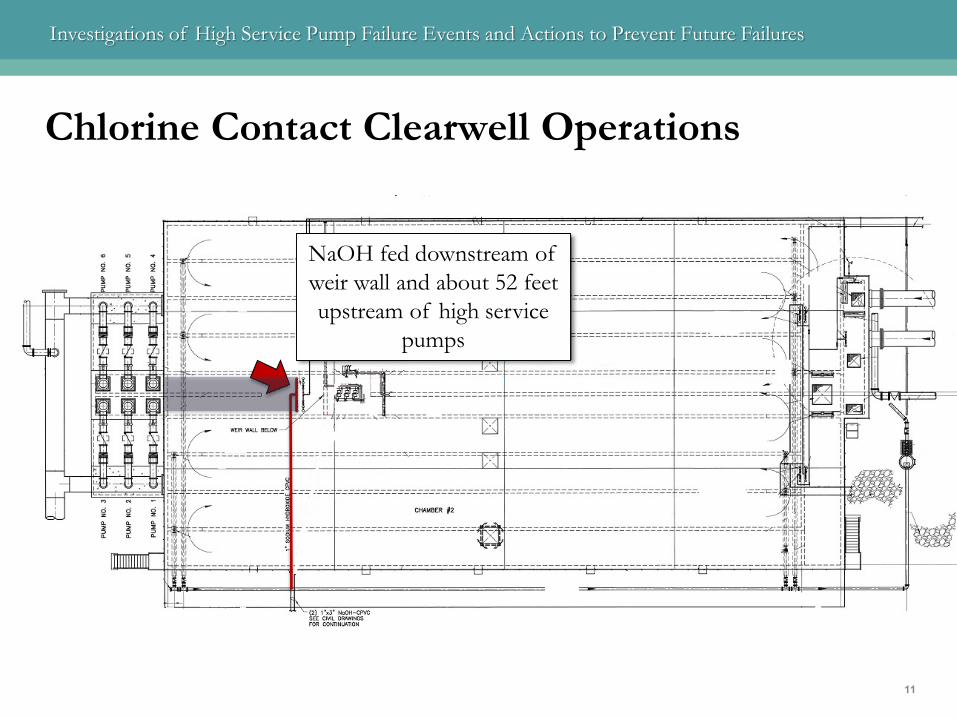
NaOH fed downstream of weir wall and about 52 feet upstream of high service
pumps

Investigations of High Service Pump Failure Events and Actions to Prevent Future Failures
Chlorine Contact Clearwell Operations
12
NaOH initially fed downstream of weir wall
and about 52 feet upstream of high service pumps
pH monitored before NaOH feed and after high
service pumps

Investigations of High Service Pump Failure Events and Actions to Prevent Future Failures
Average chemical feed travel time to high service pumps less than one (1) minute at 70 mgd
NaOH/calcium reaction in water complete and reaches equilibrium after about 3 minutes to 4 minutesLikely chemical reactions occurring in pump suction and rotating impeller causing scale deposits (highest water velocity areas)Scale deposition increases pump friction and amp draw resulting in pump overheating leading ultimately to pump failure and tripped breakers
Chlorine Contact Clearwell Operations
13

Investigations of High Service Pump Failure Events and Actions to Prevent Future Failures
Investigations of operating data and water quality were made to:
Identify possible cause(s) of scale formations leading to pump failuresDefine water quality parameters that result in pump scalingDevelop means to reduce or eliminate pump scaling issuesEstimate water quality parameters and operating conditions to reduce or eliminate pump scalingImprove high service pump reliability
Data Investigations
14

Investigations of High Service Pump Failure Events and Actions to Prevent Future Failures
2015 Pump Failures - LSI
15
0.30
0.33
0.35
0.38
0.40
0.43
0.45
0.48
0.50
0.53
0.55
0.58
0.60
0.63
0.65
0.68
0.70
7.75 7.80 7.85 7.90 7.95 8.00 8.05
Lang
elie
r Ind
ex
Finished Water pH, s.u.
Pump 2 locked up due to scale
10/7/15
October 1 - 10, 2015

Investigations of High Service Pump Failure Events and Actions to Prevent Future Failures
2015 Pump Failures - CCPP
16
2.0
2.5
3.0
3.5
4.0
4.5
5.0
5.5
6.0
6.5
7.0
7.5
8.0
8.5
9.0
7.75 7.80 7.85 7.90 7.95 8.00 8.05
CC
PP,
mg/
L as
CaC
O3
Finished Water pH, s.u.
October 1 - 10, 2015
Pump 2 locked up due to scale
10/7/15
Investigations of High Service Pump Failure Events and Actions to Prevent Future Failures
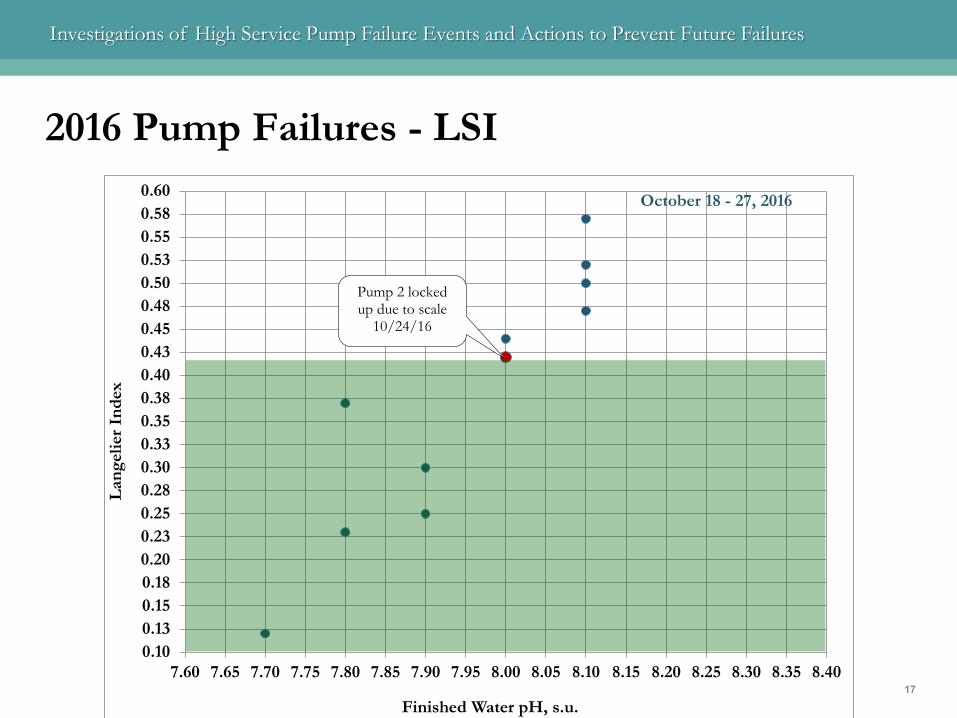
2016 Pump Failures - LSI
17
0.100.130.150.180.200.230.250.280.300.330.350.380.400.430.450.480.500.530.550.580.60
7.60 7.65 7.70 7.75 7.80 7.85 7.90 7.95 8.00 8.05 8.10 8.15 8.20 8.25 8.30 8.35 8.40
Lang
elie
r Ind
ex
Finished Water pH, s.u.
Pump 2 locked up due to scale
10/24/16
October 18 - 27, 2016

Investigations of High Service Pump Failure Events and Actions to Prevent Future Failures
2016 Pump Failures - CCPP
18
0.0
0.5
1.0
1.5
2.0
2.5
3.0
3.5
4.0
4.5
5.0
5.5
6.0
6.5
7.0
7.60 7.65 7.70 7.75 7.80 7.85 7.90 7.95 8.00 8.05 8.10 8.15 8.20 8.25 8.30 8.35 8.40
CC
PP,
mg/
L as
CaC
O3
Finished Water pH, s.u.
October 18 - 27, 2016
Pump 2 locked up due to scale
10/24/16

Investigations of High Service Pump Failure Events and Actions to Prevent Future Failures
2017 Pump Failures - LSI
19
0.000.020.040.060.080.100.120.140.160.180.200.220.240.260.280.300.320.340.360.380.400.420.440.460.480.500.520.540.560.580.60
7.75 7.80 7.85 7.90 7.95 8.00 8.05 8.10 8.15 8.20
Lang
elie
r Ind
ex
Finished Water pH, s.u.
Pumps 4, 5, 6 locked up due to
scale 9/20/17Pump 6 locked up due to scale
9/26/17
September 20 - 30, 2017

Investigations of High Service Pump Failure Events and Actions to Prevent Future Failures
2017 Pump Failures - CCPP
20
0.0
0.5
1.0
1.5
2.0
2.5
3.0
3.5
4.0
4.5
5.0
5.5
6.0
7.75 7.80 7.85 7.90 7.95 8.00 8.05 8.10 8.15 8.20
CC
PP,
mg/
L or
pH
eq, s
.u.
Finished Water pH, s.u.
Pumps 4, 5, 6 locked up due to
scale 9/20/17
September 20 - 30, 2017
Pump 6 locked up due to scale
9/26/17

Investigations of High Service Pump Failure Events and Actions to Prevent Future Failures
Information suggested insufficient reaction time between chemical feed and pumping operations
NaOH reacting with calcium producing CaCO 3like softening treatmentIncreased reaction time with relocation of chemical feed for pH adjustment might helpPossibly convert to lower strength NaOH to improve mixing into solution
Data suggested water pH target needs to be more closely matched with alkalinity and calcium parameters
Limit LSI and CCPP based on inlet water qualityPossibly suggest new target values for water pH, LSI, and CCPP to control pump scaling
Data Analysis
21
Previous scale build-up at weir wall
Investigations of High Service Pump Failure Events and Actions to Prevent Future Failures
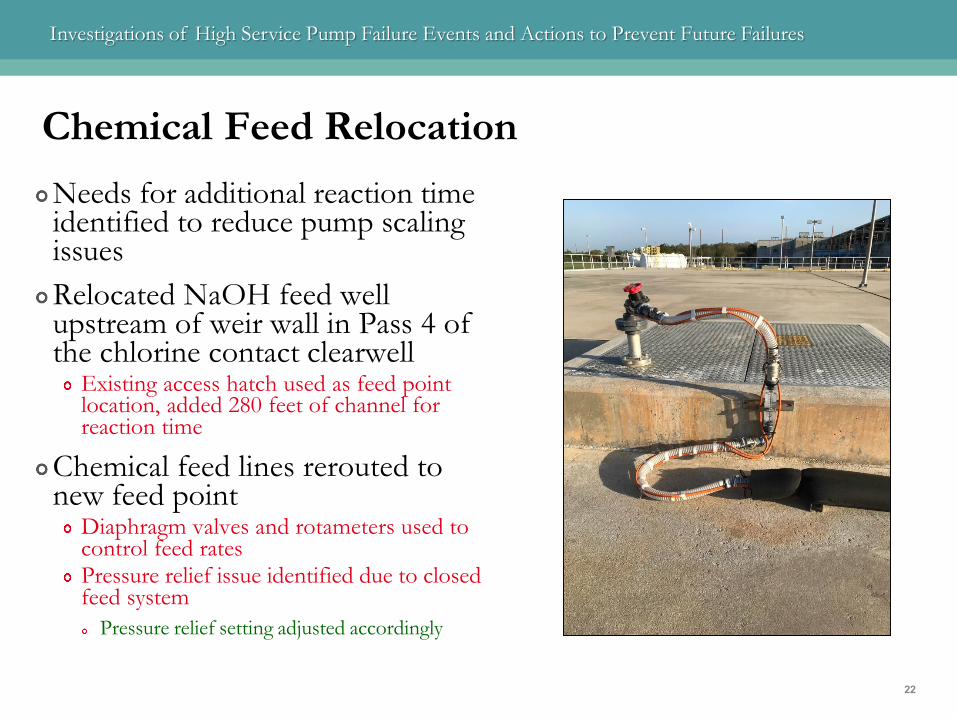
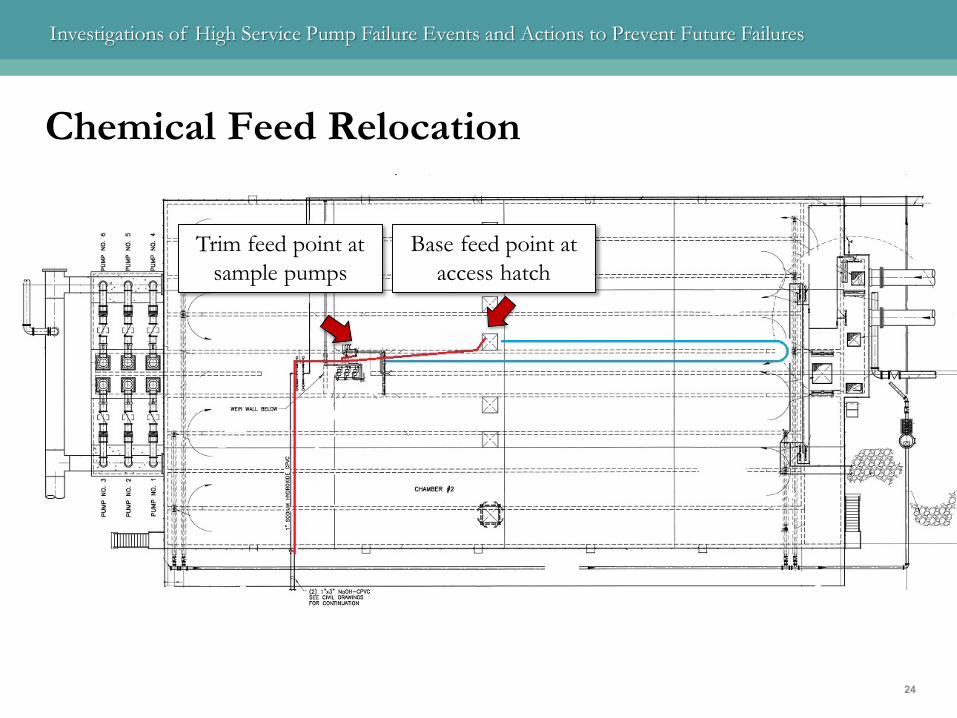
Needs for additional reaction time identified to reduce pump scaling issuesRelocated NaOH feed well upstream of weir wall in Pass 4 of the chlorine contact clearwell
Existing access hatch used as feed point location, added 280 feet of channel for reaction time
Chemical feed lines rerouted to new feed point
Diaphragm valves and rotameters used to control feed ratesPressure relief issue identified due to closed feed system
Pressure relief setting adjusted accordingly
Chemical Feed Relocation
22

Investigations of High Service Pump Failure Events and Actions to Prevent Future Failures
Chemical Feed Relocation
23
Base feed point at access hatch
NaOH travel path through pass 4
and pass 5
Investigations of High Service Pump Failure Events and Actions to Prevent Future Failures
Chemical Feed Relocation
24
Base feed point at access hatch
Trim feed point at sample pumps

Investigations of High Service Pump Failure Events and Actions to Prevent Future Failures
Chemical Feed Relocation
25
Base feed point at access hatch
Trim feed point at sample pumps
pH monitored before NaOH feed and after high
service pumps
NaOH detention time at 70 mgd – 2.8 minutes
Investigations of High Service Pump Failure Events and Actions to Prevent Future Failures
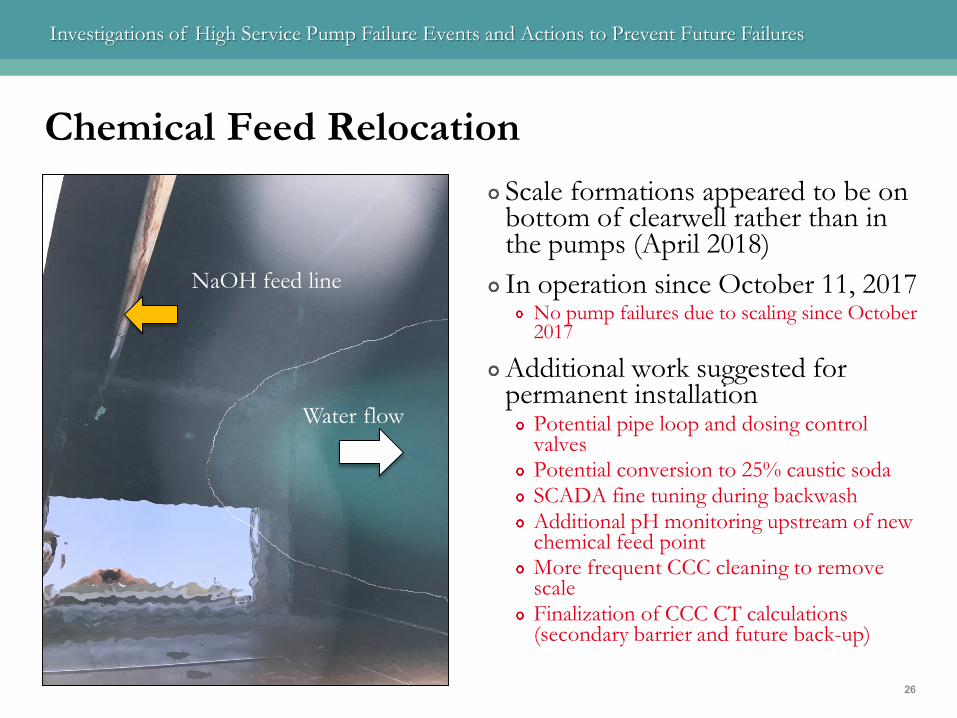
Scale formations appeared to be on bottom of clearwell rather than in the pumps (April 2018)In operation since October 11, 2017
No pump failures due to scaling since October 2017
Additional work suggested for permanent installation
Potential pipe loop and dosing control valvesPotential conversion to 25% caustic sodaSCADA fine tuning during backwashAdditional pH monitoring upstream of new chemical feed pointMore frequent CCC cleaning to remove scaleFinalization of CCC CT calculations (secondary barrier and future back-up)
Chemical Feed Relocation
26
NaOH feed line
Water flow

Investigations of High Service Pump Failure Events and Actions to Prevent Future Failures
Chemical Feed Relocation
27
6.40
6.60
6.80
7.00
7.20
7.40
7.60
7.80
8.00
8.20
8.40
8.60
8.80
9.00
9.20
1115 1215 1315 1415 1515 1615 1715
Wat
er p
H, s
.u.
Time Intervals
Intermediate pH Finished pH
Stabilized finished water pH at 70 mgd production
74 mgd production to
fill clearwell for backwash, pH
stable
Filter backwash,pH spiked then
quickly stabilized to established
Initial feed adjustment at
11:20 am
October 2017

Investigations of High Service Pump Failure Events and Actions to Prevent Future Failures
Chemical Feed Relocation
28
6.40
6.60
6.80
7.00
7.20
7.40
7.60
7.80
8.00
8.20
8.40
8.60
8.80
9.00
9.20
1115 1215 1315 1415 1515 1615 1715
Wat
er p
H, s
.u.
Time Intervals
Intermediate pH Finished pH
Stabilized finished water pH at 70 mgd production
74 mgd production to
fill clearwell for backwash, pH
stable
Filter backwash,pH spiked then
quickly stabilized to established
Initial feed adjustment at
11:20 am
6 hours for clearwell pH and finished pH to converge
Investigations of High Service Pump Failure Events and Actions to Prevent Future Failures
Chemical Feed Relocation
29R² = 0.9906
0
10
20
30
40
50
60
70
80
90
100
110
120
130
140
6.90 7.00 7.10 7.20 7.30 7.40 7.50 7.60 7.70 7.80 7.90
Hyd
raul
ic D
eten
tion
Tim
es P
rodu
ced
Intermediate Water pH, s.u.
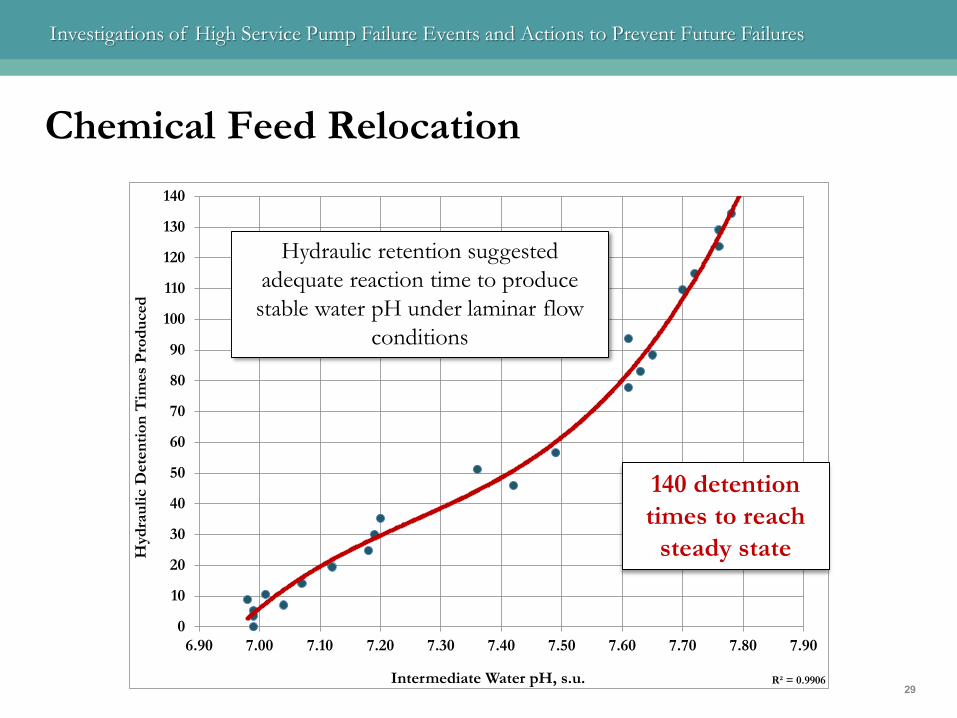
Hydraulic retention suggested adequate reaction time to produce stable water pH under laminar flow
conditions
140 detention times to reach
steady state

Investigations of High Service Pump Failure Events and Actions to Prevent Future Failures
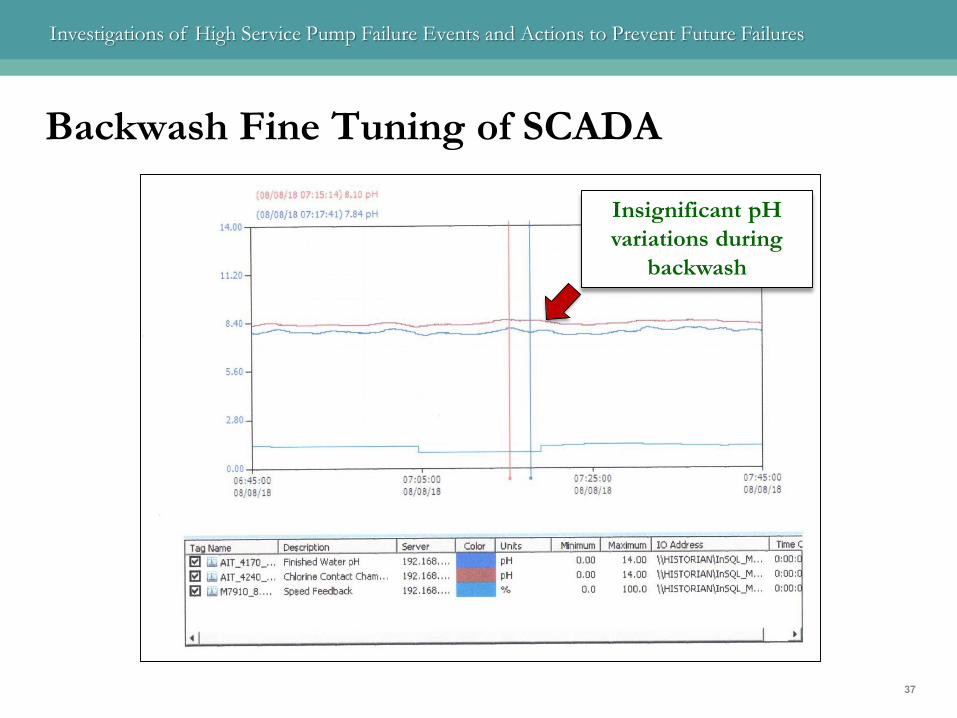
Notable pH spikes observed during backwash cycles
Backwash pump draws significant flow from production for filter washesSignificant reduction in flow to CCC during backwashNaOH feed was not altered for the changes in flow to the contact clearwells (flow pacing based on high service production)Resulted in a slug of NaOH that created a spike in pH after backwashpH spikes may contribute to pump failures due to scaling
SCADA Backwash Fine Tuning
30

Investigations of High Service Pump Failure Events and Actions to Prevent Future Failures
Backwash Fine Tuning of SCADA
31
Initial trial with
NaOH at access hatch
spikes during backwash cycles up to
0.6 pH units

Investigations of High Service Pump Failure Events and Actions to Prevent Future Failures
Backwash Fine Tuning of SCADA
32
pH dip during backwash cycles up to 0.4 units with NaOH
turned off during backwash

Investigations of High Service Pump Failure Events and Actions to Prevent Future Failures
Backwash Fine Tuning of SCADA
33
pH dip during backwash cycles up to 0.25 units with NaOH speed at 50% and 2-minute offset from
backwash cycle
Investigations of High Service Pump Failure Events and Actions to Prevent Future Failures
Backwash Fine Tuning of SCADA
34
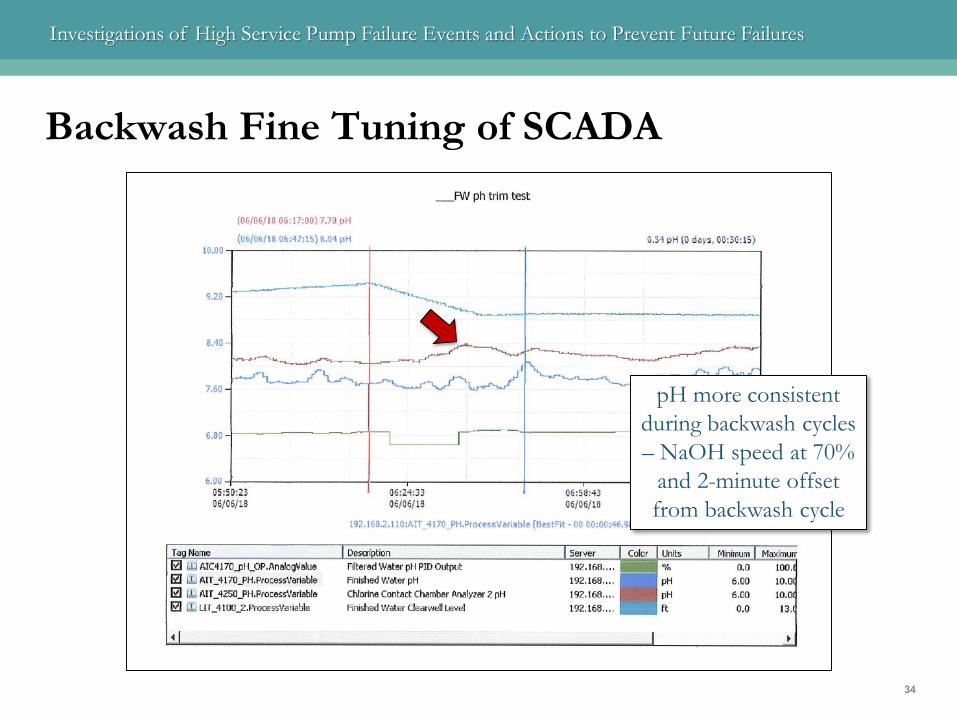
pH more consistent during backwash cycles – NaOH speed at 70%
and 2-minute offset from backwash cycle

Investigations of High Service Pump Failure Events and Actions to Prevent Future Failures
Backwash Fine Tuning of SCADA
35
y = 0.000167x2 - 0.033274x + 1.685889R² = 0.997053
0.0%
5.0%
10.0%
15.0%
20.0%
25.0%
30.0%
35.0%
40.0%
45.0%
50.0%
55.0%
60.0%
65.0%
70.0%
40 50 60 70 80 90 100
NaO
H S
peed
Red
uctio
n D
urin
g B
ackw
ash
Finished Water Flow, mgd

Investigations of High Service Pump Failure Events and Actions to Prevent Future Failures
Backwash Fine Tuning of SCADA
36
y = 0.000167x2 - 0.033274x + 1.685889R² = 0.997053
0.0%
5.0%
10.0%
15.0%
20.0%
25.0%
30.0%
35.0%
40.0%
45.0%
50.0%
55.0%
60.0%
65.0%
70.0%
40 50 60 70 80 90 100
NaO
H S
peed
Red
uctio
n D
urin
g B
ackw
ash
Finished Water Flow, mgd
28% NaOH speed reduction during backwash at 60 mgd
production rate. Flow pacing now enabled according to flow
being treated.
Investigations of High Service Pump Failure Events and Actions to Prevent Future Failures
Backwash Fine Tuning of SCADA
37
Insignificant pH variations during
backwash

Investigations of High Service Pump Failure Events and Actions to Prevent Future Failures
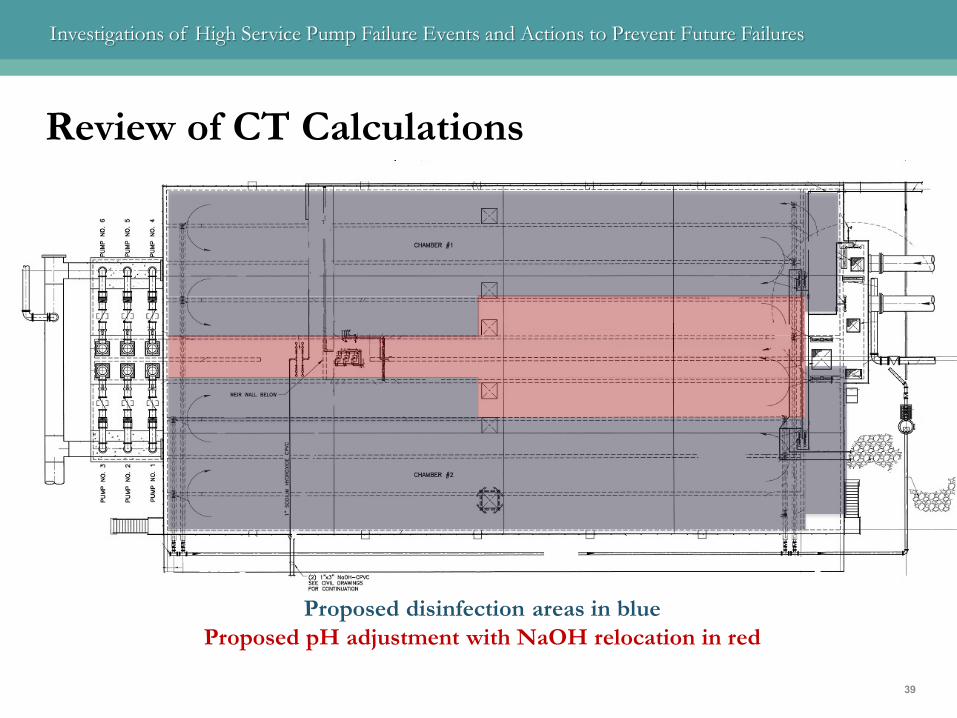
CT compliance generally met in ozone contactorsCT reviews for chlorine contact clearwell made as secondary barrier and as back-up
Revised clearwell volume based on relocated NaOH feed pointVerified state approved baffling factorDeveloped CT model with new configurations to determine worst -case scenarioModel predictions meet CT if ozone contactor out -of-service
Review of CT Calculations
38
Investigations of High Service Pump Failure Events and Actions to Prevent Future Failures
Review of CT Calculations
39
Proposed disinfection areas in blueProposed pH adjustment with NaOH relocation in red

Investigations of High Service Pump Failure Events and Actions to Prevent Future Failures
Review of CT Calculations
40
2
99 34,373 7.00 20.0 7.5 2.80 11.6 30.1 2.58
PEAK HOURLY TREATMENT FLOW EACH
CHAMBER, gpm
HIGHEST WATER pH
LOWEST WATER TEMP.
oC
CALCULATED CT mg/L-minutes
REQUIRED CT FROM TABLES
mg/L-min.
CHLORINE CONTACT
CHAMBER FREE CHLORINE CONC. mg/L
PLANT PRODUCTION
RATE, mgd
TAMPA BAY REGIONAL SURFACE WATER TREATMENT PLANTCT CALCULATIONS MODEL FOR CHLORINE CONTACT CHAMBERS
Chlorine contact chambers in service (1 or 2)
LOWEST CHLORINE CONTACT CHAMBER
OPERATING LEVEL, ft.
CT RATIO
CT model developed for Tampa Regional plant

Investigations of High Service Pump Failure Events and Actions to Prevent Future Failures
1
99 68,746 7.00 20.0 7.5 2.80 11.6 15.0 1.29
PEAK HOURLY TREATMENT FLOW EACH
CHAMBER, gpm
HIGHEST WATER pH
LOWEST WATER TEMP.
oC
CALCULATED CT mg/L-minutes
REQUIRED CT FROM TABLES
mg/L-min.
CHLORINE CONTACT
CHAMBER FREE CHLORINE CONC. mg/L
PLANT PRODUCTION
RATE, mgd
TAMPA BAY REGIONAL SURFACE WATER TREATMENT PLANTCT CALCULATIONS MODEL FOR CHLORINE CONTACT CHAMBERS
Chlorine contact chambers in service (1 or 2)
LOWEST CHLORINE CONTACT CHAMBER
OPERATING LEVEL, ft.
CT RATIO
Review of CT Calculations
41
CT model developed for Tampa Regional plant
Investigations of High Service Pump Failure Events and Actions to Prevent Future Failures
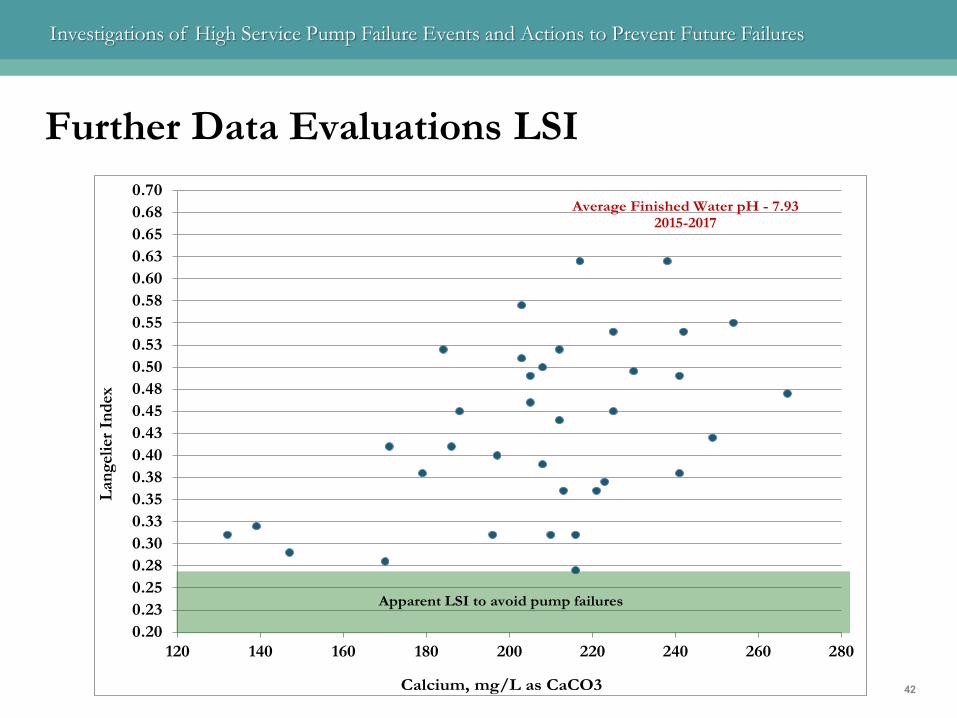
Further Data Evaluations LSI
42
0.200.230.250.280.300.330.350.380.400.430.450.480.500.530.550.580.600.630.650.680.70
120 140 160 180 200 220 240 260 280
Lang
elie
r Ind
ex
Calcium, mg/L as CaCO3
Average Finished Water pH - 7.932015-2017
Apparent LSI to avoid pump failures

Investigations of High Service Pump Failure Events and Actions to Prevent Future Failures
Further Data Evaluations CCPP
43
0.00.51.01.52.02.53.03.54.04.55.05.56.06.57.07.58.08.59.09.5
10.0
120 140 160 180 200 220 240 260 280
CCPP
, mg/
L as
CaC
O3
Calcium, mg/L as CaCO3
Average Finished Water pH - 7.932015-2017
Apparent CCPP to avoid pump failures
Investigations of High Service Pump Failure Events and Actions to Prevent Future Failures
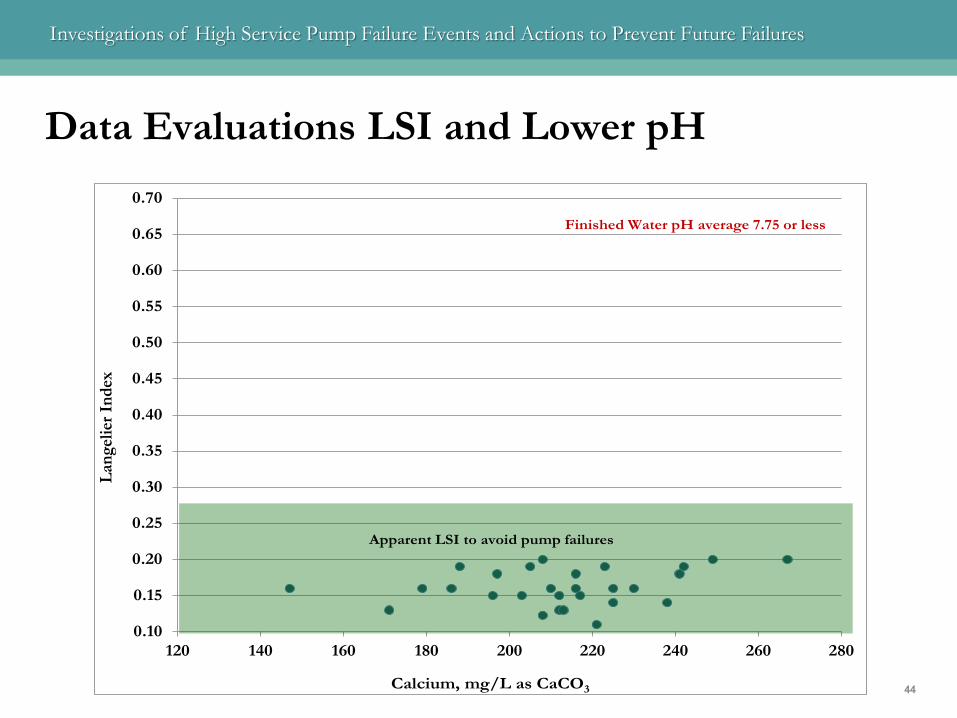
Data Evaluations LSI and Lower pH
44
0.10
0.15
0.20
0.25
0.30
0.35
0.40
0.45
0.50
0.55
0.60
0.65
0.70
120 140 160 180 200 220 240 260 280
Lang
elie
r Ind
ex
Calcium, mg/L as CaCO3
Finished Water pH average 7.75 or less
Apparent LSI to avoid pump failures

Investigations of High Service Pump Failure Events and Actions to Prevent Future Failures
Data Evaluations CCPP and Lower pH
45
0.00
1.00
2.00
3.00
4.00
5.00
6.00
7.00
8.00
9.00
10.00
120 140 160 180 200 220 240 260 280
CCPP
, mg/
Las C
aCO
3
Calcium, mg/L as CaCO3
Finished Water pH average 7.75 or less
Apparent CCPP to avoid pump failures
Investigations of High Service Pump Failure Events and Actions to Prevent Future Failures
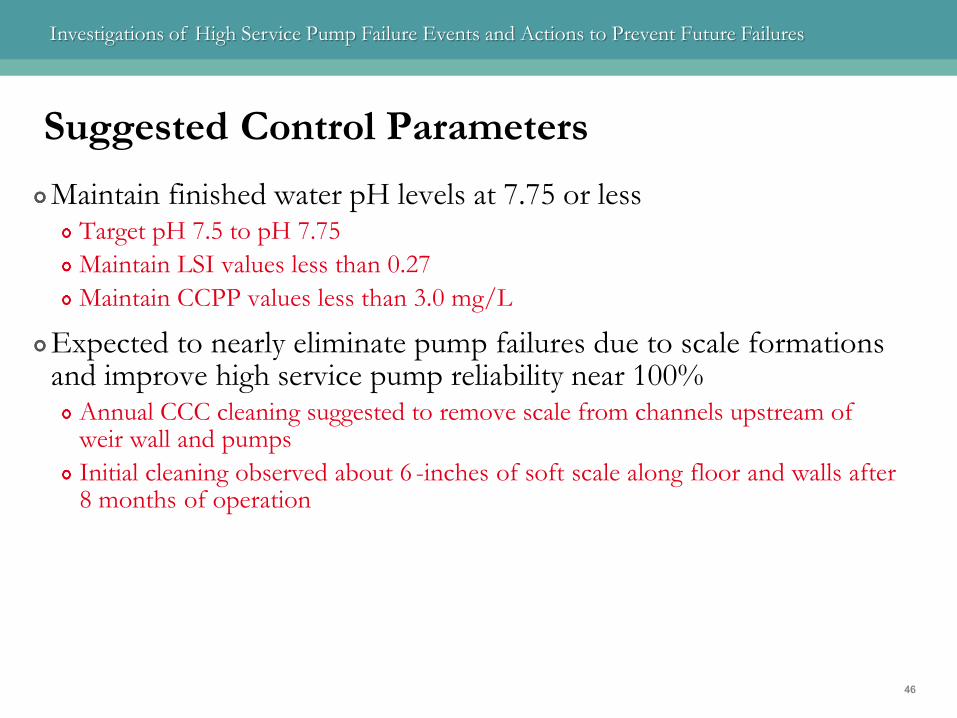
Maintain finished water pH levels at 7.75 or lessTarget pH 7.5 to pH 7.75 Maintain LSI values less than 0.27 Maintain CCPP values less than 3.0 mg/L
Expected to nearly eliminate pump failures due to scale formations and improve high service pump reliability near 100%
Annual CCC cleaning suggested to remove scale from channels upstream of weir wall and pumpsInitial cleaning observed about 6 -inches of soft scale along floor and walls after 8 months of operation
Suggested Control Parameters
46

Investigations of High Service Pump Failure Events and Actions to Prevent Future Failures
Conversion to 25% NaOH for treatmentImproved mixing in contact clearwell since specific gravity is closer to sodium hypochloriteCrystallization point is 1oF rather than 54oF (heat tracing not needed)No increase in costs (NaOH cost based on dry weight)
Costs verified by chemical supplierIncreased operating speed of the feed pumps (12% to 24%) and provided more reliability and flexibility in chemical feed75,000 gallons storage available
Projected usage at 75,000 gallons per month at 64 mgd
pH adjustment SOP re-written once details finalized
Suggested Control Parameters
47

Investigations of High Service Pump Failure Events and Actions to Prevent Future Failures
Reduced target pH to no more than 7.75 LSI and CCPP continue to be monitored, but no longer a primary
goal
Converted to 25% NaOH Feed pump operating in nearer to middle capacity range
SCADA fine tuning maintaining water pH ±0.11 units SOP revised to target pH levels and operating conditions Discusses pump failures due to scale Discusses SCADA tuning to maintain pH during backwash Outlines target parameters to avoid pump scaling
Changes in Operating Procedures
48
Investigations of High Service Pump Failure Events and Actions to Prevent Future Failures
4949