INVESTIGATION OF WATERHAMMER PROBLEMS …etd.lib.metu.edu.tr/upload/12615452/index.pdfi...
84
INVESTIGATION OF WATERHAMMER PROBLEMS IN THE PENSTOCKS OF PUMPED- STORAGE POWER PLANTS A THESIS SUBMITTED TO THE GRADUATE SCHOOL OF NATURAL AND APPLIED SCIENCES OF MIDDLE EAST TECHNICAL UNIVERSITY BY ALİ ERSİN DİNÇER IN PARTIAL FULLFILLMENT OF THE REQUIREMENTS FOR THE DEGREE OF MASTER OF SCIENCE IN CIVIL ENGINEERING JANUARY 2013
Transcript of INVESTIGATION OF WATERHAMMER PROBLEMS …etd.lib.metu.edu.tr/upload/12615452/index.pdfi...
i
INVESTIGATION OF WATERHAMMER PROBLEMS IN THE PENSTOCKS OF PUMPED-
STORAGE POWER PLANTS
A THESIS SUBMITTED TO
THE GRADUATE SCHOOL OF NATURAL AND APPLIED SCIENCES
OF
MIDDLE EAST TECHNICAL UNIVERSITY
BY
ALİ ERSİN DİNÇER
IN PARTIAL FULLFILLMENT OF THE REQUIREMENTS
FOR
THE DEGREE OF MASTER OF SCIENCE
IN
CIVIL ENGINEERING
JANUARY 2013


iii
Approval of the thesis:
INVESTIGATION OF WATERHAMMER PROBLEMS IN THE PENSTOCKS OF
PUMPED-STORAGE POWER PLANTS
submitted by ALİ ERSİN DİNÇER in partial fulfillment of the requirements for the degree of
Master Science in Civil Engineering Department, Middle East Technical University by,
Prof. Dr. Canan Özgen
Dean, Graduate School of Natural and Applied Sciences
Prof. Dr. Ahmet Cevdet Yalçıner
Head of Department, Civil Engineering
Assoc. Prof. Dr. Zafer Bozkuş
Supervisor, Civil Engineering Dept., METU
Examining Committee Members
Prof. Dr. İsmail AYDIN
Civil Engineering Dept., METU
Assoc. Prof. Dr. Zafer Bozkuş
Civil Engineering Dept., METU
Assoc. Prof. Dr. Nuri Merzi
Civil Engineering Dept., METU
Assoc. Prof. Dr. Mete Köken
Civil Engineering Dept., METU
Maksut Saraç
Head of the Project Department of YEGM, EIE
Date: 28 January 2013

iv
I hereby declare that all information in this document has been obtained and presented in
accordance with academic rules and ethical conduct. I also declare that, as required by these
rules and conduct, I have fully cited and referenced all material and results that are not
original to this work.
Name, Last name: Ali Ersin DİNÇER
Signature :
v
ABSTRACT
INVESTIGATION OF WATERHAMMER PROBLEMS IN THE PENSTOCKS OF
PUMPED-STORAGE POWER PLANTS
Dinçer, Ali Ersin
M.S., Department of Civil Engineering
Supervisor: Assoc. Prof. Dr. Zafer Bozkuş
January 2013, 70 Pages
Waterhammer is an undesirable event, caused by sudden flow changes in a confined pipe system.
When it occurs, its consequences can be very costly and even sometimes deadly. In general, it may
be encountered in the penstocks of hydropower plants, water transmission lines, water networks, etc.
Therefore, the operation guidelines of the hydropower plants should be defined correctly. In this
thesis, waterhammer problems in pumped storage hydropower plants are investigated. Time
dependent flow conditions in the penstocks are studied by the help of computer software,
HAMMER. The software solves nonlinear differential equations by using method of characteristics.
Firstly, hydraulic transients for various operational cases are investigated using some scenarios.
Then a surge tank, protective device for waterhammer, is added to the system and for the same
operational cases, hydraulic transients are studied again. Finally, the results obtained from the
operation of the system with and without surge tank are compared. Wind-hydro hybrid systems are
also included in the study.
Keywords: Waterhammer, Hydraulic Transients, Pumped-storage Hydropower Plants, Wind-Hydro
Hybrid Systems, HAMMER

vi
ÖZ
POMPALI DEPOLAMALI ENERJİ SANTRALLERİNİN CEBRİ BORULARINDA
OLUŞAN SU DARBESİ PROBLEMLERİNİN ARAŞTIRILMASI
Dinçer, Ali Ersin
Yüksek Lisans, İnşaat Mühendisliği Bölümü
Tez Yöneticisi: Doç. Dr. Zafer Bozkuş
Ocak 2013, 70 Sayfa
Su darbesi, kapalı boru sistemindeki ani akım değişimlerinden oluşan, istenmeyen bir durumdur. Su
darbesi oluştuğu zaman, sonuçları çok ağır ve hatta ölümcül bile olabilir. Su darbesi, genellikle
hidroelektrik santrallerin cebri borularında, su iletim hatlarında, su şebekelerinde vs. meydana gelir.
Bu nedenle hidroelektrik santrallerin işletme prensipleri doğru bir şekilde belirlenmelidir. Bu tezde,
pompajlı-depolamalı hidrolik santrallerdeki su darbesi sorunları araştırılmıştır. Cebri borulardaki
zamana bağlı olarak değişen akış durumları, HAMMER adlı bir bilgisayar programı yardımıyla
incelenmiştir. Bu program, doğrusal olmayan diferansiyel denklemleri, karakteristikler metodunu
kullanarak çözer. İlk önce, bazı senaryolar kullanarak, farklı işletim durumları için, zamana bağlı
akımlar incelenmiştir. Daha sonra, su darbesi önlem aracı olarak denge bacası sisteme eklenmiştir ve
aynı işletim durumları için zamana bağlı akımlar tekrar incelenmiştir. Son olarak, sistemin denge
bacalı ve denge bacasız çalışmasından elde edilen sonuçlar karşılaştırılmıştır. Bu çalışmaya ayrıca
su-rüzgar hibrit sistemleri de dahil edilmiştir.
Anahtar kelimler: Su darbesi, Zamana bağlı akım, Pompalı-Depolamalı Hidroelektrik Santraller, Su-
Rüzgar Hibrit Sistemleri, HAMMER

vii
To My Parents

viii
ACKNOWLEDGEMENTS
I wish to express my deepest gratitude to my supervisor Dr. Zafer Bozkuş for his support,
instruction, criticism, and inspirations. This thesis could not have been completed without his help.
Working with him has been a great pleasure for me.
I also want to thank Maksut Saraç for his suggestions and comments. With his great contribution this
thesis has been completed.
I am also grateful to my girlfriend Ezgi Başçoban and my dearest friends Samet Dursun, Salih
Erakman, Taner Atıcı, Cüneyt Yavuz, Muratcan Özalp and Kayra Ergen for their motivation and
support.
The assistance of my aunt Nazire Nergis Dinçer, are appreciatively acknowledged. Her help was one
of the main reasons I could complete my thesis.
My dearest family is the most important thing in my life. I want to thank them profoundly. My father
Ahmet Emin and my mother Hasibe have always supported me. Their endless love and support
always push me to do the best in my life. My sister Esin also deserves special thanks. She was
always standing by me all my life.
ix
TABLE OF CONTENTS
ABSTRACT ......................................................................................................................................... v
ÖZ ........................................................................................................................................................ vi
ACKNOWLEDGEMENTS ............................................................................................................... viii
LIST OF TABLES ................................................................................................................................ x
LIST OF FIGURES ............................................................................................................................. xi
LIST OF SYMBOLS AND ABBREVIATIONS ............................................................................... xiii
CHAPTERS
1. INTRODUCTION ....................................................................................................................... 1
1.1 Introduction .......................................................................................................................... 1
1.2 Literature Survey ................................................................................................................. 2
1.3 The Scope of the Study ........................................................................................................ 5
2. TRANSIENT FLOW ................................................................................................................... 7
2.1 Classification of Flow .......................................................................................................... 7
2.2 Waterhammer ...................................................................................................................... 7
2.3 Derivations of the Transient Equations .............................................................................. 10
2.3.1 Wave Speed Equation ............................................................................................... 10
2.3.2 Continuity and Momentum Equations ...................................................................... 11
2.3.4 Solution by Method of Characteristics ...................................................................... 13
3. PUMPED-STORAGE HYDROPOWER PLANTS (PSHPs) .................................................... 17
3.1 General ............................................................................................................................... 17
3.2 PSHPs in the World ........................................................................................................... 18
3.3 Historical Development of PSHPs ..................................................................................... 19
3.4 Types of PSHPs ................................................................................................................. 20
3.5 Parts of a PSHP .................................................................................................................. 21
3.5 Waterhammer in Pumped Storage Systems ....................................................................... 23
4. COMPUTER SOFTWARE ....................................................................................................... 25
4.1 The Necessity of Computer Software ................................................................................ 25
4.2 The Input Data for HAMMER ........................................................................................... 25
4.3 The Interface of HAMMER and the Toolbars ................................................................... 26
5. CASE STUDY AND DISCUSSION OF SCENARIOS ............................................................ 33
5.1 Physical Information about Yahyalı Hybrid Plant ............................................................. 33
5.2 Transient Analysis of Yahyalı Hybrid Plant ...................................................................... 38
5.2.1 Scenario 1: Stop of both Turbines due to Load Rejection ......................................... 39
5.2.2 Scenario 2: Stop of both Turbines due to Instant Load Rejection .............................. 45
5.2.3 Scenario 3: Load Acceptance of both Turbines ......................................................... 50
5.2.4 Scenario 4: Start-up of both Pumps ........................................................................... 53
5.2.5 Scenario 5: Shut down of both Pumps ....................................................................... 56
5.2.6 Summary of Results ................................................................................................... 60
6. WIND-HYDRO HYBRID SYSTEMS ...................................................................................... 61
6.1 Wind Potential in Turkey ................................................................................................... 61
6.2 Wind-Hydro Hybrid Systems ............................................................................................ 62
6.3 The Comparison between El Hierro and Yahyalı Wind-Hydro Plants .............................. 64
7. CONCLUSIONS ........................................................................................................................ 67
REFERENCES ............................................................................................................................... 69

x
LIST OF TABLES
TABLES
Table 3.1 Pumped-Storage Capacities of Some Countries…………………………………….…... 19
Table 3.2 Scenarios used in Waterhammer Calculations ………………………………..………... 24
Table 5.1 The Physical Properties of Reservoirs in Yahyalı Hybrid Plant…………….....………... 33
Table 5.2 Penstock Characteristics……………………………………………..…….……............. 38

xi
LIST OF FIGURES
FIGURES
Figure 2.1.a Time between (Chaudhry, 1987)……………………………………..... 8
Figure 2.1.b Time between (Chaudhry, 1987)……………................................. 9
Figure 2.1.c Time between (Chaudhry, 1987)……………………………….. 9
Figure 2.1.d Time between (Chaudhry, 1987) ……………………………….. 9
Figure 2.2 The Lengthening of Pipe……………………………….……………………………..... 10
Figure 2.3 Control Volume used to Derive Continuity and Momentum Equations……………….. 12
Figure 2.4 Characteristics Lines………………………………………………………………….... 14
Figure 3.1 Typical PSHP…………………………………………………………………………... 17
Figure 3.2a La Muela PSHP (Spain) ……………………………………………………………… 18
Figure 3.2b Kinzua Dam and PSHP (Pennsylvania) …………………………………………….... 18
Figure 3.3 A Typical Underground Reservoir……………………………………………………... 20
Figure 3.4a Reaction Type of Turbines…………………………………………………………… 22
Figure 3.4b Impulse Type of Turbines……………………………………………………………. 22
Figure 3.5a Simple Type of Surge Tanks………………………………………………………….. 23
Figure 3.5b Differential Type of Surge Tanks……………………………………………………... 23
Figure 3.5c Orifice Type of Surge Tanks……………………………………………………... 23
Figure 4.1 Example of the Interface of HAMMER………………………………………………... 26
Figure 4.2a Steady-State Flow Conditions in HAMMER…………………………………………. 27
Figure 4.2b Transient Flow Conditions in HAMMER…………………………………………….. 27
Figure 4.3 Transient Calculation Summary………………………………………………………... 28
Figure 4.4 Pipe Table………………………………………………………………………………. 29
Figure 4.5 Example of a Profile…………………………………………………………………… 30
Figure 4.6a Pipe Properties Tool…………………………………………………………………... 31
Figure 4.6b Junction Properties Tool………………………………………………………………. 31
Figure 5.1 Plan View of Yahyalı Plant…………………………………………………………….. 34
Figure 5.2 Layouts of Penstocks…………………………………………………………………… 36
Figure 5.3 Optimization Analysis………………………………………………………………….. 37
Figure 5.4 HGL along the Penstocks (Scenario 1) ………………………………………………... 40
Figure 5.5 Pressure Heads along the Penstock (Scenario 1) ………………………………………. 41
Figure 5.6 Pressure Head Variation with respect to Time at the Turbine (Scenario 1)……………. 42
Figure 5.7 Effect of Surge Tank on HGL along the Penstock (Scenario 1)……………………… 43
Figure 5.8 Effect of Surge Tank on Pressure Heads along the Penstock (Scenario 1)……….......... 44
Figure 5.9 Pressure Head Values at the Turbine with and without Surge Tank (Scenario 1)……... 45
Figure 5.10 Wicket Gate Position in Time (Scenario 2)…………………………………………… 46
Figure 5.11 HGL along the Penstocks (Scenario 2) ………………………………………………. 47
Figure 5.12 Pressure Heads along the Penstocks (Scenario 2) ……………………………………. 48
Figure 5.13 Pressure Head Values at the Turbine with and without Surge Tank (Scenario 2)……. 49
Figure 5.14 Wicket Gate Position in Time (Scenario 3) …………………………………………... 50
Figure 5.15 HGL along the Penstocks (Scenario 3) ………………………………………………. 51
Figure 5.16 Pressure Heads along the Penstocks (Scenario 3) ……………………………………. 52
Figure 5.17 Pressure Head Values with and without Surge Tank (Scenario 3)……………………. 53
Figure 5.18 HGL along the Penstocks (Scenario 4) ………………………………………………. 54
Figure 5.19 Pressure Heads along the Penstocks (Scenario 4) ……………………………………. 55
Figure 5.20 Pressure Head Values with and without Surge Tank (Scenario 4)……………………. 56
Figure 5.21 HGL along the Penstocks (Scenario 5) ………………………………………………. 57
Figure 5.22 Pressure Heads along the Penstocks (Scenario 5) ……………………………………. 58
Figure 5.23 Pressure Head Values with and without Surge Tank (Scenario 5)……………………. 59
Figure 6.1 Turkey Wind Atlas……………………………………………………………………... 61
Figure 6.2a Classical Electrical System……………………………………………………………. 62

xii
Figure 6.2b Electrical System with Wind-Hydro Hybrid Plant………………………………….. 63
Figure 6.3 Approximate Wind Power Distribution of Turkey in a Day in June…………………… 64
Figure 6.4 Layout of Penstocks near the Branch in Yahyali Plant………………………………… 65
Figure 6.5 Plan View of El Hierro Hybrid Plant…………………………………………………... 65
xiii
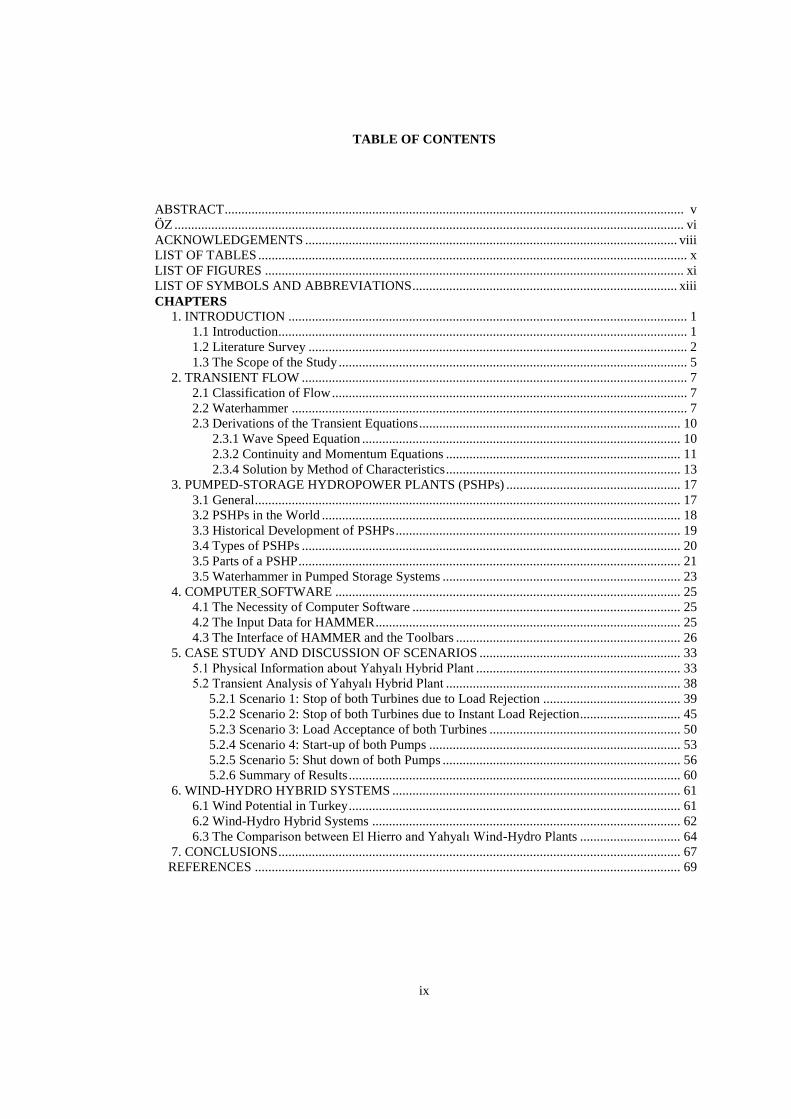
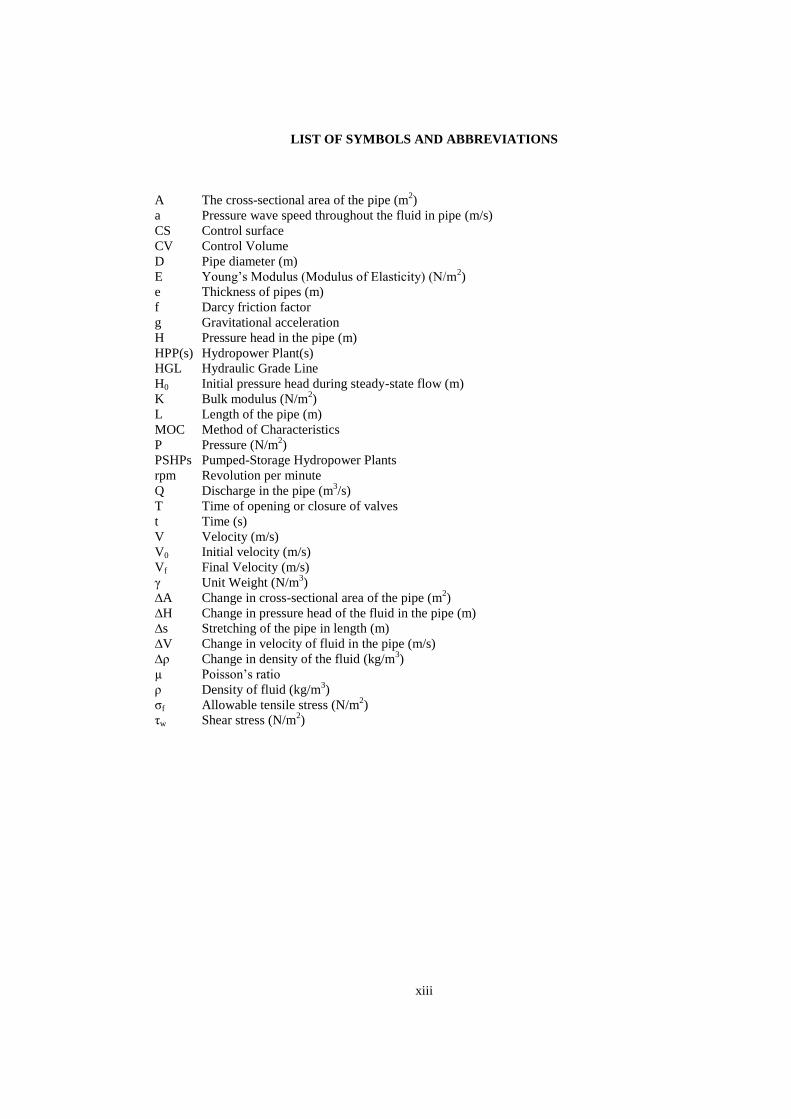
LIST OF SYMBOLS AND ABBREVIATIONS
A The cross-sectional area of the pipe (m2)
a Pressure wave speed throughout the fluid in pipe (m/s)
CS Control surface
CV Control Volume
D Pipe diameter (m)
E Young’s Modulus (Modulus of Elasticity) (N/m2)
e Thickness of pipes (m)
f Darcy friction factor
g Gravitational acceleration
H Pressure head in the pipe (m)
HPP(s) Hydropower Plant(s)
HGL Hydraulic Grade Line
H0 Initial pressure head during steady-state flow (m)
K Bulk modulus (N/m2)
L Length of the pipe (m)
MOC Method of Characteristics
P Pressure (N/m2)
PSHPs Pumped-Storage Hydropower Plants
rpm Revolution per minute
Q Discharge in the pipe (m3/s)
T Time of opening or closure of valves
t Time (s)
V Velocity (m/s)
V0 Initial velocity (m/s)
Vf Final Velocity (m/s)
γ Unit Weight (N/m3)
∆A Change in cross-sectional area of the pipe (m2)
∆H Change in pressure head of the fluid in the pipe (m)
∆s Stretching of the pipe in length (m)
∆V Change in velocity of fluid in the pipe (m/s)
∆ρ Change in density of the fluid (kg/m3)
µ Poisson’s ratio
ρ Density of fluid (kg/m3)
σf Allowable tensile stress (N/m2)
τw Shear stress (N/m2)

xiv
1
CHAPTER 1
INTRODUCTION
1.1 Introduction
Energy is the key for social and economic development of any country. Consequently, energy
demand worldwide has been growing day by day due to the increase in population and life standards.
Therefore, generation of electricity has gained an important role all over the world. Hydropower
plants (HPPs), nuclear plants, thermal power plants have been constructed, resulting in an increase
for the energy supply. Especially for Turkey, in the past, energy demand increased more than the
supply, so Turkey has imported electricity from other countries. Nevertheless, Turkey decided to
regulate her policy about hydropower plants to increase the energy generation in 2000. In 2001, a
law, in which the government encouraged the private sector to build and operate HPPs, was enacted.
With Energy Law, which was publicized in 2005, buying electricity from the companies owning
hydropower plants was guaranteed for 10 years by the government. Afterwards, different regulations
have been put forward and the number of HPPs has been increased dramatically.
The increase in the number of HPPs was remarkable, but not enough. This is because the demand
has been more than the supply. Especially for the peak times, which are the hours when the
electricity demand is the highest, the energy generation may not be enough. Therefore, the energy
generation should be increased during the peak hours. This can be achieved by operating HPPs
during these times. However, this may still be not enough. The other solution is to operate pumped-
storage hydropower plants (PSHPs). The main purpose of the pumped-storage systems is to store
electricity in terms of pumped water in a reservoir when the price of electricity is low and generate it
when the price is high. In other words, PSHPs typically generate electricity during peak times. The
pumped storage generation capacity of the world was around 127 GW in 2010. In fact, 60% growth
in the number of the PSHPs is expected in the next 4 years. Developed countries, like Japan and
United States, give importance to pumped-storage systems. Japan has the largest pumped-storage
capacity around 25.5 GW and United States has 21.5 GW generating capacity. (Deane, et.al., 2010)
Although, Turkey does not have any PSHPs currently, there are 10 projects of which pre-feasibility
studies have been completed.
The design and construction of the pumped-storage systems are important. With a suitable design,
these systems work more efficiently. However, the operation is also as important as the design.
Efficient and continuous energy production is very significant for the owner of the energy facilities.
All the operational conditions should be taken into consideration in the design stage to prevent any
failures, and to operate the system efficiently. It is easier to operate the system under steady
conditions since no change in the flow occurs. The main problem is to operate the system under the
transient cases in which, the flow parameters such as discharge or pressure head may change
drastically. The pressure head starts to fluctuate in the pipes with a hammering sound which is called
waterhammer. These fluctuations occur along the penstocks in the system. If the pressure head
increases or decreases extremely, the penstocks may fail resulting in serious damages in the plant
and loss of lives in some cases. Therefore, hydraulic transient studies should be done at the design
stage and the hydropower plant should be operated properly when it is put into operation.
Although the operation is easy in the steady case; in the transient case, the behavior of the flow
should be understood correctly and the precautions should be taken. There are many investigations
on waterhammer and hydraulic transients and their consequences in the relevant literature.
2
In this study, the transients in PSHPs are investigated by using computer software named
HAMMER. In the next section, firstly, the literature of waterhammer is reviewed in general. Then,
the studies about pumped storage systems specifically are reviewed in detail. The studies about
waterhammer in PSHPs are also examined.
1.2 Literature Survey
The subject of hydraulic transients has attracted many researchers for years due to its importance. In
this part, the historical background of waterhammer and PSHPs are mentioned based on the studies
of Chaudhry (1987).
The studies on hydraulic transients began with the studies of Newton and Lagrange in the 17th
and
18th
centuries. By studying the sound waves in air, Newton obtained the velocity of sound. Lagrange
also obtained it theoretically. Although Newton found an incorrect expression for the celerity of
waves, Lagrange was the one who obtained a successful expression for the celerity of waves. The
known term “Method of Characteristics” was presented by Monge in 1789. With the studies of
Laplace about the velocity of sound, the effects were made to understand the reasons of the
difference between the theoretical and the measured values of velocity of sounds. By investigating
pressure wave speed in pipes, Young became the first researcher who studied the hydraulic transients
in closed conduits. The pressure wave speed for incompressible fluids was obtained by Young in
1808. Then Weber made experiments about the velocity of pressure waves. Dynamic and continuity
equations were derived by Weber. Korteweg was the first researcher who considered both the
elasticity of the pipe material and the fluid at the same time. To determine the wave speed, he
derived a formula. The problem of waterhammer was introduced to literature by Michaud. He
studied on precautions for waterhammer. Frizell tried to relate the velocity and pressure changes in a
pipe. He derived the equations for this relation in 1898. In the same years, Joukowsky also studied
waterhammer. He conducted experiments in long pipes with high wave speeds. He developed a
formula about pressure rise in the pipes. Although Frizell was also successful to derive the famous
pressure rise equation, Joukowksy was recognized to derive this equation first. According to his law
about waterhammer, fast closure of a downstream valve causes the head rise in the pipes. According
to Joukowsky, the closure is fast if where “Tc” is time of closure of the valve,” L” is the
length of the pipe and “a” is the wave speed. He also studied safety measures such as surge tanks and
air chambers to prevent waterhammer. Due to his huge contribution, Joukowsky was pointed as the
father of waterhammer analysis. Allievi derived a more accurate dynamic equation compared to
Korteweg’s equation. He was the first researcher who put the waterhammer theory in the field. By
defining two dimensionless parameters which represent the valve-closure characteristics and the
ratios between kinetic and potential energies, he presented charts. In these charts, pressure changes at
the valves due to closing or opening them can be obtained. Strowger and Kerr studied on hydraulic
turbines. They determined the speed changes of hydraulic turbines due to waterhammer effects. In
their works, the efficiency for different gate openings was considered. In 1928, Wood and Löwy
developed the same graphical method for the hydraulic transient analysis independent of each other.
The studies of Schnyder are about the pump characteristics during transient flow (Chaudhry, 1987).
The studies mentioned above are the frameworks of the hydraulic transient analysis. These studies
about waterhammer were then used to model and operate the hydropower plants. Next, researches on
reversible pump-turbines, adjusting the time durations that pump or turbine is under operation,
combined wind and pumped storage systems and mainly transients in PSHPs are presented in
chronological order.
The studies on PSHPs started with an article about Rocky River Plant. Hughes and Macwilliam
(1958) studied about the feasibility of PSHPs. They presented all the costs since the first operation of
Rocky River Plant and they tried to show the impact of the investments on the development of future
pumped storage plants.
3
Roth (1958) studied on the subject of reversible pump turbines. These turbines could be used as a
pump and a turbine by adjusting the direction of rotation. In addition, the types and characteristics of
reversible pump turbines that are used in PSHPs were stated.
Transients in pumped storage projects were particularly discussed at an international symposium in
1965 in Chicago. Gibson (1965), symposium papers chairman, later edited a book in which the
papers presented in the symposium was included. At the symposium, Lorel and Mamin (1965)
presented a paper about transients in pump-turbine systems. They explained a method to calculate
the response of a pump-turbine after a power failure, in which, operating, mechanical and pipeline
characteristics were represented as dimensionless numbers. Then, they derived the equations of
waterhammer accordingly and their method of calculation was applied. They tried to optimize the
minimum and maximum net mass energies and speed of rotation of the pump-turbine by adapting the
wicket gate closure time. Donsky and DeFazio (1965) discussed transients at the San Luis Pumping-
Generating Plant. They only investigated the waterhammer due to load rejection during energy
generation and power failure when pumping cases. Graphical methods were used in their work. They
found that water-column separation problem or excessive head rise was not critical for this plant.
Miyashiro (1965) presented his works about pumps installed in series. He developed a method that
analyzes the waterhammer in a pump system. Waterhammer equations, inertia equations, and pump
characteristics were defined and boundary conditions were used in order to calculate transient
conditions when power loss during pumping occurred. He found that when the level difference
between the pumps is high, cavitation and water-column separation may occur. Salzman and Yang
(1965) tried to find the maximum head rise due to waterhammer in Yards Creek Pumped-Storage
Plant. They used arithmetic integration and graphical methods. They concluded that the load
rejection of all turbines at the maximum operating case was the most critical case that gave the
maximum pressure rise.
Hammons (1970) studied starting procedures of reversible pump turbines. In his study, two methods,
asynchronous starting and synchronous starting, were studied. He tried to find the most economic
and reliable method. He could not reach any universally optimum method. The methods to be used
change from case to case.
Allen (1977) described the condition of pumped-storage systems at that time and gave information
about future potentials of them. Allen divided pumped-storage systems into two categories as
conventional and underground pumped storage systems. While the systems having both reservoirs on
the ground surface are called conventional, the ones whose lower reservoir was located underground
are called underground pumped-storage systems. He also mentioned about the benefits such as
having rapid load response, having long life, or being low cost peaking resource. On the other hand,
the problems such as capital shortage, public opposition, and planning and construction time of cost
were specified. He concluded that since peak hour demand was increasing day by day and this
demand should be met, the number of pumped storage systems should be increased.
Power demand should be met by adapting the operation time of a power station. How to find this
hourly operation is called unit commitment problem. Cohen and Wan (1985) presented a dynamic
programming algorithm which deals with unit commitment problem on PSHPs. They tried to
minimize the net thermal cost by optimizing the generation and pumping schedule. The constraints
were energy balance, energy in the initial and final times, generation, pumping load and head
equations. They found that the algorithm was very effective to schedule PSHPs. Aoki, et al. (1987)
studied on the optimization of unit commitment problem for thermal plants and for PSHPs. They
tried to minimize the total cost by changing the duration of operation time of PSHPs and thermal
plants.
Kuwabara, et al. (1996) studied the adjustable speed pumped storage units for Ohkawachi Power
Station. In order to prevent the electricity problems due to inadequate power capacity, adjustable
pumped-storage plants may be used. Due to their instantaneous load response, adjustable pumped-

4
storage plants help stabilizing of electrical power system. Field tests for Ohkawachi Power Station
were conducted and transient problems were investigated. After field tests, transient response
characteristics of the adjustable pumped-storage plants were acquired as appropriate.
Yanagisawa, et al. (1996) worked on the transients for adjustable speed generator motor in pumped
storage systems. They calculated transients when sudden short circuit occurs in the generator motor
by using symmetrical components method in which an equivalent circuit is made. It was found that
symmetrical components method was a useful method to calculate the transients for adjustable speed
generator motor when an electrical fault occurred.
Simond, et al. (1999) tried to increase the efficiency of conventional pumped-storage systems
running at constant speed by using variable speed groups, i.e. adjustable speed pumps. They ran tests
by using doubly fed asynchronous machine as adjustable speed motor-generator for both steady state
and transient state. In the results, the machine had benefits in terms of having power control on
pumping mode and providing possibility of instantaneous power injection into the electrical grid
system by changing the speed.
Ferhadi, et al. (2007) studied on the transients for the pump start-up case in Tehran Research
Reactor. Since there is variability in the flow rate and rotational speed, transients would occur in
pump start-up case. A mathematical model was developed in order to calculate the transients in this
case. In the mathematical model, inertia of the rotating parts and inertia of the coolant fluid which
are very important for transients were related to pump kinetic energy and differential equations were
obtained. Solving these equations numerically for Tahran Research Reactor, analysis was finalized.
The results from experiments and mathematical model showed a fair agreement.
Gonzalez, et al. (2008) proposed a method which maximizes expected market profit for combined
wind and pumped-storage units by using two stage stochastic programming approach which is useful
for optimization of problems with uncertainty. With the application of the method to a real case, the
two stage programming approach was proven as an effective method. The method may also help
investors to make decisions about installing pumped storage systems.
Deane, et al. (2009) reviewed the pumped storage systems. They mentioned about the traditional
developments of the systems and the pumped storage capacity of different countries. According to
them, although USA and Japan has larger pumped-storage capacity, most of the new plants were
planned to be installed in Europe.
Dursun and Alboyaci (2010) investigated combined wind power and pumped storage system
potential in Turkey. The demand of wind power in Turkey has increased because wind energy is
relatively cheap, clean, and unlimited. Suitable wind power generation regions were researched.
Marmara, the southeast Anatolian, and the Aegean regions are the most appealing regions for power
generation in Turkey. Because the wind power production is variable and non-trustable, it gives the
electricity system uncertainty. To overcome this problem, wind-hydro pumped storage systems were
designed. In conclusion, the authors emphasized the need to wind-hydro systems since they
minimize the dependency on imported fuel and meet the electricity demand as a renewable and clean
energy resource.
Fu, et al. (2011) studied on overload protection of pumped storage generator-motor. They stated that
with the development of pumped storage systems, the capacity of generators increased. However, the
frequent starting or stopping procedure causes damages to the high capacity generators and electrical
shortage. Various inverse time characteristics of overload protection devices were utilized for a real
pumped storage plant generator. Thermal overload inverse time characteristics and traditional ones
were compared. Authors proved that traditional inverse time characteristics are simplifications of
thermal overload inverse time characteristics. In addition, thermal overload characteristic is more
appropriate for the real situation and the overcapacity of the generator may be achieved due to this
characteristic. A more detailed protection may be required.
5
Song, Han, and Yu (2011) investigated the effect of pumped storage plants on the wind power
systems in terms of utilization rate and proportion in energy consumption. First, peak load regulation
capacity of wind turbines was found. Then water volume in the reservoir of pumped storage system
was formulated. The goal is to maximize wind power by relating reserve capacity, conventional units
output and load equalization with the wind power. Although PSHPs were seen to be less effective for
lower wind levels, the percentage of energy generated by the wind was increased with a PSHP for a
large wind installed level. For very high wind levels, PSHP is obviously infeasible.
1.3 The Scope of the Study
Many countries have constructed PSHPs to benefit from them. There are plans to construct PSHPs
also in Turkey. Since lower reservoirs exist, only upper reservoirs of PSHPs are needed to be
constructed. Therefore, constructing these plants in Turkey is cost-efficient. In addition to the
construction, operation cases should be examined carefully. As known, in PSHPs there is a flow in
both directions, from downward to upward or from upward to downward. The direction of the flow
is changed in short time periods. Therefore, the efficient operation of PSHPs is very crucial.
Problems may occur due to the hydraulic transients in PSHPs. In literature, some of the problems
were studied. The aim of this study is to investigate waterhammer problems in the penstocks of
PSHPs. Flow situations in different times are investigated in this study. A computer program which
solves nonlinear partial differential equations of transient flow by using method of characteristics is
used. With the help of this program, different operational cases are studied. Moreover, the behavior
of the system without any protective devices is examined. Then, a surge tank is added to the system
and the new behavior is analyzed.
In this study, Yahyalı Hybrid Plant located in Kayseri, whose pre-feasibility studies have been
completed, but whose construction has not yet started, is investigated. The main importance of the
project is that it will be the first pumped-storage plant in Turkey. In fact, in this project, both a wind
power plant and a pumped storage plant are to be constructed together. This kind of systems is called
hybrid systems. More detailed information about hybrid systems may be found in Chapter 6.
Next chapter is dedicated to the transient flow concepts. Due to the transient flow, waterhammer
occurs in the system. The waterhammer concept and the causes of waterhammer are explained.
Then, the equations used in the study are derived.
In Chapter 3 general information about PSHPs is presented and the situation of PSHPs in the world
is discussed. After that, how PSHPs were developed through the history and the types of PSHPs are
explained. Finally, the effects of waterhammer in PSHPs are discussed.
Bentley Hammer which is a computer software used in this study is presented in Chapter 4.
In Chapter 5, a case study is performed. After giving detailed information about Yahyalı Hybrid
Plant, a pipe optimization analysis is presented. Then, the transients of a PSHP for different
operational cases are investigated. The pressure variations due to waterhammer effects with and
without a protective device are found.
In Chapter 6, wind-hydro hybrid systems are presented. The chapter starts with Turkey’s energy
production from wind. Then the necessity of wind-hydro hybrid systems is stated. Finally, a
comparison between two wind-hydro hybrid plants is done. One of the plants is El Hierro Hybrid
Plant, located in Spain and the other one is the PSHP which is the case study of this thesis, Yahyalı
Plant in Kayseri.
Finally, Chapter 7 has conclusions of the study.

6
7
CHAPTER 2
TRANSIENT FLOW
In this chapter, firstly transient flow concept is defined, and then waterhammer equations are
derived. These equations are wave speed, continuity, and momentum equations. After deriving them,
method of characteristics (MOC), one of the techniques useful to solve these equations
simultaneously, is described.
2.1 Classification of Flow
When there is no change in the flow properties over time, the flow is steady flow. In steady flow, the
flow properties may change from point to point, however they remain constant at a point with
respect to time. If the properties change with time, then the flow is unsteady flow. In real life, slight
changes in velocity and pressure always occur, but if the mean values are the same, then the flow is
accepted as steady flow. The unsteady flow equations must also satisfy the steady flow conditions.
Steady-oscillatory flow or periodic flow occurs when the flow conditions change with time, but the
same flow conditions develop in fixed-time intervals. These time intervals in which the conditions
repeat are called period.
Transient flow is the unsteady flow in the pipes. The term waterhammer is also used instead of
transients. It is created by the changes in the flow such as closing of a valve or a pump trip, etc. It
may cause excessive pressures in the pipelines. More detailed information about waterhammer is
given in the next section.
2.2 Waterhammer
Waterhammer is the change in flow properties due to a disturbance in the pipe systems. There are
many causes of the waterhammer. Usual reasons of waterhammer some of which are:
Valve operations
Pump operations
Hydraulic turbine operations
Change in water elevation of a reservoir
Waves on the surface of a dam reservoir due to earthquake, winds or landslides
Power failures in the system
Emergency closure of the units
There are many studies on the causes of waterhammer and theoretical modeling of waterhammer.
Firstly, Joukowsky conducted extensive experiments on drinking water supply pipes. He published
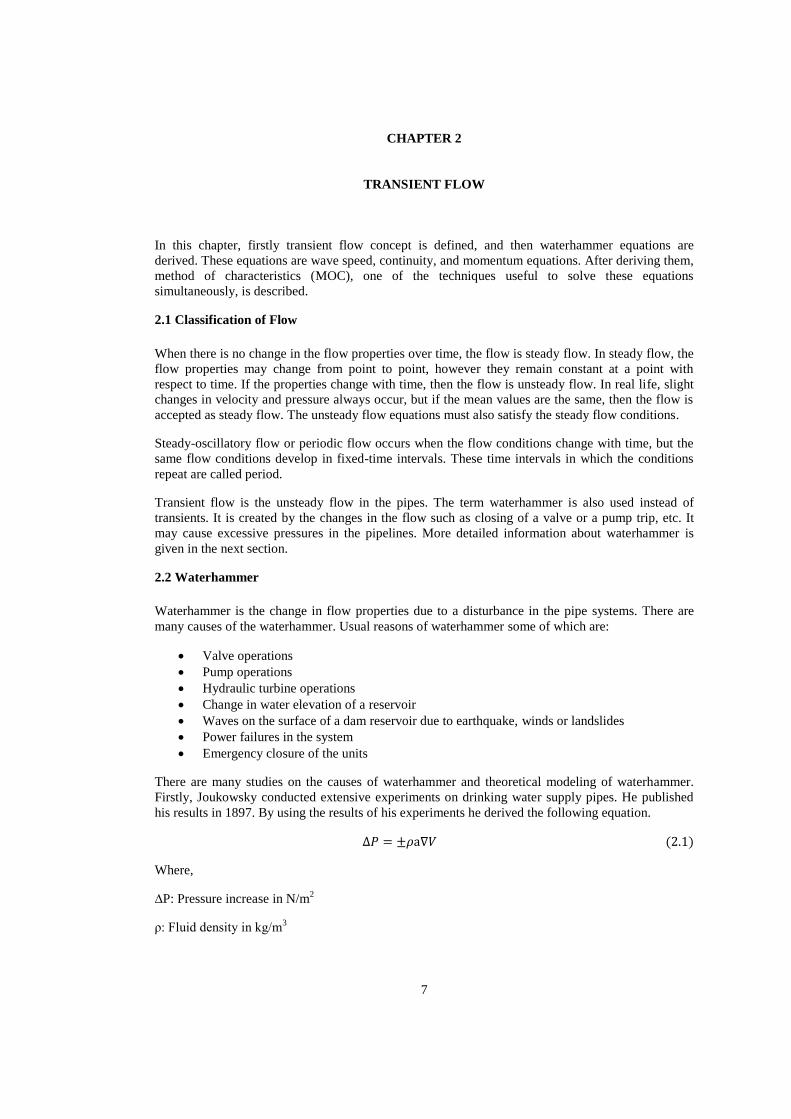
his results in 1897. By using the results of his experiments he derived the following equation.
Where,
∆P: Pressure increase in N/m2
ρ: Fluid density in kg/m3
8
a: The pressure wave speed through the fluid in the pipe in m/s
∆V: The change in the velocity of the flow in m/s (Final Velocity - Initial Velocity)
This equation is named as Joukowsky equation and is valid for rapid closure cases. According to
Joukowsky, rapid closure is the closure which takes less than the wave reflection time. Wave
reflection time is the time needed for a wave to travel the whole pipe length and return to excitation
location. For a pipe having length “L”, the wave reflection time is 2L/a. Consequently, the closure is
said to be rapid if it is less than 2L/a. Plus sign in the equation is used for upstream closures, while
minus sign is used for downstream closures in a pipeline.
To understand the concept of the waterhammer better, a piping system having a valve shown in
Figure 2.1 is considered. The flow is steady initially. The valve is assumed to be instantaneously
closed at time zero (t=0). The behavior of the flow can be seen for different time periods. Note that
in the figures, the minor and friction losses are ignored. In Figure 2.1a, the time duration of is shown. Here, the valve is closed instantly and the velocity at the valve is immediately reduced
to zero. This causes a pressure rise of o. In this equation, a is the wave speed, g is the
gravitational acceleration and Vo is the initial velocity. At , the wave reaches the reservoir,
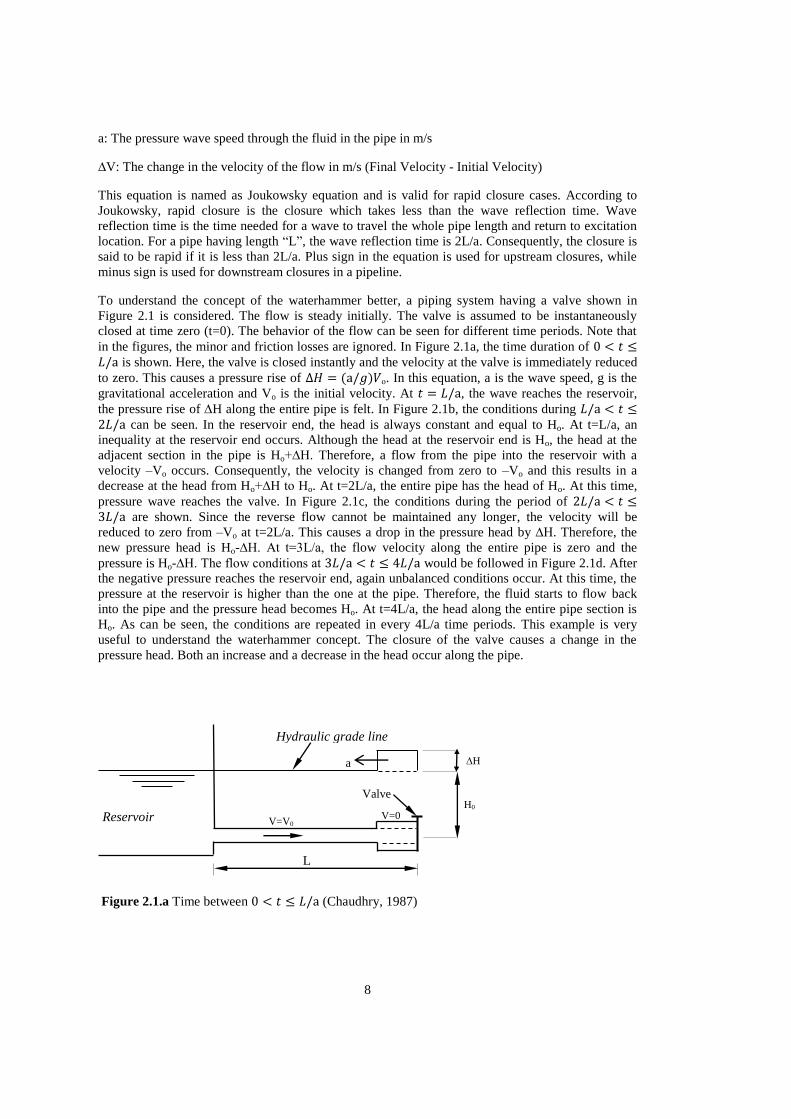
the pressure rise of ∆H along the entire pipe is felt. In Figure 2.1b, the conditions during can be seen. In the reservoir end, the head is always constant and equal to Ho. At t=L/a, an
inequality at the reservoir end occurs. Although the head at the reservoir end is Ho, the head at the
adjacent section in the pipe is Ho+∆H. Therefore, a flow from the pipe into the reservoir with a
velocity –Vo occurs. Consequently, the velocity is changed from zero to –Vo and this results in a
decrease at the head from Ho+∆H to Ho. At t=2L/a, the entire pipe has the head of Ho. At this time,
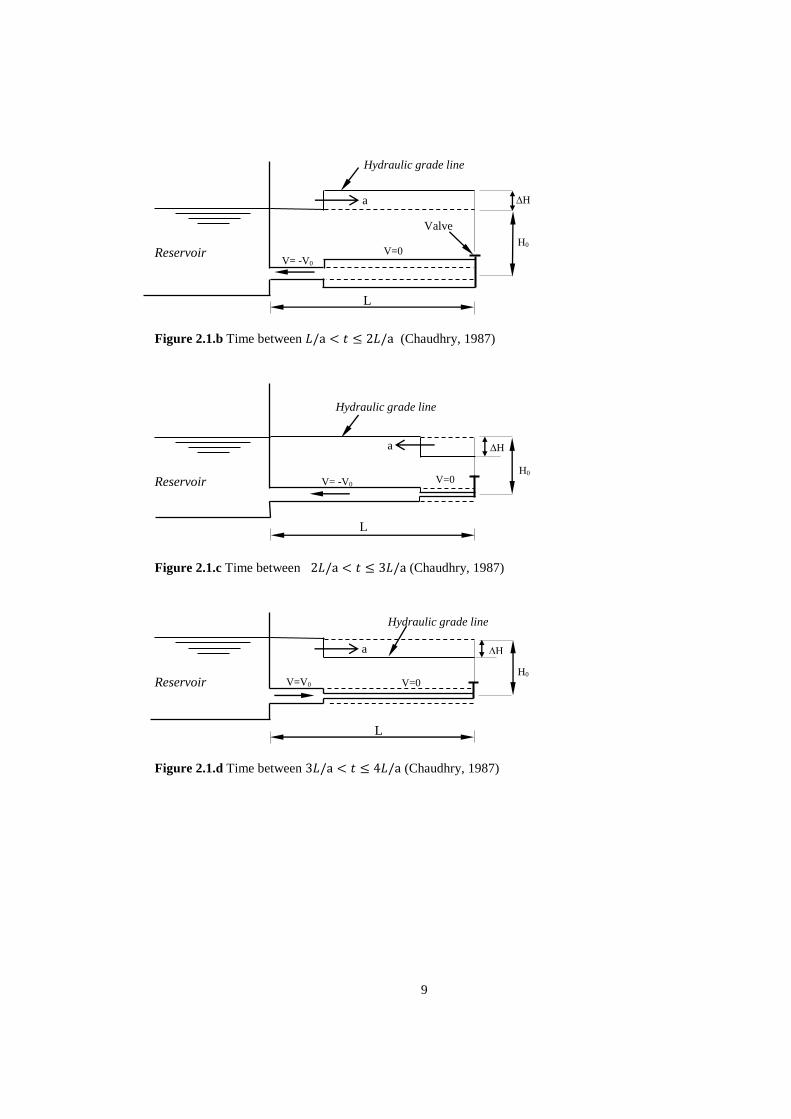
pressure wave reaches the valve. In Figure 2.1c, the conditions during the period of are shown. Since the reverse flow cannot be maintained any longer, the velocity will be
reduced to zero from –Vo at t=2L/a. This causes a drop in the pressure head by ∆H. Therefore, the
new pressure head is Ho-∆H. At t=3L/a, the flow velocity along the entire pipe is zero and the
pressure is Ho-∆H. The flow conditions at would be followed in Figure 2.1d. After
the negative pressure reaches the reservoir end, again unbalanced conditions occur. At this time, the
pressure at the reservoir is higher than the one at the pipe. Therefore, the fluid starts to flow back
into the pipe and the pressure head becomes Ho. At t=4L/a, the head along the entire pipe section is
Ho. As can be seen, the conditions are repeated in every 4L/a time periods. This example is very
useful to understand the waterhammer concept. The closure of the valve causes a change in the
pressure head. Both an increase and a decrease in the head occur along the pipe.
Figure 2.1.a Time between (Chaudhry, 1987)
Valve
V=0 V=V0
Hydraulic grade line
H0
∆H
L
a
Reservoir
9
Reservoir
Figure 2.1.b Time between (Chaudhry, 1987)
Reservoir
Figure 2.1.c Time between (Chaudhry, 1987)
Reservoir
Figure 2.1.d Time between (Chaudhry, 1987)
Hydraulic grade line
Valve
V=0 V= -V0
∆H
H0
L
Hydraulic grade line
V=0
∆H
H0
L
Hydraulic grade line
V=0 V=V0
∆H
H0
L
V= -V0
a
a
a
10
2.3 Derivations of the Transient Equations
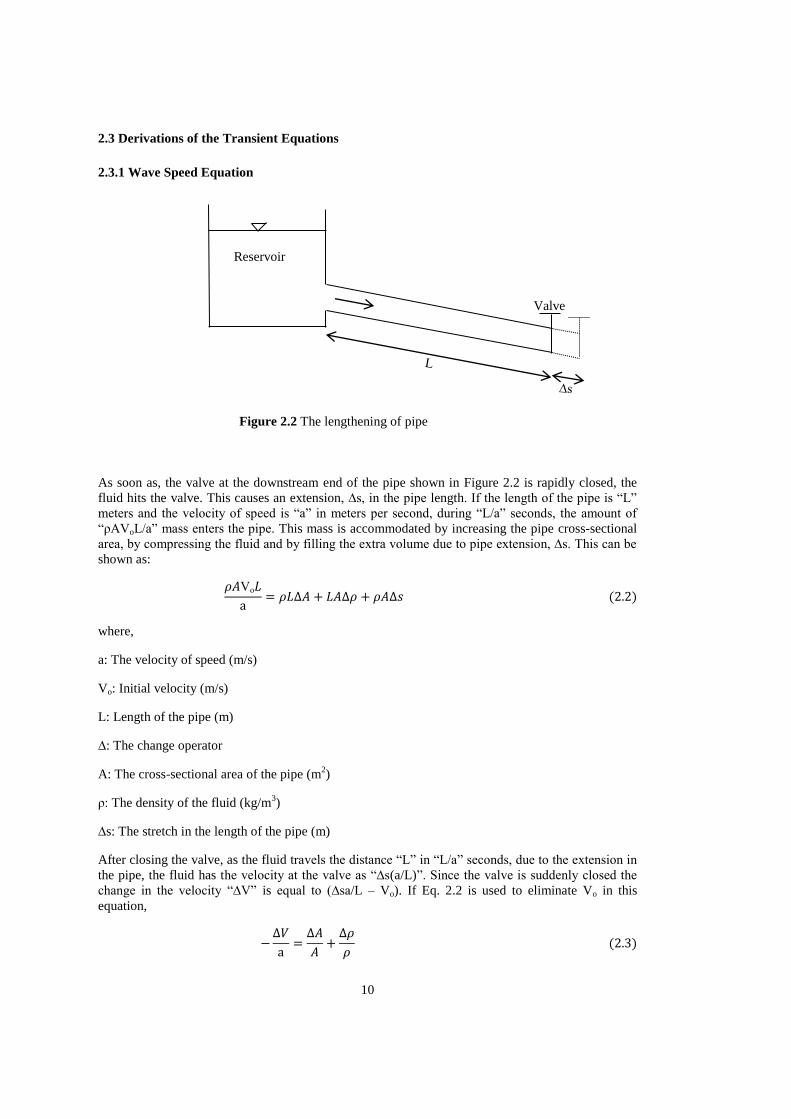
2.3.1 Wave Speed Equation
Figure 2.2 The lengthening of pipe
As soon as, the valve at the downstream end of the pipe shown in Figure 2.2 is rapidly closed, the
fluid hits the valve. This causes an extension, ∆s, in the pipe length. If the length of the pipe is “L”
meters and the velocity of speed is “a” in meters per second, during “L/a” seconds, the amount of
“ρAVoL/a” mass enters the pipe. This mass is accommodated by increasing the pipe cross-sectional
area, by compressing the fluid and by filling the extra volume due to pipe extension, ∆s. This can be
shown as:
Vo
where,
a: The velocity of speed (m/s)
Vo: Initial velocity (m/s)
L: Length of the pipe (m)
∆: The change operator
A: The cross-sectional area of the pipe (m2)
ρ: The density of the fluid (kg/m3)
∆s: The stretch in the length of the pipe (m)
After closing the valve, as the fluid travels the distance “L” in “L/a” seconds, due to the extension in
the pipe, the fluid has the velocity at the valve as “∆s(a/L)”. Since the valve is suddenly closed the
change in the velocity “∆V” is equal to (∆sa/L – Vo). If Eq. 2.2 is used to eliminate Vo in this
equation,
Reservoir
Valve
11
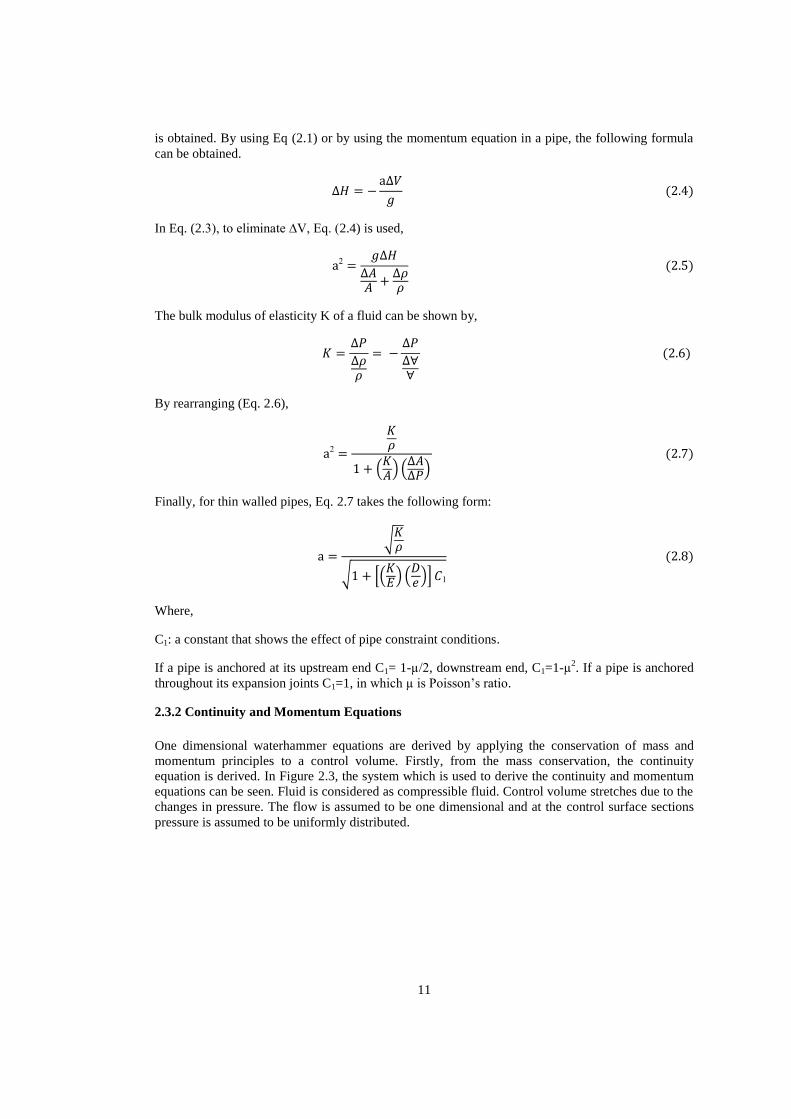
is obtained. By using Eq (2.1) or by using the momentum equation in a pipe, the following formula
can be obtained.
In Eq. (2.3), to eliminate ∆V, Eq. (2.4) is used,
2
The bulk modulus of elasticity K of a fluid can be shown by,
By rearranging (Eq. 2.6),
2
( ) (
)
Finally, for thin walled pipes, Eq. 2.7 takes the following form:
√
√ *( ) (
)+ 1
Where,
C1: a constant that shows the effect of pipe constraint conditions.
If a pipe is anchored at its upstream end C1= 1-µ/2, downstream end, C1=1-µ2. If a pipe is anchored
throughout its expansion joints C1=1, in which µ is Poisson’s ratio.
2.3.2 Continuity and Momentum Equations
One dimensional waterhammer equations are derived by applying the conservation of mass and
momentum principles to a control volume. Firstly, from the mass conservation, the continuity
equation is derived. In Figure 2.3, the system which is used to derive the continuity and momentum
equations can be seen. Fluid is considered as compressible fluid. Control volume stretches due to the
changes in pressure. The flow is assumed to be one dimensional and at the control surface sections
pressure is assumed to be uniformly distributed.

12
Figure 2.3 Control volume used to derive continuity and momentum equations
If the conservation of mass and momentum principles are applied, the following equations are
obtained.
(
) 2
w
Where,
ρ = Density of the fluid (m3/s)
P = Pressure (N/m2)
V = Velocity of the fluid (m/s)
a = Pressure wave speed throughout the fluid in the pipe (m/s)
Pressure variation with respect to time
Pressure variation with respect to distance
Ѳ W=ρgAδx
13
Velocity variation with respect to distance
Velocity variation with respect to
τw = Wall shear stress (N/m2)
D = Diameter of the pipe (m)
g = Gravitational acceleration (m/s2)
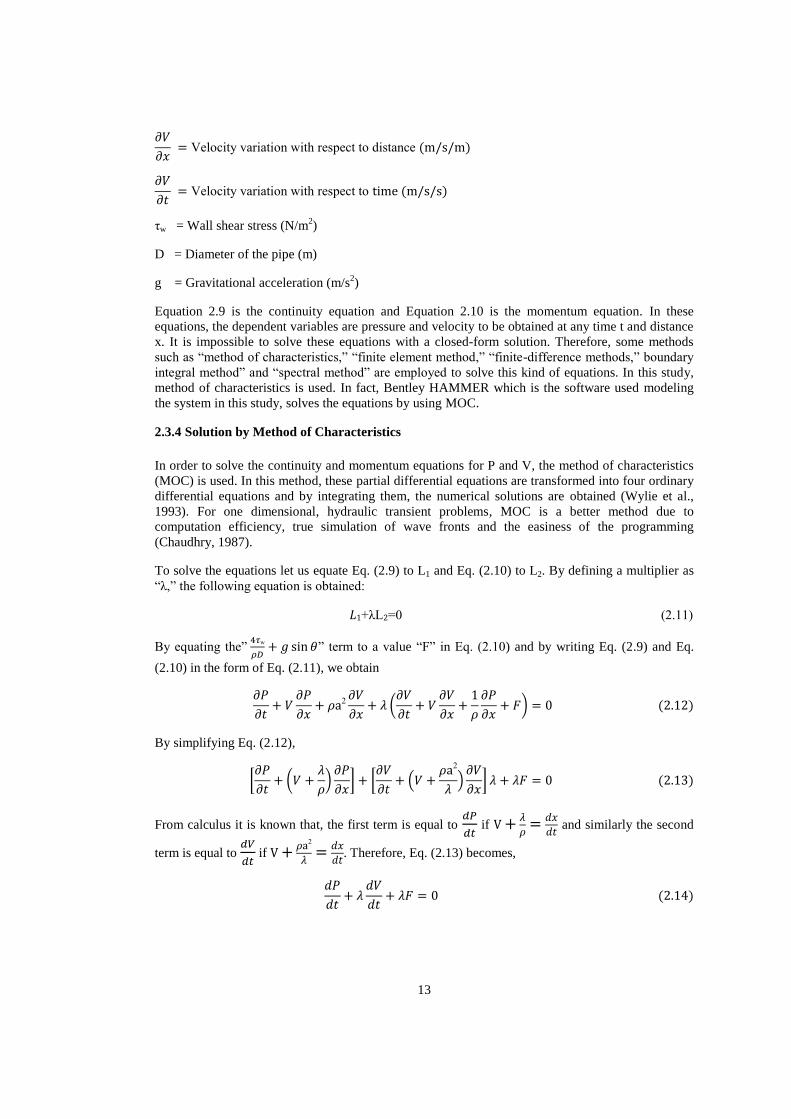
Equation 2.9 is the continuity equation and Equation 2.10 is the momentum equation. In these
equations, the dependent variables are pressure and velocity to be obtained at any time t and distance
x. It is impossible to solve these equations with a closed-form solution. Therefore, some methods
such as “method of characteristics,” “finite element method,” “finite-difference methods,” boundary
integral method” and “spectral method” are employed to solve this kind of equations. In this study,
method of characteristics is used. In fact, Bentley HAMMER which is the software used modeling
the system in this study, solves the equations by using MOC.
2.3.4 Solution by Method of Characteristics
In order to solve the continuity and momentum equations for P and V, the method of characteristics
(MOC) is used. In this method, these partial differential equations are transformed into four ordinary
differential equations and by integrating them, the numerical solutions are obtained (Wylie et al.,
1993). For one dimensional, hydraulic transient problems, MOC is a better method due to
computation efficiency, true simulation of wave fronts and the easiness of the programming
(Chaudhry, 1987).
To solve the equations let us equate Eq. (2.9) to L1 and Eq. (2.10) to L2. By defining a multiplier as
“λ,” the following equation is obtained:
+λL =0 (2.11)
By equating the” w
” term to a value “F” in Eq. (2.10) and by writing Eq. (2.9) and Eq.
(2.10) in the form of Eq. (2.11), we obtain
2
(
)
By simplifying Eq. (2.12),
[
(
)
] [
(
2
)
]
From calculus it is known that, the first term is equal to
if
and similarly the second
term is equal to
if 2
. Therefore, Eq. (2.13) becomes,

14
Recalling,
2
If the previous equation is solved, the value of “λ” is obtained as
By knowing the value of “λ,” can be found easily:
However, it is a fact that the magnitude of wave speed is much larger than the magnitude of flow
velocity. Therefore, V term in the previous equation can be neglected. Then the final form becomes:
This equation represents two straight lines with slopes of “+1/a” and “-1/a”. These lines are called
characteristics lines and shown in Figure 2.4. By putting Eq. (2.16) into Eq. (2.14), the complete
forms of compatibility and characteristics equations are obtained.
Figure 2.4 Characteristics lines
∆x ∆x i i+1 i-1 ∆x ∆x
C+ C
-
∆t
t
x
t=t0
∆t
∆x=a∆t
A B
C
15
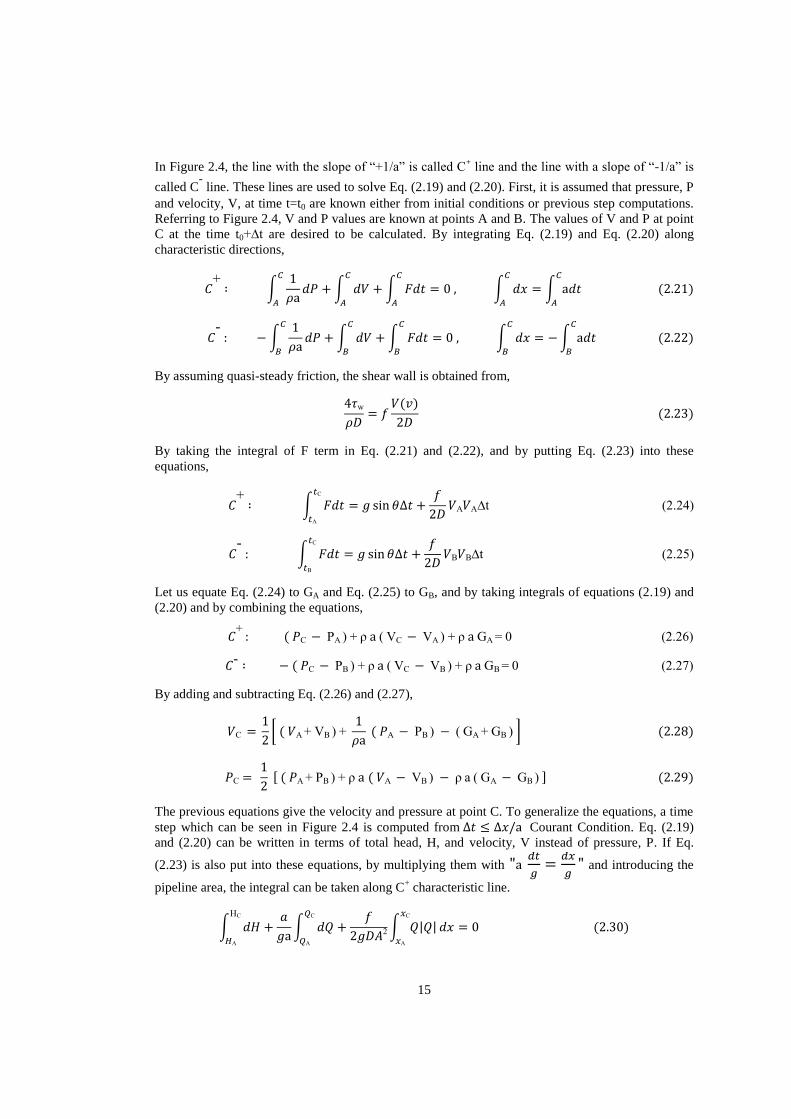
In Figure 2.4, the line with the slope of “+1/a” is called C+ line and the line with a slope of “-1/a” is
called C- line. These lines are used to solve Eq. (2.19) and (2.20). First, it is assumed that pressure, P
and velocity, V, at time t=t0 are known either from initial conditions or previous step computations.
Referring to Figure 2.4, V and P values are known at points A and B. The values of V and P at point
C at the time t0+∆t are desired to be calculated. By integrating Eq. (2.19) and Eq. (2.20) along
characteristic directions,
+
∫
∫ ∫ ∫ ∫
- ∫
∫ ∫ ∫ ∫
By assuming quasi-steady friction, the shear wall is obtained from,
w
By taking the integral of F term in Eq. (2.21) and (2.22), and by putting Eq. (2.23) into these
equations,
+
∫
A A∆t (2.24)
C
A
- ∫
B B∆t (2.25)
C
B
Let us equate Eq. (2.24) to GA and Eq. (2.25) to GB, and by taking integrals of equations (2.19) and
(2.20) and by combining the equations,
+ C PA ) + ρ ( VC VA ) + ρ GA = 0 (2.26)
C PB ) + ρ ( VC VB ) + ρ GB = 0 (2.27)
By adding and subtracting Eq. (2.26) and (2.27),
C
[ A + VB ) +
A PB ) ( GA + GB ) ]
C
[ A + PB ) + ρ A VB ) ρ a ( GA GB ) ]
The previous equations give the velocity and pressure at point C. To generalize the equations, a time
step which can be seen in Figure 2.4 is computed from Courant Condition. Eq. (2.19)
and (2.20) can be written in terms of total head, H, and velocity, V instead of pressure, P. If Eq.
(2.23) is also put into these equations, by multiplying them with
and introducing the
pipeline area, the integral can be taken along C+ characteristic line.
∫
∫
2 ∫ | | C
A
C
A
HC
A
16
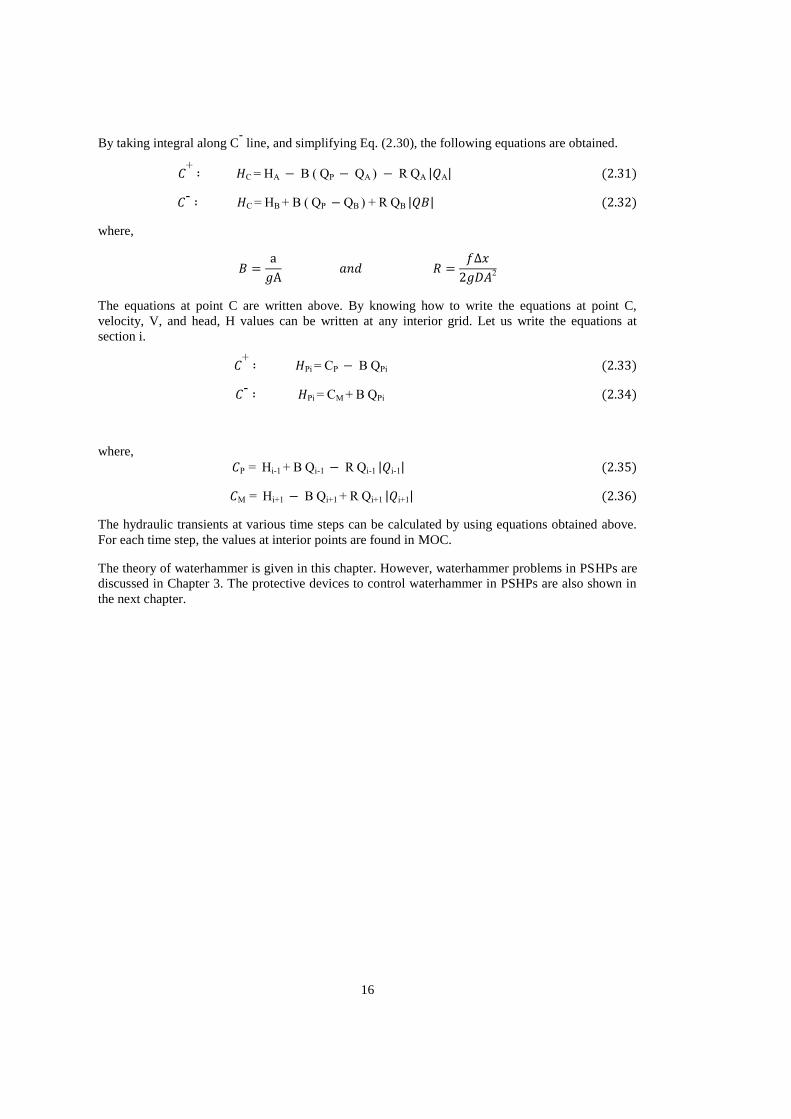
By taking integral along C- line, and simplifying Eq. (2.30), the following equations are obtained.
+ C = HA B ( QP QA ) R QA | A|
C = HB + B ( QP QB ) + R QB | |
where,
2
The equations at point C are written above. By knowing how to write the equations at point C,
velocity, V, and head, H values can be written at any interior grid. Let us write the equations at
section i.
+ Pi = CP B QPi
Pi = CM + B QPi
where, P = Hi-1 + B Qi-1 R Qi-1 | i-1|
M = Hi+1 B Qi+1 + R Qi+1 | i+1|
The hydraulic transients at various time steps can be calculated by using equations obtained above.
For each time step, the values at interior points are found in MOC.
The theory of waterhammer is given in this chapter. However, waterhammer problems in PSHPs are
discussed in Chapter 3. The protective devices to control waterhammer in PSHPs are also shown in
the next chapter.
17
CHAPTER 3
PUMPED-STORAGE HYDROPOWER PLANTS
3.1 General
Energy demands change in a day, so energy should be stored in order to supply electricity when the
demand is high. Instead of storing energy, more power plants can be constructed to meet the peak
demand. However, this is not an option due to the investment cost. Energy consumption and demand
should be optimized by using effective ways. Therefore, many techniques have been developed to
store the energy such as batteries, capacitors, compressed air energy storage, and PSHPs. The most
efficient technique for energy storage method is storing water in a PSHP for now, in which the
amount of electricity generated is always less than the electricity used during the process. This
means PSHP should not be considered as a plant which generates electricity. They are simply
contributors among other power plants during the peak energy demand. Although their generation is
less than the consumption, their contribution to the electrical systems cannot be ignored.
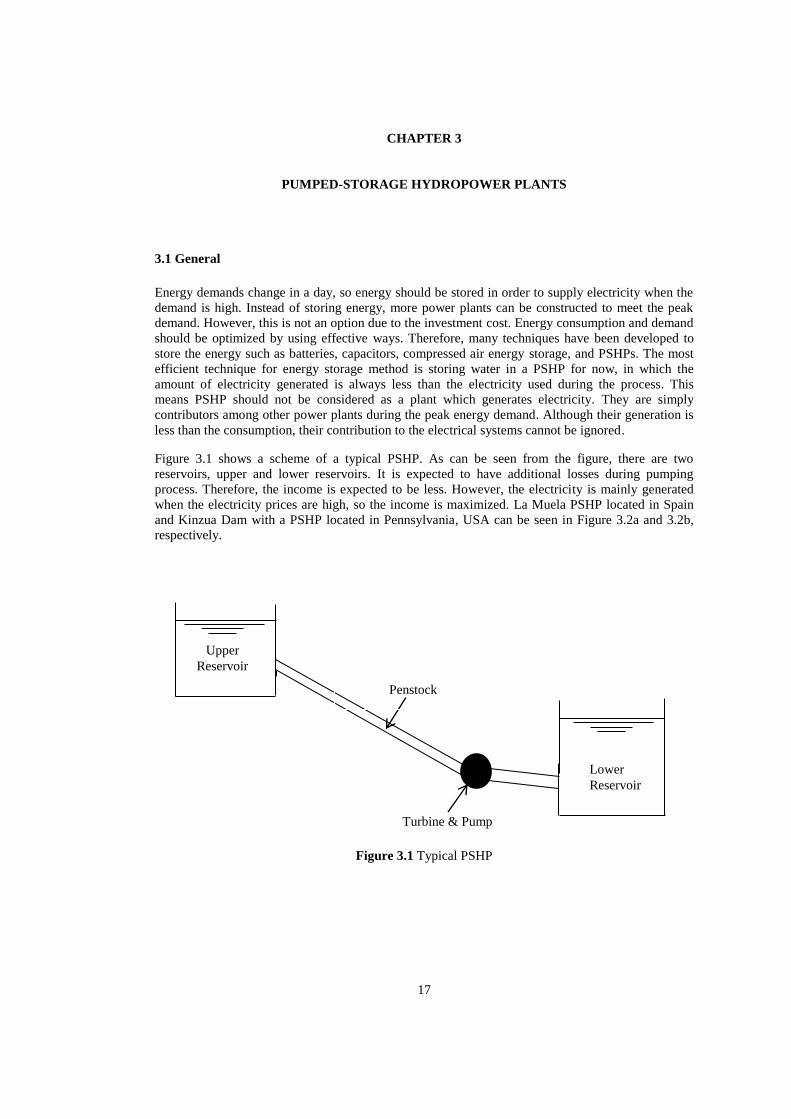
Figure 3.1 shows a scheme of a typical PSHP. As can be seen from the figure, there are two
reservoirs, upper and lower reservoirs. It is expected to have additional losses during pumping
process. Therefore, the income is expected to be less. However, the electricity is mainly generated
when the electricity prices are high, so the income is maximized. La Muela PSHP located in Spain
and Kinzua Dam with a PSHP located in Pennsylvania, USA can be seen in Figure 3.2a and 3.2b,
respectively.
Figure 3.1 Typical PSHP
Upper
Reservoir
Lower
Reservoir
Turbine & Pump
Penstock

18
Figure 3.2a La Muela PSHP (Spain) Figure 3.2b Kinzua Dam and PSHP
(Pennsylvania, USA)
Pumped-storage systems are one of the most efficient storing systems currently. PSHPs are superior
by storing great amounts of renewable energy. Although, there are not many cost efficient
technologies for the peak hours, PSHPs are mainly designed to satisfy the energy demand for these
hours. One of the advantages of PSHPs is that they can be operated without fuel oil. As known, the
importance of fuel oil is increasing day by day. The price of fuel oil is also increasing. Therefore, the
energy systems operated without fuel oil have gained more importance. Moreover, due to global
warming and the call to de-carbonize electricity, the governments tried to increase the number of
PSHPs. Having long life is another advantage of PSHPs. Although for long terms, the maintenance
is required, there are lots of PSHPs constructed before 1950s and still in efficient operation. In
addition, PSHPs have rapid load response. Energy can be available within seconds. To satisfy
sudden increase in energy demands, pumped-storage systems are very effective.
3.2 PSHPs in the World
Countries are trying to reduce the greenhouse emissions by using their renewable energy resources
and by shutting down their nuclear plants. For example, according to the recent studies, German
government plans to achieve %100 renewable electricity sources by 2050 to satisfy their electricity
demand (Deane, et.al., 2009). Consequently, in the world, the number of PSHPs has been increasing.
Although world pumped storage generating capacity was about 127 GW in 2009, the generation is
expected to be around 203 GW in 2014. The pumped storage capacities of some countries are shown
in Table 3.1. As can be seen from the table, Japan has the largest pumped storage capacity which is
around 25.2 GW. The United States, on the other hand, have 21.9 GW pumped storage capacity
which is around %21 of the world. The Europe has around 170 pumped storage plants with almost
45 GW capacities Germany, France, Italy, and Spain have more than %35 of installed pumped-
storage capacity in Europe.1 Although most of the countries in Europe produces electricity from
pumped-storage systems, Turkey does not have any PSHPs. However, the demand during peak hours
1 The source is www.wikipedia.org

19
has been increasing in Turkey, so the government has plans to build PSHPs. In fact, the prefeasibility
studies of 10 PSHPs are completed and the construction is planned to be started.
Table 3.1 Pumped storage capacities of some countries (Yang, 2010)
Country
Installed PSHP Capacity
(GW)
Japan 25.18
USA 21.89
China 15.64
Italy 7.54
Spain 5.35
Germany 5.22
France 4.30
Austria 3.58
3.3 Historical Development of PSHPs
The first PSHPs, which had separate pump and turbine systems, were constructed in Switzerland,
Australia, and Italy in 1890s. Instead of separate pump turbine systems, single-reversible turbines
were developed and started to be used in 1950s. PSHPs were considered as assistive to nuclear
power during peak hours in 1960s. Richard D. Harza came up with an idea of using a mine as an
underground reservoir of a PSHP in 1960. Sorensen made design of underground PSHPs possible
with his article in 1968 (Pickard, 2011). However, still there exists no constructed underground
PSHP.
The majority of PSHPs in many countries was built between 1960s and 1990s. In 1990s, due to the
low natural gas prices, the number of gas turbines increased and the demand to PSHPs decreased in
many countries. Besides, environmental concerns affected the development of PSHPs adversely.
There is a loss in the process of pumping the water back and generating the electricity, therefore the
net electricity output of PSHPs is negative. For this reason, PSHPs were not considered as power
generators. They are still not qualified as transmission infrastructure in many countries. However,
the regulations show variation in different countries. For example, although USA does not accept
PSHPs as transmission infrastructure, China considered PSHPs as transmission facility and with the
transmission prices, the stated grid corporations are allowed to recover their installment cost (Yang,
2010).
With the increase of the importance in carbon emissions of the countries, clean and renewable
energy has become dominant in recent years. With the new technological developments such as
variable speed pump-turbine units which allows the adjustment of energy absorbed in pumping mode
or the PSHPs which can use seawater, the number of PSHPs has increased. (Deane, etal., 2009).
Besides, the use of wind energy has increased. Since the indeterminate nature of wind, power
production changes in time intervals. In order to satisfy a constant power to the electricity grid,
combined wind power and pumped-storage systems are used. Therefore, the number of PSHPs
increased with wind power systems.
20
3.4 Types of PSHPs
As mentioned earlier PSHPs have two reservoirs, upper and lower ones. If a PSHP is classified
according to water reservoirs, possible types are given below:
One of the reservoirs is a reservoir of an existing hydropower plant and the other one is
constructed later.
Both reservoirs are constructed. This is not preferable due to high investment cost.
Both reservoirs are existing water sources. This is very rare.
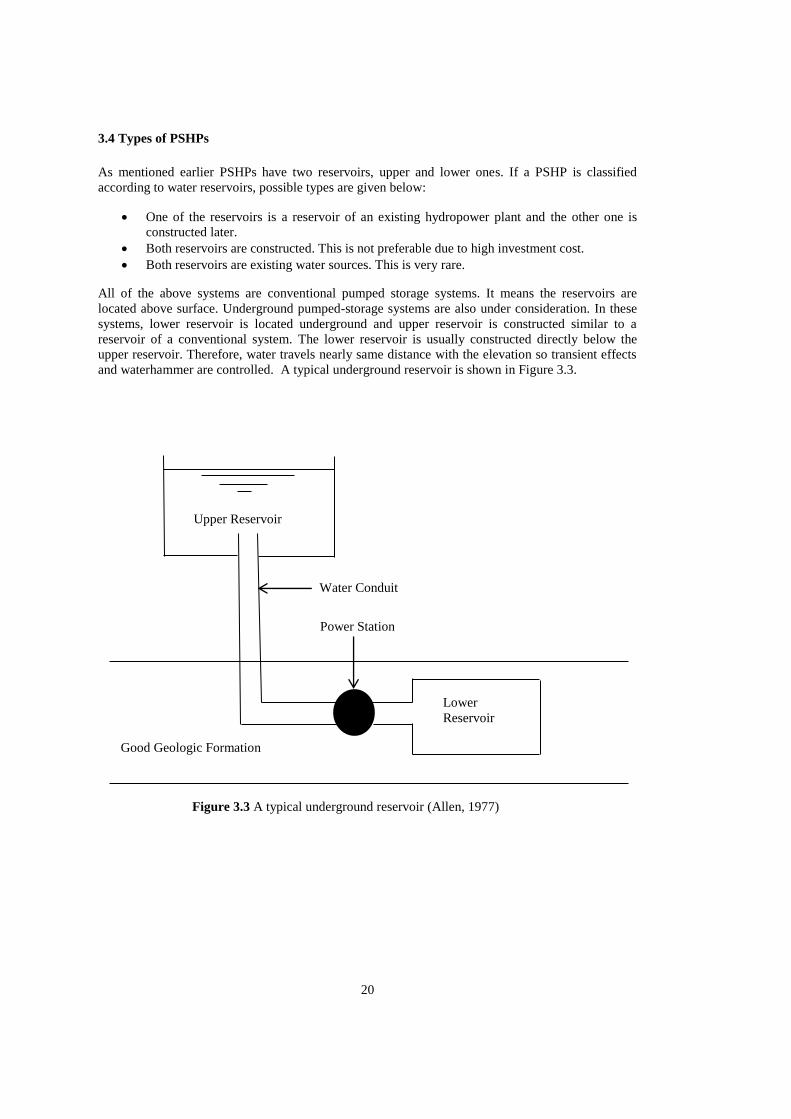
All of the above systems are conventional pumped storage systems. It means the reservoirs are
located above surface. Underground pumped-storage systems are also under consideration. In these
systems, lower reservoir is located underground and upper reservoir is constructed similar to a
reservoir of a conventional system. The lower reservoir is usually constructed directly below the
upper reservoir. Therefore, water travels nearly same distance with the elevation so transient effects
and waterhammer are controlled. A typical underground reservoir is shown in Figure 3.3.
Figure 3.3 A typical underground reservoir (Allen, 1977)
Good Geologic Formation
Lower
Reservoir
Upper Reservoir
Water Conduit
Power Station

21
PSHPs are very similar to normal hydropower plants. The only differences are the necessity of a
lower reservoir and pumping machinery. For different pumping equipment, PSHPs can also be
classified as shown below.
Four units PSHPs. The turbine with its generator and the pump with its motor are separate.
Three units PSHPs. Here, the turbine and the pump are separate units, but motor and
generator is a single unit.
Two units PSHPs. Both pump and turbine and motor and generator are single units. The
turbine or the pump is active according to the flow direction. These systems are also called
reversible pump-turbine systems.
3.5 Parts of a PSHP
The parts of a PSHP are nearly the same with the parts of conventional hydropower plants. There are
many studies in the literature which investigate the parts of HPPs. Here, just the names and
definitions of the parts are given. One of the main parts is the intake structures which deliver the
water from the reservoir to the penstocks. An intake structure delivers the necessary amount of water
with clarifying it from the sediments or any other detrimental materials which can damage the
turbines. Penstock or tunnels delivers the water from the reservoir with the help of an intake
structure to the turbines.
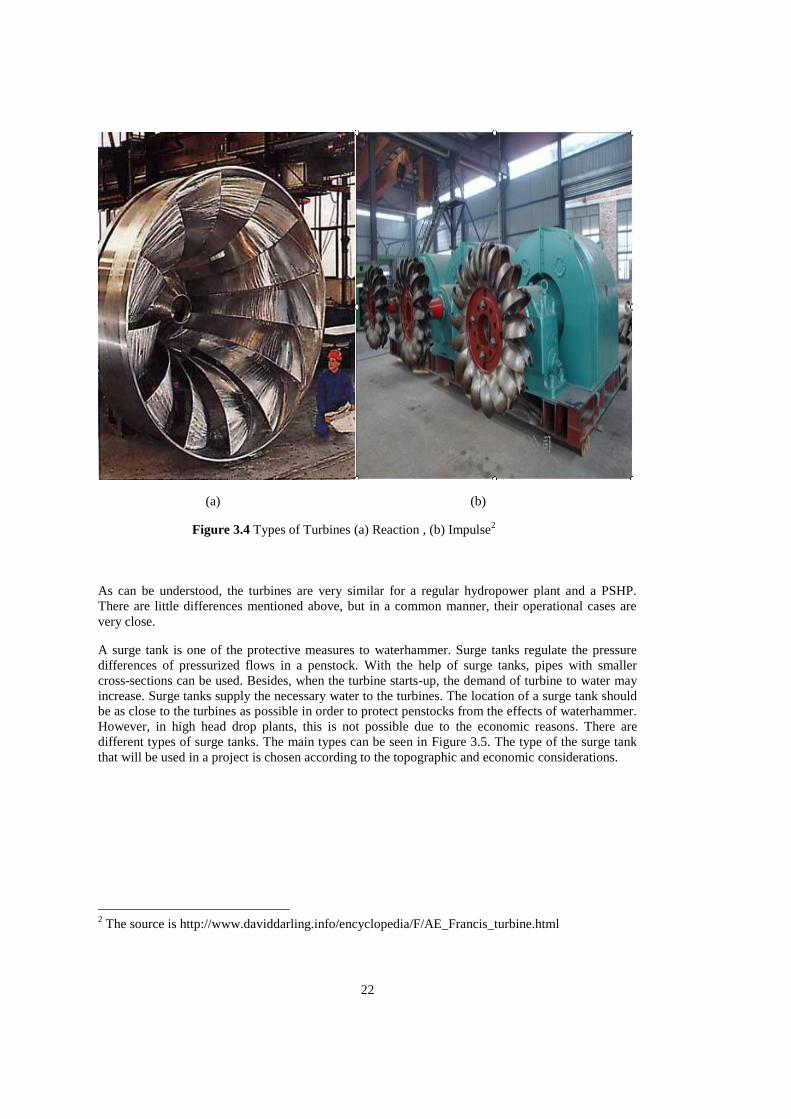
One of the most important parts of PSHPs is the turbines. Turbines are used to transform the energy
of water into mechanical energy which operates generator. There are two types of turbines, namely
reaction and impulse turbines. Reaction turbines have blades as can be seen in Fig 3.4a. Here blades
are similar to a wing of a plane. While the water is passing through the blades, the velocity increases
and pressure decreases. The energy is transformed into mechanical energy due to this drop. Types of
reaction turbines are Francis, Kaplan, Tyson and Gorlov. The blades of impulse turbines can be seen
in Figure 3.4b. In these turbines, pressure remains constant while water is passing through the
blades. However, the pressure is reduced with the help of the nozzle. Waterwheel, Pelton and Turgo
are some types of impulse turbines.
Lately, in the operation, reversible pump-turbine systems are commonly used. In fact, Francis type
of turbine is used in the most reversible pump-turbines. Francis turbines can be operated between 10
and 650 meters. The power output is between 10 to 750 Megawatts. The difference between regular
Francis and reversible pump-turbine is the size and amount of the blades. In reversible pump-
turbines, the blades are longer and fewer to obtain high head for the pump.
22
(a) (b)
Figure 3.4 Types of Turbines (a) Reaction , (b) Impulse2
As can be understood, the turbines are very similar for a regular hydropower plant and a PSHP.
There are little differences mentioned above, but in a common manner, their operational cases are
very close.
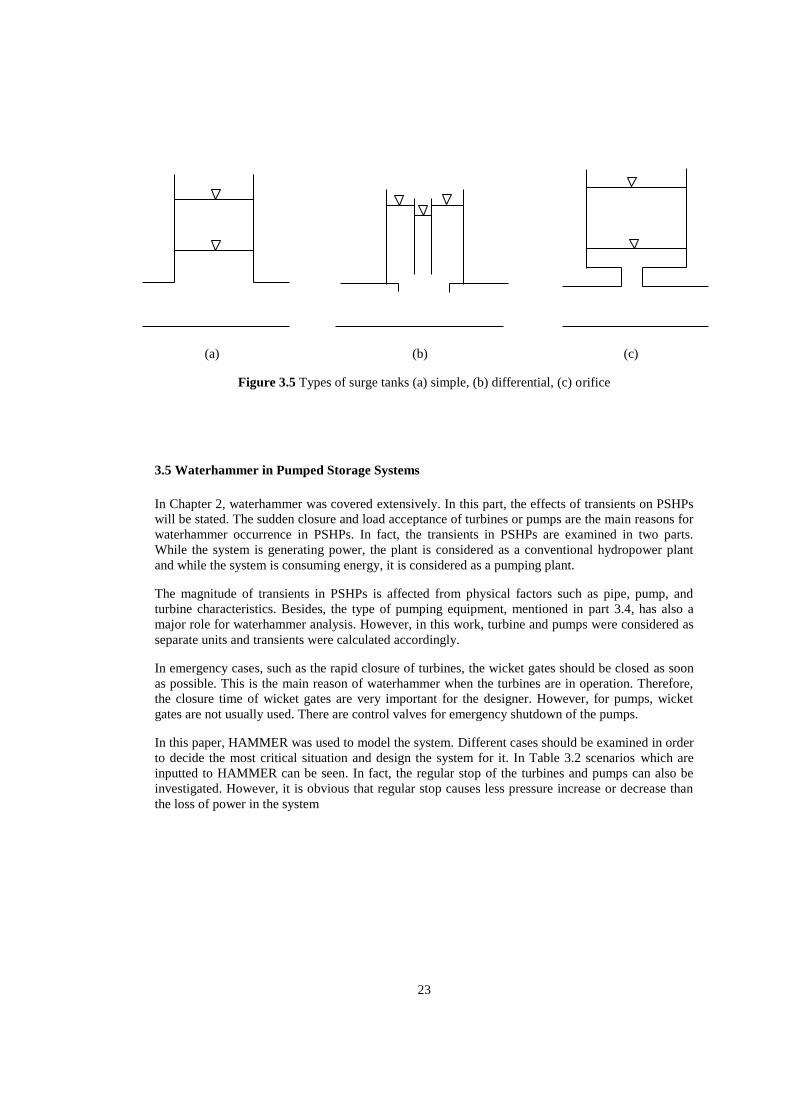
A surge tank is one of the protective measures to waterhammer. Surge tanks regulate the pressure
differences of pressurized flows in a penstock. With the help of surge tanks, pipes with smaller
cross-sections can be used. Besides, when the turbine starts-up, the demand of turbine to water may
increase. Surge tanks supply the necessary water to the turbines. The location of a surge tank should
be as close to the turbines as possible in order to protect penstocks from the effects of waterhammer.
However, in high head drop plants, this is not possible due to the economic reasons. There are
different types of surge tanks. The main types can be seen in Figure 3.5. The type of the surge tank
that will be used in a project is chosen according to the topographic and economic considerations.
2 The source is http://www.daviddarling.info/encyclopedia/F/AE_Francis_turbine.html
23
(a) (b) (c)
Figure 3.5 Types of surge tanks (a) simple, (b) differential, (c) orifice
3.5 Waterhammer in Pumped Storage Systems
In Chapter 2, waterhammer was covered extensively. In this part, the effects of transients on PSHPs
will be stated. The sudden closure and load acceptance of turbines or pumps are the main reasons for
waterhammer occurrence in PSHPs. In fact, the transients in PSHPs are examined in two parts.
While the system is generating power, the plant is considered as a conventional hydropower plant
and while the system is consuming energy, it is considered as a pumping plant.
The magnitude of transients in PSHPs is affected from physical factors such as pipe, pump, and
turbine characteristics. Besides, the type of pumping equipment, mentioned in part 3.4, has also a
major role for waterhammer analysis. However, in this work, turbine and pumps were considered as
separate units and transients were calculated accordingly.
In emergency cases, such as the rapid closure of turbines, the wicket gates should be closed as soon
as possible. This is the main reason of waterhammer when the turbines are in operation. Therefore,
the closure time of wicket gates are very important for the designer. However, for pumps, wicket
gates are not usually used. There are control valves for emergency shutdown of the pumps.
In this paper, HAMMER was used to model the system. Different cases should be examined in order
to decide the most critical situation and design the system for it. In Table 3.2 scenarios which are
inputted to HAMMER can be seen. In fact, the regular stop of the turbines and pumps can also be
investigated. However, it is obvious that regular stop causes less pressure increase or decrease than
the loss of power in the system

24
Table 3.2 Scenarios used in waterhammer calculations
Device Scenario
Number Scenario Case
Pressure change due to the
operation of turbines
1 Stop of both turbines due to load rejection
2 Stop of both turbines due to instant load rejection
3 Load acceptance of both turbines
Pressure change due to the
operation of pumps
4 Startup of both pumps
5 Shutdown of both pumps

25
CHAPTER 4
COMPUTER SOFTWARE
4.1 The Necessity of Computer Software
The hyperbolic, nonlinear, partial differential equations of continuity and momentum should be
solved to analyze transient flows. Knowing the flow dynamics along the penstock in a transient case
is important. Therefore, algebraic forms of these equations are applied in the x-t domain. The
software used to solve these equations numerically in the study is the HAMMER developed by
Bentley. HAMMER uses method of characteristics to solve the continuity and momentum equations.
HAMMER is superior due to:
Creation of a new model or importing the model from another drawing software is simple.
In HAMMER unlimited number of scenarios can be created and the comparison between
them can be done.
HAMMER has an engineering library which includes lots of materials.
The data input is simple.
Most importantly, results can be seen clearly. The transient history of a point in the system
is plotted. In this graph, hydraulic head or pressure values are shown. The animation in the
graph is also possible.
Due to these advantages, HAMMER is chosen for this work. In fact, designing of the pumps are very
simple in HAMMER. Since the transients in pumped-storage systems are investigated here,
HAMMER is the most useful software. However, in HAMMER reversible pump-turbines cannot be
modeled. The pump and turbine cases are studied separately. Therefore, the shift from pump to
turbine or vice-versa during a transient cannot be analyzed. On the other hand, the most critical cases
are expected in emergency operations such as rapid load rejection of the turbines or pump shut
down. Consequently, the shift between turbine and pump is not expected to affect the perfection of
the results.
4.2 The Input Data for HAMMER
For pump storage systems, the necessary data for pump case and turbine case is slightly different.
For pump case, pump characteristics are entered and either pump-shutoff or pump startup case is
chosen for transient flow. On the other hand, turbine characteristics are necessary for turbine case. In
addition, turbine load rejection, instant load rejection, or load acceptance is chosen for transient
flow. The other data is the same and listed below:
Pipe characteristics, length, diameter and wave speed,
Minor losses (Although HAMMER can calculate friction losses, minor losses should be
entered)
Reservoir characteristics and water elevations in the reservoir
The location and elevation of junction points which are necessary to join the different pipes
to each other.
The characteristics and dimensions of protective measures. In this work, surge tank is used.
HAMMER allows designing detailed surge tanks.
26
The fluid conditions to determine the vapor pressure.
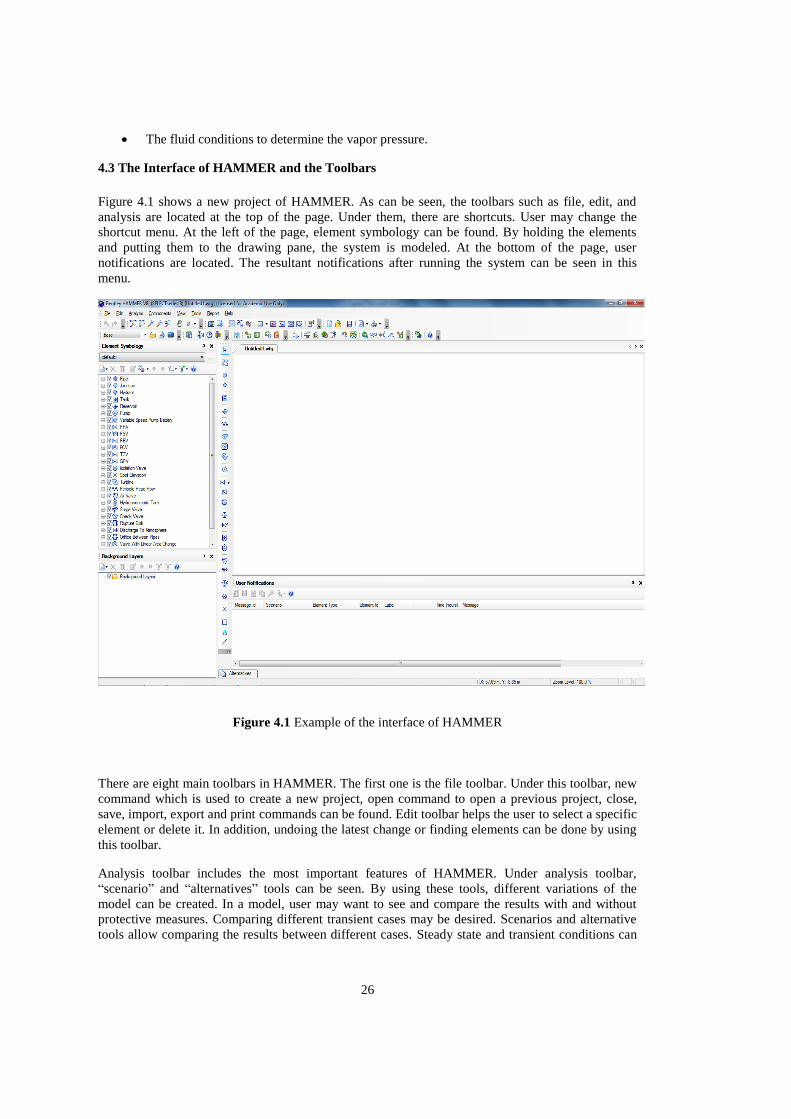
4.3 The Interface of HAMMER and the Toolbars
Figure 4.1 shows a new project of HAMMER. As can be seen, the toolbars such as file, edit, and
analysis are located at the top of the page. Under them, there are shortcuts. User may change the
shortcut menu. At the left of the page, element symbology can be found. By holding the elements
and putting them to the drawing pane, the system is modeled. At the bottom of the page, user
notifications are located. The resultant notifications after running the system can be seen in this
menu.
Figure 4.1 Example of the interface of HAMMER
There are eight main toolbars in HAMMER. The first one is the file toolbar. Under this toolbar, new
command which is used to create a new project, open command to open a previous project, close,
save, import, export and print commands can be found. Edit toolbar helps the user to select a specific
element or delete it. In addition, undoing the latest change or finding elements can be done by using
this toolbar.
Analysis toolbar includes the most important features of HAMMER. Under analysis toolbar,
“scenario” and “alternatives” tools can be seen. By using these tools, different variations of the
model can be created. In a model, user may want to see and compare the results with and without
protective measures. Comparing different transient cases may be desired. Scenarios and alternative
tools allow comparing the results between different cases. Steady state and transient conditions can

27
be adjusted by using calculation option tool. Figure 4.2 shows the properties that can be entered for
these cases.
(a) (b)
Figure 4.2 Flow conditions in HAMMER (a) steady state, (b) transient
Post calculation processor, under the analysis toolbar, allows analyzing elements statistically on
various results. In addition analysis toolbar contains one of the most useful tools, “transient results
28
viewer”. Transient results viewer allows viewing the results on graph. Results can be seen in two
options. In the first option, with the profile of the model, the results such as hydraulic grade or
pressure are shown in a single figure. In the second option, the change in the results with time can be
seen. Both options allow animations which show the change of the results in different time zones.
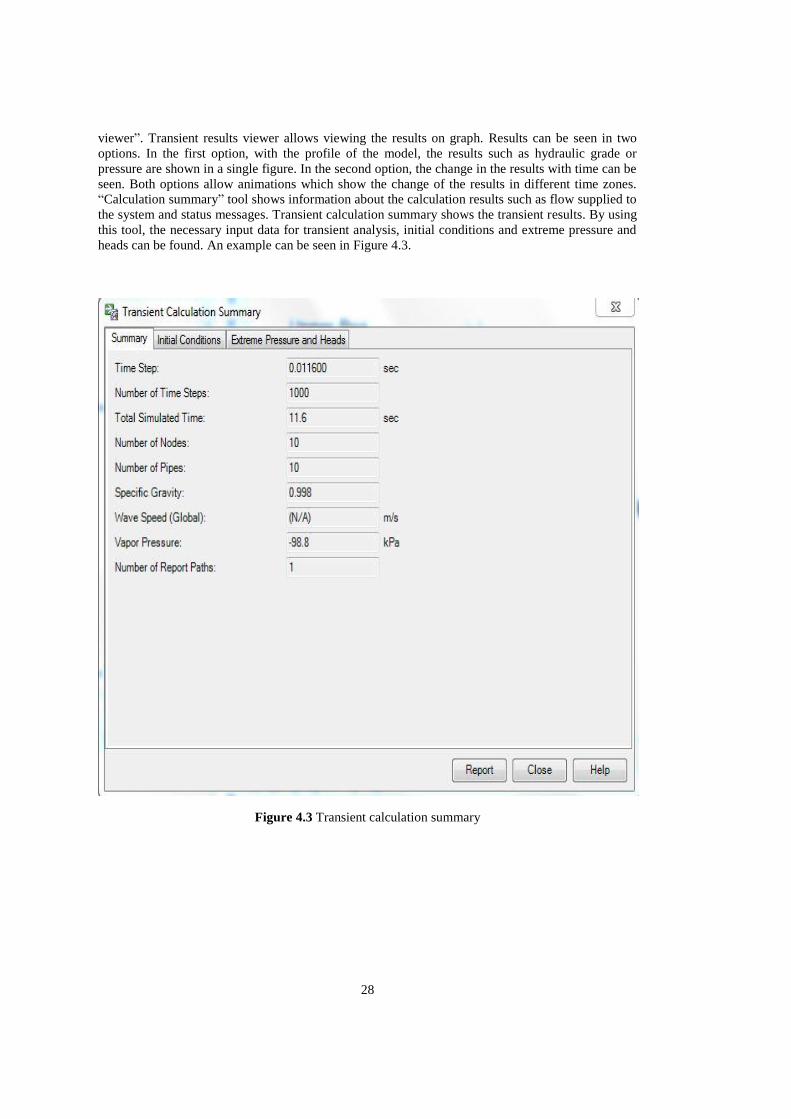
“Calculation summary” tool shows information about the calculation results such as flow supplied to
the system and status messages. Transient calculation summary shows the transient results. By using
this tool, the necessary input data for transient analysis, initial conditions and extreme pressure and
heads can be found. An example can be seen in Figure 4.3.
Figure 4.3 Transient calculation summary
29
“Validate” tool control whether errors with the input data are encountered. If any problems are
predicted, user is alerted. To run the model and see the results “compute initial conditions” and
“compute” tools are used.
Components toolbar presents useful features. “Controls” tool under components toolbar allows
defining the status of an element. For example, when the discharge is under a value, pump is decided
to be operated. This condition can be realized by using controls tool. Condition logics used are AND,
IF and OR. “Zones” helps to define and change the zones desired to study in the model. In the
operation of a hydropower plant, the conditions are changed. For illustration, the power demand
changes in a day. To meet the demand, operation of the pumps or turbines is different in various
times. In addition, when an emergency situation occurs, wicket gates should be closed as rapidly as
possible. “Patterns” tool should be used to define these time variable changes. A pattern is simply a
sequence of time step values. In the “pump definitions” tool, the characteristics of the pumps are
defined. The pumps can be imported from the engineering libraries which are defined in HAMMER,
or new pumps can be created by directly entered the properties of the pump. “Minor loss
coefficients” tool allow the user to enter the minor losses by hand. In fact, HAMMER has an
extensive engineering library in which the most common minor losses are presented.
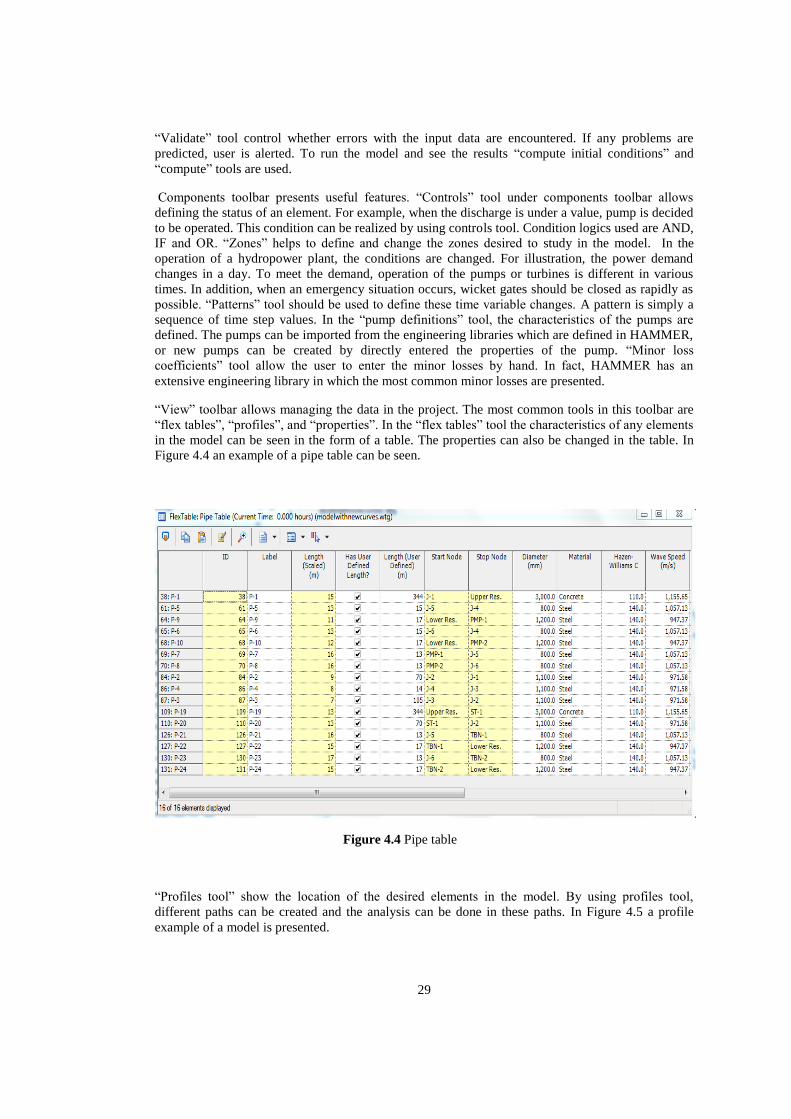
“View” toolbar allows managing the data in the project. The most common tools in this toolbar are
“flex tables”, “profiles”, and “properties”. In the “flex tables” tool the characteristics of any elements
in the model can be seen in the form of a table. The properties can also be changed in the table. In
Figure 4.4 an example of a pipe table can be seen.
Figure 4.4 Pipe table
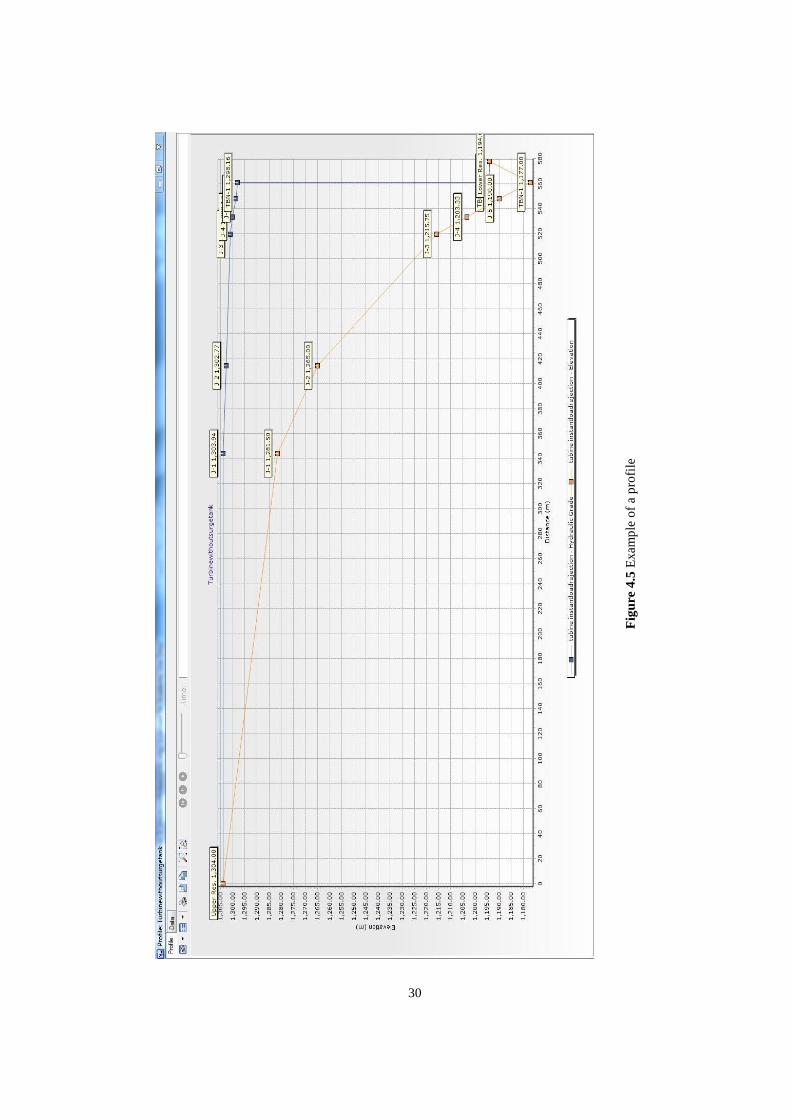
“Profiles tool” show the location of the desired elements in the model. By using profiles tool,
different paths can be created and the analysis can be done in these paths. In Figure 4.5 a profile
example of a model is presented.
30
Fig
ure
4.5
Exam
ple
of
a p
rofi
le
30
31
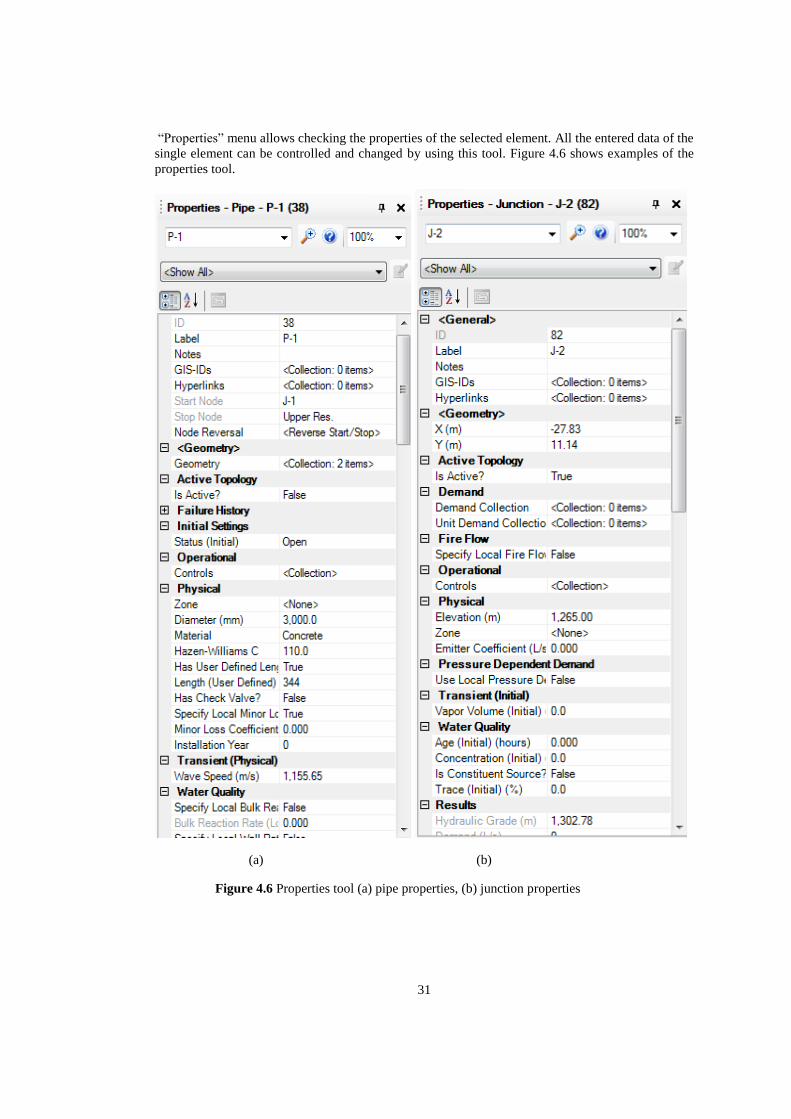
“Properties” menu allows checking the properties of the selected element. All the entered data of the
single element can be controlled and changed by using this tool. Figure 4.6 shows examples of the
properties tool.
(a) (b)
Figure 4.6 Properties tool (a) pipe properties, (b) junction properties

32

33
CHAPTER 5
CASE STUDY AND DISCUSSION OF SCENARIOS
In this chapter, the transients in Yahyalı Hybrid Plant are studied. Firstly, brief information about the
plant is given. Then, the results of different scenarios are discussed. Finally, the transients with surge
tank which is placed as a protective measure in the system are calculated and the effects of surge
tank are discussed. The aim of this chapter is to calculate the transients for the worst scenarios.
5.1 Physical Information about Yahyalı Hybrid Plant
Yahyalı Hybrid Plant is located at Kayseri, Turkey. At first, this plant was decided to be constructed
in Yalova, but because the soil properties of Yalova were not appropriate for the plant, the location
was changed to Kayseri. Since there are no pumped-storage systems in Turkey, an experienced
Japan firm is chosen as the designer. The most important feature of this plant is that the plant
combines wind power and hydropower. At the times when the energy production due to wind is
higher than the energy demand, the pumps are operated and the water is pump into the upstream
reservoir. On the contrary, when the demand is higher, the turbines produce energy. More detailed
information about this subject will be given in the next chapter.
There are two reservoirs of the plant as expected in PSHPs. The lower reservoir of Yahyalı Plant is
the existing reservoir of Çamlıca-1 Hydropower Plant. Therefore, there is no need to construct a new
reservoir and the cost is lowered. General plan view of the plant can be seen in Figure 5.1.
Table 5.1 The physical properties of reservoirs in Yahyalı Hybrid Plant
Location Active Volume (m3) Maximum Water
Elevation (m)
Minimum Water
Elevation (m)
Upper Reservoir 181,000 1,304 1,285
Lower Reservoir 319,000 1,194 1,192
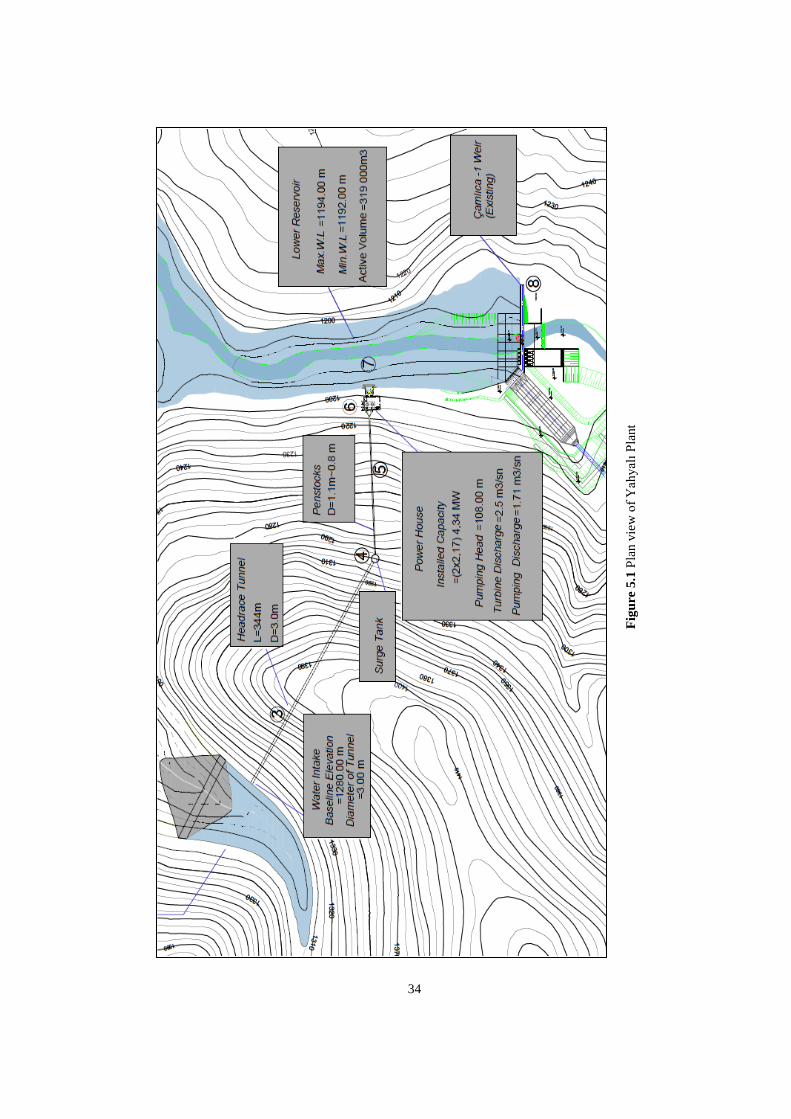
34
Fig
ure
5.1
Pla
n v
iew
of
Yah
yal
ı P
lant
34

35
As can be seen from Figure 5.1, a headrace tunnel with a diameter of 3.0 m is connected to the
upper reservoir. The length of the headrace tunnel is 344m. Between the energy tunnel and the
penstocks, a surge tank is considered to be constructed. The diameter of the surge tank is 5.0 m.
While the total volume of the upper reservoir is 218000 m3, the active volume is 181000 m
3. On the
other hand, the active volume of the lower reservoir is 319000 m3. The main body of the upper
reservoir is rock fill with concrete lining. Lastly, as shown in Table 5.1 the maximum and
minimum water elevations of the upper reservoir are 1304.0 m and 1285.0 m, respectively.
Similarly, for the lower reservoir, the maximum and the minimum water elevations are 1194.0 m
and 1192.0 m, respectively.
There are penstocks with a total length of 245 m between the surge tank and the power station.
After the power station, again with the help of penstocks, the water is delivered to the lower
reservoir while the turbines are in operation. On the other hand, while pumps are operated, the
water is distributed from the lower reservoir to the upper reservoir. A view of the penstocks is
given in Figure 5.2.
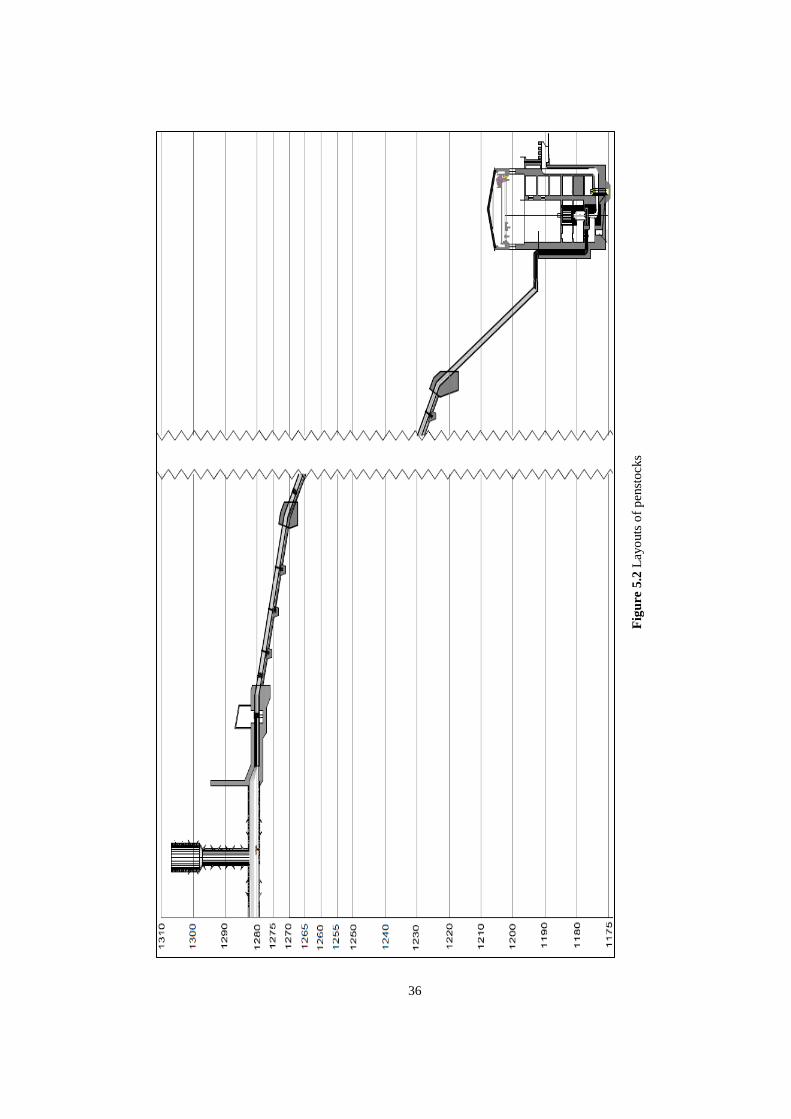
36
Fig
ure
5.2
Lay
outs
of
pen
sto
cks
36
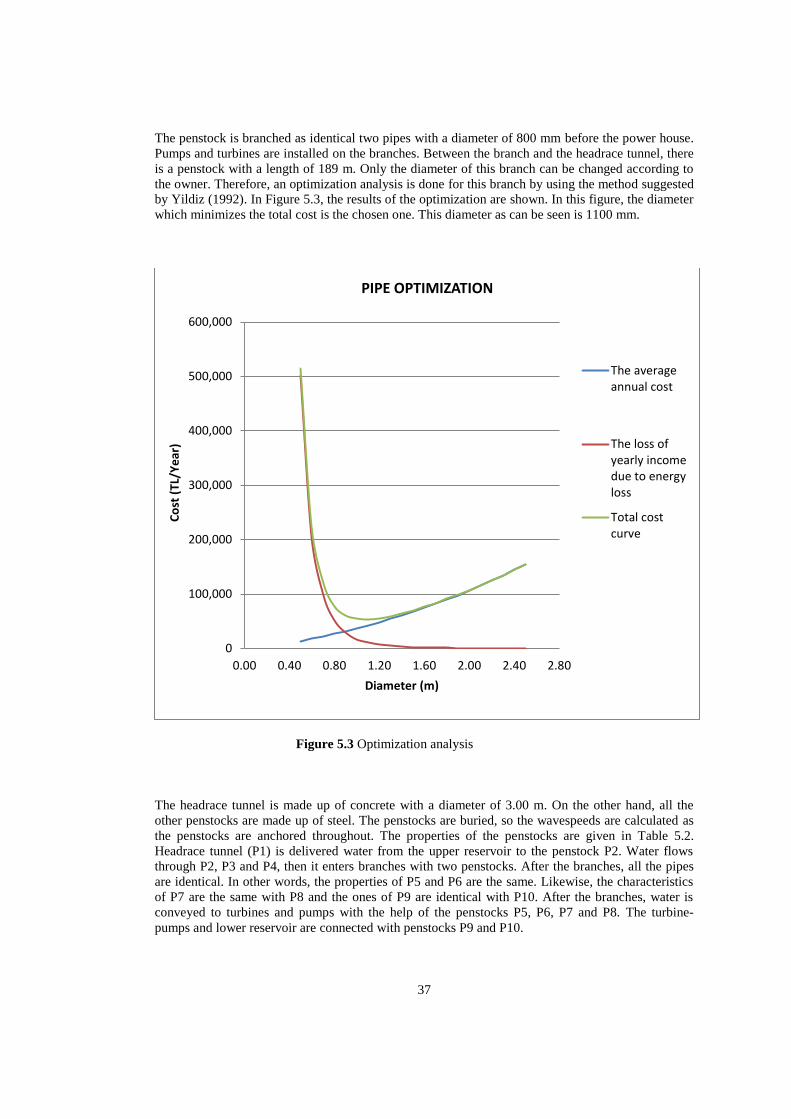
37
The penstock is branched as identical two pipes with a diameter of 800 mm before the power house.
Pumps and turbines are installed on the branches. Between the branch and the headrace tunnel, there
is a penstock with a length of 189 m. Only the diameter of this branch can be changed according to
the owner. Therefore, an optimization analysis is done for this branch by using the method suggested
by Yildiz (1992). In Figure 5.3, the results of the optimization are shown. In this figure, the diameter
which minimizes the total cost is the chosen one. This diameter as can be seen is 1100 mm.
Figure 5.3 Optimization analysis
The headrace tunnel is made up of concrete with a diameter of 3.00 m. On the other hand, all the
other penstocks are made up of steel. The penstocks are buried, so the wavespeeds are calculated as
the penstocks are anchored throughout. The properties of the penstocks are given in Table 5.2.
Headrace tunnel (P1) is delivered water from the upper reservoir to the penstock P2. Water flows
through P2, P3 and P4, then it enters branches with two penstocks. After the branches, all the pipes
are identical. In other words, the properties of P5 and P6 are the same. Likewise, the characteristics
of P7 are the same with P8 and the ones of P9 are identical with P10. After the branches, water is
conveyed to turbines and pumps with the help of the penstocks P5, P6, P7 and P8. The turbine-
pumps and lower reservoir are connected with penstocks P9 and P10.
0
100,000
200,000
300,000
400,000
500,000
600,000
0.00 0.40 0.80 1.20 1.60 2.00 2.40 2.80
Co
st (
TL/Y
ear
)
Diameter (m)
PIPE OPTIMIZATION
The averageannual cost
The loss ofyearly incomedue to energyloss
Total costcurve
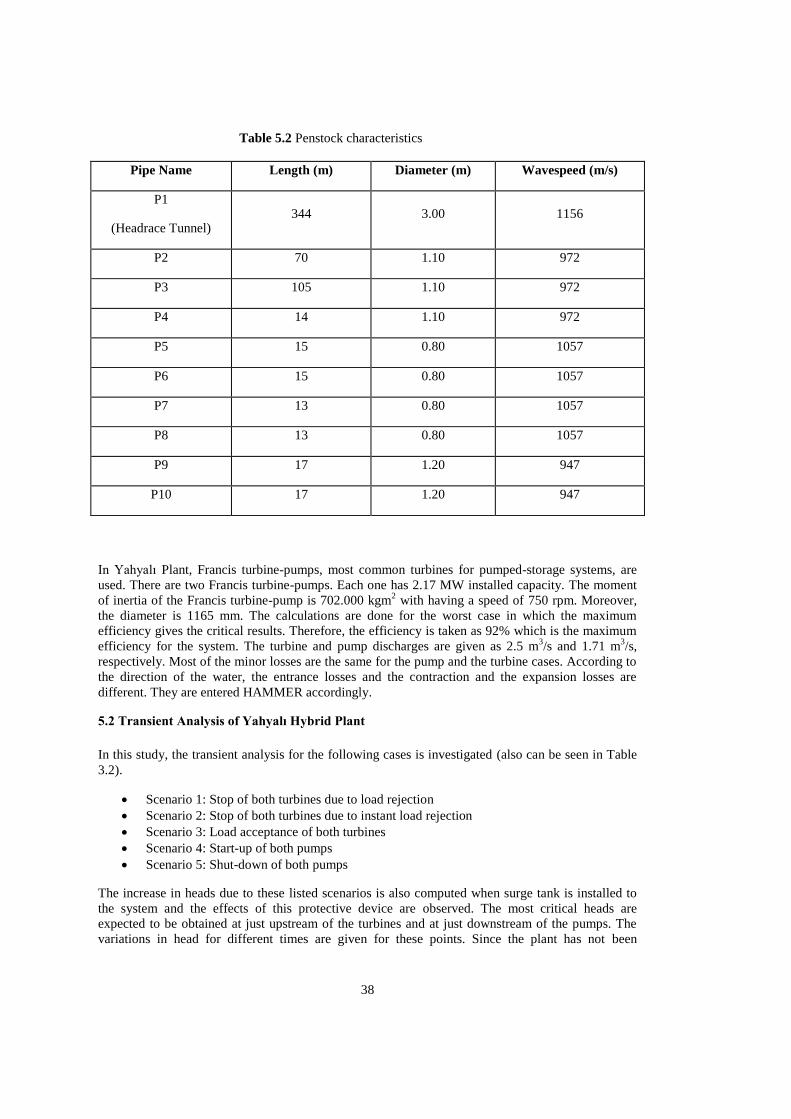
38
Table 5.2 Penstock characteristics
Pipe Name Length (m) Diameter (m) Wavespeed (m/s)
P1
(Headrace Tunnel) 344 3.00 1156
P2 70 1.10 972
P3 105 1.10 972
P4 14 1.10 972
P5 15 0.80 1057
P6 15 0.80 1057
P7 13 0.80 1057
P8 13 0.80 1057
P9 17 1.20 947
P10 17 1.20 947
In Yahyalı Plant, Francis turbine-pumps, most common turbines for pumped-storage systems, are
used. There are two Francis turbine-pumps. Each one has 2.17 MW installed capacity. The moment
of inertia of the Francis turbine-pump is 702.000 kgm2 with having a speed of 750 rpm. Moreover,
the diameter is 1165 mm. The calculations are done for the worst case in which the maximum
efficiency gives the critical results. Therefore, the efficiency is taken as 92% which is the maximum
efficiency for the system. The turbine and pump discharges are given as 2.5 m3/s and 1.71 m
3/s,
respectively. Most of the minor losses are the same for the pump and the turbine cases. According to
the direction of the water, the entrance losses and the contraction and the expansion losses are
different. They are entered HAMMER accordingly.
5.2 Transient Analysis of Yahyalı Hybrid Plant
In this study, the transient analysis for the following cases is investigated (also can be seen in Table
3.2).
Scenario 1: Stop of both turbines due to load rejection
Scenario 2: Stop of both turbines due to instant load rejection
Scenario 3: Load acceptance of both turbines
Scenario 4: Start-up of both pumps
Scenario 5: Shut-down of both pumps
The increase in heads due to these listed scenarios is also computed when surge tank is installed to
the system and the effects of this protective device are observed. The most critical heads are
expected to be obtained at just upstream of the turbines and at just downstream of the pumps. The
variations in head for different times are given for these points. Since the plant has not been
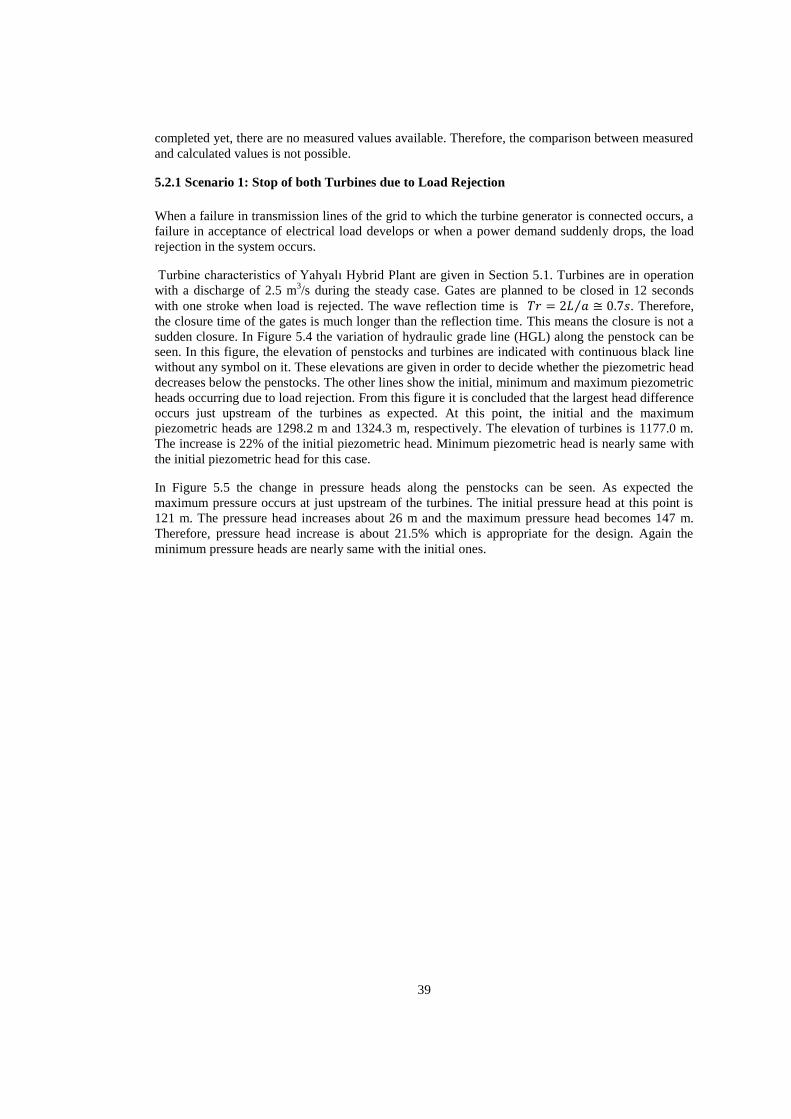
39
completed yet, there are no measured values available. Therefore, the comparison between measured
and calculated values is not possible.
5.2.1 Scenario 1: Stop of both Turbines due to Load Rejection
When a failure in transmission lines of the grid to which the turbine generator is connected occurs, a
failure in acceptance of electrical load develops or when a power demand suddenly drops, the load
rejection in the system occurs.
Turbine characteristics of Yahyalı Hybrid Plant are given in Section 5.1. Turbines are in operation
with a discharge of 2.5 m3/s during the steady case. Gates are planned to be closed in 12 seconds
with one stroke when load is rejected. The wave reflection time is ⁄ . Therefore,
the closure time of the gates is much longer than the reflection time. This means the closure is not a
sudden closure. In Figure 5.4 the variation of hydraulic grade line (HGL) along the penstock can be
seen. In this figure, the elevation of penstocks and turbines are indicated with continuous black line
without any symbol on it. These elevations are given in order to decide whether the piezometric head
decreases below the penstocks. The other lines show the initial, minimum and maximum piezometric
heads occurring due to load rejection. From this figure it is concluded that the largest head difference
occurs just upstream of the turbines as expected. At this point, the initial and the maximum
piezometric heads are 1298.2 m and 1324.3 m, respectively. The elevation of turbines is 1177.0 m.
The increase is 22% of the initial piezometric head. Minimum piezometric head is nearly same with
the initial piezometric head for this case.
In Figure 5.5 the change in pressure heads along the penstocks can be seen. As expected the
maximum pressure occurs at just upstream of the turbines. The initial pressure head at this point is
121 m. The pressure head increases about 26 m and the maximum pressure head becomes 147 m.
Therefore, pressure head increase is about 21.5% which is appropriate for the design. Again the
minimum pressure heads are nearly same with the initial ones.
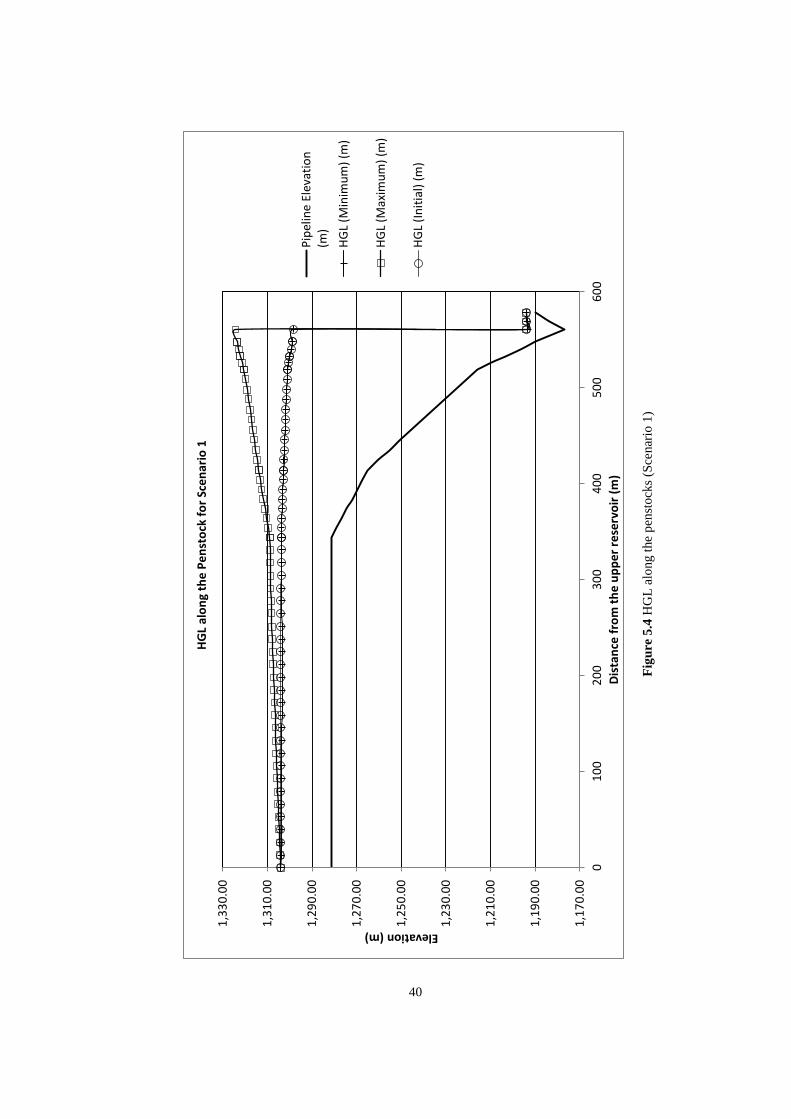
40
Fig
ure
5.4
HG
L a
long t
he
pen
sto
cks
(Sce
nar
io 1
)
1,1
70
.00
1,1
90
.00
1,2
10
.00
1,2
30
.00
1,2
50
.00
1,2
70
.00
1,2
90
.00
1,3
10
.00
1,3
30
.00
01
00
20
03
00
40
05
00
60
0
Elevation (m)
Dis
tan
ce f
rom
th
e u
pp
er
rese
rvo
ir (
m)
HG
L al
on
g th
e P
en
sto
ck f
or
Sce
nar
io 1
Pip
elin
e E
leva
tio
n(m
)
HG
L (M
inim
um
) (m
)
HG
L (M
axim
um
) (m
)
HG
L (I
nit
ial)
(m
)
40
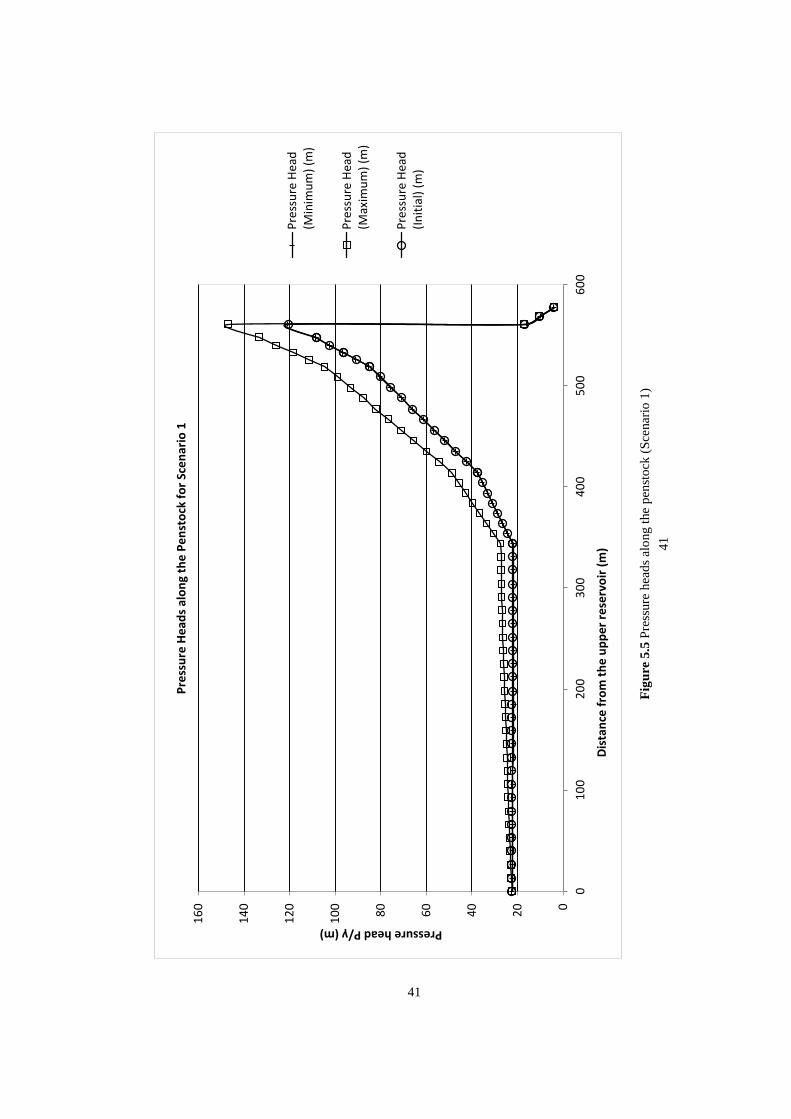
41
Fig
ure
5.5
Pre
ssure
hea
ds
alo
ng t
he
pen
sto
ck (
Sce
nar
io 1
)
0
20
40
60
80
10
0
12
0
14
0
16
0
01
00
20
03
00
40
05
00
60
0
Pressure head P/γ (m)
Dis
tan
ce f
rom
th
e u
pp
er
rese
rvo
ir (
m)
Pre
ssu
re H
ead
s al
on
g th
e P
en
sto
ck f
or
Sce
nar
io 1
Pre
ssu
re H
ead
(Min
imu
m)
(m)
Pre
ssu
re H
ead
(Max
imu
m)
(m)
Pre
ssu
re H
ead
(In
itia
l) (
m)
41
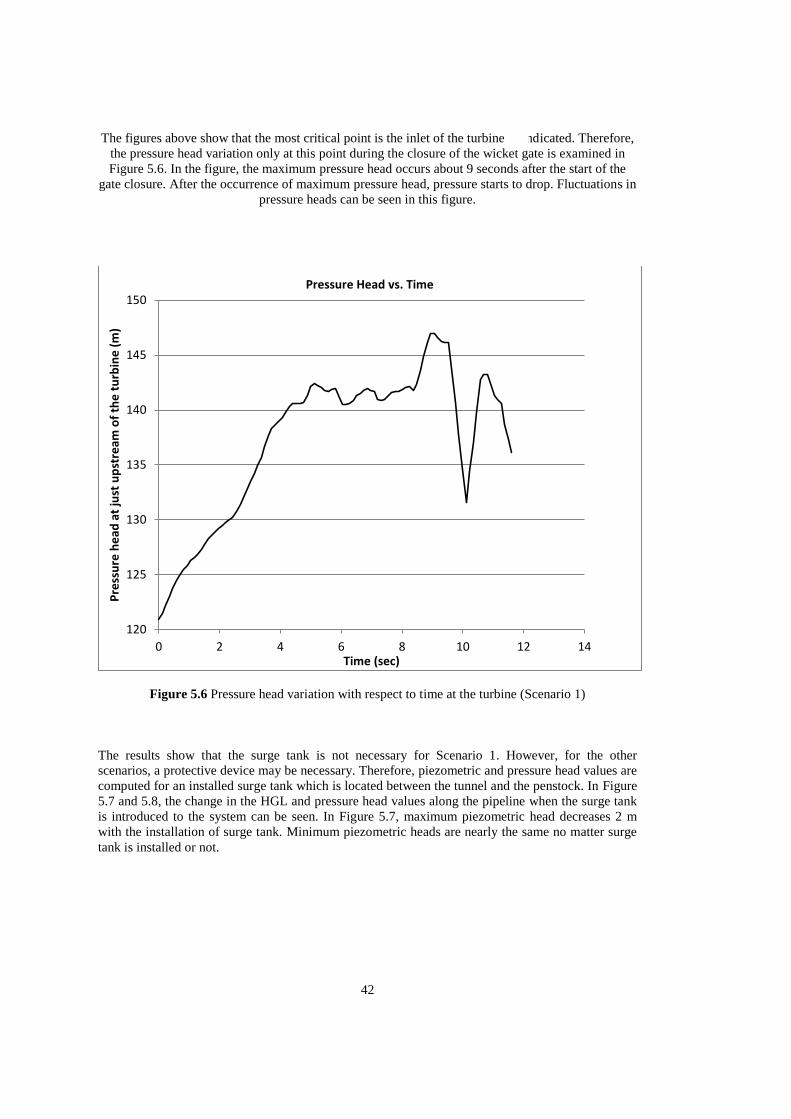
42
The figures above show that the most critical point is the inlet of the turbine as indicated. Therefore,
the pressure head variation only at this point during the closure of the wicket gate is examined in
Figure 5.6. In the figure, the maximum pressure head occurs about 9 seconds after the start of the
gate closure. After the occurrence of maximum pressure head, pressure starts to drop. Fluctuations in
pressure heads can be seen in this figure.
Figure 5.6 Pressure head variation with respect to time at the turbine (Scenario 1)
The results show that the surge tank is not necessary for Scenario 1. However, for the other
scenarios, a protective device may be necessary. Therefore, piezometric and pressure head values are
computed for an installed surge tank which is located between the tunnel and the penstock. In Figure
5.7 and 5.8, the change in the HGL and pressure head values along the pipeline when the surge tank
is introduced to the system can be seen. In Figure 5.7, maximum piezometric head decreases 2 m
with the installation of surge tank. Minimum piezometric heads are nearly the same no matter surge
tank is installed or not.
120
125
130
135
140
145
150
0 2 4 6 8 10 12 14
Pre
ssu
re h
ead
at
just
up
stre
am o
f th
e t
urb
ine
(m
)
Time (sec)
Pressure Head vs. Time
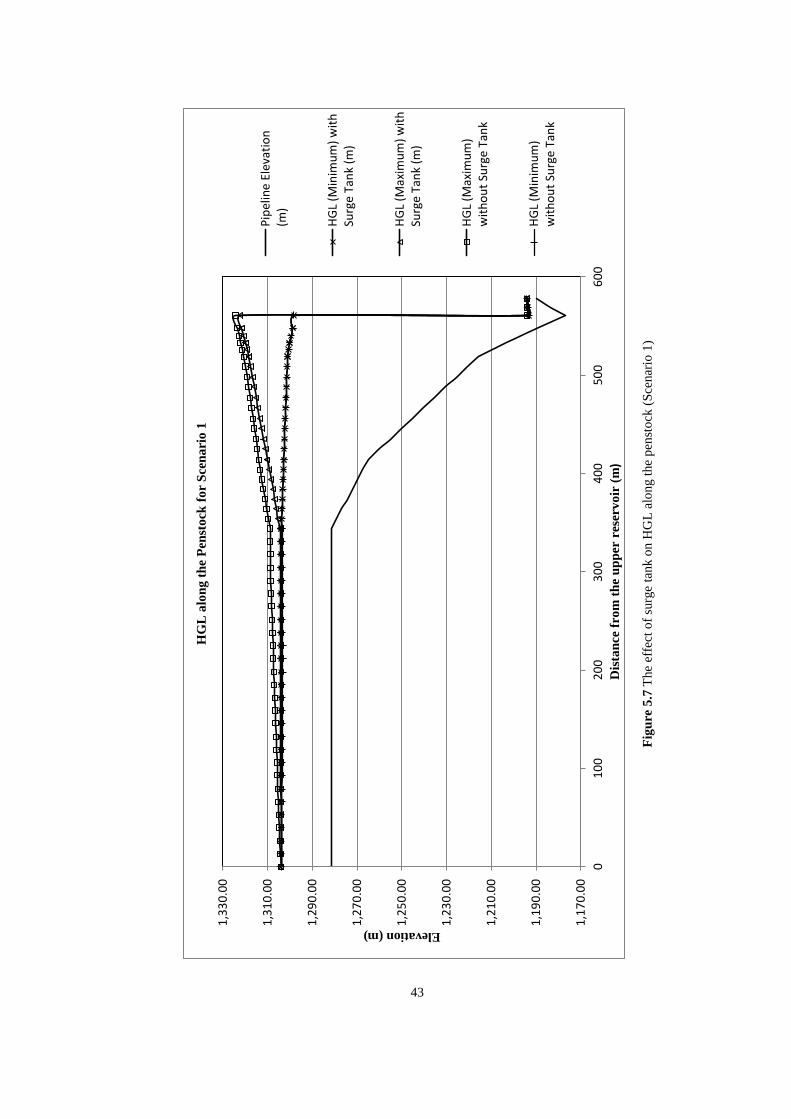
43
Fig
ure
5.7
The
effe
ct o
f su
rge t
ank o
n H
GL
alo
ng t
he
pen
sto
ck (
Sce
nar
io 1
)
1,1
70
.00
1,1
90
.00
1,2
10
.00
1,2
30
.00
1,2
50
.00
1,2
70
.00
1,2
90
.00
1,3
10
.00
1,3
30
.00
01
00
20
03
00
40
05
00
60
0
Elevation (m)
Dis
tan
ce f
rom
th
e u
pp
er r
eser
vo
ir (
m)
HG
L a
lon
g t
he
Pen
sto
ck f
or
Sce
na
rio
1
Pip
elin
e E
leva
tio
n(m
)
HG
L (M
inim
um
) w
ith
Surg
e T
ank
(m)
HG
L (M
axim
um
) w
ith
Surg
e T
ank
(m)
HG
L (M
axim
um
)w
ith
ou
t Su
rge
Tan
k
HG
L (M
inim
um
)w
ith
ou
t Su
rge
Tan
k
43
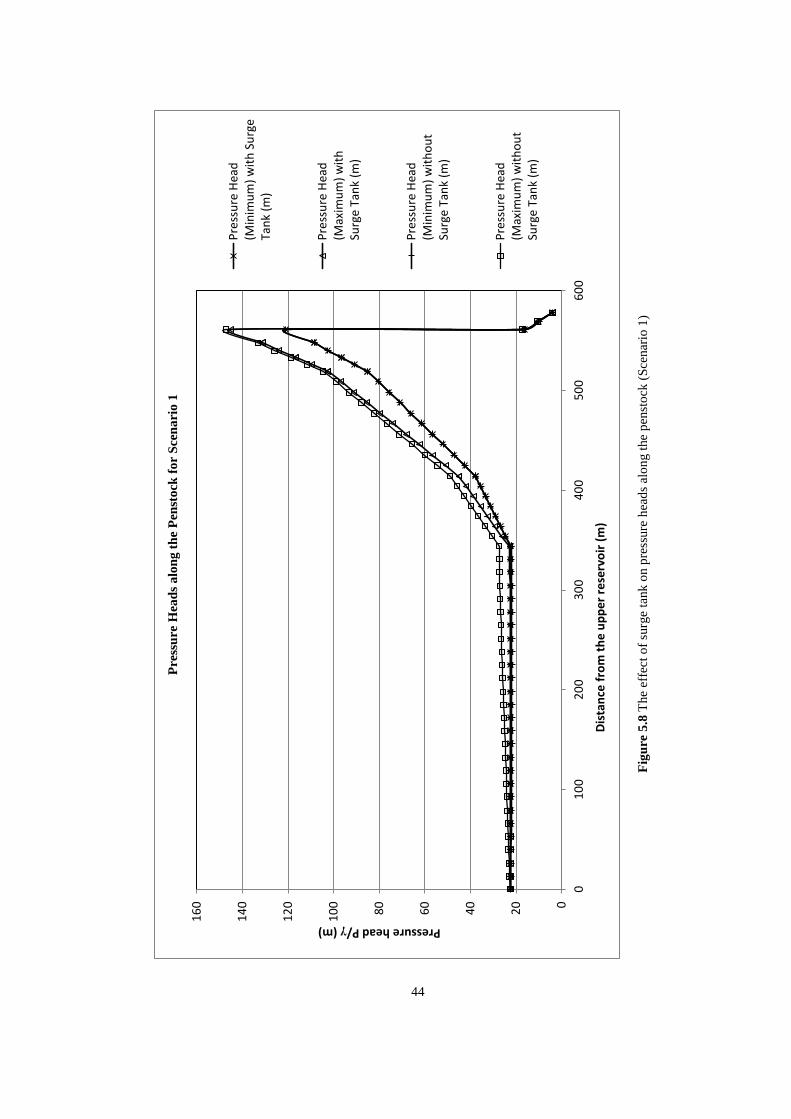
44
Fig
ure
5.8
The
effe
ct o
f su
rge t
ank o
n p
ress
ure
hea
ds
alo
ng t
he
pen
sto
ck (
Sce
nar
io 1
)
0
20
40
60
80
10
0
12
0
14
0
16
0
01
00
20
03
00
40
05
00
60
0
Pressure head P/γ (m)
Dis
tan
ce f
rom
th
e u
pp
er
rese
rvo
ir (
m)
Pre
ssu
re H
ead
s a
lon
g t
he
Pen
sto
ck f
or
Sce
na
rio
1
Pre
ssu
re H
ead
(Min
imu
m)
wit
h S
urg
eTa
nk
(m)
Pre
ssu
re H
ead
(Max
imu
m)
wit
hSu
rge
Tan
k (m
)
Pre
ssu
re H
ead
(Min
imu
m)
wit
ho
ut
Surg
e T
ank
(m)
Pre
ssu
re H
ead
(Max
imu
m)
wit
ho
ut
Surg
e T
ank
(m)
44
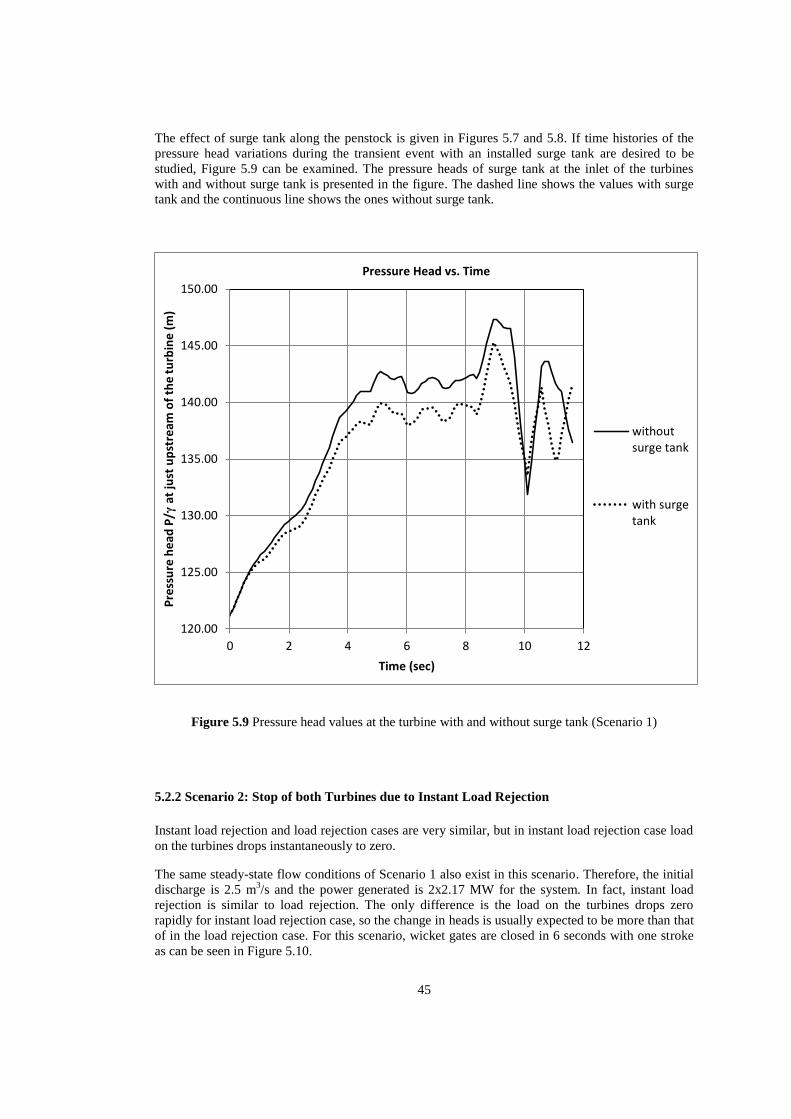
45
The effect of surge tank along the penstock is given in Figures 5.7 and 5.8. If time histories of the
pressure head variations during the transient event with an installed surge tank are desired to be
studied, Figure 5.9 can be examined. The pressure heads of surge tank at the inlet of the turbines
with and without surge tank is presented in the figure. The dashed line shows the values with surge
tank and the continuous line shows the ones without surge tank.
Figure 5.9 Pressure head values at the turbine with and without surge tank (Scenario 1)
5.2.2 Scenario 2: Stop of both Turbines due to Instant Load Rejection
Instant load rejection and load rejection cases are very similar, but in instant load rejection case load
on the turbines drops instantaneously to zero.
The same steady-state flow conditions of Scenario 1 also exist in this scenario. Therefore, the initial
discharge is 2.5 m3/s and the power generated is 2x2.17 MW for the system. In fact, instant load
rejection is similar to load rejection. The only difference is the load on the turbines drops zero
rapidly for instant load rejection case, so the change in heads is usually expected to be more than that
of in the load rejection case. For this scenario, wicket gates are closed in 6 seconds with one stroke
as can be seen in Figure 5.10.
120.00
125.00
130.00
135.00
140.00
145.00
150.00
0 2 4 6 8 10 12
Pre
ssu
re h
ead
P/γ
at
just
up
stre
am o
f th
e t
urb
ine
(m
)
Time (sec)
Pressure Head vs. Time
withoutsurge tank
with surgetank
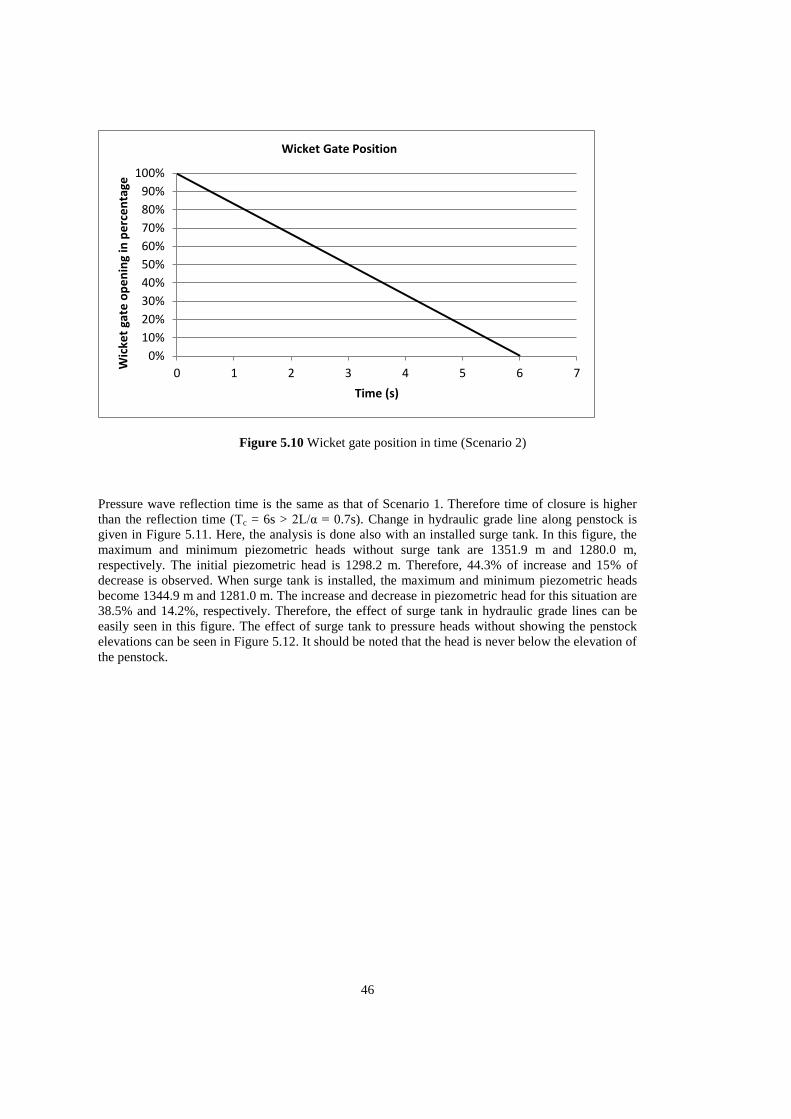
46
Figure 5.10 Wicket gate position in time (Scenario 2)
Pressure wave reflection time is the same as that of Scenario 1. Therefore time of closure is higher
than the reflection time (Tc = 6s > 2L/α = 0.7s). Change in hydraulic grade line along penstock is
given in Figure 5.11. Here, the analysis is done also with an installed surge tank. In this figure, the
maximum and minimum piezometric heads without surge tank are 1351.9 m and 1280.0 m,
respectively. The initial piezometric head is 1298.2 m. Therefore, 44.3% of increase and 15% of
decrease is observed. When surge tank is installed, the maximum and minimum piezometric heads
become 1344.9 m and 1281.0 m. The increase and decrease in piezometric head for this situation are
38.5% and 14.2%, respectively. Therefore, the effect of surge tank in hydraulic grade lines can be
easily seen in this figure. The effect of surge tank to pressure heads without showing the penstock
elevations can be seen in Figure 5.12. It should be noted that the head is never below the elevation of
the penstock.
0%
10%
20%
30%
40%
50%
60%
70%
80%
90%
100%
0 1 2 3 4 5 6 7
Wic
ket
gate
op
en
ing
in p
erc
en
tage
Time (s)
Wicket Gate Position
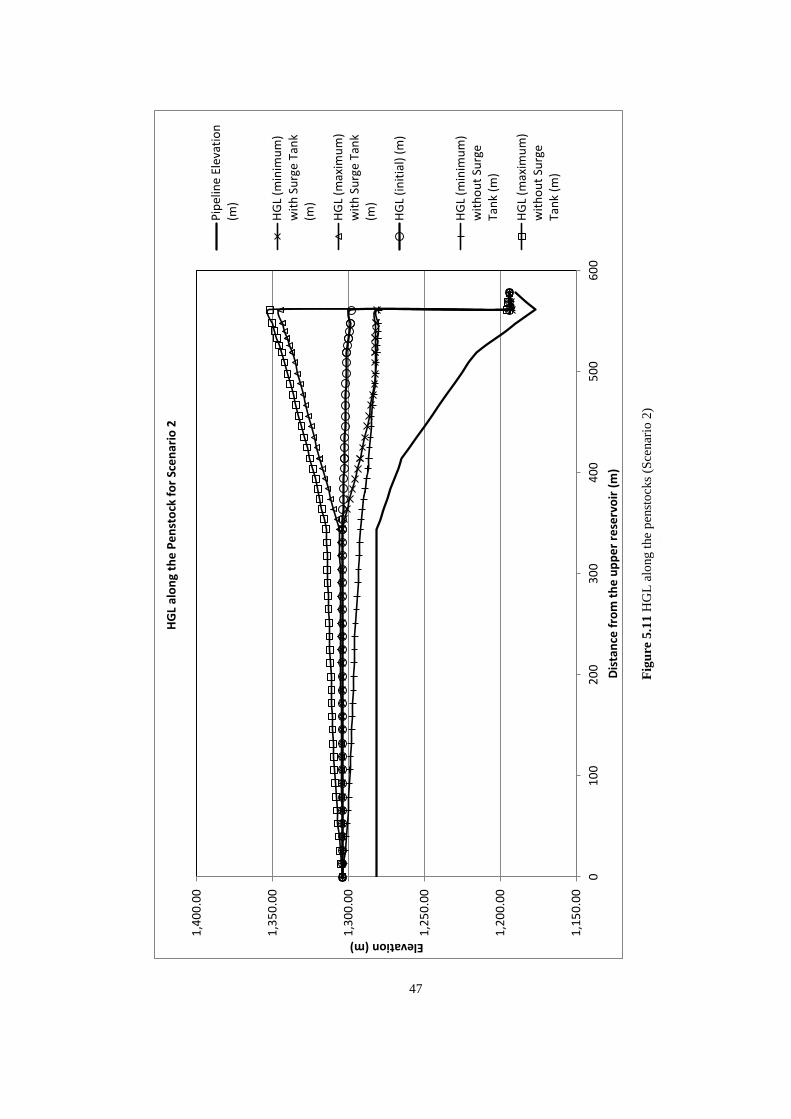
47
Fig
ure
5.1
1 H
GL
alo
ng t
he
pen
sto
cks
(Sce
nar
io 2
)
1,1
50
.00
1,2
00
.00
1,2
50
.00
1,3
00
.00
1,3
50
.00
1,4
00
.00
01
00
20
03
00
40
05
00
60
0
Elevation (m)
Dis
tan
ce f
rom
th
e u
pp
er
rese
rvo
ir (
m)
HG
L al
on
g th
e P
en
sto
ck f
or
Sce
nar
io 2
Pip
elin
e E
leva
tio
n(m
)
HG
L (m
inim
um
)w
ith
Su
rge
Tan
k(m
)
HG
L (m
axim
um
)w
ith
Su
rge
Tan
k(m
)
HG
L (i
nit
ial)
(m
)
HG
L (m
inim
um
)w
ith
ou
t Su
rge
Tan
k (m
)
HG
L (m
axim
um
)w
ith
ou
t Su
rge
Tan
k (m
)
47
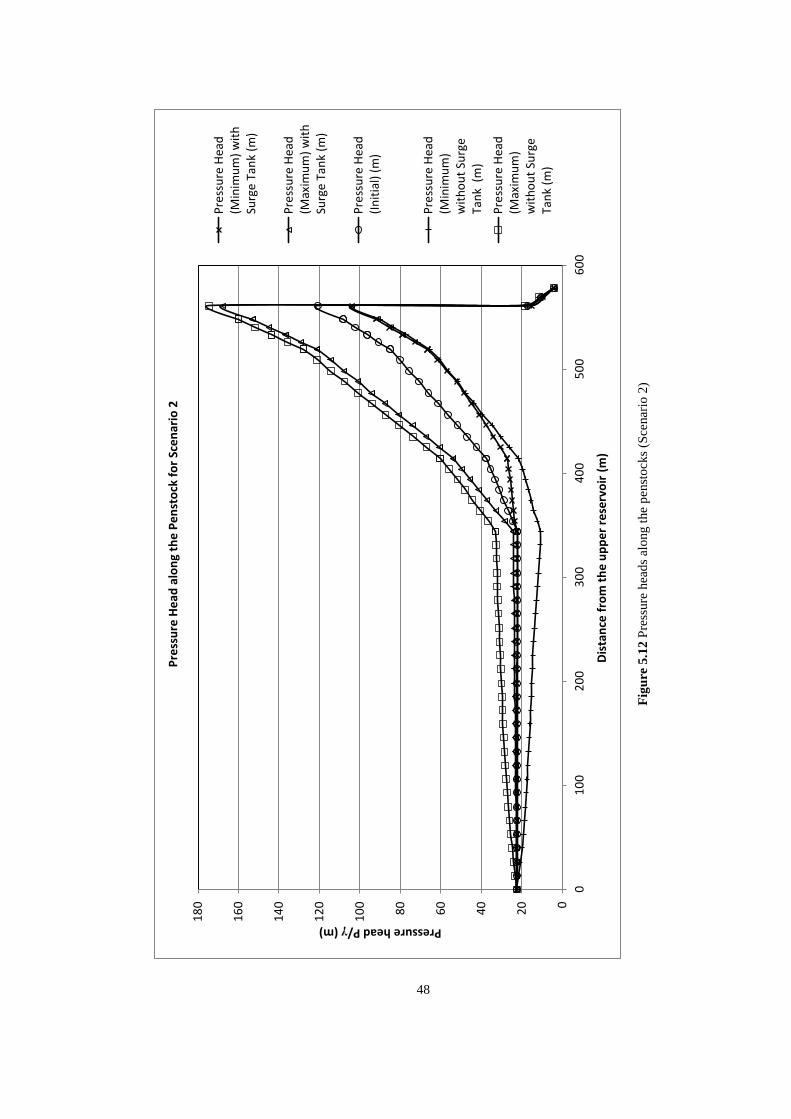
48
Fig
ure
5.1
2 P
ress
ure
hea
ds
alo
ng t
he
pen
sto
cks
(Sce
nar
io 2
)
0
20
40
60
80
10
0
12
0
14
0
16
0
18
0
01
00
20
03
00
40
05
00
60
0
Pressure head P/γ (m)
Dis
tan
ce f
rom
th
e u
pp
er
rese
rvo
ir (
m)
Pre
ssu
re H
ead
alo
ng
the
Pe
nst
ock
fo
r Sc
en
ario
2
Pre
ssu
re H
ead
(Min
imu
m)
wit
hSu
rge
Tan
k (m
)
Pre
ssu
re H
ead
(Max
imu
m)
wit
hSu
rge
Tan
k (m
)
Pre
ssu
re H
ead
(In
itia
l) (
m)
Pre
ssu
re H
ead
(Min
imu
m)
wit
ho
ut
Surg
eTa
nk
(m
)
Pre
ssu
re H
ead
(Max
imu
m)
wit
ho
ut
Surg
eTa
nk
(m)
48
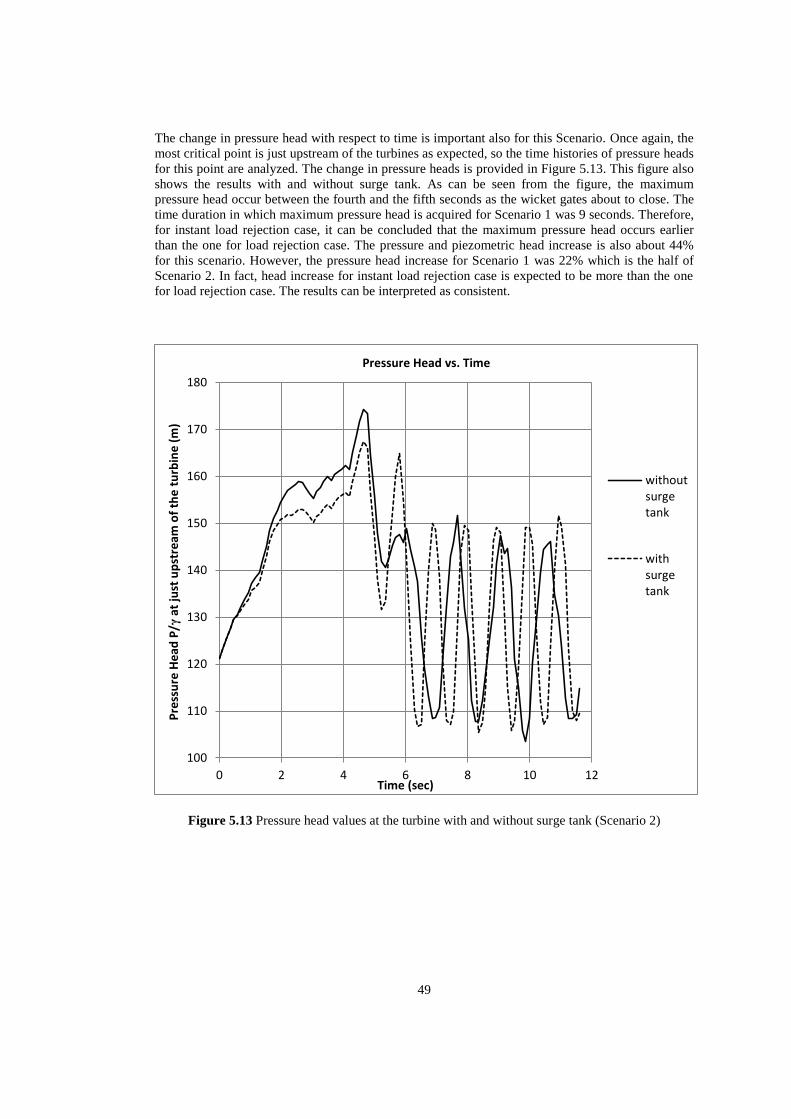
49
The change in pressure head with respect to time is important also for this Scenario. Once again, the
most critical point is just upstream of the turbines as expected, so the time histories of pressure heads
for this point are analyzed. The change in pressure heads is provided in Figure 5.13. This figure also
shows the results with and without surge tank. As can be seen from the figure, the maximum
pressure head occur between the fourth and the fifth seconds as the wicket gates about to close. The
time duration in which maximum pressure head is acquired for Scenario 1 was 9 seconds. Therefore,
for instant load rejection case, it can be concluded that the maximum pressure head occurs earlier
than the one for load rejection case. The pressure and piezometric head increase is also about 44%
for this scenario. However, the pressure head increase for Scenario 1 was 22% which is the half of
Scenario 2. In fact, head increase for instant load rejection case is expected to be more than the one
for load rejection case. The results can be interpreted as consistent.
Figure 5.13 Pressure head values at the turbine with and without surge tank (Scenario 2)
100
110
120
130
140
150
160
170
180
0 2 4 6 8 10 12
Pre
ssu
re H
ead
P/γ
at
just
up
stre
am o
f th
e t
urb
ine
(m
)
Time (sec)
Pressure Head vs. Time
withoutsurgetank
withsurgetank
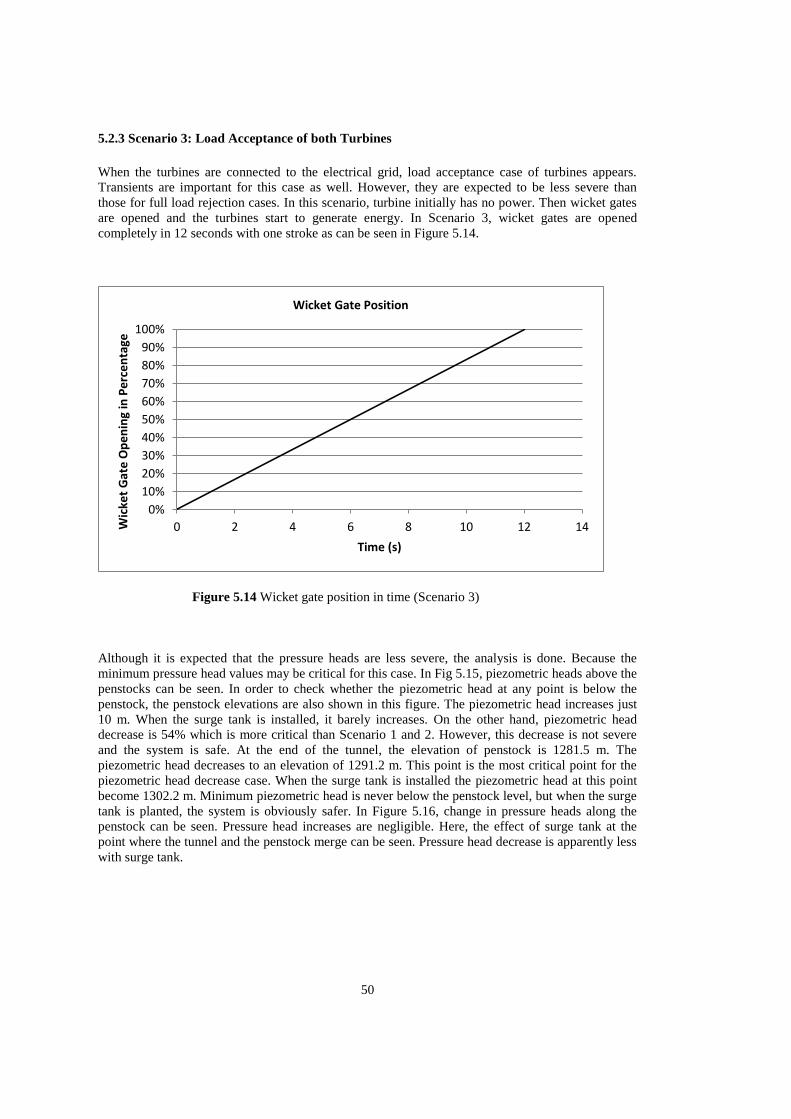
50
5.2.3 Scenario 3: Load Acceptance of both Turbines
When the turbines are connected to the electrical grid, load acceptance case of turbines appears.
Transients are important for this case as well. However, they are expected to be less severe than
those for full load rejection cases. In this scenario, turbine initially has no power. Then wicket gates
are opened and the turbines start to generate energy. In Scenario 3, wicket gates are opened
completely in 12 seconds with one stroke as can be seen in Figure 5.14.
Figure 5.14 Wicket gate position in time (Scenario 3)
Although it is expected that the pressure heads are less severe, the analysis is done. Because the
minimum pressure head values may be critical for this case. In Fig 5.15, piezometric heads above the
penstocks can be seen. In order to check whether the piezometric head at any point is below the
penstock, the penstock elevations are also shown in this figure. The piezometric head increases just
10 m. When the surge tank is installed, it barely increases. On the other hand, piezometric head
decrease is 54% which is more critical than Scenario 1 and 2. However, this decrease is not severe
and the system is safe. At the end of the tunnel, the elevation of penstock is 1281.5 m. The
piezometric head decreases to an elevation of 1291.2 m. This point is the most critical point for the
piezometric head decrease case. When the surge tank is installed the piezometric head at this point
become 1302.2 m. Minimum piezometric head is never below the penstock level, but when the surge
tank is planted, the system is obviously safer. In Figure 5.16, change in pressure heads along the
penstock can be seen. Pressure head increases are negligible. Here, the effect of surge tank at the
point where the tunnel and the penstock merge can be seen. Pressure head decrease is apparently less
with surge tank.
0%
10%
20%
30%
40%
50%
60%
70%
80%
90%
100%
0 2 4 6 8 10 12 14Wic
ket
Gat
e O
pe
nin
g in
Pe
rce
nta
ge
Time (s)
Wicket Gate Position
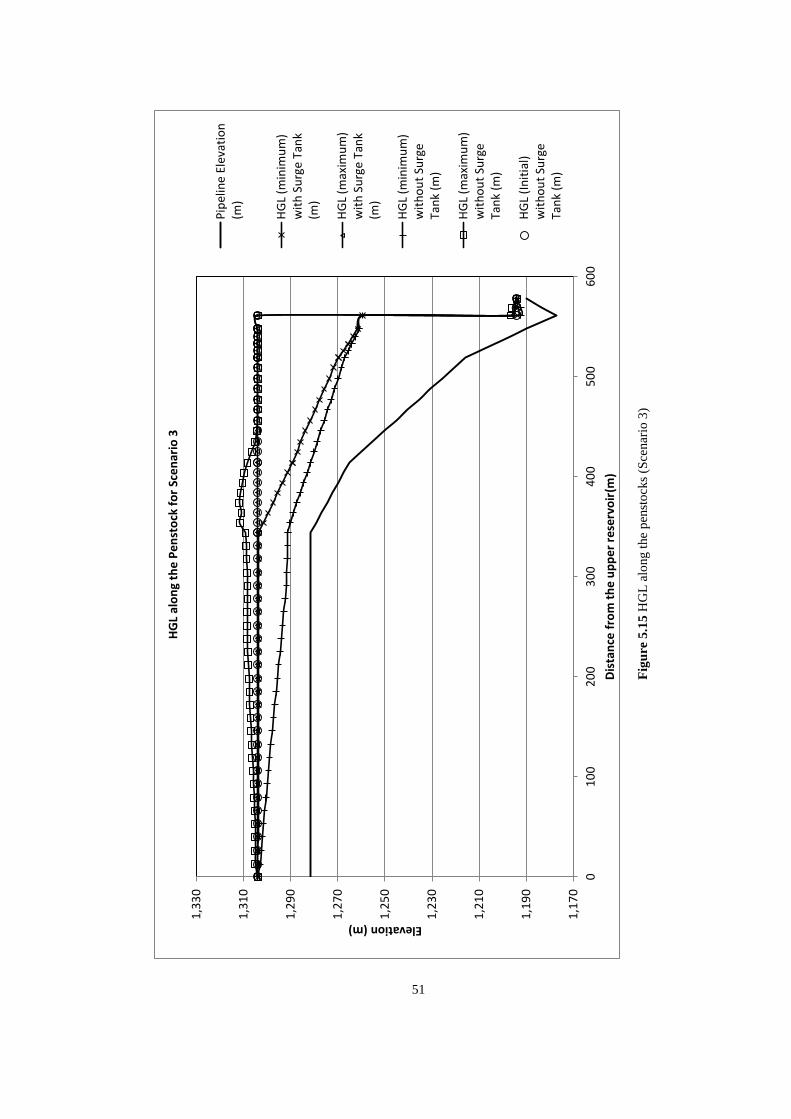
51
Fig
ure
5.1
5 H
GL
alo
ng t
he
pen
sto
cks
(Sce
nar
io 3
)
1,1
70
1,1
90
1,2
10
1,2
30
1,2
50
1,2
70
1,2
90
1,3
10
1,3
30
01
00
20
03
00
40
05
00
60
0
Elevation (m)
Dis
tan
ce f
rom
th
e u
pp
er
rese
rvo
ir(m
)
HG
L al
on
g th
e P
en
sto
ck f
or
Sce
nar
io 3
Pip
elin
e E
leva
tio
n(m
)
HG
L (m
inim
um
)w
ith
Su
rge
Tan
k(m
)
HG
L (m
axim
um
)w
ith
Su
rge
Tan
k(m
)
HG
L (m
inim
um
)w
ith
ou
t Su
rge
Tan
k (m
)
HG
L (m
axim
um
)w
ith
ou
t Su
rge
Tan
k (m
)
HG
L (I
nit
ial)
wit
ho
ut
Surg
eTa
nk
(m)
51
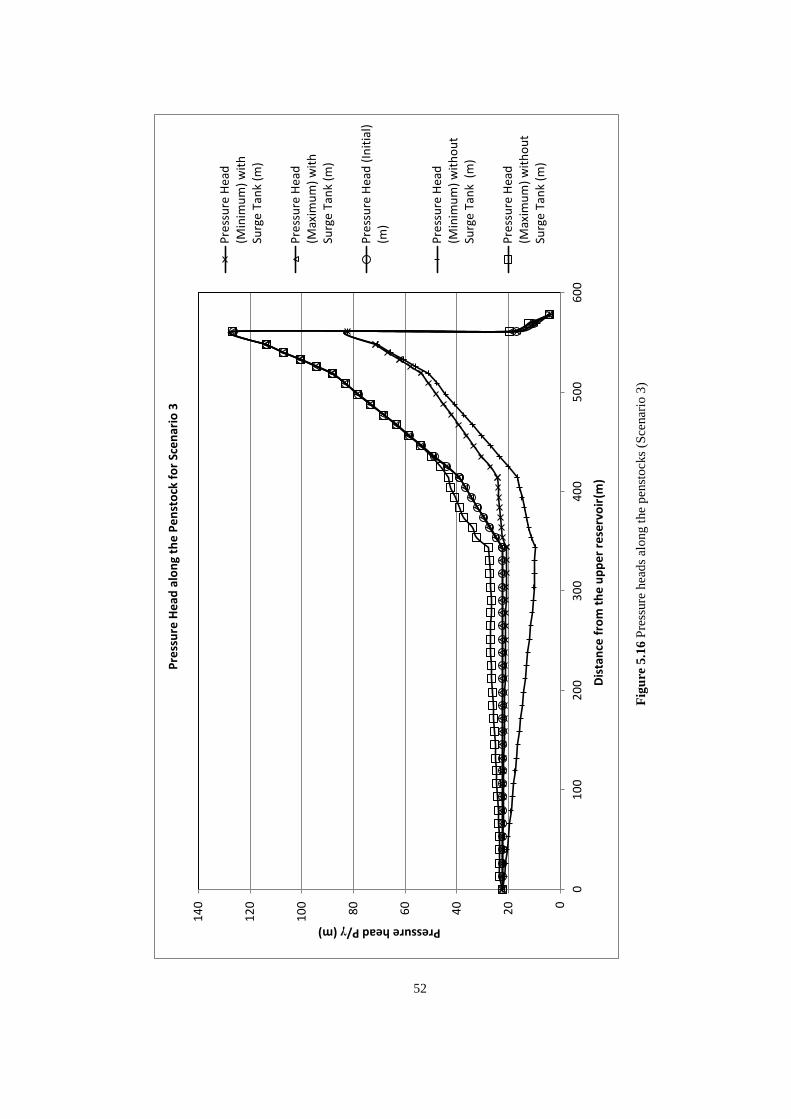
52
Fig
ure
5.1
6 P
ress
ure
hea
ds
alo
ng t
he
pen
sto
cks
(Sce
nar
io 3
)
0
20
40
60
80
10
0
12
0
14
0
01
00
20
03
00
40
05
00
60
0
Pressure head P/γ (m)
Dis
tan
ce f
rom
th
e u
pp
er
rese
rvo
ir(m
)
Pre
ssu
re H
ead
alo
ng
the
Pe
nst
ock
fo
r Sc
en
ario
3
Pre
ssu
re H
ead
(Min
imu
m)
wit
hSu
rge
Tan
k (m
)
Pre
ssu
re H
ead
(Max
imu
m)
wit
hSu
rge
Tan
k (m
)
Pre
ssu
re H
ead
(In
itia
l)(m
)
Pre
ssu
re H
ead
(Min
imu
m)
wit
ho
ut
Surg
e T
ank
(m
)
Pre
ssu
re H
ead
(Max
imu
m)
wit
ho
ut
Surg
e T
ank
(m)
52
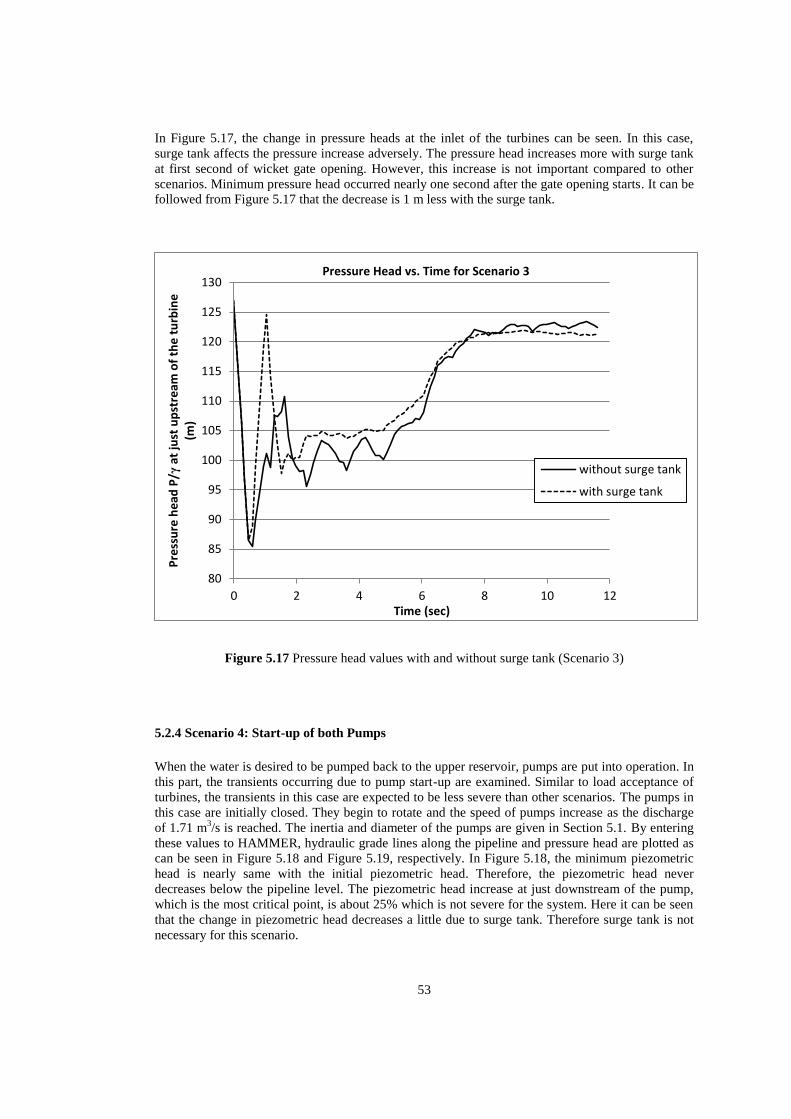
53
In Figure 5.17, the change in pressure heads at the inlet of the turbines can be seen. In this case,
surge tank affects the pressure increase adversely. The pressure head increases more with surge tank
at first second of wicket gate opening. However, this increase is not important compared to other
scenarios. Minimum pressure head occurred nearly one second after the gate opening starts. It can be
followed from Figure 5.17 that the decrease is 1 m less with the surge tank.
Figure 5.17 Pressure head values with and without surge tank (Scenario 3)
5.2.4 Scenario 4: Start-up of both Pumps
When the water is desired to be pumped back to the upper reservoir, pumps are put into operation. In
this part, the transients occurring due to pump start-up are examined. Similar to load acceptance of
turbines, the transients in this case are expected to be less severe than other scenarios. The pumps in
this case are initially closed. They begin to rotate and the speed of pumps increase as the discharge
of 1.71 m3/s is reached. The inertia and diameter of the pumps are given in Section 5.1. By entering
these values to HAMMER, hydraulic grade lines along the pipeline and pressure head are plotted as
can be seen in Figure 5.18 and Figure 5.19, respectively. In Figure 5.18, the minimum piezometric
head is nearly same with the initial piezometric head. Therefore, the piezometric head never
decreases below the pipeline level. The piezometric head increase at just downstream of the pump,
which is the most critical point, is about 25% which is not severe for the system. Here it can be seen
that the change in piezometric head decreases a little due to surge tank. Therefore surge tank is not
necessary for this scenario.
80
85
90
95
100
105
110
115
120
125
130
0 2 4 6 8 10 12
Pre
ssu
re h
ead
P/γ
at
just
up
stre
am o
f th
e t
urb
ine
(m
)
Time (sec)
Pressure Head vs. Time for Scenario 3
without surge tank
with surge tank
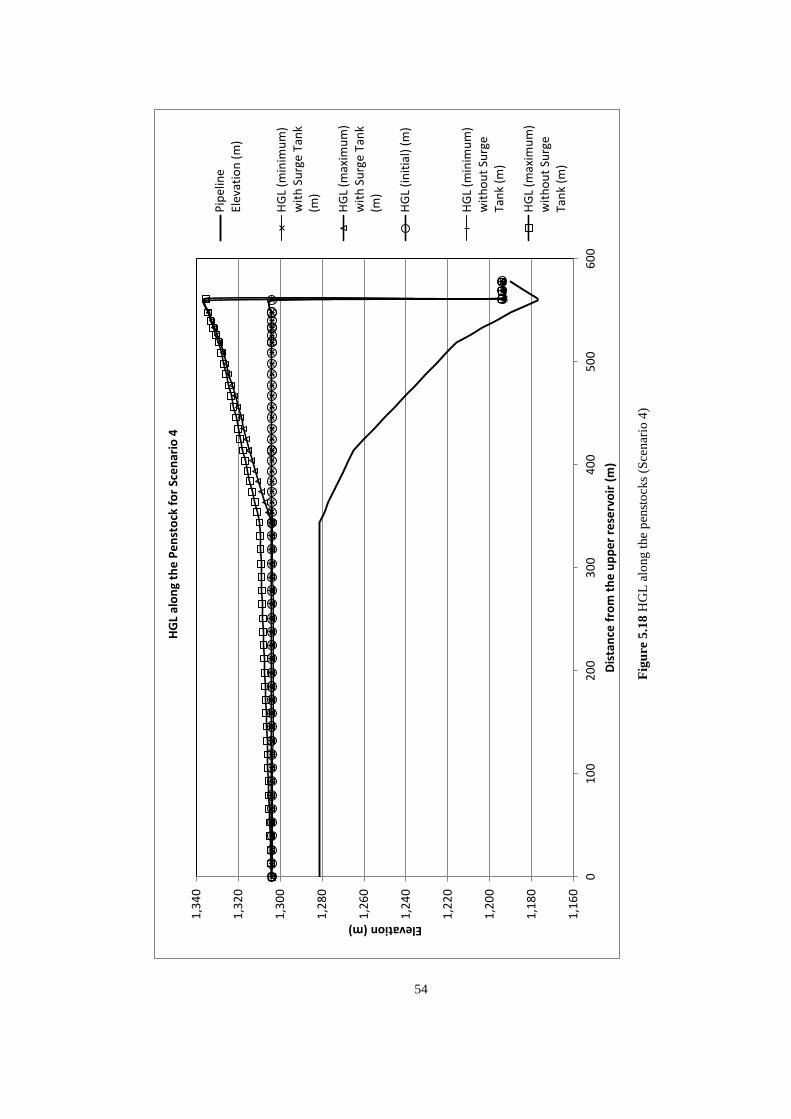
54
Fig
ure
5.1
8 H
GL
alo
ng t
he
pen
sto
cks
(Sce
nar
io 4
)
1,1
60
1,1
80
1,2
00
1,2
20
1,2
40
1,2
60
1,2
80
1,3
00
1,3
20
1,3
40
01
00
20
03
00
40
05
00
60
0
Elevation (m)
Dis
tan
ce f
rom
th
e u
pp
er
rese
rvo
ir (
m)
HG
L al
on
g th
e P
en
sto
ck f
or
Sce
nar
io 4
Pip
elin
eEl
evat
ion
(m
)
HG
L (m
inim
um
)w
ith
Su
rge
Tan
k(m
)
HG
L (m
axim
um
)w
ith
Su
rge
Tan
k(m
)
HG
L (i
nit
ial)
(m
)
HG
L (m
inim
um
)w
ith
ou
t Su
rge
Tan
k (m
)
HG
L (m
axim
um
)w
ith
ou
t Su
rge
Tan
k (m
)
54
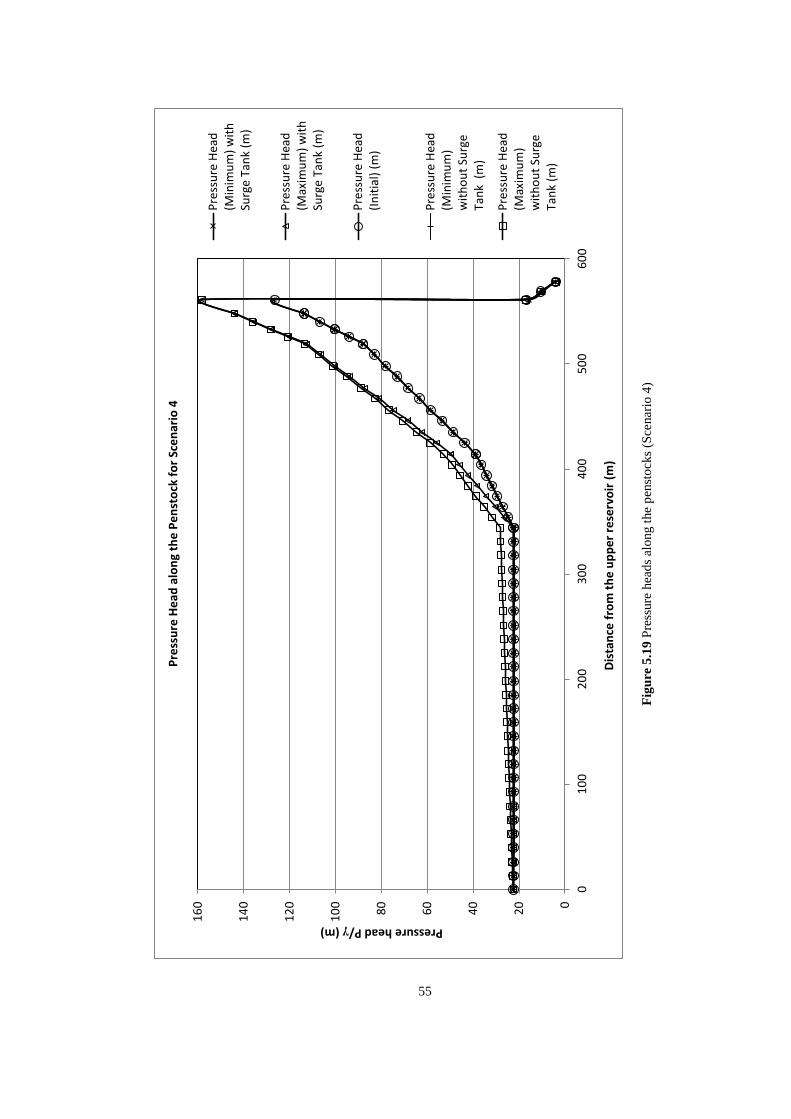
55
Fig
ure
5.1
9 P
ress
ure
hea
ds
alo
ng t
he
pen
sto
cks
(Sce
nar
io 4
)
0
20
40
60
80
10
0
12
0
14
0
16
0
01
00
20
03
00
40
05
00
60
0
Pressure head P/γ (m)
Dis
tan
ce f
rom
th
e u
pp
er
rese
rvo
ir (
m)
Pre
ssu
re H
ead
alo
ng
the
Pe
nst
ock
fo
r Sc
en
ario
4
Pre
ssu
re H
ead
(Min
imu
m)
wit
hSu
rge
Tan
k (m
)
Pre
ssu
re H
ead
(Max
imu
m)
wit
hSu
rge
Tan
k (m
)
Pre
ssu
re H
ead
(In
itia
l) (
m)
Pre
ssu
re H
ead
(Min
imu
m)
wit
ho
ut
Surg
eTa
nk
(m
)
Pre
ssu
re H
ead
(Max
imu
m)
wit
ho
ut
Surg
eTa
nk
(m)
55
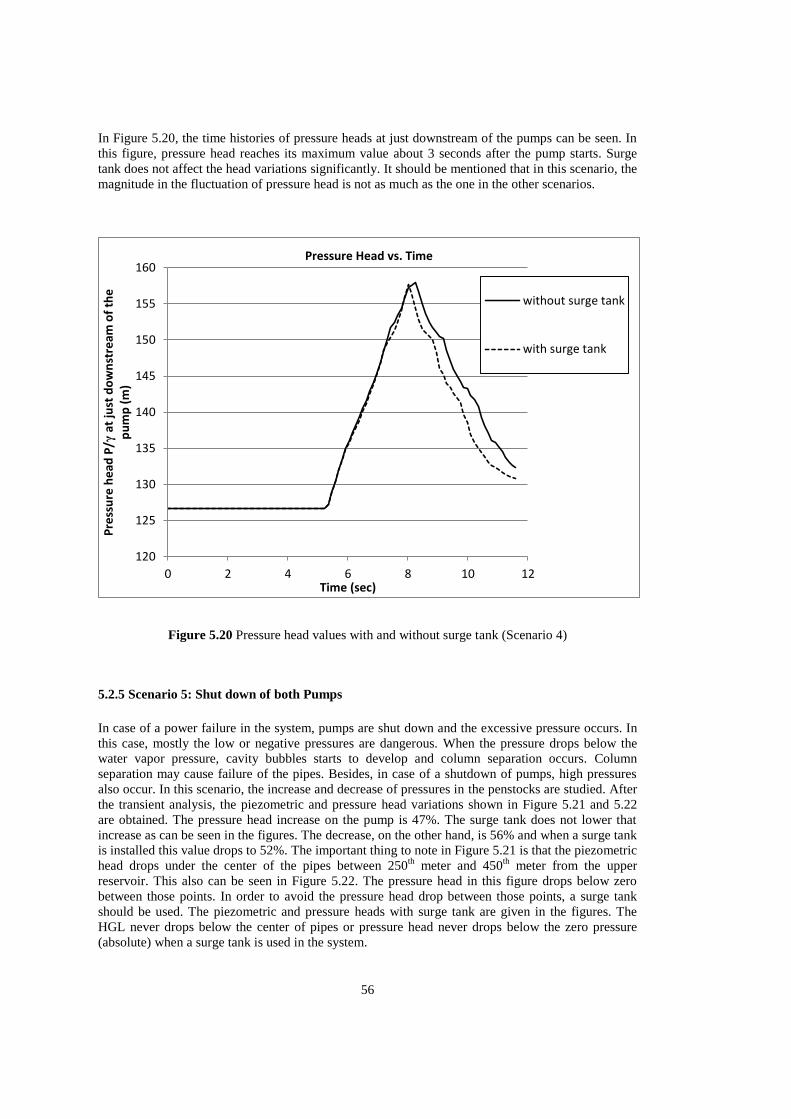
56
In Figure 5.20, the time histories of pressure heads at just downstream of the pumps can be seen. In
this figure, pressure head reaches its maximum value about 3 seconds after the pump starts. Surge
tank does not affect the head variations significantly. It should be mentioned that in this scenario, the
magnitude in the fluctuation of pressure head is not as much as the one in the other scenarios.
Figure 5.20 Pressure head values with and without surge tank (Scenario 4)
5.2.5 Scenario 5: Shut down of both Pumps
In case of a power failure in the system, pumps are shut down and the excessive pressure occurs. In
this case, mostly the low or negative pressures are dangerous. When the pressure drops below the
water vapor pressure, cavity bubbles starts to develop and column separation occurs. Column
separation may cause failure of the pipes. Besides, in case of a shutdown of pumps, high pressures
also occur. In this scenario, the increase and decrease of pressures in the penstocks are studied. After
the transient analysis, the piezometric and pressure head variations shown in Figure 5.21 and 5.22
are obtained. The pressure head increase on the pump is 47%. The surge tank does not lower that
increase as can be seen in the figures. The decrease, on the other hand, is 56% and when a surge tank
is installed this value drops to 52%. The important thing to note in Figure 5.21 is that the piezometric
head drops under the center of the pipes between 250th
meter and 450th
meter from the upper
reservoir. This also can be seen in Figure 5.22. The pressure head in this figure drops below zero
between those points. In order to avoid the pressure head drop between those points, a surge tank
should be used. The piezometric and pressure heads with surge tank are given in the figures. The
HGL never drops below the center of pipes or pressure head never drops below the zero pressure
(absolute) when a surge tank is used in the system.
120
125
130
135
140
145
150
155
160
0 2 4 6 8 10 12
Pre
ssu
re h
ead
P/γ
at
just
do
wn
stre
am o
f th
e
pu
mp
(m
)
Time (sec)
Pressure Head vs. Time
without surge tank
with surge tank
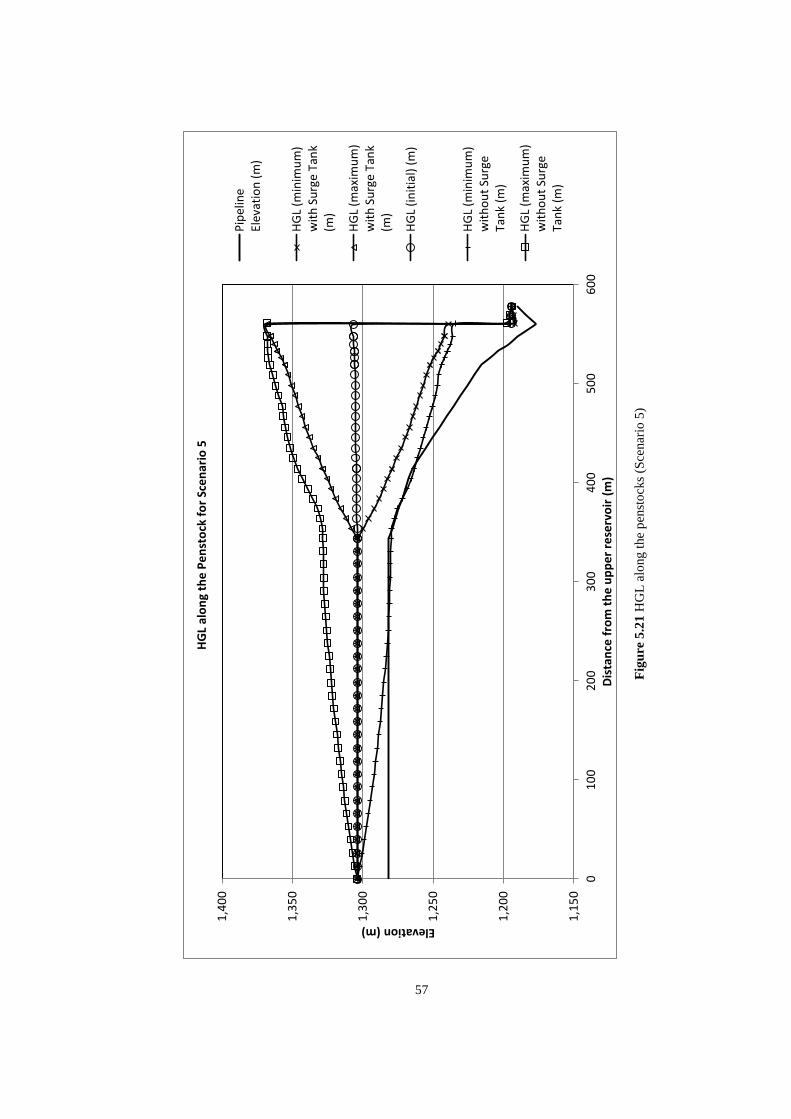
57
Fig
ure
5.2
1 H
GL
alo
ng t
he
pen
sto
cks
(Sce
nar
io 5
)
1,1
50
1,2
00
1,2
50
1,3
00
1,3
50
1,4
00
01
00
20
03
00
40
05
00
60
0
Elevation (m)
Dis
tan
ce f
rom
th
e u
pp
er
rese
rvo
ir (
m)
HG
L al
on
g th
e P
en
sto
ck f
or
Sce
nar
io 5
Pip
elin
eEl
evat
ion
(m
)
HG
L (m
inim
um
)w
ith
Su
rge
Tan
k(m
)
HG
L (m
axim
um
)w
ith
Su
rge
Tan
k(m
)
HG
L (i
nit
ial)
(m
)
HG
L (m
inim
um
)w
ith
ou
t Su
rge
Tan
k (m
)
HG
L (m
axim
um
)w
ith
ou
t Su
rge
Tan
k (m
)
57
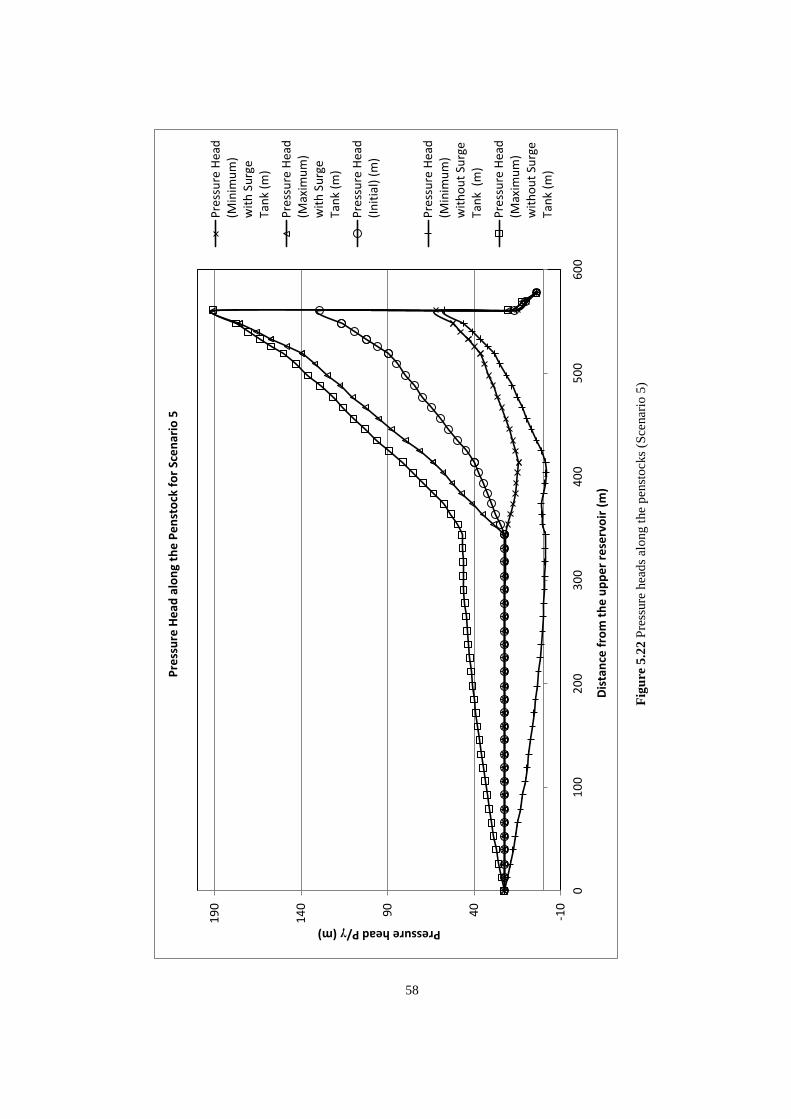
58
Fig
ure
5.2
2 P
ress
ure
hea
ds
alo
ng t
he
pen
sto
cks
(Sce
nar
io 5
)
-10
40
90
14
0
19
0
01
00
20
03
00
40
05
00
60
0
Pressure head P/γ (m)
Dis
tan
ce f
rom
th
e u
pp
er
rese
rvo
ir (
m)
Pre
ssu
re H
ead
alo
ng
the
Pe
nst
ock
fo
r Sc
en
ario
5
Pre
ssu
re H
ead
(Min
imu
m)
wit
h S
urg
eTa
nk
(m)
Pre
ssu
re H
ead
(Max
imu
m)
wit
h S
urg
eTa
nk
(m)
Pre
ssu
re H
ead
(In
itia
l) (
m)
Pre
ssu
re H
ead
(Min
imu
m)
wit
ho
ut
Surg
eTa
nk
(m
)
Pre
ssu
re H
ead
(Max
imu
m)
wit
ho
ut
Surg
eTa
nk
(m)
58
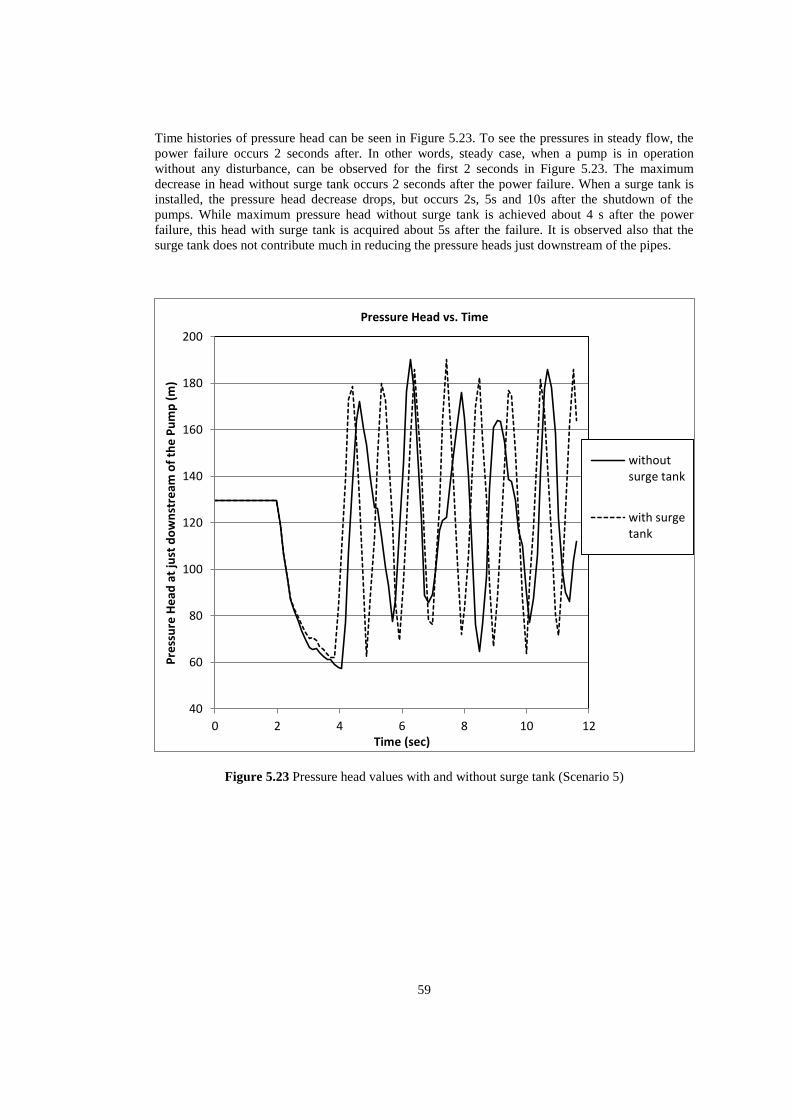
59
Time histories of pressure head can be seen in Figure 5.23. To see the pressures in steady flow, the
power failure occurs 2 seconds after. In other words, steady case, when a pump is in operation
without any disturbance, can be observed for the first 2 seconds in Figure 5.23. The maximum
decrease in head without surge tank occurs 2 seconds after the power failure. When a surge tank is
installed, the pressure head decrease drops, but occurs 2s, 5s and 10s after the shutdown of the
pumps. While maximum pressure head without surge tank is achieved about 4 s after the power
failure, this head with surge tank is acquired about 5s after the failure. It is observed also that the
surge tank does not contribute much in reducing the pressure heads just downstream of the pipes.
Figure 5.23 Pressure head values with and without surge tank (Scenario 5)
40
60
80
100
120
140
160
180
200
0 2 4 6 8 10 12
Pre
ssu
re H
ead
at
just
do
wn
stre
am o
f th
e P
um
p (
m)
Time (sec)
Pressure Head vs. Time
withoutsurge tank
with surgetank

60
5.2.6 Summary of Results
The calculations were performed for five different scenarios in this chapter. Before the calculations
made in HAMMER, it was most likely expected that the most critical scenarios would be Scenario 2
and Scenario 5. Besides, the most critical increase and decrease are expected to be at the inlet of the
turbines and at the outlet of the pumps. After the calculations, it is seen that the most critical pressure
variation occurs for the shutdown of the pumps (Scenario 5). The pressure head increase for
Scenario 5 is 47%, while this value for Scenario 2 is 44.3%. On the other hand, the pressure head
decrease for Scenario 5 is very critical. HGL drops below penstock level. Therefore, a surge tank is
necessary for this system according to Scenario 5.
The effect of the surge tank in the pressure head increase or decrease in the penstocks is also
investigated. The surge tank does not affect the maximum or minimum pressure heads so
significantly. However, as can be seen in Scenario 5, it prevents HGL to drop below the penstock
level. Here it should be noted that although the maximum pressure head drop occurs on the pump,
the pressure head drop at this point is not so critical. Surge tank is not installed for this point.
However, HGL drops below the penstock elevation just after the tunnel. For this point, installation of
a surge tank is necessary.
It should be noted that the maximum allowable pressure head for this system is 274 m. The
maximum pressure head occurs during transients is 190 m. It is obvious that the system is safe if
only the maximum pressures are taken into account.

61
CHAPTER 6
WIND-HYDRO HYBRID SYSTEMS
In this chapter, hybrid systems are discussed. Firstly, wind energy potential in Turkey is briefly
covered. Then, the properties of hybrid systems are stated. The importance of these systems is
given. Finally, a comparison between El Hierro, a hybrid plant in Spain and Yahyalı Hybrid plant is
made.
6.1 Wind Potential in Turkey
Demand for the wind power has increased in Europe similar to other renewable energies. The laws
are regulated to increase the use of wind energy systems. As a result, the use of renewable energy
has increased from 6% to 12% since 2006. The contribution of renewable energy is expected to be
20% by 2020 (Coskun, 2012). Among the renewable energy resources, wind energy has gained an
important role in the world due to the environmental advantages and the laws which encourage the
use of wind energy. Having nearly 29000 MW wind energy production, Europe previously was the
leader in energy market. However, in 2009, Asia took the lead with the great contribution of China
(Coskun, 2012).
The wind energy capacity of Turkey is one of the highest capacities in Europe. In Figure 6.1, Turkey
Wind Atlas at 100 m can be seen. According to this figure, the potential is very high in Marmara,
Aegean and East Mediterranean regions. Despite the potential, the use of wind power was 20 MW in
2005. With the Law of Renewable Energy Resources in 2005, the installed capacity was increased to
almost 150 MW just in two years. At the end of 2009, the installed wind energy capacity of Turkey
is 801 MW and the capacity is expected to be nearly 2 GW by the end of 2012 (European Wind
Energy Statistics, 2009).
Figure 6.1 Turkey Wind Atlas (Arslan, 2010)
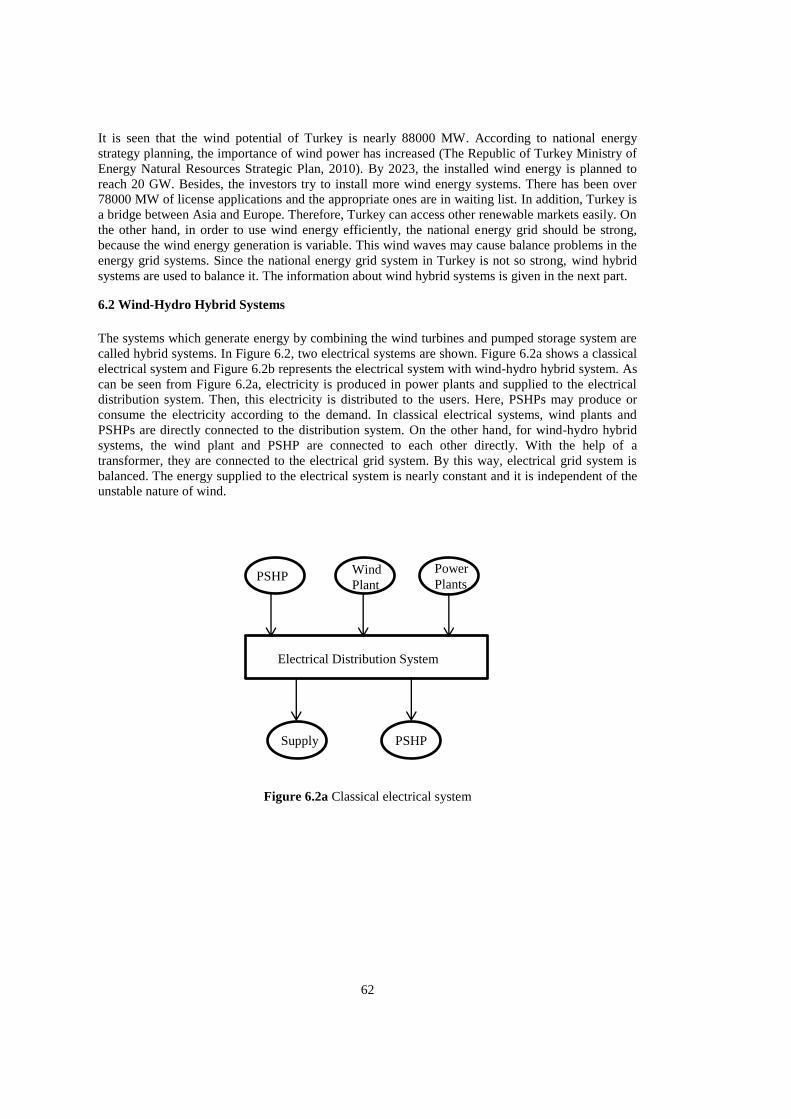
62
It is seen that the wind potential of Turkey is nearly 88000 MW. According to national energy
strategy planning, the importance of wind power has increased (The Republic of Turkey Ministry of
Energy Natural Resources Strategic Plan, 2010). By 2023, the installed wind energy is planned to
reach 20 GW. Besides, the investors try to install more wind energy systems. There has been over
78000 MW of license applications and the appropriate ones are in waiting list. In addition, Turkey is
a bridge between Asia and Europe. Therefore, Turkey can access other renewable markets easily. On
the other hand, in order to use wind energy efficiently, the national energy grid should be strong,
because the wind energy generation is variable. This wind waves may cause balance problems in the
energy grid systems. Since the national energy grid system in Turkey is not so strong, wind hybrid
systems are used to balance it. The information about wind hybrid systems is given in the next part.
6.2 Wind-Hydro Hybrid Systems
The systems which generate energy by combining the wind turbines and pumped storage system are
called hybrid systems. In Figure 6.2, two electrical systems are shown. Figure 6.2a shows a classical
electrical system and Figure 6.2b represents the electrical system with wind-hydro hybrid system. As
can be seen from Figure 6.2a, electricity is produced in power plants and supplied to the electrical
distribution system. Then, this electricity is distributed to the users. Here, PSHPs may produce or
consume the electricity according to the demand. In classical electrical systems, wind plants and
PSHPs are directly connected to the distribution system. On the other hand, for wind-hydro hybrid
systems, the wind plant and PSHP are connected to each other directly. With the help of a
transformer, they are connected to the electrical grid system. By this way, electrical grid system is
balanced. The energy supplied to the electrical system is nearly constant and it is independent of the
unstable nature of wind.
Figure 6.2a Classical electrical system
Power
Plants
Electrical Distribution System
PSHP Supply
Wind
Plant PSHP
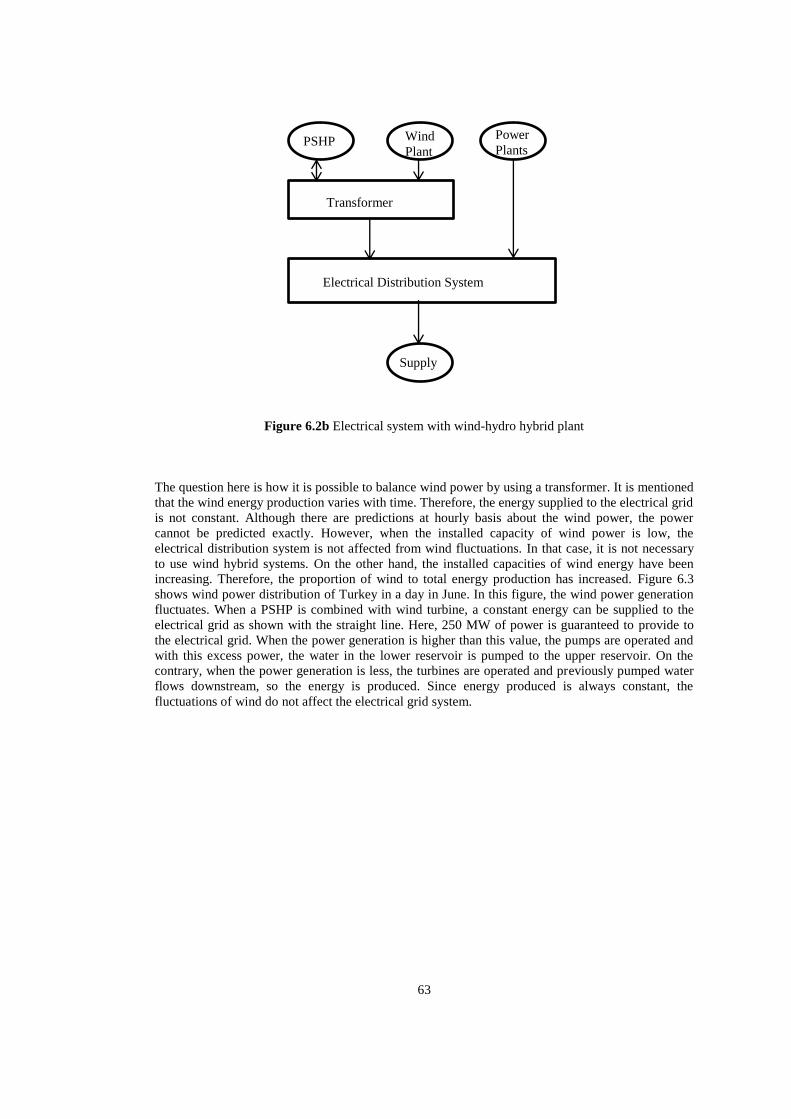
63
Figure 6.2b Electrical system with wind-hydro hybrid plant
The question here is how it is possible to balance wind power by using a transformer. It is mentioned
that the wind energy production varies with time. Therefore, the energy supplied to the electrical grid
is not constant. Although there are predictions at hourly basis about the wind power, the power
cannot be predicted exactly. However, when the installed capacity of wind power is low, the
electrical distribution system is not affected from wind fluctuations. In that case, it is not necessary
to use wind hybrid systems. On the other hand, the installed capacities of wind energy have been
increasing. Therefore, the proportion of wind to total energy production has increased. Figure 6.3
shows wind power distribution of Turkey in a day in June. In this figure, the wind power generation
fluctuates. When a PSHP is combined with wind turbine, a constant energy can be supplied to the
electrical grid as shown with the straight line. Here, 250 MW of power is guaranteed to provide to
the electrical grid. When the power generation is higher than this value, the pumps are operated and
with this excess power, the water in the lower reservoir is pumped to the upper reservoir. On the
contrary, when the power generation is less, the turbines are operated and previously pumped water
flows downstream, so the energy is produced. Since energy produced is always constant, the
fluctuations of wind do not affect the electrical grid system.
Supply
Electrical Distribution System
PSHP Power
Plants Wind
Plant
Transformer
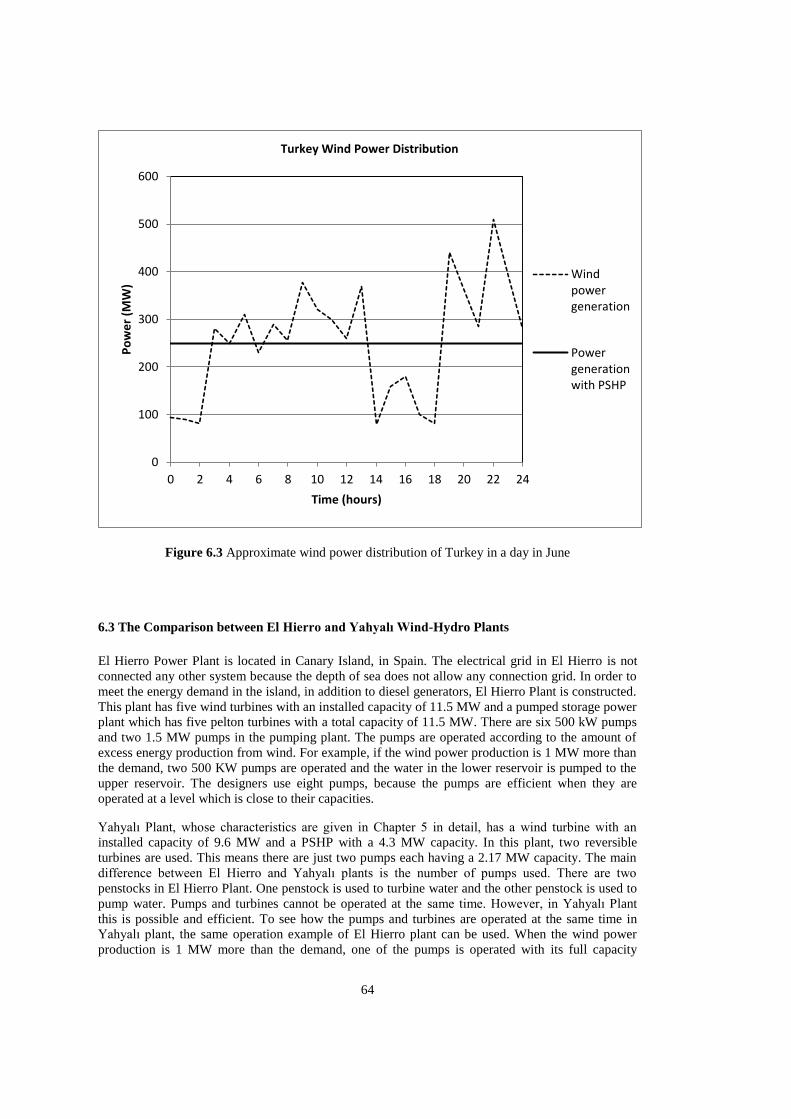
64
Figure 6.3 Approximate wind power distribution of Turkey in a day in June
6.3 The Comparison between El Hierro and Yahyalı Wind-Hydro Plants
El Hierro Power Plant is located in Canary Island, in Spain. The electrical grid in El Hierro is not
connected any other system because the depth of sea does not allow any connection grid. In order to
meet the energy demand in the island, in addition to diesel generators, El Hierro Plant is constructed.
This plant has five wind turbines with an installed capacity of 11.5 MW and a pumped storage power
plant which has five pelton turbines with a total capacity of 11.5 MW. There are six 500 kW pumps
and two 1.5 MW pumps in the pumping plant. The pumps are operated according to the amount of
excess energy production from wind. For example, if the wind power production is 1 MW more than
the demand, two 500 KW pumps are operated and the water in the lower reservoir is pumped to the
upper reservoir. The designers use eight pumps, because the pumps are efficient when they are
operated at a level which is close to their capacities.
Yahyalı Plant, whose characteristics are given in Chapter 5 in detail, has a wind turbine with an
installed capacity of 9.6 MW and a PSHP with a 4.3 MW capacity. In this plant, two reversible
turbines are used. This means there are just two pumps each having a 2.17 MW capacity. The main
difference between El Hierro and Yahyalı plants is the number of pumps used. There are two
penstocks in El Hierro Plant. One penstock is used to turbine water and the other penstock is used to
pump water. Pumps and turbines cannot be operated at the same time. However, in Yahyalı Plant
this is possible and efficient. To see how the pumps and turbines are operated at the same time in
Yahyalı plant, the same operation example of El Hierro plant can be used. When the wind power
production is 1 MW more than the demand, one of the pumps is operated with its full capacity
0
100
200
300
400
500
600
0 2 4 6 8 10 12 14 16 18 20 22 24
Po
we
r (M
W)
Time (hours)
Turkey Wind Power Distribution
Windpowergeneration
Powergenerationwith PSHP
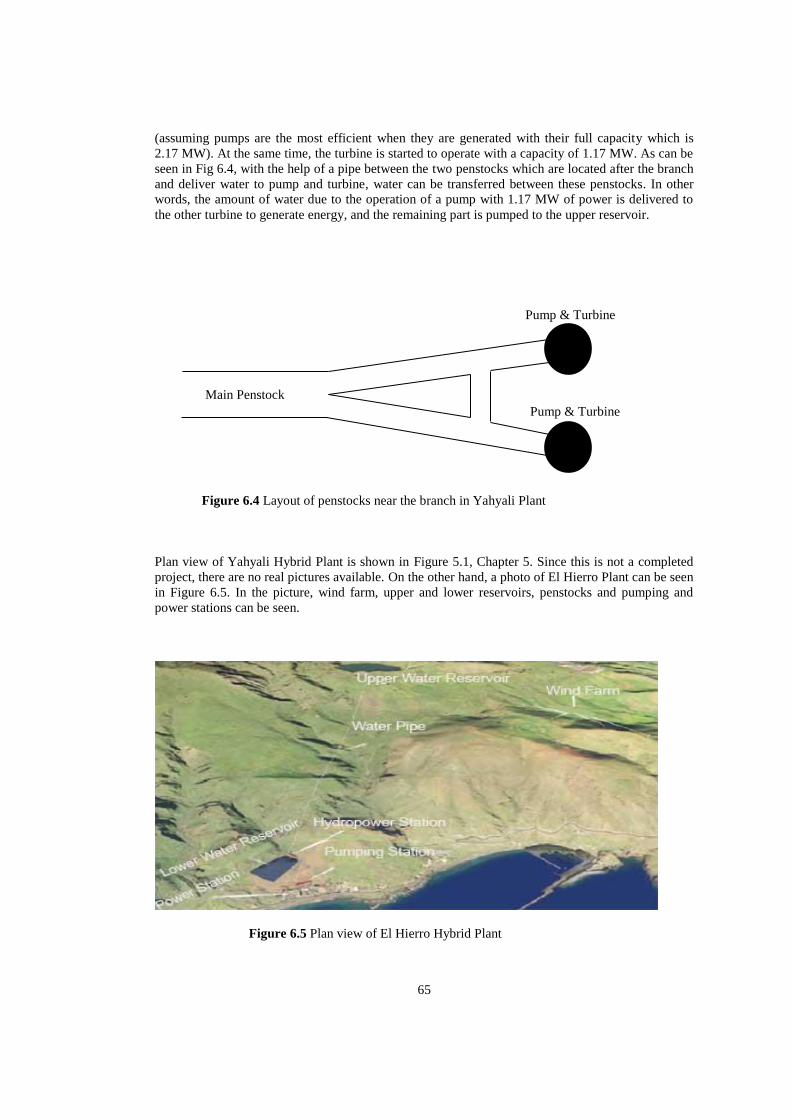
65
(assuming pumps are the most efficient when they are generated with their full capacity which is
2.17 MW). At the same time, the turbine is started to operate with a capacity of 1.17 MW. As can be
seen in Fig 6.4, with the help of a pipe between the two penstocks which are located after the branch
and deliver water to pump and turbine, water can be transferred between these penstocks. In other
words, the amount of water due to the operation of a pump with 1.17 MW of power is delivered to
the other turbine to generate energy, and the remaining part is pumped to the upper reservoir.
Figure 6.4 Layout of penstocks near the branch in Yahyali Plant
Plan view of Yahyali Hybrid Plant is shown in Figure 5.1, Chapter 5. Since this is not a completed
project, there are no real pictures available. On the other hand, a photo of El Hierro Plant can be seen
in Figure 6.5. In the picture, wind farm, upper and lower reservoirs, penstocks and pumping and
power stations can be seen.
Figure 6.5 Plan view of El Hierro Hybrid Plant
Main Penstock
Pump & Turbine
Pump & Turbine

66
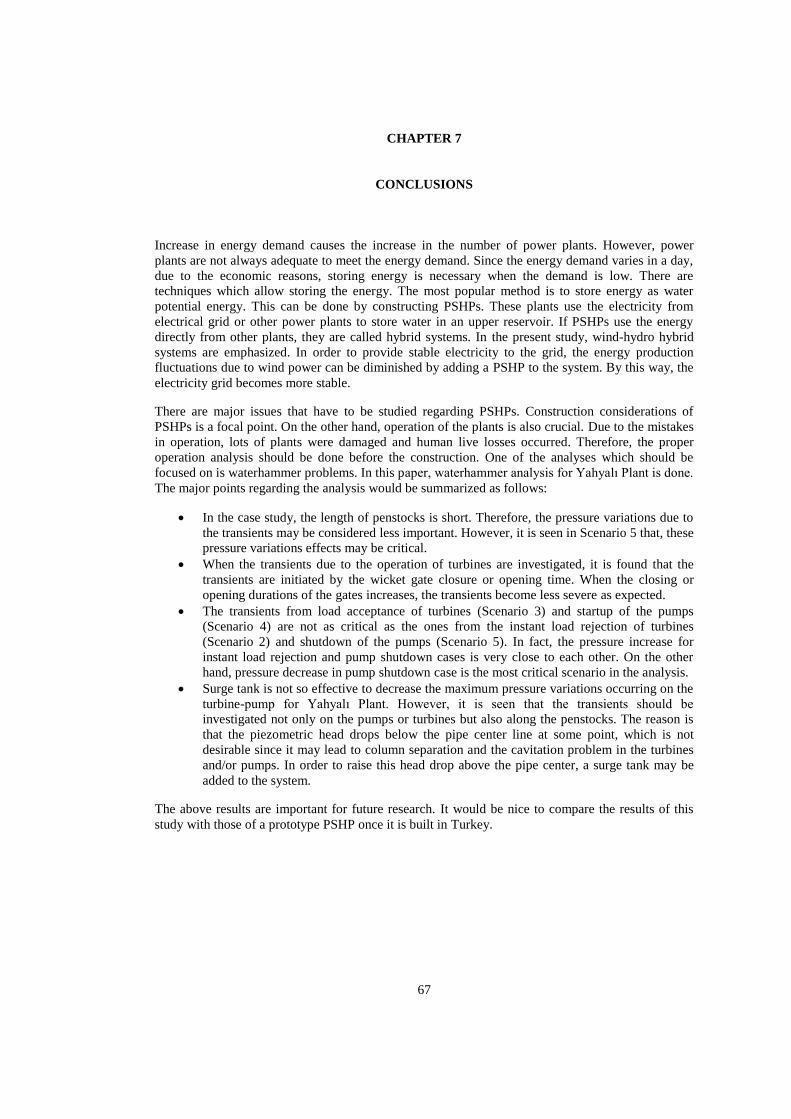
67
CHAPTER 7
CONCLUSIONS
Increase in energy demand causes the increase in the number of power plants. However, power
plants are not always adequate to meet the energy demand. Since the energy demand varies in a day,
due to the economic reasons, storing energy is necessary when the demand is low. There are
techniques which allow storing the energy. The most popular method is to store energy as water
potential energy. This can be done by constructing PSHPs. These plants use the electricity from
electrical grid or other power plants to store water in an upper reservoir. If PSHPs use the energy
directly from other plants, they are called hybrid systems. In the present study, wind-hydro hybrid
systems are emphasized. In order to provide stable electricity to the grid, the energy production
fluctuations due to wind power can be diminished by adding a PSHP to the system. By this way, the
electricity grid becomes more stable.
There are major issues that have to be studied regarding PSHPs. Construction considerations of
PSHPs is a focal point. On the other hand, operation of the plants is also crucial. Due to the mistakes
in operation, lots of plants were damaged and human live losses occurred. Therefore, the proper
operation analysis should be done before the construction. One of the analyses which should be
focused on is waterhammer problems. In this paper, waterhammer analysis for Yahyalı Plant is done.
The major points regarding the analysis would be summarized as follows:
In the case study, the length of penstocks is short. Therefore, the pressure variations due to
the transients may be considered less important. However, it is seen in Scenario 5 that, these
pressure variations effects may be critical.
When the transients due to the operation of turbines are investigated, it is found that the
transients are initiated by the wicket gate closure or opening time. When the closing or
opening durations of the gates increases, the transients become less severe as expected.
The transients from load acceptance of turbines (Scenario 3) and startup of the pumps
(Scenario 4) are not as critical as the ones from the instant load rejection of turbines
(Scenario 2) and shutdown of the pumps (Scenario 5). In fact, the pressure increase for
instant load rejection and pump shutdown cases is very close to each other. On the other
hand, pressure decrease in pump shutdown case is the most critical scenario in the analysis.
Surge tank is not so effective to decrease the maximum pressure variations occurring on the
turbine-pump for Yahyalı Plant. However, it is seen that the transients should be
investigated not only on the pumps or turbines but also along the penstocks. The reason is
that the piezometric head drops below the pipe center line at some point, which is not
desirable since it may lead to column separation and the cavitation problem in the turbines
and/or pumps. In order to raise this head drop above the pipe center, a surge tank may be
added to the system.
The above results are important for future research. It would be nice to compare the results of this
study with those of a prototype PSHP once it is built in Turkey.

68
69
REFERENCES
Allen, A. E. (1977). Potential for Conventional and Underground Pumped-Storage. IEEE
Transactions on Power Apparatus and Systems, Vol. PAS-96, No. 3.
Aoki, K. Satoh, T. Itoh, M. Ichimori, and T. Masegi, K. (1987). Unit Commitment in a Large-Scale
Power System Including Fuel Constrained Thermal and Pumped-Storage Hydro
Arslan, O. (2010). Technoeconomic Analysis of Electricity Generation from Wind Energy in
Kutahya, Turkey. Elsevier, Vol. 35, Issue 4, 120-131.
Chaudry, M. H. (1987). Applied Hydraulic Transients. New York: Van Nostrand Reinhold Company
Limited.
Cohen, I. A. and Wan, S. H. (1985). An Algorithm for Scheduling a Large Pumped Storage Plant.
IEEE Transactions on Power Apparatus and Systems, Vol. PAS-104, No. 8.
Coskun, A.A. and Türker, Ö.Y. (2012). Wind Energy and Turkey. Environ Monit Assess, 184:1265–
1273
Deane, J. P. Gallachoir, B. P. and McKeogh, E. J. (2009). Techno-economic Review of Existing and
New Pumped Hydro Energy Storage Plant. Renewable and Sustainable Energy Reviews, 14, 1293-
1302.
Dursun, B. and Alboyaci, B. (2010). The contribution of Wind-Hydro Pumped-Storage Systems in
Meeting Turkey's Electric Energy Demand. Renewable and Sustainable Energy Reviews, Vol.14,
Issue 7, 1978-1988.
Fu, Q. Yin,X. Luo, H. and Li, Z. (2010). Research on Overload Protection Inverse Time
Characteristic for Pumped Storage Generator-motors. IEEE, Vol. 7, Issue 11.
Hughes, C.T. and Macwilliam, C.M. (1958). America's First Pumped-Storage Hydro Plant: 28 Years'
Operating Experience. Power Apparatus and Systems, Part III. Transactions of the American
Institute of Electrical Engineers.
Gibson, W. L. (1965). International Symposium on Waterhammer in Pumped Storage Projects. New
York: N. Y. 10017.
Gonzalez, J. G. Muela, R. M. R. Santos, L. M. and Gonzalez, A. M. (2008). Stochastic Joint
Optimization of Wind Generation and Pumped-Storage Units in an Electricity Market. IEEE
transactions on power systems, Vol. 23, No. 2.
Hammons, T.J. (1970). Starting methods for generator/motor units employed in pumped-storage
stations. Glasgow: Electrical Engineers, Proceedings of the Institution of
Kuwabara, T. Shibuya, A. Furuta, H. Kita, E. and Mitsuhashi, K. (1996). Design and Dynamic
Response Characterıstics of 400 MW Adjustable Speed Pumped Storage Unit for Ohkawachi Power
Station. IEEE Transactions on Energy Conversion, Vol. 11, No. 2.
Pickard, W. F. (2011). The History, Present State, and Future Prospects of Underground Pumped
Hydro for Massive Energy Storage. IEEE, Vol.20, Issue2.
Roth, H.H. (1958). Electrical Requirements of Reversible Pumped-Storage Units. Power Apparatus
and Systems, Part III. Transactions of the American Institute of Electrical Engineers.

70
Simond, J. Sapin, A. and Schafer, D. (1999). Expected benefits of adjustable speed pumped storage
in the European Network. SIMSEN General Presentation
Song, S. Han, X. and Yu, D. (2011). Impacts of pumped storage power station on large scale wind
power integration into grid. IEEE, Vol.2, Issue 11.
The Republic of Turkey Ministry of Energy and Natural Resources (2010). The Republic of Turkey
Ministry of Energy and Natural Resources Strategic Plan. Retrieved from
http://www.enerji.gov.tr/yayinlar_raporlar_EN/ETKB_2010_2014_Stratejik_Plani_EN.pdf9
The Worlds of David Darling (2012). Francis Turbine. Retrieved September 08, 2012 from:
http://www.daviddarling.info/encyclopedia/F/AE_Francis_turbine.html
Wikipedia (2012). Pumped Storage Hydroelectricity. Retrieved August 05,2012 from:
http://en.wikipedia.org/wiki/Pumped-storage_hydroelectricity
Wylie, E.B. (1994). Fundamental Equations of Waterhammer. Journal of Hydraulic Engineering,
ASCE, 539-542.
Yanagisawa, T. Kageyama, T. Okamure, K. Kusunoki,K. Taguchi, T. Abe, M. and Kaneko, H.
(1996). Transient Analysis of Converter-Fed Adjustable-Speed Generator- Motor for the Pumped
Storage Power Plant. Electrical Engineering in Japan, Vol. 116, No. 2.
Yang, C. (2010). Pumped Hydroelectric Storage. Renewable and Sustainable Energy Reviews,
Vol.15, Issue 1, Pages 839-844.
Yildiz, K. (1992). Hidroelektrik Santraller Hesap Esaslari ve Projelendirilmesi. Ankara: Devlet Su
Isleri Print.