Investigating correlations between crack width, corrosion...
30
1 Investigating Correlations between Crack Width, Corrosion Level and Anchorage Capacity Tahershamsi, Mohammad 1 ; Fernandez, Ignasi 1,3 ; Lundgren, Karin 1 ; Zandi, Kamyab 1,2 1 Department of Civil and Environmental Engineering, Division of Structural Engineering, Concrete Structures, Chalmers University of Technology, 412 96, Gothenburg, Sweden 2 Material Group, CBI Swedish Cement and Concrete Research Institute, 501 15, Borås, Sweden 3 Corresponding author: [email protected] Published in Structure and Infrastructure Engineering, published online 27 Dec 2016 http://dx.doi.org/10.1080/15732479.2016.1263673
Transcript of Investigating correlations between crack width, corrosion...

1
Investigating Correlations between
Crack Width, Corrosion Level and Anchorage Capacity
Tahershamsi, Mohammad1; Fernandez, Ignasi1,3; Lundgren, Karin1; Zandi, Kamyab1,2
1 Department of Civil and Environmental Engineering, Division of Structural Engineering, Concrete Structures, Chalmers University of Technology, 412 96, Gothenburg, Sweden
2 Material Group, CBI Swedish Cement and Concrete Research Institute, 501 15, Borås, Sweden
3 Corresponding author: [email protected]
Published in Structure and Infrastructure Engineering, published online 27 Dec 2016 http://dx.doi.org/10.1080/15732479.2016.1263673
2
Investigating Correlations between
Crack Width, Corrosion Level and Anchorage Capacity
Tahershamsi, Mohammad1; Fernandez, Ignasi1,3; Lundgren, Karin1; Zandi, Kamyab1,2
1 Department of Civil and Environmental Engineering, Division of Structural Engineering, Concrete Structures, Chalmers University of Technology, 412 96, Gothenburg, Sweden
2 Material Group, CBI Swedish Cement and Concrete Research Institute, 501 15, Borås, Sweden
3 Corresponding author: [email protected]
Keywords: Natural corrosion, inspection, bond, anchorage, crack width, pitting corrosion, 3D optical scanning
Highlights
• Steel reinforcement corrosion level characterized through optical 3D scanning
• Relations between corrosion induced crack and corrosion level
• Relations between average bond, corrosion induced crack width and corrosion level
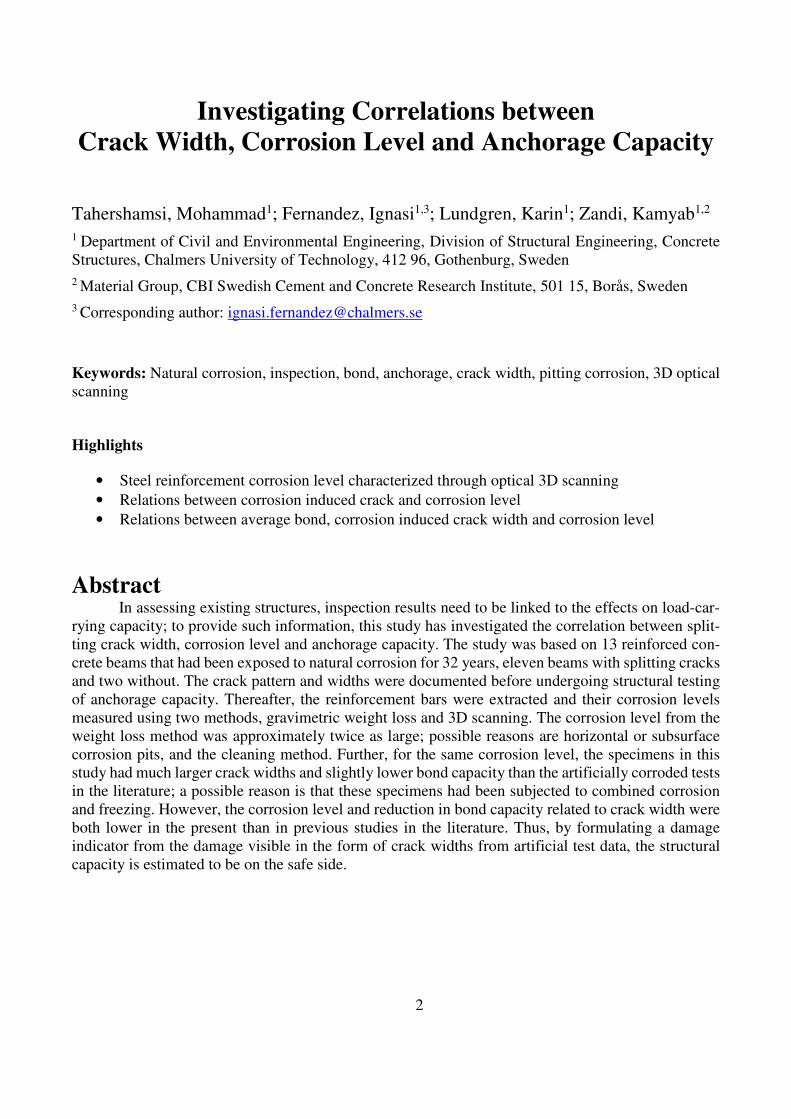
Abstract In assessing existing structures, inspection results need to be linked to the effects on load-car-
rying capacity; to provide such information, this study has investigated the correlation between split-ting crack width, corrosion level and anchorage capacity. The study was based on 13 reinforced con-crete beams that had been exposed to natural corrosion for 32 years, eleven beams with splitting cracks and two without. The crack pattern and widths were documented before undergoing structural testing of anchorage capacity. Thereafter, the reinforcement bars were extracted and their corrosion levels measured using two methods, gravimetric weight loss and 3D scanning. The corrosion level from the weight loss method was approximately twice as large; possible reasons are horizontal or subsurface corrosion pits, and the cleaning method. Further, for the same corrosion level, the specimens in this study had much larger crack widths and slightly lower bond capacity than the artificially corroded tests in the literature; a possible reason is that these specimens had been subjected to combined corrosion and freezing. However, the corrosion level and reduction in bond capacity related to crack width were both lower in the present than in previous studies in the literature. Thus, by formulating a damage indicator from the damage visible in the form of crack widths from artificial test data, the structural capacity is estimated to be on the safe side.

3
1 Introduction Corrosion of reinforcement is commonly agreed to be the primary cause of degradation in re-
inforced concrete (RC) structures exposed to aggressive environments (Almusallam & Al-gahtani, 1996; Cabrera, 1996; Azad, Ahmad & Azher, 2007; Bertolini, 2008; Lundgren, 2007; Sistonen, Cwirzen & Puttonen, 2008). This causes high costs in developed countries; as an example, the average annual cost to repair and replace conventional reinforced and prestressed concrete highway bridges specifically owing to corrosion damage was more than $6.3 billion already fifteen years ago in the US (Koch, Brongers, Thompson, Virmani & Payer, 2002); Yunovich, Yunovich, Balvanyos & Lave, 2001). Reinforcement corrosion not only reduces the cross sectional area and ductility of the steel rebar in RC structures (Almusallam, 2001); Du, Clark & Chan, 2005; Fernandez, Bairán & Marí, 2015; Fernandez, Bairán, & Marí, 2016) but it also induces cracking, delamination and spalling of the sur-rounding concrete caused by the expansion of the corrosion products (Al-Sulaimani, Kaleemullah, Basunbul & Rasheeduzzafar, 1990; Dang & François, 2013; Sæther, 2010; Val, Stewart & Melchers, 1998). The expansion of corrosion products also affects steel-concrete bond properties (Lundgren, 2007). Therefore, corrosion may to a great extent decrease the service life of RC structures. Many research studies have been focusing on the relationship between the degree of corrosion of steel reinforcement bars and the load-carrying capacity of corresponding RC elements (Azad et al., 2007; Cairns & Millard, 1999; Dang & François, 2014; Law, Du, Cairns, 2008; Sæther, 2011; Zandi Hanjari, 2010; Zhu & François, 2016); Fernandez, Herrador, Marí, & Bairán, 2016), and several empirical, analytical and numerical models relating corrosion level to load-carrying capacity have been devel-oped (Wang & Liu, 2004; Berra, Castellani, Coronelli, Zanni & Zhang, 2003; Lee, Noguchi & Tomosawa, 2002; Bhargava, Ghosh, Mori & Ramanujam, 2008; Lundgren, 2005; Biondini & Vergani, 2014). However, since corrosion levels cannot be easily measured in existing structures, these models do not yet have any direct practical application. Traditionally, some non-destructive test methods, such as half-cell potential and corrosion rate measurements, are used to predict the corrosion condition in practice in existing RC structures (Andrade & Alonso, 2004; Tang & Malmberg, 2006). These non-destructive methods can predict the potential existence of corrosion damage below the concrete surface (Frolund & Sorense, 2007), but not the actual corrosion level.
Given the fact that cracking, as the first sign of deterioration in RC structures, is mostly detected through visual inspection, simplified models are needed to correlate cracking to structural strength. A general framework for such an approach has been proposed in CEB (1998), in which the intensity of damage, defined by damage indicators, is correlated with structural performance. Application of the method to corroded RC structures, e.g. Coronelli (2006) and Folić and Zenunović (2010), illustrated the practical significance of these simplified approaches. However, a major drawback is that when the level of corrosion attack is not known in advance, predictions that are too conservative may occur, Coronelli (2007).
Recent studies have investigated the correlation between the corrosion attack and the spalling crack opening. In a study by Yu, François, Hiep, Hostis and Gagné (2015), a fairly good correlation was found between the maximum corrosion crack width and the average cross-sectional loss of the reinforcement bar. In another research study by Andrade, Cesetti, Mancini and Tondolo (2016), the influence of fundamental parameters such as concrete strength and cover to bar diameter have been considered and correlation functions have been proposed. The correlation functions proposed by Andrade et al. (2016) were based on test results of artificially corroded experiments exposed to low corrosion rates.
A major disadvantage of nearly all-contemporary research available on the subject is that it is based on artificially corroded specimens; consequently, specimens had been subjected to an acceler-ated corrosion process by the application of electric current, or exposing the specimens to wetting and

4
drying cycles and adding chloride salts. There are several uncertainties concerning how well these findings corresponds to corrosion taking place in existing structures; e.g. the effect of creep and if similar corrosion products are formed. In accelerated corrosion tests using the electric current, the test specimens can be wholly or partially submerged in salt water solutions or be sprayed by the solutions. Submerging the specimens tend to restrict the availability of oxygen and the corrosion products and the generated expansive forces may thus differ from test specimens subjected to wetting and drying cycles (fib Bulletin 10, 2000). It has also been observed that the current density applied to accelerated corrosion exerts a significant influence on the amount of corrosion products and the influence on bond strength between reinforcement and the concrete (Clark & Saifullah, 1994). Furthermore, Zandi Hanjari (2010) showed that rust could flow through cracks; this effect becomes significant when wide cracks are developing and the corrosion rate is low, such as for natural corrosion.
The research presented in this paper addresses the aforementioned issue by using samples of naturally corroded steel reinforcement bars. In this study, the corrosion level was measured both by the gravimetric weight loss method, and in greater detail by using an advanced 3D optical scanning method, enabling the study of corrosion patterns in the reinforcement bars. These results were com-bined with inspection results, such as splitting crack widths, to find potential correlations. Furthermore, the possible relation between splitting cracks widths and anchorage capacity was investigated. The results were compared to available test results of artificial corrosion and the recently proposed corre-lation factors by Andrade et al. (2016).
2 Methods
2.1 Specimen description Specimens were taken from the edge beam of a girder bridge built in 1979-81, the Stallbacka
Bridge in Sweden. The edge beams along the bridge deck showed varying extents of damage owing to de-icing salt and freezing. Twenty-one reinforced concrete beams had in an earlier study been loaded in four-point bending with suspended supports, leading to anchorage failure by splitting induced pull-out in all tested specimens. The beams were classified into three damage classes: Reference (R), with no visible surface cracking; Medium damaged (M) with splitting cracks but no spalling; and Highly-damaged (H) with both cracking and spalling of concrete cover; more information is provided in Tahershamsi, Zandi, Lundgren and Plos (2014) and Lundgren, Tahershamsi, Zandi and Plos (2015). In Figure 1 some details of the tested specimens and the used test setup are provided. Table 1 gives detailed information of the concrete covers as well as the compressive strength for each specimen.

5
Figure 1. Test setup and specimen description
Table 1. Size of the concrete covers in the failure region of the tested specimen.
Spec-
imen
Concrete covers fc [MPa] ca cb cc cd
R4 45 65 45 45 52.4 R6 50 40 65 50 51.2
M4 30 65 70 45 50.6 M5 55 65 55 50 42.6 M7 75 55 35 65 53.6
M8 45 45 50 40 44.8 M9 55 55 45 50 46.4 M10 50 55 45 60 44.2
M11 50 50 80 55 40.9 M12 60 50 40 60 50.0 H5 50 50 60 30 41.8
H6 35 70 60 55 40.5 H7 30 70 65 50 52.4
After the tests, four tensile reinforcement bars were extracted from each of the beams (two bundles with two bars in each); see Figure 2. The reinforcement extracted had two different rib pat-
terns, skewed and straight ribs. All the specimens were cut into a suitable length of 580±0.5 mm using a precision cutting machine. The anchorage length measured after the beams testing was always within the chosen bar length with the purpose to evaluate the corrosion level in the anchorage region. Photos of the reinforcement bars before and after cleaning are shown in Figure 3. Thirteen out of twenty-one beams were selected for this study, those on which 3D scanning of the reinforcement bars were per-formed.

6
(a) (b)
Figure 2. (a) Scheme of a damaged reinforced concrete specimen taken from Stallbacka Bridge (b) scheme of
the extracted steel reinforcements and the 3D scanned parts
(a) (b)
Figure 3. (a) Extracted steel reinforcements before cutting and cleaning from specimen H6, bars closest to the
side covers and bottom covers were denoted External and Internal bars, respectively (b) Extracted
steel rebars cut from the anchorage zones after cleaning with two different rib patterns: skewed (M10)
and straight (H5)
2.2 Corrosion level measurements The tensile reinforcement bars were extracted from the concrete members after structural test-
ing of the beams. The end parts of the bars where the anchorage failure took place were cut into
580±0.5 mm long pieces. The bars were cleaned by wire bristle brushes following the ASTM Standard G1 (2011) code recommendations and thereafter weighted and scanned by using 3D optical scanning technique.
2.2.1 Gravimetric measurements
The corrosion loss for each bar was calculated using the average weight of the non-corroded reinforcement bars from the reference specimens as reference. The reason for this choice was that the initial weight of each bar before corrosion was missing; naturally, the bars had not been weighed before they were placed into the bridge. As mentioned, the reinforcement bars had ribs of two types. Thus, reinforcement bars with straight and skewed ribs without any signs of corrosion were cut, cleaned and weighed; 14 respectively 11 uncorroded bars from different tested beams were used as references.

7
These measurements were done using a scale accurate to 0.1g and had standard deviations of σ=±0.51% and σ=±0.75% for bars with straight and skewed ribs, respectively. The average values obtained were assumed to be uncorroded reference specimens for the calculation of the corrosion level of the other specimens. Thereafter, the corrosion levels reported in Table 2 were calculated using the weight loss obtained with respect to the aforementioned reference values and consequently they are subjected to the same deviations. In the same table, these values are compared with the measurements obtained using 3D scanning with the post-processing method presented in next section. The differences are further discussed in Section 2.2.3.

8
Table 2. Average corrosion level expressed in percentage (%) of full bar length from each specimen. Splitting
cracks were in all cases along Bundle 2 – External bar.
Specimen
Bundle 1 Bundle 2
Internal bar External bar Internal bar External bar
Weight loss 3D
scanning Weight loss
3D scan-ning
Weight loss 3D scan-
ning Weight loss
M4 0.00 0.02 0.30 0.54 3.40 0.81 7.50
M5 0.42 0.04 0.06 0.30 2.62 1.90 4.00
M7 0.49 0.08 0.35 0.09 1.81 0.77 5.98
M8 0.00 0.02 0.20 0.10 0.60 0.32 2.20
M9 0.40 0.31 0.90 0.14 0.70 -0.02 0.80
M10 -0.10 0.00 -0.20 0.07 2.80 1.09 7.20
M11 0.50 0.02 0.60 0.17 7.60 6.29 9.60
M12 -0.30 -0.12 -0.20 0.08 2.90 0.96 6.80
H5 1.30 0.62 1.30 0.22 3.60 1.74 8.50
H6 -0.16 0.36 -0.34 0.13 5.74 3.29 9.32
H7 -0.26 0.12 -0.35 0.00 6.68 5.54 7.78
2.2.2 3D scanning technique
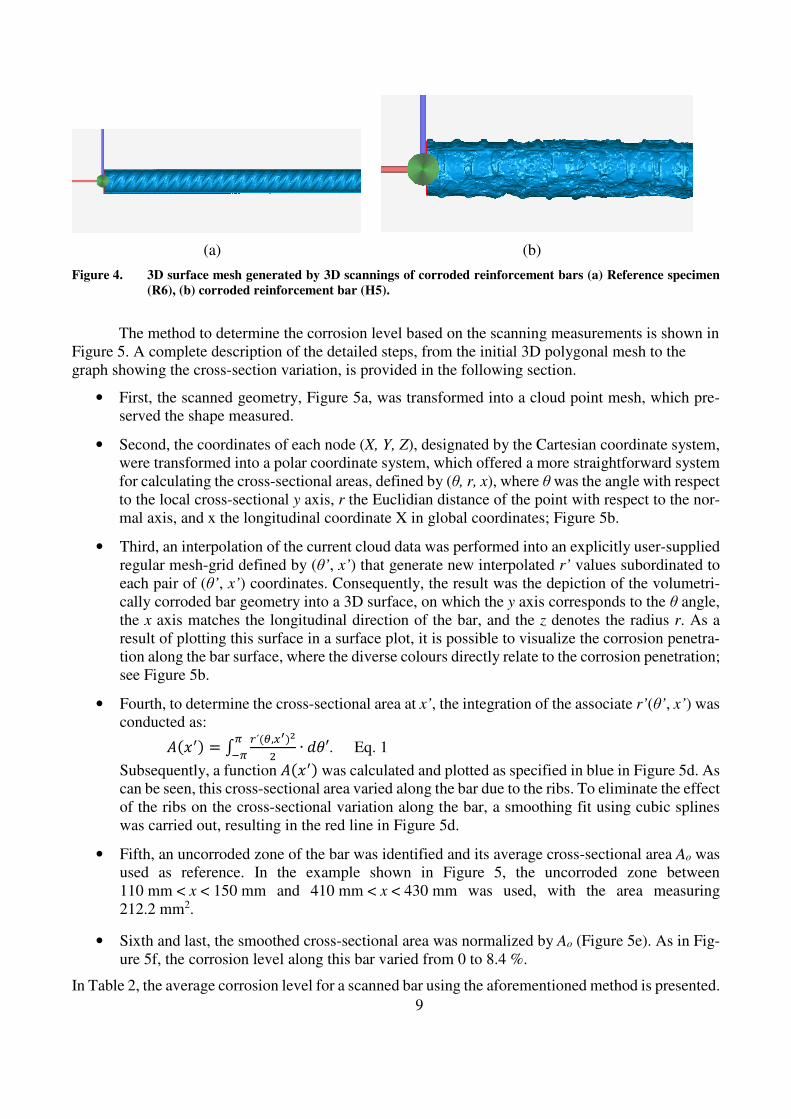
The corrosion level of the extracted reinforcement bars was also measured using the 3D scan-ning technique. An industrial stereo device with two cameras of 5 megapixels each was used. The stereo cameras were combined with a projector to capture three views of an object in a single meas-urement process. The maximum accuracy provided by the camera was 2.5 µm, which allows describ-ing imperfections on the steel bar surface due to corrosion. A global coordinate system, (X, Y, Z), was established and referenced to the end of the bar; see Figure 4. The outcome of the optical measurement was a very fine mesh of triangular surface polygons connected by nodes. The average size of one element was 0.002 mm2. The number of triangular elements in each scanning was between 2,000,000 and 4,000,000 elements, depending on the geometry complexity, i.e. number and distribution of pits. Figure 4 shows two representative specimens, an uncorroded as well as a corroded bar. By clicking on the same figure, it is possible to see an enhanced 3D model of a corroded bar. The high resolution of the surface mesh allows a detailed enough description of the geometry of the bar obtaining information about e.g. pit depth and length, pit distribution, and loss of cross-sectional area along the bar length.
9
(a) (b)
Figure 4. 3D surface mesh generated by 3D scannings of corroded reinforcement bars (a) Reference specimen
(R6), (b) corroded reinforcement bar (H5).
The method to determine the corrosion level based on the scanning measurements is shown in
Figure 5. A complete description of the detailed steps, from the initial 3D polygonal mesh to the graph showing the cross-section variation, is provided in the following section.
• First, the scanned geometry, Figure 5a, was transformed into a cloud point mesh, which pre-served the shape measured.
• Second, the coordinates of each node (X, Y, Z), designated by the Cartesian coordinate system, were transformed into a polar coordinate system, which offered a more straightforward system for calculating the cross-sectional areas, defined by (θ, r, x), where θ was the angle with respect to the local cross-sectional y axis, r the Euclidian distance of the point with respect to the nor-mal axis, and x the longitudinal coordinate X in global coordinates; Figure 5b.
• Third, an interpolation of the current cloud data was performed into an explicitly user-supplied regular mesh-grid defined by (θ’, x’) that generate new interpolated r’ values subordinated to each pair of (θ’, x’) coordinates. Consequently, the result was the depiction of the volumetri-cally corroded bar geometry into a 3D surface, on which the y axis corresponds to the θ angle, the x axis matches the longitudinal direction of the bar, and the z denotes the radius r. As a result of plotting this surface in a surface plot, it is possible to visualize the corrosion penetra-tion along the bar surface, where the diverse colours directly relate to the corrosion penetration; see Figure 5b.
• Fourth, to determine the cross-sectional area at x’, the integration of the associate r’(θ’, x’) was conducted as:
����� = � �´�,� ��� ∙ ��′�
�� . Eq. 1
Subsequently, a function ����� was calculated and plotted as specified in blue in Figure 5d. As can be seen, this cross-sectional area varied along the bar due to the ribs. To eliminate the effect of the ribs on the cross-sectional variation along the bar, a smoothing fit using cubic splines was carried out, resulting in the red line in Figure 5d.
• Fifth, an uncorroded zone of the bar was identified and its average cross-sectional area Ao was used as reference. In the example shown in Figure 5, the uncorroded zone between 110 mm < x < 150 mm and 410 mm < x < 430 mm was used, with the area measuring 212.2 mm2.
• Sixth and last, the smoothed cross-sectional area was normalized by Ao (Figure 5e). As in Fig-ure 5f, the corrosion level along this bar varied from 0 to 8.4 %.
In Table 2, the average corrosion level for a scanned bar using the aforementioned method is presented.

10

11
Figure 5. Overview of the method to obtain corrosion level variation along a bar, specimen H7.
-π
π
(a)
(b)
(c)
(d)
(e)
(f)

12
2.2.3 Comparison of corrosion level from gravimetric measurements and 3D scanning
A direct comparison between the two methods presented to assess the corrosion level is shown in both Table 2 and Figure 6. Each bar from every bundle is separately depicted. As seen, the gravi-metric weight loss method resulted in higher corrosion level values than those resulting from 3D scan-ning measurements for all bars.
The difference between corrosion levels evaluated by both methods is plotted versus the cor-rosion level from the gravimetric method as presented in Figure 7. As can be seen, the higher the corrosion level, the larger the difference between the two methods. On an average, the corrosion level evaluated using the weight loss method yielded values approximately twice as large as those of 3D scanning.
Figure 6. Corrosion level from gravimetric weight loss method plotted versus corrosion level from 3D scanning
method.

13
Figure 7. Difference between gravimetric and 3D scanning methods plotted versus the corrosion level from
weight loss method
This difference made the authors carefully review the results of the calculations to spot any possible source of error; however, none such error could be found. Instead, a possible explanation was found as described in the following. After the weight loss had been measured, the bars were tested up to failure under tensile load. It was noted that a few minor steel pieces broke away from the original steel rebar during the test execution. Figure 8 shows a cross-section where the bar failed the tensile test; the observed pit had been covered by sound steel before the test. Thus, the corrosion products under the surface remained hidden until the steel broke due to tensile stresses. The same behaviour was observed in many other specimens; this finding indicates the presence of horizontal or subsurface corrosion in the bars; see Figure 9.
With the purpose of quantifying the described effect, a comparison between the ratio of the weight before and after tensile testing with respect to the corrosion level measured is presented in Figure 10. As observed, the higher the loss of steel during the tensile test, the larger the corrosion level; this behaviour indicates that the presence of hidden corrosion increased with increasing corrosion lev-els.

14
(a) (b)
Figure 8. (a) 3D-scanned part of a rebar before tensile testing. (b) Photo of the same rebar at the same location
after tensile testing. Note the large corrosion pit that was hidden before the tensile test. External rebar
in Bundle 2, Specimen M10.
(a) Subsurface (b) Undercutting (c) Horizontal
Figure 9. Types of pitting corrosion where not all corrosion is visible from the surface. Redrawn from ASTM
Standard Practice G46-76 (1993).
Figure 10. Ratio between weight before and after tensile testing plotted versus the corrosion level from weight
loss method.
From these observations, it was concluded that a combination of different factors might explain the difference between both measurements. Hidden corrosion was the most likely explanation, along with inaccuracies in the cleaning method by wire bristle brush when applied to naturally corroded bars, which corrosion products are under confinement conditions during long periods. Although works using similar scanning techniques have been found in the literature, only Tang, Lin, Chen and Yi (2014) presented a direct comparison between gravimetric and 3D scanning method to assess the corrosion level; the agreement between both was very reasonable, however, the study was performed on artifi-cially corroded steel bars and the cleaning method used was sandblasting.
However, the methodology presented using the 3D scanning results was found to be trustwor-thy in describing the corrosion on the surface. Major benefits of this method were that it enabled a description of the variation of corrosion along the bar, the pattern of surface pitting and the pit charac-terization; accordingly to other authors as well, who utilised similar techniques applied to artificially

15
corroded bars (Apostolopoulos, Demis & Papadakis, 2013; Fernandez, Bairán & Marí, 2016; Mancini, Tondolo, Iuliano, Minetola, 2014; Ou, Susanto & Roh, 2016; Tang et al., 2014; Wang, Zhang,Gu & Dai, 2013).
2.3 Crack width measurements All visible cracks were marked and measured in the laboratory before any destructive experi-
ment was carried out. The crack widths were measured on three sides of each specimen, in the shear and anchorage zones, roughly every 150 mm along the splitting cracks, close to the location of stirrups and in-between them. The crack widths were measured using a scaled electrometer with a 50x magni-fication microscope. The metric resolution of the microscope with which to measure the cracks on concrete was about 20 micrometres. The crack width was measured by positioning the electrometer over a crack. The view was focused on the crack opening through an eyepiece and the width was measured by a scale visible through the eyepiece.
From the measurements, just before structural testing, the widths of the longitudinally splitting cracks measured within the available anchorage length on the sides that later failed varied from 0.1 mm to 2.5 mm. A detailed documentation of all crack measurements can be found in Lundgren et al. (2015); Tahershamsi et al. (2014).
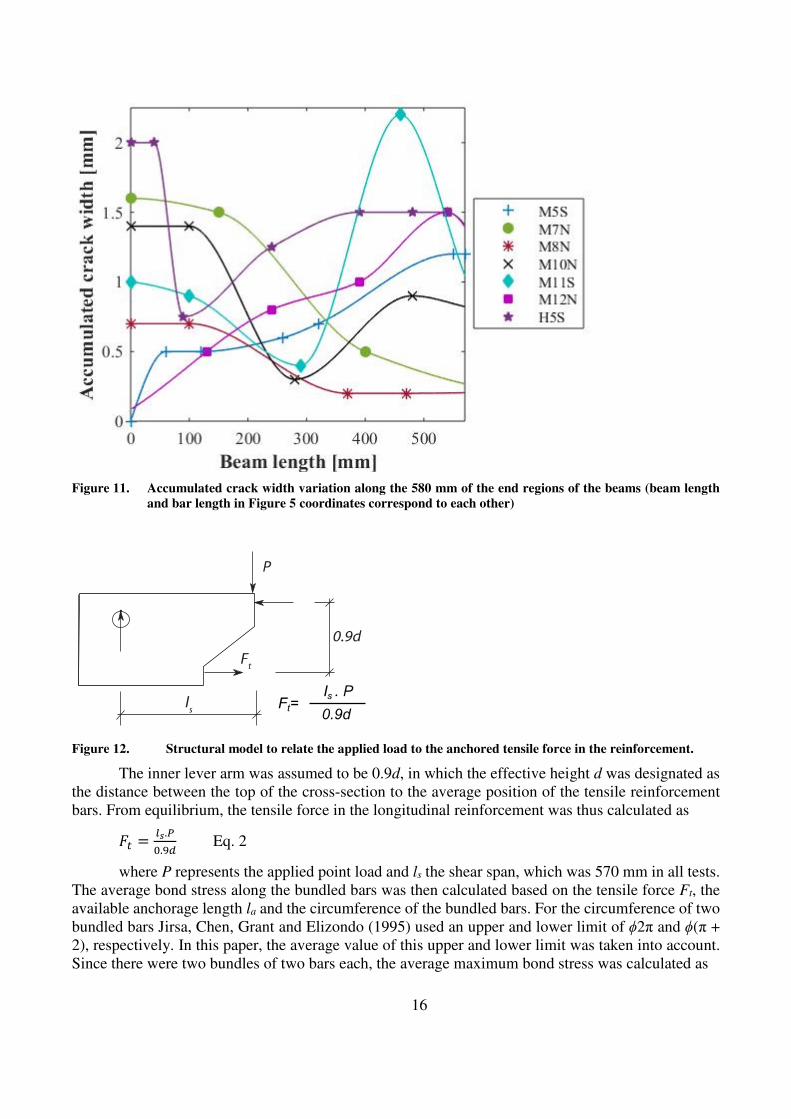
As described, the crack width measurements related to discrete points along each crack. For the purpose of comparing the discrete values to the corrosion measurements along each bar, an inter-polation of the discrete points along the beam end was carried out using a shape preserving interpolant in MATLAB software, Piecewise Cubic Hermite Interpolating Polynomial (PCHIP). Figure 11 shows the variation of the splitting crack widths accumulated along the beam end, which corresponded to the same length as the 3D scanned bars, for all specimens. In the same figure, each marker corresponds to a single measurement of crack width; if more than one crack was detected in a specimen, the marker corresponds to the accumulated value, which indicates the total crack opening at each specific location. In all specimens, cracking only took place at one of the bundles in the anchorage zone where the specimen failed.
2.4 Average maximum bond stress The reinforced concrete beams were tested in suspended four-point bending tests, resulting in
anchorage failure. The anchorage capacity was calculated from the applied force measured during the tests using a simplified structural model assuming that no tensile force was transferred over the main shear crack (see Figure 12).
16
Figure 11. Accumulated crack width variation along the 580 mm of the end regions of the beams (beam length
and bar length in Figure 5 coordinates correspond to each other)
Figure 12. Structural model to relate the applied load to the anchored tensile force in the reinforcement.
The inner lever arm was assumed to be 0.9d, in which the effective height d was designated as the distance between the top of the cross-section to the average position of the tensile reinforcement bars. From equilibrium, the tensile force in the longitudinal reinforcement was thus calculated as
�� = ��.��.�� Eq. 2
where P represents the applied point load and ls the shear span, which was 570 mm in all tests. The average bond stress along the bundled bars was then calculated based on the tensile force Ft, the available anchorage length la and the circumference of the bundled bars. For the circumference of two bundled bars Jirsa, Chen, Grant and Elizondo (1995) used an upper and lower limit of ϕ2π and ϕ(π + 2), respectively. In this paper, the average value of this upper and lower limit was taken into account. Since there were two bundles of two bars each, the average maximum bond stress was calculated as

17
�̂ = !"�#$%&�� ' Eq. 3
Where Ft corresponds to the value calculated in equation 4, ϕ the diameter of the steel rein-forcement bar and la the measured anchorage length for each specimen after testing.
3 Links between corrosion-induced crack width and corro-
sion level First, a comparison between the collected data from the naturally corroded specimens in the
present study was made, looking for potential links between the crack width and corrosion level. Sec-ond, a comparison between the aforementioned relationships and assembled data from the literature for accelerated corrosion specimens is presented. By means of such comparison, it was possible to assess the scope of a variety of proposed crack width/corrosion level relationships applied to naturally corroded specimens to examine if the type of corrosion influences the amount of external damage in relation to corrosion level.
3.1 Results of the present study The possible link between the corrosion level obtained from the 3D scanning method and lon-
gitudinal crack width was investigated by direct comparison of the corrosion level and crack width along each bar; see Sections 2.2.2 and 2.3, respectively. One pair of data points, crack width/corrosion level, was obtained for every single longitudinal interpolated x’ value. All these points were put to-gether in the same data set regardless of the specimen which they came from. Due to the scatter of all collected points, the data were therefore post-processed in such a way that data points with similar crack widths, with a range of ±0.125 mm, were grouped together. This value was chosen in order to has a good discretization within 0 and 2.5 mm, minimum and maximum crack widths. The corrosion level of all data points in one group was evaluated statistically. The average and standard deviation of this set of values was associated with the particular crack width, i.e., the average of the corrosion levels associated with the crack widths ±0.125 mm to a specific value was chosen and therefore represented a single data point linked to such an explicit crack width. For instance, a crack width equal to 0.375 mm enclosed the average corrosion levels of all crack widths within 0.375±0.125 mm; see Figure 13.
The final post-processed data are represented in Figure 14. In the same figure, the corrosion level from the gravimetric method versus the crack width is shown as well. In this case, each data point represents the average corrosion level for each bundle at the splitting cracks to the maximum accumu-lated splitting crack width.
As observed in Figure 14, the scatter is large; no clear pattern is observed for weight measure-ments. However, the amount of measurements was likely not large enough, as every specimen only resulted in a single point when the average corrosion loss was used. On the other hand, due to the method used for 3D scanning, they resulted in a much larger number of measurement points. Despite the fact that the raw data also presented a huge scatter, after they were statistically processed and grouped as previously described, a pattern was observed. Furthermore, a possible explanation of this observation is that the 3D scanning technique described the surface corrosion in a detailed way, while the gravimetric method, in spite of more accurately estimating the corrosion level, also considered the hidden corrosion, which likely did not have as a significant effect in the growth of the crack widths as surface pitting.

18
Figure 13. Discretization of the crack width with a range of ±0.125 mm
Figure 14. Crack width versus corrosion level. For the weight loss markers, the crack width corresponds to the
maximum accumulated crack measured along the bar length studied in each specimen. For the results
of the 3D scanning, the crack width corresponds to the accumulated crack with interpolation along
the bar length/beam length
3.2 Comparison to results from the literature An extensive compilation of artificially corroded test data from the literature was carried out
by Andrade et al. (2016). These compilations are presented in Figure 15, together with additional nat-urally corroded test results from Yu et al. (2015) and the present study. The values described in Figure 15 which were expressed in terms of corrosion percentage level, were in Figure 15 translated into the ratio corrosion penetration to bar radius assuming general corrosion for the purpose of comparing the data from the literature. However, it should be noted that the observed corrosion in the naturally cor-roded specimens from the present study did not correspond to generalized corrosion (see e.g. Figure 5b); still, in this particular case, it was considered useful to express it in such terms so as to ease comparisons to tests with varying bar diameters. An idealised circular cross-section with nominal di-ameter was assumed. To give a clear depiction of the literature data and their scatter, the 5% and 95% bounds, labelled lower and upper bounds, respectively, are plotted in the same figure.
In Figure 15, both the gravimetric and 3D scanning corrosion level measurements are included and compared to the data points from literature. It is clear that the crack width associated with a specific corrosion penetration was larger for the naturally corroded specimens than for the artificially corroded members; it was also generally larger in this study than in other naturally corroded tests found in the literature. To investigate whether this finding can be explained by other factors known to influence,

19
the correction factor “CT” proposed by Andrade et al. (2016) was applied. This correction factor is defined as:
() = *+ ∙ ,�-� ./0", Eq. 4
and considers the geometrical parameters and concrete of different tests. The parameters influ-encing are c/d, which is the concrete cover to steel bar diameter ratio, fct the tensile strength of the concrete and + and 1 the coefficients defined by Andrade et al. (2016) to better fit available data. The values presented in Figure 16 correspond to the same data as in Figure 15, but corrected using the aforementioned expression. It is worth pointing out that the amount of transverse reinforcement is not included as a factor; in a study by Coronelli, Zandi and Lundgren (2013), it is shown that the transverse reinforcement, either corroding or not, reduces the width of cracks caused by the corrosion of the main bars - a possible explanation for the rather large scatter in the results.
Thus, if the corrosion level could be estimated based on the measured crack widths from results of artificially corroded specimens, the corrosion level in the naturally corroded specimens would be greatly overestimated, even when applying the correction factor to include the geometrical and mate-rial properties. This finding agrees with the research by Andrade, Alonso and Olina (1993) who dis-covered that for the same corrosion level with low corrosion rates, larger crack widths would appear on concrete surfaces. However, this is contradictory to results reported by Coronelli, Zandi, Lundgren, and Rossi (2011); they indicated that the slower the corrosion rate, the smaller the crack widths, which appears reasonable as a smaller corrosion rate allows for corrosion products to flow out through cracks, thereby reducing splitting pressure. Obviously, other effects may act in the opposite direction in these specimens. Some possible explanations might be found in the following effects:
• These specimens had been subjected to freezing and thawing, as they had been exposed for 32 years to the outdoor environment at the Stallbacka Bridge near the Swedish city of Trollhät-tan. It seems likely that there was a combined effect of corrosion initiating the cracks and that the cracks progressively increased in width due to the presence of water vapour in the cracks at freezing and thawing. Discussion of the freezing and thawing damaged observed in the tested specimens can be found in Tahershamsi (2016).
• The corrosion was not uniformly distributed on the cross-section; the 3D scanning results in-dicated a clear concentration of corrosion in pits longitudinally distributed along the bar length, commonly following the crack alignment. These results can be seen in Figure 17, which shows the pit pattern along some of the bars together with the location of the spalling cracks and the crack width distribution.
• Long-term effects such as creep and shrinkage of the concrete will also increase the crack width over time. On the other hand, these effects are also visibly present in artificially corroded specimens and are unlikely to fully explain why the naturally corroded specimens behaved differently in the way described.

20
Figure 15. Comparison between naturally and artificially corroded specimens. Data from literature compiled by
Andrade et al. (2016), all artificially corroded. Test specimens in Torres-Acosta & Martnez-Madrid
(2003) and Yu et al. (2015) were naturally corroded.
Figure 16. Artificially corroded and naturally corroded data corrected for the adjustment coefficient proposed
by Andrade et al. (2016)

21
Figure 17. Corrosion pattern of some of the bars together with the location of splitting cracks and the accumu-
lated crack width. (The surface plots show the bar radius in millimetre)
Finally, the results of the present study were compared to equations given in literature to esti-mate the crack width from the corrosion level. The following four expressions were used:
2 = 0.05 + 4.5 ∙ �,, w and xc in mm. Rodriguez, Ortega and Garda (1994) Eq. 5
2 = 0.004 ∙ �,, Fib Model Code (2010) Eq. 6
2 = 0.008 ∙ �,, Fib Model Code (2010) Eq. 7
2 = 2 ∙ 9 ∙ �, ∙ 0.001 ∙ �;<�− 1�, Molina, Alonso and Andrade (1993) Eq. 8

22
2 = 15.86 ∙ *�0�? ∙ ()-�.�@
, Andrade et al. (2016) Eq. 9
Where 2 corresponds to the crack width opening, �, corresponds to the corrosion penetration
in µm, ;<� corresponds to the ratio between the specific volumes of rust and steel, AB corresponds to
the initial radius and CT to the correction factor in Equation 9.
All the expressions combined with the results of this study are shown in Figure 18. As seen, when applied to the naturally corroded specimens in this study, all equations gave large overestima-tions of the corrosion level from the measured crack width.
More experimental data of naturally corroded specimens are required to further assess the scope of the different expressions presented. It would be relevant to also assess the environmental impacts on the crack width opening in regions without freezing and thawing phenomena as well.
Figure 18. Results from the present study compared to equations from literature, estimating the crack width
from the corrosion level.
4 Maximum average bond stress versus crack width and cor-
rosion level In this section, the data collected from the naturally corroded specimens was compiled to look
for potential links between the calculated maximum average bond stresses and the measured corrosion levels of the bundled bars. Furthermore, a comparison between the calculated maximum average bond stress and the measured accumulative crack width is presented. Finally, a comparison is made between these results and the literature data gathered on accelerated corrosion specimens. By means of such comparison, it was possible to assess the validity of different proposed crack width/corrosion level
23
relationships for naturally corroded specimens in order to examine whether the type of corrosion would influence the amount of external damage with respect to corrosion level.
4.1 Results of the present study The maximum average bond stress in the present study was evaluated in Section 2.4. In Figure
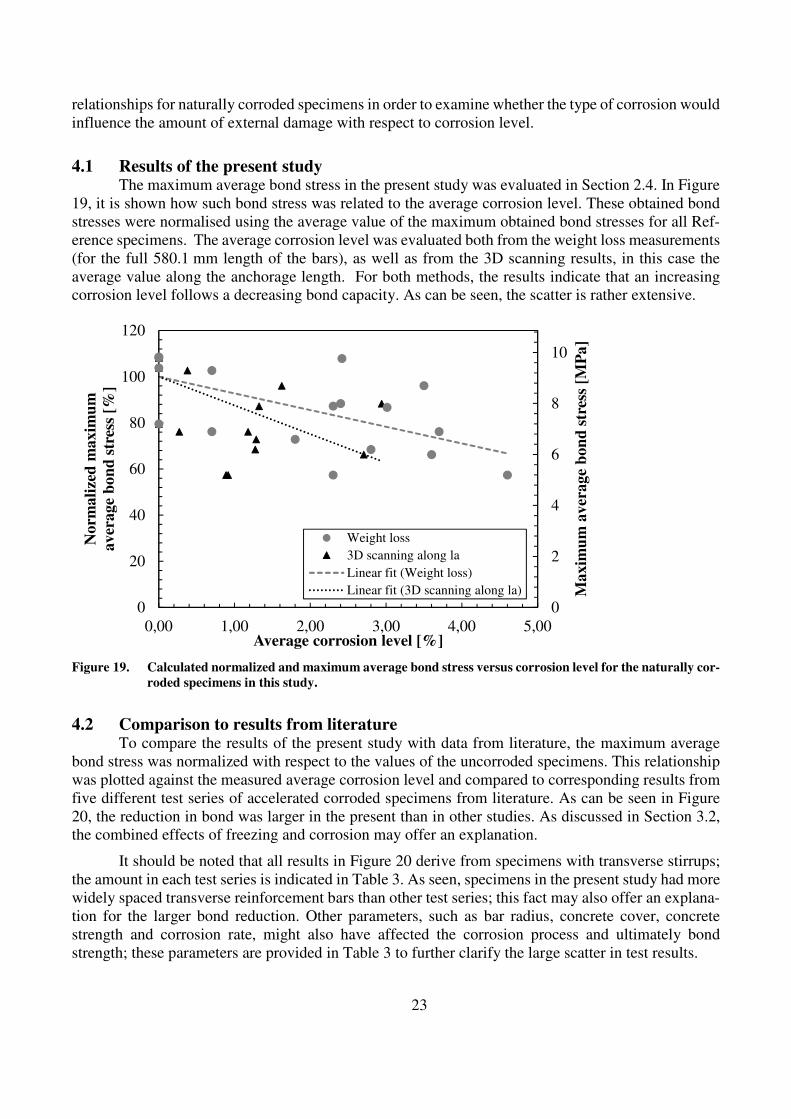
19, it is shown how such bond stress was related to the average corrosion level. These obtained bond stresses were normalised using the average value of the maximum obtained bond stresses for all Ref-erence specimens. The average corrosion level was evaluated both from the weight loss measurements (for the full 580.1 mm length of the bars), as well as from the 3D scanning results, in this case the average value along the anchorage length. For both methods, the results indicate that an increasing corrosion level follows a decreasing bond capacity. As can be seen, the scatter is rather extensive.
Figure 19. Calculated normalized and maximum average bond stress versus corrosion level for the naturally cor-
roded specimens in this study.
4.2 Comparison to results from literature To compare the results of the present study with data from literature, the maximum average
bond stress was normalized with respect to the values of the uncorroded specimens. This relationship was plotted against the measured average corrosion level and compared to corresponding results from five different test series of accelerated corroded specimens from literature. As can be seen in Figure 20, the reduction in bond was larger in the present than in other studies. As discussed in Section 3.2, the combined effects of freezing and corrosion may offer an explanation.
It should be noted that all results in Figure 20 derive from specimens with transverse stirrups; the amount in each test series is indicated in Table 3. As seen, specimens in the present study had more widely spaced transverse reinforcement bars than other test series; this fact may also offer an explana-tion for the larger bond reduction. Other parameters, such as bar radius, concrete cover, concrete strength and corrosion rate, might also have affected the corrosion process and ultimately bond strength; these parameters are provided in Table 3 to further clarify the large scatter in test results.
0
2
4
6
8
10
0
20
40
60
80
100
120
0,00 1,00 2,00 3,00 4,00 5,00
Maxim
um
aver
age
bon
d s
tres
s [M
Pa]
Norm
ali
zed
maxim
um
aver
age
bon
d s
tres
s [%
]
Average corrosion level [%]
Weight loss
3D scanning along la
Linear fit (Weight loss)
Linear fit (3D scanning along la)

24
Figure 20. Comparison of test results from naturally corroded specimens with artificially corroded tests in terms
of bond strength and normalized with respect to the average maximum bond strength obtained from
reference samples versus average corrosion level.
Table 3. Specifications of different test series.
Experimental studies Bar radius
[mm] Cover size
[mm]
Stirrup
specifications
Compressive strength [MPa]
Corrosion rate[µA/cm2]
Al Sulaimani et al (1990) 12 25 (ϕ6@50mm) 40 2000
Berra, Castellani and Coronelli (1997)
14 28-42 (ϕ6@100mm)+skin
bars 36 (20 days) 42
(90 days) -
Fang, Lundgren, Chen and Zhu (2004)
20 65 (ϕ6@40mm) 52 -
Zandi, Coronelli and Lundgren (2011)
20 30 (ϕ8@48mm) 34-38 100
Rodriquez et al (1994) 16 24 (ϕ6@100mm) 40 100
Present study 2ϕ16
(bundled) 30-70 (ϕ10@300mm) 37-49 4
The maximum crack widths observed before structural testing were measured in the shear and anchorage zones of each specimen as illustrated in Section 2.3. In the following, the accumulated crack width, i.e. the sum of the splitting crack widths on two edges of a corner bundle in the anchorage zone was used. In Figure 21, the normalized maximum average bond stress versus crack width is plotted. The results indicate a decreasing bond capacity with increasing crack width. Model Code 2010 sug-gests a reduction in residual bond strength depending on the crack width as was plotted for comparison in Figure 21. Model Code 2010 gives a range of bond strength and crack width, however, in this paper,
0,0
20,0
40,0
60,0
80,0
100,0
120,0
0 5 10 15 20
Norm
ali
zed
maxim
um
aver
age
bon
d s
tres
s [%
]
Average corrosion level [%]
Al-Sulaimani et al 1990Berra et al 1997Fang et al 2004Zandi et al 2011Rodriguez et al 1994Natural corrosion, Present studyNatural corrosion, with CL along la, Present studyLinear (Al-Sulaimani et al 1990)Linear (Berra et al 1997)Linear (Fang et al 2004)Linear (Zandi et al 2011)Linear (Rodriguez et al 1994)Linear (Natural corrosion, Present study)Linear (Natural corrosion, with CL along la, Present study)

25
it was decided to plot the interval between the ranges in bond strength versus the average values of the relevant crack width ranges. As the figure shows, the upper and lower limits for the residual bond strength have a descending trend with respect to the increase in crack widths. It can be observed that the residual bond capacities of the naturally corroded specimens were higher than the upper limit in Model Code 2010. Furthermore, in this figure, the results of this study are compared with three differ-ent test series of accelerated corroded specimens carried out by Fischer and Ožbolt (2013), Rodriguez et al. (1994), Zandi Hanjari et al. (2011), Zandi and Coronelli (2010). Consequently, for the same crack width, the bond strength of the naturally corroded bars in the present study was considerably higher than that of the artificially corroded specimens. It is worth mentioning that the range of measured crack widths in the present study was wider compared with the artificially corroded specimens in the litera-ture.
Figure 21. Comparison of test results from the naturally corroded specimens with artificially corroded tests and
with Model Code 2010 in terms of bond strength, normalized with respect to the average maximum
bond strength obtained from reference samples versus accumulated crack width.
5 Conclusions Based on the research presented, the following conclusions can be drawn:
• Corrosion levels evaluated using the weight loss method yielded values approximately twice as large as those of 3D scanning. The facts that small steel pieces detached from the original steel rebar during tensile testing and that the weight of the bars actually decreased due to tensile tests indicate the presence of horizontal or subsurface corrosion that cannot be measured nor detected by 3D optical measurement.
• Despite this weakness, the 3D scanning method proved to be advantageous to describe corro-sion patterns on the steel bar surface, as well as the longitudinal variation of the corrosion level;
R² = 0,4255
R² = 0,2796
R² = 0,71
R² = 0,8262
0
20
40
60
80
100
120
0,0 0,5 1,0 1,5 2,0 2,5
Norm
ali
zed
maxim
um
aver
age
bon
d s
tres
s
[%]
Accumulated crack width [mm]
Natural Corrosion (Present study)Artificial Corrosion (Zandi et al, 2010)Artificial Corrosion (Rodriguez et al, 1994)Artificial Corrosion (Fischer C. et al, 2013)Model Code 2010: Lower limitModel Code 2010: Upper limitRegression, Natural (Present study)Regression, Artificial (Zandi et al, 2010)Regression, Artificial (Rodriguez et al, 1994)Regression, Artificial (Fischer C. et al, 2013)

26
by using the proposed methodologies to treat 3D scanning results, it was possible to find cor-relations between measured crack widths and corrosion levels.
• For the same corrosion level, the specimens in this study featured much larger crack widths than those of tests in the literature. Most results from literature involved artificially corroded specimens. Some possible explanations might be the combined effects of freezing and thawing, longitudinal pitting corrosion following splitting cracks, or long-term effects including creep and shrinkage of the concrete.
• Contrarily, if the corrosion level would be estimated from measured crack widths based on our existing knowledge mainly from the results of artificially corroded specimens, the corrosion level in naturally corroded specimens would be greatly overestimated.
• Related to crack width, the reduction in bond was lower in the present study than in other studies found in literature, all with artificially induced corrosion owing to the larger crack widths in this study.
• Related to the corrosion level, the reduction in bond was larger in the present study than in other studies found in literature, all with artificially induced corrosion. The combined effects of freezing and corrosion can offer one explanation, but it should be noted that stirrups had larger distance in the present study which is definitely a possible explanation.
• The results indicate that if we are using our knowledge of artificial corrosion as a basis to formulate how the damage visible in the form of crack widths can be used as a damage indica-tor, our estimations of the structural capacity would be on the safe side.
Acknowledgements This research study was undertaken at Chalmers University of Technology, Division of Struc-
tural Engineering, Concrete Structures. The authors would like to gratefully acknowledge the funding by the Swedish Transport Administration (Trafikverket).
References Almusallam, A. A. (2001). Effect of degree of corrosion on the properties of reinforcing steel
bars. Construction and Building Materials, 15(8), 361–368. doi:10.1016/S0950-0618(01)00009-5
Almusallam, A. A., & Al-gahtani, A. S. (1996). Effect of reinforcement corrosion on bond strength, 10(2), 123–129.
Al-Sulaimani, G. J., Kaleemullah, M., Basunbul, I. A., & Rasheeduzzafar. (1990). Influence of corrosion and cracking on bond behavior and strength of reinforced concrete members. ACI Structural
Journal, 87(2), 220–231.
Andrade, C., & Alonso, C. (2004). Test methods for on-site corrosion rate measurement of steel reinforcement in concrete by means of the polarization resistance method. Materials and Structures, 37(9), 623–643. doi:10.1007/BF02483292
Andrade, C., Alonso, C., & Olina, F. J. (1993). Cover cracking as a function of bar corrosion: Part I-Experimental test. Materials and Structures, 26(8), 453–464. doi:10.1007/BF02472805
Andrade, C., Cesetti, A., Mancini, G., & Tondolo, F. (2016). Estimation of Corrosion Atack in Reinforced Concrete by Means of Crack Opening. Structural Concrete. doi:10.1002/suco.201500114
Apostolopoulos, C. A., Demis, S., & Papadakis, V. G. (2013). Chloride-induced corrosion of steel reinforcement – Mechanical performance and pit depth analysis. Construction and Building
Materials, 38, 139–146. http://doi.org/10.1016/j.conbuildmat.2012.07.087

27
ASTM Standard G46-76. (1993). Standard Practice for Examination and Evaluation of Pitting Corrosion
ASTM Standard G1. (2011). Standard practice for preparing, cleaning, and evaluating corrosion test specimens.
Azad, A. K., Ahmad, S., & Azher, S. A. (2007). Residual strength of corrosion-damaged reinforced concrete beams. ACI Materials journal, 104(1), 40–47.´
Berra, M., Castellani, A. & Coronelli, D. (1997), Bond in reinforced concrete and corrosion of bars, Proceedings of the seventh international coference on structural faults and repair, Volume II: concrete and composites
Berra, M., Castellani, A., Coronelli, D., Zanni, S., & Zhang, G. (2003). Steel-concrete bond deterioration due to corrosion: finite-element analysis for different confinement levels. Magazine of
Concrete Research, 55(3), 237–247. doi:10.1680/macr.55.3.237.37574
Bertolini, L. (2008). Steel corrosion and service life of reinforced concrete structures. Structure
and Infrastructure Engineering, 4(2), 123–137. doi:10.1080/15732470601155490
Bhargava, K., Ghosh, A. K., Mori, Y., & Ramanujam, S. (2008). Suggested empirical models for corrosion-induced bond. Journal of Structural Engineering, 134(2), 221–230.
Biondini, F., & Vergani, M. (2014). Deteriorating beam finite element for nonlinear analysis of concrete structures under corrosion. Structure and Infrastructure Engineering, 11(4), 519–532. doi:10.1080/15732479.2014.951863
Cabrera, J. G. (1996). Deterioration of concrete due to reinforcement steel corrosion. Cement
and Concrete Composites, 18(1), 47–59. doi:10.1016/0958-9465(95)00043-7
Cairns, J., & Millard, S. (1999). Reinforcement corrosion and its effect on residual strength of concrete structures. In Proceeding of the 8th International Conference on Structure Faults and Repair. Edinburg, UK.
CEB. (2000). Bond in Concrete. Bulletin 10.
CEB. (1998). Strategies for testing and assessment of concrete structure. Bulletin 243.
Clark, L. & Saifullah, M., (1994). Effect of corrosion rate on the bond strength of corroded reinforcement. In R. Swamy, ed. Proceedings of the international conference on corrosion and
corrosion protecction of steel in concrete. Shefield, UK. Sheffield Academic Press, pp. 591-602
Coronelli, D. (2006). Condition rating for the evaluation of the safety of corroding RC structures. In 11th International Conference on Structure, Faults and Repair. Edinburgh, UK.
Coronelli (2007) Condition rating of RC structures: A case study. Journal of Building Ap-
praisal,3 I :29-5I
Coronelli, D., Zandi Hanjari, K., Lundgren, K., & Rossi, E. (2011). Severely corroded reinforced concrete with cover cracking: Part 1. Crack initiation and propagation. RILEM Bookseries (Vol. 5, pp. 195–205). Dipartimento di Ingegneria Strutturale, Politecnico di Milano, Italy.
Coronelli, D., Zandi Hanjari, K., & Lundgren, K. (2013). Severely corroded RC with cover cracking. Journal of Structural Engineering, 139(2), 221–232. doi:10.1061/(ASCE)ST.1943-541X.0000633.
28
Dang, V. H., & François, R. (2013). Influence of long-term corrosion in chloride environment on mechanical behaviour of RC beam. Engineering Structures, 48, 558–568. doi:10.1016/j.engstruct.2012.09.021
Dang, V. H., & François, R. (2014). Prediction of ductility factor of corroded reinforced concrete beams exposed to long term aging in chloride environment. Cement and Concrete
Composites, 53, 136–147. doi:10.1016/j.cemconcomp.2014.06.002
Du, Y. G., Clark, L. A., & Chan, A. H. C. (2005). Effect of corrosion on ductility of reinforcing bars. Magazine of Concrete Research, 57(7), 407–419.
Fang, C., Lundgren, K., Chen, L., & Zhu, C. (2004). Corrosion influence on bond in reinforced concrete. Cement and Concrete Research, 34(11), 2159–2167. doi:10.1016/j.cemconres.2004.04.006
Fernandez, I., Bairán, J. M., & Marí, A. R. (2015). Corrosion effects on the mechanical properties of reinforcing steel bars. Fatigue and σ–ε behavior. Construction and Building Materials, 101, 772–783. doi:10.1016/j.conbuildmat.2015.10.139
Fernandez, I., M. Birán, J., & R. Marí, A. (2016). Mechanical model to evaluate steel reinforcement corrosion effects on σ-ε and fatigue curves. Experimental calibration and validation. Engineering Structures. Retrieved from http://dx.doi.org/10.1016/j.engstruct.2016.03.055
Fernandez, I., M. Birán, J., & R. Marí, A. (2016). 3D FEM model development from 3D optical measurment technique applied to corroded steel bars. Construction and Building Materials, 124, 519-
532, . http://dx.doi.org/10.1016/j.conbuildmat.2016.07.133
Fernandez, I., Herrador, M. F., Marí, A. R., & Bairán, J. M. (2016). Structural effects of steel reinforcement corrosion on statically indeterminate reinforced concrete members. Materials and
Structures. doi:10.1617/s11527-016-0836-2
Fib Model Code. (2010). Model Code 2010, Volume 1 (Vol. 1). International Federation for Structural Concrete, Lausanne, Switzerland.
Fischer, C., & Ožbolt, J. (2013). An appropriate indicator for bond strength eegradation due to reinforcement corrosion. In 8th International Conference on Fracture Mechanics of Concrete and
Concrete Structures, FraMCoS 2013 (pp. 1828–1835). Toledo, Spain.
Folić, R., & Zenunović, D. (2010). Durability problem of RC structures in Tuzla industrial zone - Two case studies. Engineering Structures, 32(7), 1846–1860. doi:10.1016/j.engstruct.2010.03.004
Frolund, T., & Sorensen, R. (2007). Corrosion monitoring in concrete structures. In Sustainable
Bridges - Assessment for Future Traffic Demands and Longer Lives (pp. 2011–2018).
Jirsa JO, Chen W, Grant DB & Elizondo R. (1995) Development of Bundled Reinforcing Steel. Texas, USA:
Koch, G. H., Brongers, M. P. H., Thompson, N. G., Virmani, Y. P., & Payer, J. H. (2002). Corrosion costs and preventive strategies in the United States. Summary, 1–12. doi:FHWA-RD-01-156
Law, D., Du, Y., & Cairns, J. (2008). Structural performance of corrosion-damaged concrete beams. Magazine of Concrete Research, 60(5), 359–370. doi:10.1680/macr.2007.00102
Lee, H.-S., Noguchi, T., & Tomosawa, F. (2002). Evaluation of the bond properties between concrete and reinforcement as a function of the degree of reinforcement corrosion. Cement and
Concrete Research, 32(8), 1313–1318. doi:10.1016/S0008-8846(02)00783-4

29
Lundgren, K. (2005). Bond between ribbed bars and concrete. Part 2: The effect of corrosion. Magazine of Concrete Research, 57(7), 383–395.
Lundgren, K. (2007). Effect of corrosion on the bond between steel and concrete: an overview. Magazine of Concrete Research, 59(6), 447–461. doi:10.1680/macr.2007.59.6.447
Lundgren, K., Tahershamsi, M., Zandi, K., & Plos, M. (2015). Tests on anchorage of naturally corroded reinforcement in concrete. Materials and Structures, 48(7), 2009–2022. doi:10.1617/s11527-014-0290-y
Mancini, G., Tondolo, F., Iuliano, L., & Minetola, P. (2014). Local reinforcing bar damage in r.c. members due to accelerated corrosion and loading. Construction and Building Materials, 69, 116–123. http://doi.org/10.1016/j.conbuildmat.2014.07.011
Molina, F. J., Alonso, C., & Andrade, C. (1993). Cover cracking as a function of rebar corrosion : Part 2 Numerical model. Materials and Structures, 26(9), 532–548.
Ou, Y.-C., Susanto, Y. T. T., & Roh, H. (2016). Tensile behavior of naturally and artificially corroded steel bars. Construction and Building Materials, 103, 93–104. http://doi.org/10.1016/j.conbuildmat.2015.10.075
Rodriguez, J., Ortega, L. M., & Garda, A. M. (1994). Assessment of structural elements with corroded reinforcement. In Corrosion and Corrosion Protection of Steel in Concrete, Proceedings of International Conference held at the University of Sheffield (pp. 172–185).
Sæther, I. (2010). Structural behaviour of deteriorated and retrofitted concrete structures. Ph.D. Thesis, Norwegian University of Science and Technology, Trondheim, Norway.
Sæther, I. (2011). Bond deterioration of corroded steel bars in concrete. Structure and
Infrastructure Engineering, 7(6), 415–429. doi:10.1080/15732470802674836
Sistonen, E., Cwirzen, A., & Puttonen, J. (2008). Corrosion mechanism of hot-dip galvanised reinforcement bar in cracked concrete. Corrosion Science, 50(12), 3416–3428. doi:10.1016/j.corsci.2008.08.050
Tahershamsi, M. (2016), Structural effects of reinforcement corrosion in concrete structures, Doctoral Thesis
Tahershamsi, M., Zandi, K., Lundgren, K., & Plos, M. (2014). Anchorage of naturally corroded bars in reinforced concrete structures. Magazine of Concrete Research, 66(14), 729–744. doi:10.1680/macr.13.00276
Tang, F., Lin, Z., Chen, G., & Yi, W. (2014). Three-dimensional corrosion pit measurement and statistical mechanical degradation analysis of deformed steel bars subjected to accelerated corrosion. Construction and Building Materials, 70, 104–117. http://doi.org/10.1016/j.conbuildmat.2014.08.001
Tang, L., & Malmberg, B. (2006). Assessment of reinforcement corrosion in a concrete highway tunnel. In Concrete Repair, Rehabilitation and Retrofitting - Proceedings of the International Conference on Concrete Repair, Rehabilitation and Retrofitting, ICCRRR 2005 (pp. 153–154).
Torres-Acosta, A. A., & Martnez-Madrid, M. (2003). Residual Life of Corroding Reinforced Concrete Structures in Marine Environment. Journal of Materials in Civil Engineering, 15(4), 344–353. doi:10.1061/(ASCE)0899-1561(2003)15:4(344)

30
Val, D. V., Stewart, M. G., & Melchers, R. E. (1998). Effect of reinforcement corrosion on reliability of highway bridges. Engineering Structures, 20(11), 1010–1019. doi:10.1016/S0141-0296(97)00197-1
Wang, X., & Liu, X. (2004). Bond strength modeling for corroded reinforcement in reinforced concrete. Structural Engineering and Mechanics, 17(6), 863–878.
Wang, X., Zhang, W., Gu, X., & Dai, H. (2013). Determination of residual cross-sectional areas of corroded bars in reinforced concrete structures using easy-to-measure variables. Construction and
Building Materials, 38, 846–853. http://doi.org/10.1016/j.conbuildmat.2012.09.060
Yu, L., François, R., Hiep, V., Hostis, V. L., & Gagné, R. (2015). Distribution of corrosion and pitting factor of steel in corroded RC beams. Construction and Building Materials, 95, 384–392. doi:10.1016/j.conbuildmat.2015.07.119
Yunovich, M., Yunovich, N. G., Balvanyos, T., & Lave, L. (2001). Corrosion cost and preventive strategies in the united states - appendix D: highway bridges, Federal Highway
Administration, FHWA-RD-01-157.
Zandi Hanjari, K. (2010). Structural behaviour of deteriorated concrete structures. Ph.D. Thesis, Chalmers University of Technology, Gothenburg, Sweden.
Zandi Hanjari, K., & Coronelli, D. (2010). “Anchorage capacity of corroded reinforcement: eccentric pull-out tests on beam-end specimens.” Report No. 2010-06, Department of Civil and Envi-ronmental Engineering, Chalmers University of Technology, Göteborg, Sweden, Dipartimento di Ingegneria Strutturale, Politecnico di Milano, Milan, Italy.
Zandi Hanjari, K., Coronelli, D., & Lundgren, K. (2011). Bond capacity of severely corroded bars with corroded stirrups. Magazine of Concrete Research, 63(12), 953–968.
Zhu, W., & François, R. (2016). Prediction of the residual load-bearing capacity of naturally corroded beams using the variability of tension behaviour of corroded steel bars. Structure and
Infrastructure Engineering, 12(2), 143–158. doi:10.1080/15732479.2014.996165