A Unified Formula for Calculation of Crack Width and ...
28
Yao et al. Int J Concr Struct Mater (2021) 15:42 https://doi.org/10.1186/s40069-021-00479-4 RESEARCH A Unified Formula for Calculation of Crack Width and Spacing in Reinforced Concrete Beams Xianhua Yao 1 , Junfeng Guan 1* , Lei Zhang 2 , Junyi Xi 1 and Lielie Li 1 Abstract Crack distribution and widths were experimentally examined in a series of reinforced concrete (RC) beams. Concretes of different strengths were used, and beams were reinforced with 600 MPa yield strength steel bars. The features of cracks, which need to be considered in the design, were determined by using statistical analysis of different crack pat- terns observed in RC beams. The methods for determining the depth of effective influence zone of 600 MPa steel bars in RC beams were experimentally obtained. Based on the experimental data obtained in this study and from the data on RC beams with 335–600 MPa yield strength steel bars from other studies, the applicability of different formulas for the determination of the maximum widths (provided in codes and by scholars) was analyzed. Methods for the calculation of average crack spacing and maximum crack widths in RC beams with steel bars of various yield strengths were proposed. A unified formula for the calculation of maximum crack width in such beams was also established. Highlights • Reinforced concrete beam cracking behavior was experimentally examined with a new type of seismic bar. • New methods for the calculation of average crack spacing and maximum crack width were presented. • A unified formula for the calculation of maximum crack width was proposed. Keywords: crack width, crack spacing, reinforced concrete beam, 600 MPa steel bar, concrete strength © The Author(s) 2021. Open Access This article is licensed under a Creative Commons Attribution 4.0 International License, which permits use, sharing, adaptation, distribution and reproduction in any medium or format, as long as you give appropriate credit to the original author(s) and the source, provide a link to the Creative Commons licence, and indicate if changes were made. The images or other third party material in this article are included in the article’s Creative Commons licence, unless indicated otherwise in a credit line to the material. If material is not included in the article’s Creative Commons licence and your intended use is not permitted by statutory regulation or exceeds the permitted use, you will need to obtain permission directly from the copyright holder. To view a copy of this licence, visit http://creativecommons.org/licenses/by/4.0/. 1 Introduction Checking and controlling of cracks in reinforced concrete (RC) components or structures are the key issues in the engineering design, construction, and serviceability of concrete structures. In particular, crack control is a major factor in design when high-strength steel bars are used. An accurate crack width checking is known as a crucial and complicated problem in the design and testing of RC structures (Beeby, 2004; Frosch, 2002; Guan, 2010; Guan et al. 2011; Zhao et al. 2008, 2009). erefore, a correct establishment of the crack width checking approach for RC structures is theoretically significant and offers a practical value in structural engineering. Existing formu- las for crack width checking in RC beams differ among countries, they are inconsistent, and can be roughly divided into two types. e first type is semi-theoretical and semi-empirical formulas, which are based on the analysis of the cracking mechanism, and are theoreti- cally derived on the basis of mechanical models. How- ever, some of the coefficients in them are determined from experiments or experience. Formulas belonging to the first type can be found in the US codes ACI318-99 Open Access International Journal of Concrete Structures and Materials *Correspondence: [email protected] 1 School of Civil Engineering and Communication, North China University of Water Resources and Electric Power, Zhengzhou 450045, Henan, China Full list of author information is available at the end of the article Journal information: ISSN 1976-0485 / eISSN 2234-1315
Transcript of A Unified Formula for Calculation of Crack Width and ...
Yao et al. Int J Concr Struct Mater (2021) 15:42 https://doi.org/10.1186/s40069-021-00479-4
RESEARCH
A Unified Formula for Calculation of Crack Width and Spacing in Reinforced Concrete BeamsXianhua Yao1, Junfeng Guan1* , Lei Zhang2, Junyi Xi1 and Lielie Li1
Abstract
Crack distribution and widths were experimentally examined in a series of reinforced concrete (RC) beams. Concretes of different strengths were used, and beams were reinforced with 600 MPa yield strength steel bars. The features of cracks, which need to be considered in the design, were determined by using statistical analysis of different crack pat-terns observed in RC beams. The methods for determining the depth of effective influence zone of 600 MPa steel bars in RC beams were experimentally obtained. Based on the experimental data obtained in this study and from the data on RC beams with 335–600 MPa yield strength steel bars from other studies, the applicability of different formulas for the determination of the maximum widths (provided in codes and by scholars) was analyzed. Methods for the calculation of average crack spacing and maximum crack widths in RC beams with steel bars of various yield strengths were proposed. A unified formula for the calculation of maximum crack width in such beams was also established.
Highlights
• Reinforced concrete beam cracking behavior was experimentally examined with a new type of seismic bar.• New methods for the calculation of average crack spacing and maximum crack width were presented.• A unified formula for the calculation of maximum crack width was proposed.
Keywords: crack width, crack spacing, reinforced concrete beam, 600 MPa steel bar, concrete strength
© The Author(s) 2021. Open Access This article is licensed under a Creative Commons Attribution 4.0 International License, which permits use, sharing, adaptation, distribution and reproduction in any medium or format, as long as you give appropriate credit to the original author(s) and the source, provide a link to the Creative Commons licence, and indicate if changes were made. The images or other third party material in this article are included in the article’s Creative Commons licence, unless indicated otherwise in a credit line to the material. If material is not included in the article’s Creative Commons licence and your intended use is not permitted by statutory regulation or exceeds the permitted use, you will need to obtain permission directly from the copyright holder. To view a copy of this licence, visit http:// creat iveco mmons. org/ licen ses/ by/4. 0/.
1 IntroductionChecking and controlling of cracks in reinforced concrete (RC) components or structures are the key issues in the engineering design, construction, and serviceability of concrete structures. In particular, crack control is a major factor in design when high-strength steel bars are used. An accurate crack width checking is known as a crucial and complicated problem in the design and testing of RC
structures (Beeby, 2004; Frosch, 2002; Guan, 2010; Guan et al. 2011; Zhao et al. 2008, 2009). Therefore, a correct establishment of the crack width checking approach for RC structures is theoretically significant and offers a practical value in structural engineering. Existing formu-las for crack width checking in RC beams differ among countries, they are inconsistent, and can be roughly divided into two types. The first type is semi-theoretical and semi-empirical formulas, which are based on the analysis of the cracking mechanism, and are theoreti-cally derived on the basis of mechanical models. How-ever, some of the coefficients in them are determined from experiments or experience. Formulas belonging to the first type can be found in the US codes ACI318-99
Open Access
International Journal of ConcreteStructures and Materials
*Correspondence: [email protected] School of Civil Engineering and Communication, North China University of Water Resources and Electric Power, Zhengzhou 450045, Henan, ChinaFull list of author information is available at the end of the articleJournal information: ISSN 1976-0485 / eISSN 2234-1315
Page 2 of 28Yao et al. Int J Concr Struct Mater (2021) 15:42
(ACI Committee, 1999) and ACI318-14 (ACI Commit-tee, 2014), European norm EN 1992-1-1 (EN1992-1-1, 2004), and Chinese codes GB (GB50010, 2010), DL/T (DL/T 5057-1996, 1996; DL/T 5057-2009, 2010 ) and SL/T (2009). The second type is formulas based on math-ematical statistics, which involves conducting a regres-sion analysis of the impacts of different parameters on the crack width development and requires a large num-ber of measured data. After selecting the most impor-tant parameters, an appropriate mathematical statistics methodology is used to directly establish an appropri-ate formula. Such examples are formulas provided in the US codes ACI318-71 (ACI Committee, 1971) and ACI318-95 (ACI Committee, 1995), and Chinese codes JTG (JTGD62-2012, 2012), JTJ (JTJ267-98, 1998) and TB (TB10002.3-2005, 2005).
In the current Chinese codes for the design of concrete structures (e.g., GB50010 for civil engineering concrete structures (GB50010, 2010), DL/T 5057 and SL/T 191 for hydraulic concrete structures (DL/T 5057-1996, 1996, DL/T 5057-2009, 2010; SL/T 191-2008, 2009), JTG D62 for highway RC structures (JTG D62-2012, 2012), JTJ 267 for harbor engineering concrete structures (JTJ267-98, 1998), and TB10002.3 for railroad RC structures (TB10002.3-2005, 2005)), the highest yield strength of ordinary steel bars is 500 MPa, which can also be con-sidered as a standard value. However, the highest yield strength of ordinary steel bars specified in ACI 318-14 (ACI Committee, 2014) and EN 1992-1-1 (EN1992-1-1, 2004) is 550 and 600 MPa, respectively. Application of high-strength steel bars with yield strength of 600 MPa in RC structures reduces steel consumption and represents a new economical and efficient design approach. Further-more, their performance during the seismic action turned out to be satisfying. In China, studies of the performance of high-strength steel bars with yield strength of 600 MPa and their structural and mechanical properties are still in an early stage (Guan et al., 2016, 2018). Zhao et al. (2008) put forward the statistical analysis principle of crack clas-sification of 335 MPa reinforced concrete beams and made statistical calculation and analysis. According to the statistical analysis, the average crack spacing, aver-age crack width, and distribution model of crack width were evaluated. Liu et al. (2019) investigated the effect of carbon fiber composite (CFRP) reinforcement on crack growth, evolution characteristics, and fractal dimensions of prestressed concrete beams under concentrated loads. The test results show that CFRP has an inhibitory effect on the cracks. The crack width conforms to the normal distribution. The scattering coefficient, average width, and characteristic width decreased with the increase in height. The three parameters of the CFRP-strengthened beam with the same height were smaller than those of the
unreinforced beam. Du and Su (2012) performed a statis-tical analysis on the crack widths at different positions of post-tensioned bonded prestressed concrete beams with 500 MPa steel bars. The results indicated that the crack width at each position follows the normal distribution, and the short-term crack width expansion coefficient at each position is the same. Li et al. (2019) studied the shear performance of steel fiber reinforced expanded-shale lightweight concrete (SFRELC) beams without mesh reinforcement. According to the basic design prin-ciples and experimental results, statistical analysis of the shear crack resistance, shear crack distribution and width, mid-term deflection, shear failure mode, and shear capacity of the specimens was carried out. The research showed that steel fibers could effectively enhance the shear performance of reinforced SFRELC beams with-out net reinforcement. Yao et al. (2020) tested the flex-ural capacity of concrete beams with varying strength grades and different reinforcement ratios embedded with new 600 MPa-grade steel bars. The research showed that when the measured values of yield strength of reinforce-ment and concrete strength were adopted, the ratio of measured failure moment value to calculated value of each beam based on different codes was close to 1.0. In addition, according to the reliability analysis, the design yield strength of 600 MPa-grade high-strength steel bars should be 520 MPa. Li et al. (2018) carried out an experi-mental study on 600 MPa reinforced concrete columns under axial compression. It was demonstrated that the 600 MPa steel bar as longitudinal reinforcement had lit-tle influence on the strength, but when it was used as the stirrup, the concrete columns showed better strength, deformation and toughness. Zhang et al. (2019) found that HRB600 reinforced high-strength concrete columns had better recoverability after the earthquakes with good hysteretic performance and energy dissipation capac-ity. In addition, Zhang et al. (2021) studied the seismic performance of reinforced shear walls with HRB600 and confirmed that the 600 MPa reinforced shear wall had stable hysteretic behavior, while HRB600 reinforced shear wall could reduce the residual deformation better than HRB400 reinforced shear wall. Xiong et al. (2018) evaluated the mechanical properties of HRB600 steel bar. It was concluded that the design value of tensile yield strength of HRB600 steel bar should be taken as 520 MPa. Guan et al. (2018) tested the mechanical prop-erties of new 600 MPa-grade seismic steel bars. The study showed that the strength and deformation properties meet the requirements of Chinese and foreign seismic design standards. The measured values of the yield and the ultimate tensile strengths were larger than 630 and 800 MPa, respectively, and the maximum total elongation Agt exceeded 9%. Based on the test data, mathematical

Page 3 of 28Yao et al. Int J Concr Struct Mater (2021) 15:42
expression for tensile constitutive relation was proposed for 600 MPa-grade seismic steel bars. Furthermore, Guan et al. (2016) carried out the research on the anti-crack performance of reinforced concrete beams with 600 MPa-grade steel bars, and presented a correction for-mula for the crack calculation when such bars are used. Guan et al. (2021) examined the mid-span deflection of reinforced concrete beams with high strength of 600 MPa and its calculation method. The test results showed that the strain change of concrete beams with high strength of 600 MPa was as per the assumption of the plane sec-tion, and the full curve of load-mid-span deflection is a triple line. A unified calculation method was established for the mid-span deflection of concrete beams with dif-ferent strengths with 335–600 MPa steel bars. Guan et al. (2020) conducted stiffness tests on beams with 600 MPa high-strength steel bars, and C60 high-strength concrete with 600 MPa-grade steel bars had excellent deformation behavior, and improved ultimate bearing capacity of the beams. Three models for stiffness of beams with 600 MPa high-strength steel bars and high-strength concrete were recommended. Unfortunately, a relatively limited research has been focused on the crack width of concrete specimens reinforced with 600 MPa-grade high-strength steel bars. Therefore, it should be experimentally checked whether the crack width verification formulas recom-mended by existing structural design standards can be applied in cases of concrete beams with 600 MPa-grade steel bars.
This paper presents the results of the crack width tests performed on a series of beams made out of concretes with different strengths and 600 MPa high-strength steel bars. Additionally, the regularity of crack distribution and width during serviceability conditions were also investi-gated. Crack widths were determined through the statis-tical analysis of the obtained data. An approach for the determination of the effective tension-affected zone was proposed based on the experimentally obtained results.
The existing calculation approaches for RC beams that provide crack spacing and width checking formulas were evaluated by using the experimental results of this study, in which 335–500 MPa-grade steel bars were used, and average crack spacing and maximum crack widths were investigated. Finally, methods for the calculation of aver-age crack spacing and maximum crack widths were pre-sented, and a unified formula for the maximum crack width was proposed for beams with 335–600 MPa-grade steel bars.
2 Experimental Study on RC Beams with 600 MPa Steel Bars
2.1 MaterialsFour different concrete mixtures were used in the study, denoted by C30, C40, C50 and C60. The basic properties of the materials used to develop the four types of con-crete are shown in Table 1. The detailed proportions of concrete mixtures can be found in Table 2.
Experimentally determined mechanical properties of concrete are listed in Table 3. At the same age of every batch of experimental RC beams, six identical cubes with the side length of 150 mm were prepared, to determine the compressive strength fcu and the splitting tensile strength fts (both as average values from three cubes). Meanwhile, six identical prisms with the dimensions of 150 × 150 × 300 mm were prepared in every batch and tested to obtain the elastic modulus Ec and compressive strength fc (both as average values from three prisms).
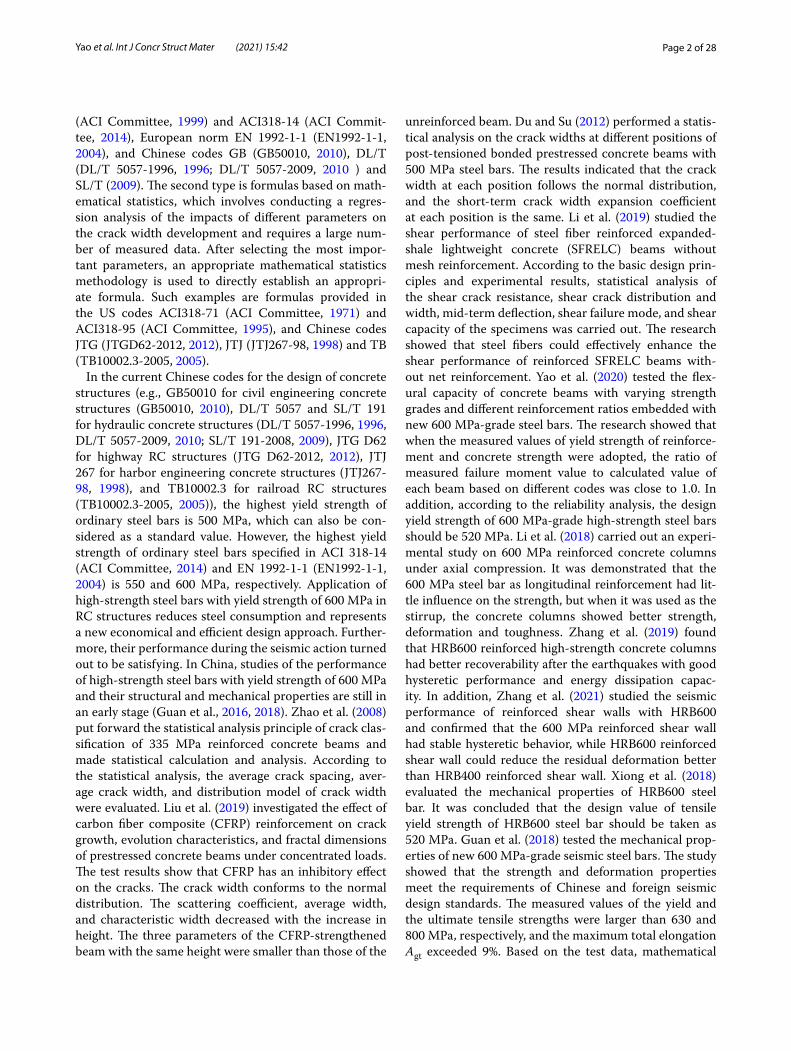
In this study, 600 MPa steels bars (Guan et al., 2021) were used as the longitudinal reinforcement in RC beams. The experimentally determined stress–strain curves for 600 MPa steel bars are shown in Fig. 1. The stress–strain full curves of the 600 MPa class steel bars showed obvi-ous yielding steps in three stages, namely, elasticity, yield, and stress strengthening. The experimentally obtained mechanical properties of 600 MPa-grade steel bars (aver-age values) are listed in Table 4. The actual yield strengths
Table 1 The physical properties of materials used in configuring concrete
Mixture Cement (General Administration of Quality Supervision, Inspection and Quarantine; and National Standardizing Committee 2007)
Fine aggregate Coarse aggregate Slump (mm)
Type 28d compressive strength(MPa)
Apparent density (g/cm3)
Apparent density (kg/m3)
Apparent density (kg/m3)
Bulk density (kg/m3)
C30 P·O 42.5 49.4 3.043 2700 2710 1630 120 ~ 200
C40
C50 P·O 52.5 57.7 3.244
C60
Page 4 of 28Yao et al. Int J Concr Struct Mater (2021) 15:42
fy of bars with different diameters d ranged from 634.17 to 648.38 MPa, and the corresponding ultimate strengths ranged from 808.15 to 843.20 MPa. The values measured
in each tested group were relatively close, and the disper-sion coefficient was small.
In the US code ASTM A706 (ASTM A706/A706M-14, 2014), the ratio of ultimate tensile strength fu to yield strength fy of steel bars is specified to be fu/fy = 1.25. European standard EN 1992-1-1 (EN1992-1-1, 2004) sets the fu/fy ratio in the range of 1.05 to 1.35. For the seis-mic design of RC members, Chinese standard GB50010 (GB50010, 2010) requires that the fu /fy ratio should not be less than 1.25. Experimentally measured values of the fu/fy ratio of 600 MPa-grade steel bars considered in this study were in the range of 1.27–1.31.
European standard EN1992-1-1 (EN 1992-1-1, 2004) specifies that the characteristic strain at maximum force of C-grade steel bars should be larger than 7.5%. For the seismic design of RC members, Chinese standard GB50010 (GB50010, 2010) specifies that the measured elongation of steel bars at maximum force (Agt) should not be less than 9%. The measured values Agt of 600 MPa-grade steel bars were larger than 9%.
Therefore, the strength and deformation properties of the applied 600 MPa steel bars met the requirements of the Chinese standard GB50010 (GB50010, 2010), the US code ASTM A706 (ASTM A706/A706M-14, 2014) and the European standard EN 1992-1-1 (EN1992-1-1, 2004).
2.2 Design of RC BeamsEight groups of 16 RC beams with 600 MPa steel bars, in which different concrete strength and reinforcement ratios were used, were cast for the experiment and were denoted as C30-1, C30-2, C40-1, C40-2, C50-1, C50-2,
Table 2 Concrete mixture proportion.
Mixture Cement, (kg/m3) Water, (kg/m3) w/c Aggregate (kg/m3) Sand (kg/m3) High-range water reducing admixture (kg/m3)5 to10 (mm) 10 to 16 (mm) 16 to 20 (mm)
C30 378 (No.42.5) 189 0.50 491 328 273 758 1.89
C40 473 (No.42.5) 189 0.40 491 328 273 670 3.31
C50 473 (No.52.5) 189 0.40 491 328 273 698 3.31
C60 630 (No.52.5) 189 0.30 458 305 254 624 5.04
Table 3 Experimental mechanical properties of concrete.
Mixture fcu (MPa) fck (MPa) fts (MPa) Ec × 104 (MPa) Age (days) Batch number
C30 37.7 26.4 2.0 3.8 200 1
C40 42.6 32.3 2.7 3.7 250 2
C50 53.0 33.3 3.4 3.7 260 3
C60 66.3 61.8 3.3 4.1 290 4
C60 67.1 62.3 3.4 4.1 300 5
Fig. 1 Experimental stress–strain curves of 600 MPa steel bars.
Table 4 Experimental mechanical properties of 600 MPa steel bars.
Diameter d (mm)
Yield strength fy (MPa)
Ultimate strength fu (MPa)
fu/fy Elastic modulus Es (GPa)
Maximum force total elongation Agt (%)
14 635.71 819.92 1.29 198 10.03
18 645.02 840.38 1.30 195 10.13
Page 5 of 28Yao et al. Int J Concr Struct Mater (2021) 15:42
C60-1 and C60-2. For comparison, two additional RC beams with 400 MPa steel bars were also cast, and were denoted by CR60-1 and CR60-2, to be associated with the C60-1 group.
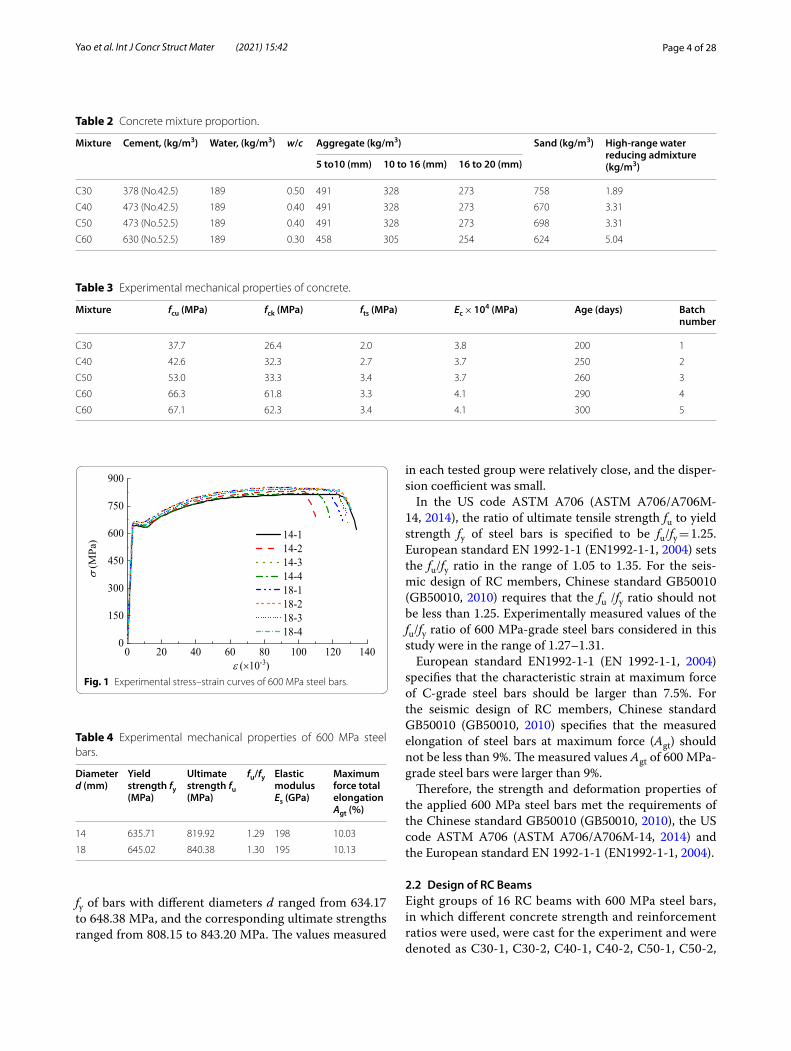
The geometry of the RC beams is shown in Fig. 2, in which b denotes width, h denotes depth, l0 represents the span, and c is the concrete cover. h0 is the effective depth, determined as h0 = h – as = h – c – d/2, where as denotes the distance from the concrete face to the center of gravity of steel bars.
The details of RC beams with 600 and 400 MPa steel bars are listed in Table 5, where ρ denotes the
reinforcement ratio determined as ρ = As/(bh0), and As is the area of steel bars.
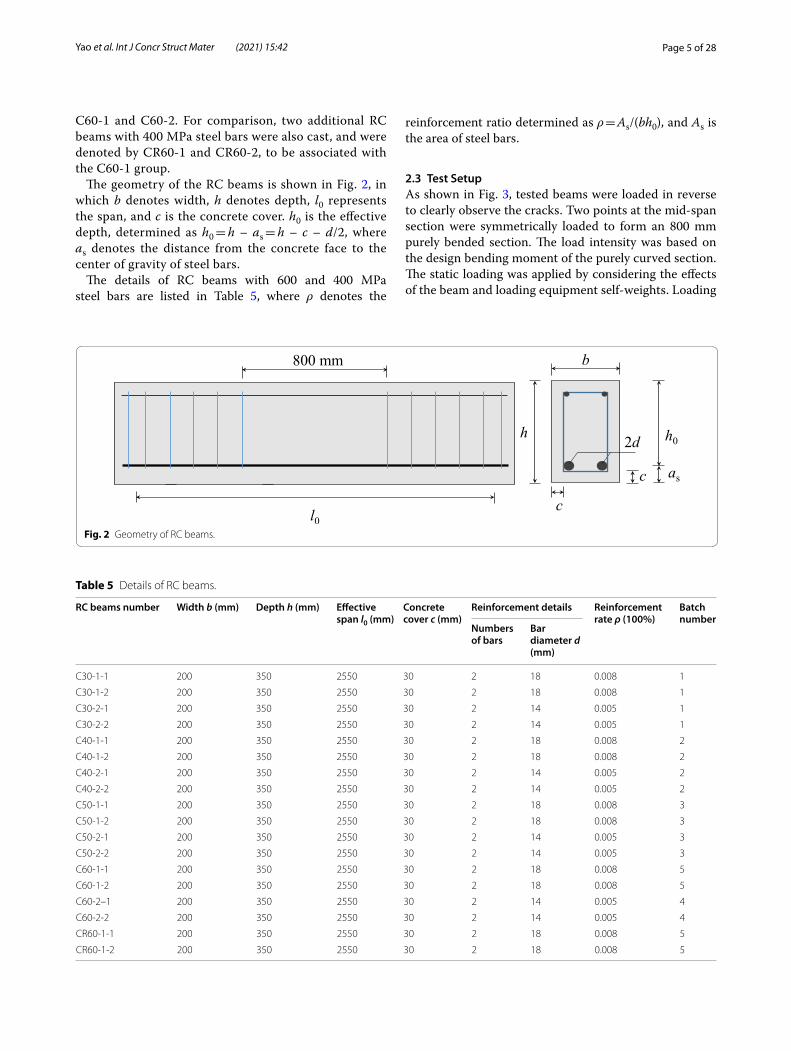
2.3 Test SetupAs shown in Fig. 3, tested beams were loaded in reverse to clearly observe the cracks. Two points at the mid-span section were symmetrically loaded to form an 800 mm purely bended section. The load intensity was based on the design bending moment of the purely curved section. The static loading was applied by considering the effects of the beam and loading equipment self-weights. Loading
Fig. 2 Geometry of RC beams.
Table 5 Details of RC beams.
RC beams number Width b (mm) Depth h (mm) Effective span l0 (mm)
Concrete cover c (mm)
Reinforcement details Reinforcement rate ρ (100%)
Batch number
Numbers of bars
Bar diameter d (mm)
C30-1-1 200 350 2550 30 2 18 0.008 1
C30-1-2 200 350 2550 30 2 18 0.008 1
C30-2-1 200 350 2550 30 2 14 0.005 1
C30-2-2 200 350 2550 30 2 14 0.005 1
C40-1-1 200 350 2550 30 2 18 0.008 2
C40-1-2 200 350 2550 30 2 18 0.008 2
C40-2-1 200 350 2550 30 2 14 0.005 2
C40-2-2 200 350 2550 30 2 14 0.005 2
C50-1-1 200 350 2550 30 2 18 0.008 3
C50-1-2 200 350 2550 30 2 18 0.008 3
C50-2-1 200 350 2550 30 2 14 0.005 3
C50-2-2 200 350 2550 30 2 14 0.005 3
C60-1-1 200 350 2550 30 2 18 0.008 5
C60-1-2 200 350 2550 30 2 18 0.008 5
C60-2–1 200 350 2550 30 2 14 0.005 4
C60-2-2 200 350 2550 30 2 14 0.005 4
CR60-1-1 200 350 2550 30 2 18 0.008 5
CR60-1-2 200 350 2550 30 2 18 0.008 5
Page 6 of 28Yao et al. Int J Concr Struct Mater (2021) 15:42
intensities at all levels were controlled by readings of the data acquisition system connected to sensors.
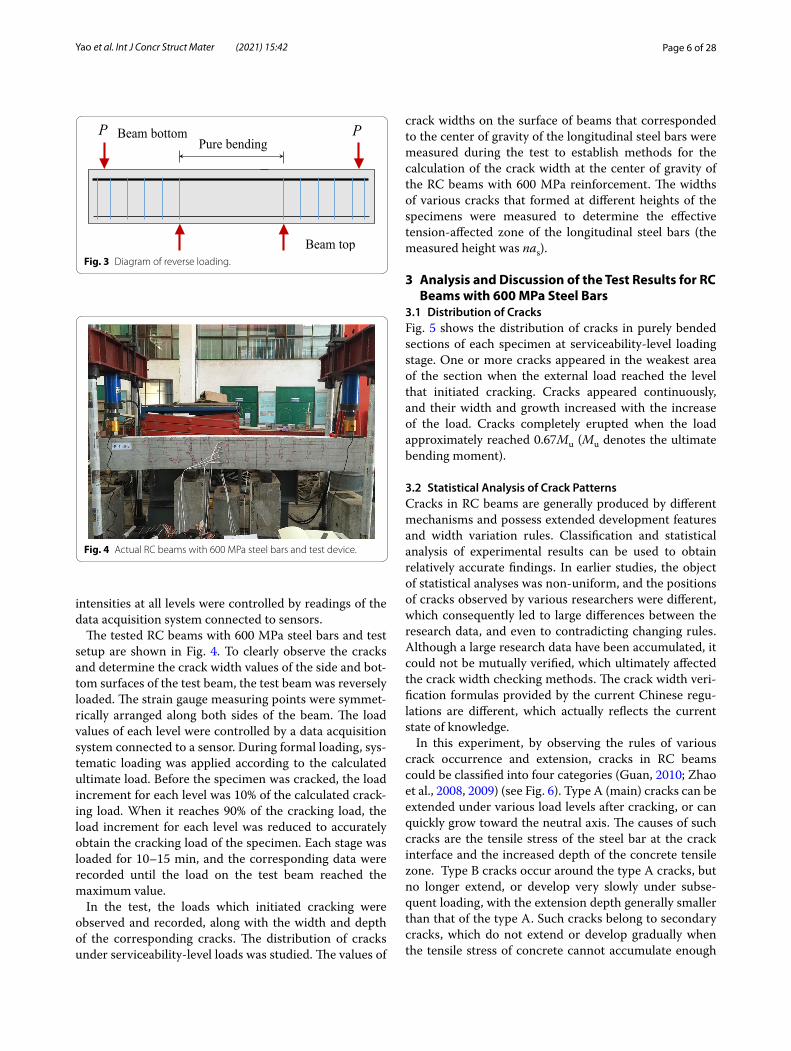
The tested RC beams with 600 MPa steel bars and test setup are shown in Fig. 4. To clearly observe the cracks and determine the crack width values of the side and bot-tom surfaces of the test beam, the test beam was reversely loaded. The strain gauge measuring points were symmet-rically arranged along both sides of the beam. The load values of each level were controlled by a data acquisition system connected to a sensor. During formal loading, sys-tematic loading was applied according to the calculated ultimate load. Before the specimen was cracked, the load increment for each level was 10% of the calculated crack-ing load. When it reaches 90% of the cracking load, the load increment for each level was reduced to accurately obtain the cracking load of the specimen. Each stage was loaded for 10–15 min, and the corresponding data were recorded until the load on the test beam reached the maximum value.
In the test, the loads which initiated cracking were observed and recorded, along with the width and depth of the corresponding cracks. The distribution of cracks under serviceability-level loads was studied. The values of
crack widths on the surface of beams that corresponded to the center of gravity of the longitudinal steel bars were measured during the test to establish methods for the calculation of the crack width at the center of gravity of the RC beams with 600 MPa reinforcement. The widths of various cracks that formed at different heights of the specimens were measured to determine the effective tension-affected zone of the longitudinal steel bars (the measured height was nas).
3 Analysis and Discussion of the Test Results for RC Beams with 600 MPa Steel Bars
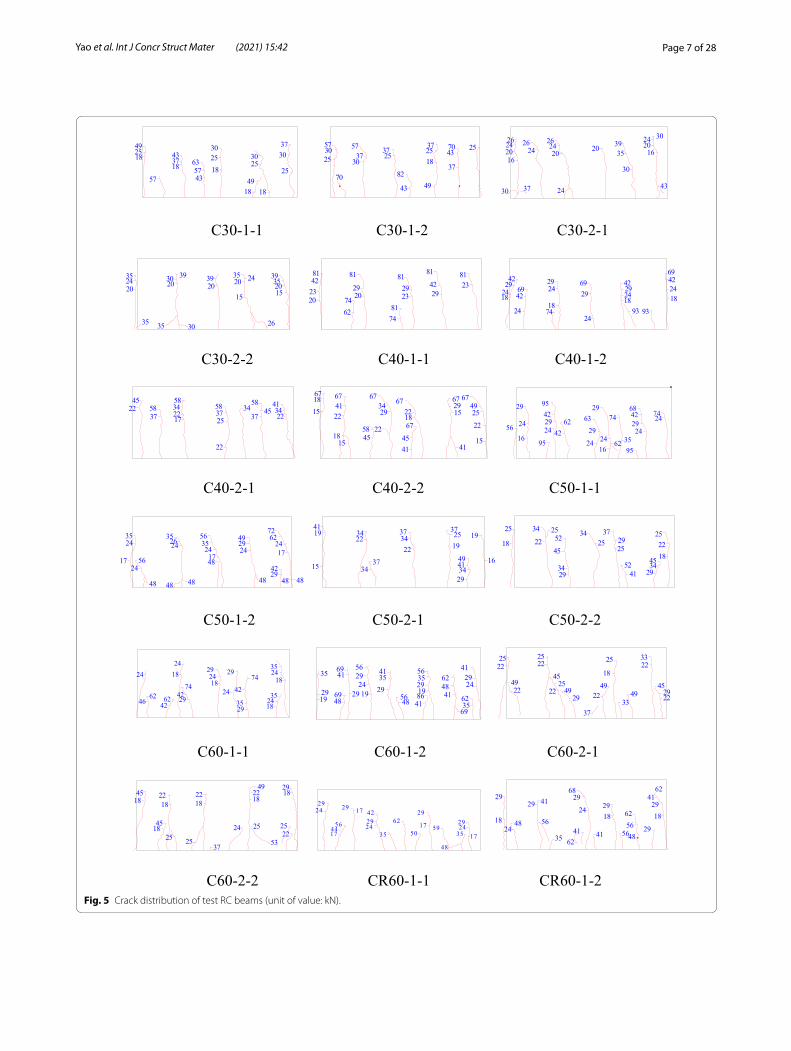
3.1 Distribution of CracksFig. 5 shows the distribution of cracks in purely bended sections of each specimen at serviceability-level loading stage. One or more cracks appeared in the weakest area of the section when the external load reached the level that initiated cracking. Cracks appeared continuously, and their width and growth increased with the increase of the load. Cracks completely erupted when the load approximately reached 0.67Mu (Mu denotes the ultimate bending moment).
3.2 Statistical Analysis of Crack PatternsCracks in RC beams are generally produced by different mechanisms and possess extended development features and width variation rules. Classification and statistical analysis of experimental results can be used to obtain relatively accurate findings. In earlier studies, the object of statistical analyses was non-uniform, and the positions of cracks observed by various researchers were different, which consequently led to large differences between the research data, and even to contradicting changing rules. Although a large research data have been accumulated, it could not be mutually verified, which ultimately affected the crack width checking methods. The crack width veri-fication formulas provided by the current Chinese regu-lations are different, which actually reflects the current state of knowledge.
In this experiment, by observing the rules of various crack occurrence and extension, cracks in RC beams could be classified into four categories (Guan, 2010; Zhao et al., 2008, 2009) (see Fig. 6). Type A (main) cracks can be extended under various load levels after cracking, or can quickly grow toward the neutral axis. The causes of such cracks are the tensile stress of the steel bar at the crack interface and the increased depth of the concrete tensile zone. Type B cracks occur around the type A cracks, but no longer extend, or develop very slowly under subse-quent loading, with the extension depth generally smaller than that of the type A. Such cracks belong to secondary cracks, which do not extend or develop gradually when the tensile stress of concrete cannot accumulate enough
Fig. 3 Diagram of reverse loading.
Fig. 4 Actual RC beams with 600 MPa steel bars and test device.
Page 7 of 28Yao et al. Int J Concr Struct Mater (2021) 15:42
C30-1-1 C30-1-2 C30-2-1
C30-2-2 C40-1-1 C40-1-2
C40-2-1 C40-2-2 C50-1-1
C50-1-2 C50-2-1 C50-2-2
C60-1-1 C60-1-2 C60-2-1
C60-2-2 CR60-1-1 CR60-1-2
3037
3025
49182530
635743
18374318
2549
5725
1818
25
37
4370
18
4943
82
2537
3037
573025
25
70
57 3716
2024 30
35
30
392020
242626
2416
2426
432437
20
30
152035
3935 2420392020
30 39352420
35 30 26
15
35
2320
4281
6274 20
29
81 81
2329
7481
2942
81
2381
939318242942
24
2969
18
2429
7424
4269
18242942
18244269
2234
41
3745
5834
3725
58
17223458
2245
22
3758 25
4967
152967
15
22
41
1822
67
4145
6722
2934
67
4558
1518
224167
151867
2474
24294268
9535
74
1624
29
6224
2963
4262
95
242942
95
16
24
29
56
1724
6272
2942
484848
242949
4817
243556
242635
484848
245617
2435
16
19
29344149
1925
37
223437
3437
2234
15
1941
1822
25
293445
4152
252925
3734
2934
45
52222534
18
25
182435
1824
2935
2918
2429
4274
1824
426246
62
7424
2924 42
352429
41
3562
69
414862
4186192935
4856
293541
242956
194869
416935 56
292919
452229
18
25
4933
2249
37
2922
25
2225
49
45
22
2225
49
2233
1829
2225
1822
1822
4518
1845
53
25
1822
49
37
24
25252429
35
48
5950
29
3524
1729
1744
56
17
17
2924 42
29 6218
2941
62
2948
566218
29
6241
24
2968
29 41
35
565641
244818
29
Fig. 5 Crack distribution of test RC beams (unit of value: kN).
Page 8 of 28Yao et al. Int J Concr Struct Mater (2021) 15:42
to cause concrete cracking under the subsequent load. Type C cracks (with fracture characteristics) occur sud-denly under a certain load and quickly reach a certain depth that is not developed further under subsequent loading. The primary reason for such cracks are as fol-lows. When loaded to a certain load level, the concrete cross section between the two main cracks (whose spac-ing is less than twice the average crack spacing) sud-denly cracks due to stress concentration caused by some defects and quickly reaches a certain depth, but does not develop any further under the action of subsequent loads. Type D (secondary) cracks occur at the center of gravity of longitudinal tensile reinforcement due to the second-ary tensile stresses caused by bond slip. Type D cracks can also occur next to the type A main cracks, but the extension depth develops slowly at the longitudinal ten-sile reinforcement center of gravity, or at the beam bot-tom with the extension depth below the center of gravity of the longitudinal tensile reinforcement.
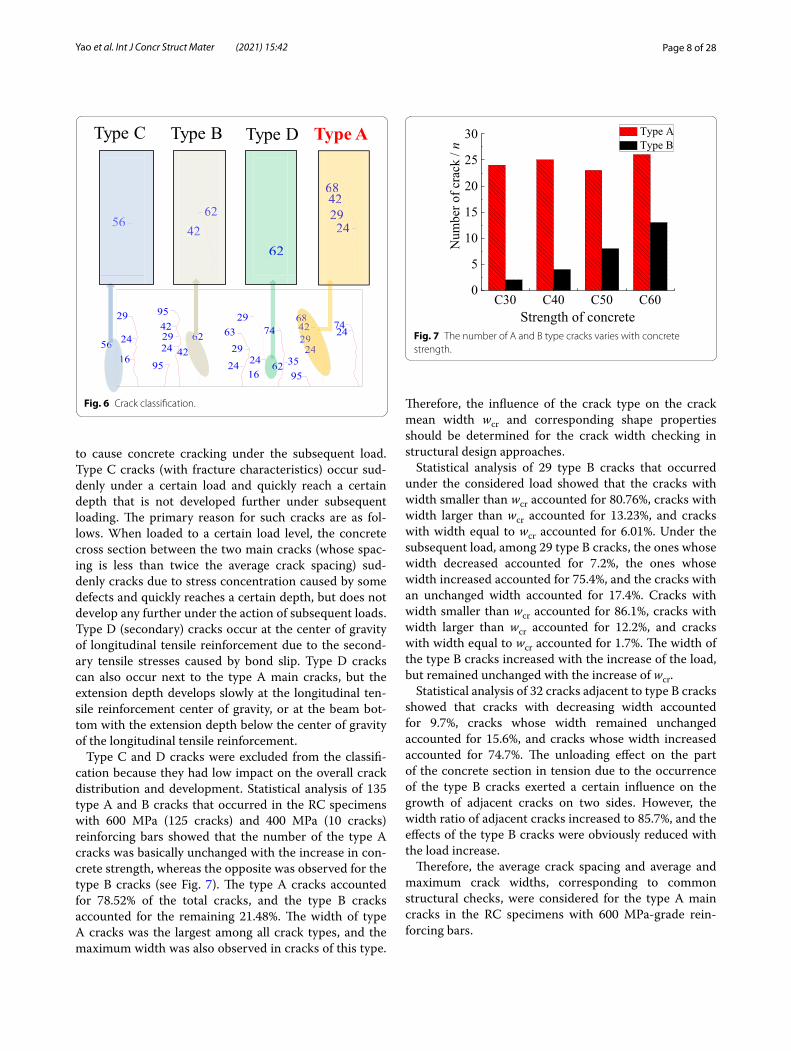
Type C and D cracks were excluded from the classifi-cation because they had low impact on the overall crack distribution and development. Statistical analysis of 135 type A and B cracks that occurred in the RC specimens with 600 MPa (125 cracks) and 400 MPa (10 cracks) reinforcing bars showed that the number of the type A cracks was basically unchanged with the increase in con-crete strength, whereas the opposite was observed for the type B cracks (see Fig. 7). The type A cracks accounted for 78.52% of the total cracks, and the type B cracks accounted for the remaining 21.48%. The width of type A cracks was the largest among all crack types, and the maximum width was also observed in cracks of this type.
Therefore, the influence of the crack type on the crack mean width wcr and corresponding shape properties should be determined for the crack width checking in structural design approaches.
Statistical analysis of 29 type B cracks that occurred under the considered load showed that the cracks with width smaller than wcr accounted for 80.76%, cracks with width larger than wcr accounted for 13.23%, and cracks with width equal to wcr accounted for 6.01%. Under the subsequent load, among 29 type B cracks, the ones whose width decreased accounted for 7.2%, the ones whose width increased accounted for 75.4%, and the cracks with an unchanged width accounted for 17.4%. Cracks with width smaller than wcr accounted for 86.1%, cracks with width larger than wcr accounted for 12.2%, and cracks with width equal to wcr accounted for 1.7%. The width of the type B cracks increased with the increase of the load, but remained unchanged with the increase of wcr.
Statistical analysis of 32 cracks adjacent to type B cracks showed that cracks with decreasing width accounted for 9.7%, cracks whose width remained unchanged accounted for 15.6%, and cracks whose width increased accounted for 74.7%. The unloading effect on the part of the concrete section in tension due to the occurrence of the type B cracks exerted a certain influence on the growth of adjacent cracks on two sides. However, the width ratio of adjacent cracks increased to 85.7%, and the effects of the type B cracks were obviously reduced with the load increase.
Therefore, the average crack spacing and average and maximum crack widths, corresponding to common structural checks, were considered for the type A main cracks in the RC specimens with 600 MPa-grade rein-forcing bars.
2474
24294268
9535
74
1624
29
6224
2963
4262
95
24294295
16
24
29
562
62622
6622
6
666
4262
Type B
24294268
Type A
56
62
Type DType C
4262
62
24294268
56
16
16
16 24
294268
2246
2246
Fig. 6 Crack classification.
C30 C40 C50 C600
5
10
15
20
25
30
Num
ber o
f cra
ck / n
Strength of concrete
Type A Type B
Fig. 7 The number of A and B type cracks varies with concrete strength.
Page 9 of 28Yao et al. Int J Concr Struct Mater (2021) 15:42
The outcomes of statistical analysis of 572 differ-ent cracks that appeared in concrete specimens with a 335 MPa-grade reinforcing bars can be found in Zhao et al. (2008), (2009) and Guan (2010). The analysis results are consistent with the ones presented in this paper. Namely, the crack shape characteristics that corre-spond to the crack width calculation in structural design approaches occurred due to the continuous increase of the cracked concrete tensile area depth and tensile stress
in reinforcement. Cracks continued to extend toward neutral axis. The type B cracks were the main one that controlled the overall development and distribution of cracks in beams.
3.3 Effective Tensile Area of Concrete SectionsA gripping force of longitudinal tensile reinforcement acting on surrounding concrete restricts its shrinkage on both sides of a crack, which affects the generation
a GB50010 (GB50010,2010)
b DL/T 5057, SL/T 191, JTJ 267 and TB 10002.3 (DL/T 5057, 1996, 2009; SL/T 191-2008, 2009; JTJ 267-98, 1998; TB 10002.3-2005, 2005 )
c Zhao and Guan (Guan et al, 2011)
Ate = b·hte
hte
b
hAs
hte= 0.5h Ate = b· hte
hte
b
hAs
hte= 0.5 h
Ate
hte
b
h0
as
hte= 2as
Ate
hte
b
h0
as
hte= 2as
Ate = b·hte
hte
b
5d
hte= 5.5d+as
c
hte ≤ 0.5h
5.5d
as
Ate = b· hte
hte
b
hte= 5.5d+s/2+as hte ≤ 0.5h
5.5d
cs
as
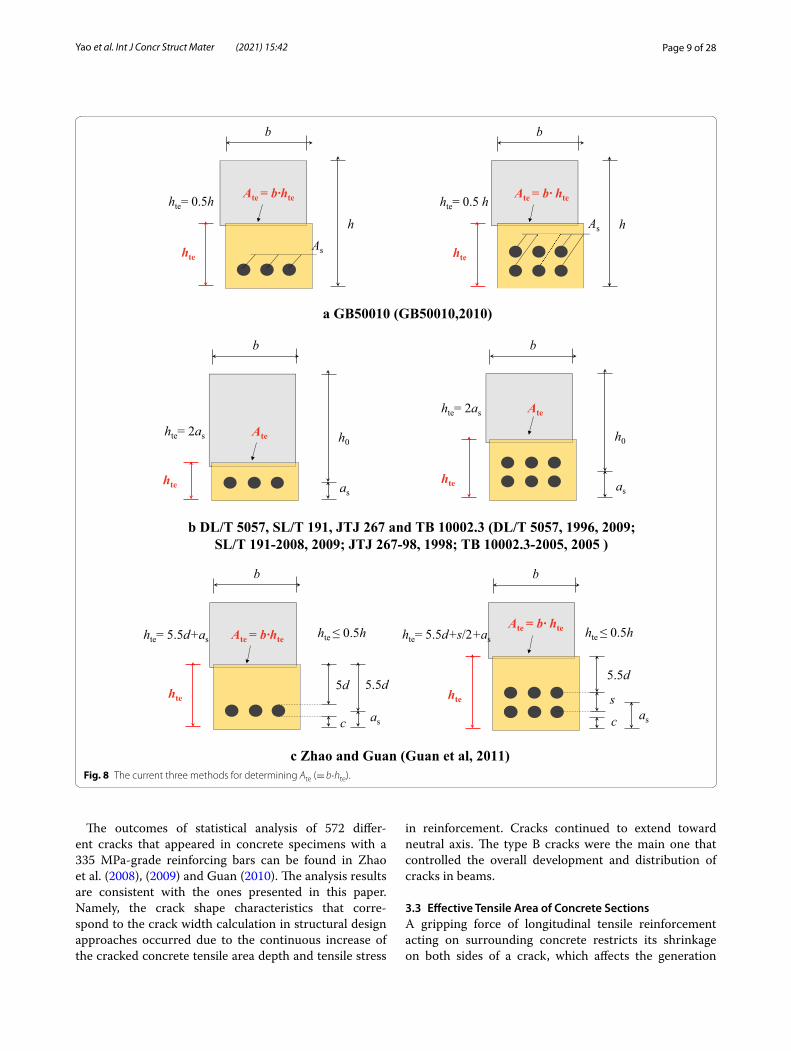
Fig. 8 The current three methods for determining Ate (= b·hte).
Page 10 of 28Yao et al. Int J Concr Struct Mater (2021) 15:42
and development of new cracks. Therefore, to establish a reasonable crack width calculation formula, the effect of longitudinal tensile reinforcement on crack develop-ment should be considered in a confined concrete area. For this reason, scholars applied different perspectives by using different research methods. A method was pro-posed for the calculation of the effective restraint zone Ate of longitudinal tensile reinforcement, by consider-ing different influencing factors. In general, Ate can be roughly classified in three ways: (1) as an area associated with the section depth; (2) as an area consistent with the longitudinal tensile reinforcement center of gravity; and (3) as an area related to the diameter of longitudinal ten-sile reinforcement d. The first two categories are conveni-ent for practical applications. The rationality of the Ate value is influenced by uniformity, cross-sectional shape, and position of the tensile reinforcement. The third cat-egory corresponds to the constraint mechanism imposed by longitudinal tensile reinforcement to the surrounding concrete, which has a clear physical significance. Fig. 8 schematically shows the values of Ate and effective tensile depth hte (discussed below) for three types of Ate and hte provided in different specifications and approaches.
a Case one b Case two c Case three
0.0 0.1 0.2 0.3 0.4 0.5 0.6 0.70.00
0.03
0.06
0.09
0.12
0.15
0.18
0.21 C60-1-2
w cr/m
m
nh (0 < n <1)
280MPa320MPa360MPa400MPa440MPa
0.0 0.2 0.4 0.6 0.80.00
0.04
0.08
0.12
0.16
0.20
0.24
0.28 C50-1-2
nh (0 < n <1)
w cr/m
m
280MPa320MPa360MPa400MPa440MPa
0.0 0.2 0.4 0.6 0.80.00
0.05
0.10
0.15
0.20
0.25 C30-1-2
nh (0 < n <1)
wcr/m
m
280MPa320MPa360MPa400MPa440MPa
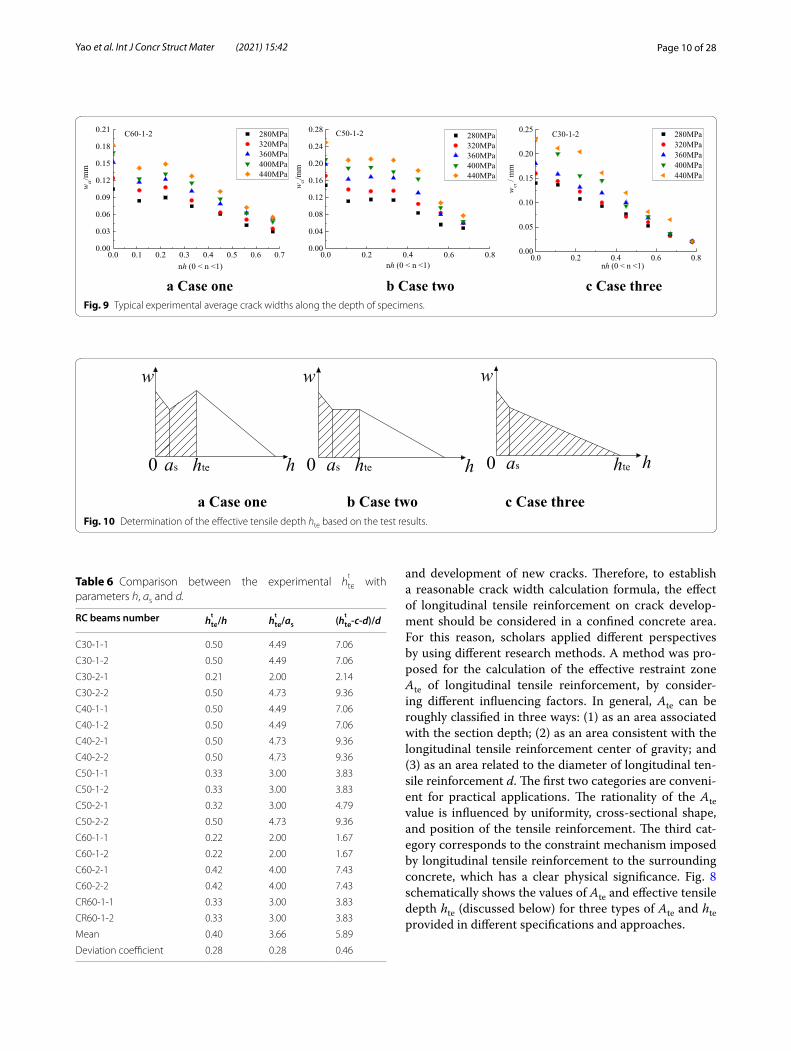
Fig. 9 Typical experimental average crack widths along the depth of specimens.
a Case one b Case two c Case three Fig. 10 Determination of the effective tensile depth hte based on the test results.
Table 6 Comparison between the experimental ht
te with parameters h, as and d.
RC beams number ht
te/h h
t
te/as (h
t
te-c-d)/d
C30-1-1 0.50 4.49 7.06
C30-1-2 0.50 4.49 7.06
C30-2-1 0.21 2.00 2.14
C30-2-2 0.50 4.73 9.36
C40-1-1 0.50 4.49 7.06
C40-1-2 0.50 4.49 7.06
C40-2-1 0.50 4.73 9.36
C40-2-2 0.50 4.73 9.36
C50-1-1 0.33 3.00 3.83
C50-1-2 0.33 3.00 3.83
C50-2-1 0.32 3.00 4.79
C50-2-2 0.50 4.73 9.36
C60-1-1 0.22 2.00 1.67
C60-1-2 0.22 2.00 1.67
C60-2-1 0.42 4.00 7.43
C60-2-2 0.42 4.00 7.43
CR60-1-1 0.33 3.00 3.83
CR60-1-2 0.33 3.00 3.83
Mean 0.40 3.66 5.89
Deviation coefficient 0.28 0.28 0.46
Page 11 of 28Yao et al. Int J Concr Struct Mater (2021) 15:42
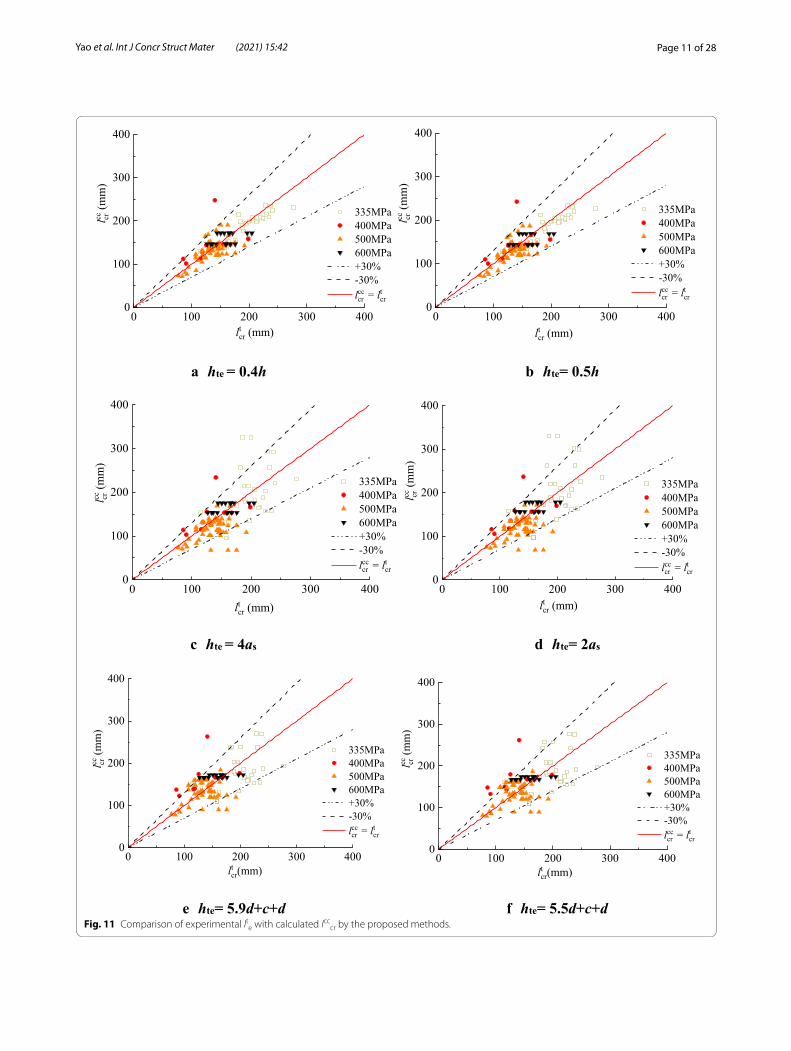
Fig. 11 Comparison of experimental lte with calculated lcccr by the proposed methods.
Page 12 of 28Yao et al. Int J Concr Struct Mater (2021) 15:42
In this study, the effective tension-affected zone of longitudinal steel bars was experimentally determined. Widths of various cracks that formed under the normal use load level (0.4Mu to 0.7Mu) were measured at differ-ent depths of the test specimens. Typical experimentally obtained average crack widths are shown in Fig. 9, along with the depth of specimens.
Fig. 10 illustrates the proposed determination approach for the effective tensile depth hte of the tested beams. By considering the test results shown in Fig. 9, the follow-ing three cases can be established to determine the effec-tive tensile depth of a cracked section hte, according to the change characteristics of a crack width and extension length range of the main crack. (1) Due to the restraint effect of the longitudinal tensile reinforcement, a crack width in the web gradually decreases after reaching its
maximum value, and the depth of the web with the maxi-mum crack width represents the effective tensile depth of the beam hte. (2) A maximum crack width appears at the beam bottom, but there is still a certain crack width at the web that does not exhibiting a linear decrease; thus, the depth corresponding to the maximum crack width at the web may be taken as the effective tensile depth of the beam hte. (3) In the range of a crack extension length, a crack width decreases approximately linearly, and the actual extension depth of a crack can be considered as the effec-tive tensile zone depth of the beam hte.
Statistical analysis of cracks obtained for the loading range of 0.4Mu to 0.7Mu was conducted, and the relation-ships between the measured effective tensile depths for 600 MPa RC beams, ht
te , and the corresponding h, as, and
d values are shown in Table 6.
Table 7 Comparison of experimental ltc with calculated lcccr by the proposed methods.
Proposed methods hte = 0.4 h hte = 0.5 h hte = 4as hte = 2as hte = 5.9d + c + d hte = 5.5d + c + d
335 MPa Mean 1.06 1.07 1.08 1.06 1.13 1.11
Deviation coefficient 0.08 0.08 0.27 0.27 0.22 0.23
400 MPa Mean 0.95 0.96 0.92 0.90 0.82 0.79
Deviation coefficient 0.22 0.22 0.20 0.20 0.23 0.24
500 MPa Mean 1.04 1.06 1.19 1.17 1.04 1.03
Deviation coefficient 0.13 0.13 0.26 0.27 0.23 0.23
600 MPa Mean 1.01 1.03 0.97 0.96 0.95 0.94
Deviation coefficient 0.12 0.12 0.12 0.12 0.13 0.13
Sum Mean 1.03 1.05 1.11 1.09 1.03 1.02
Deviation coefficient 0.13 0.13 0.26 0.26 0.23 0.23
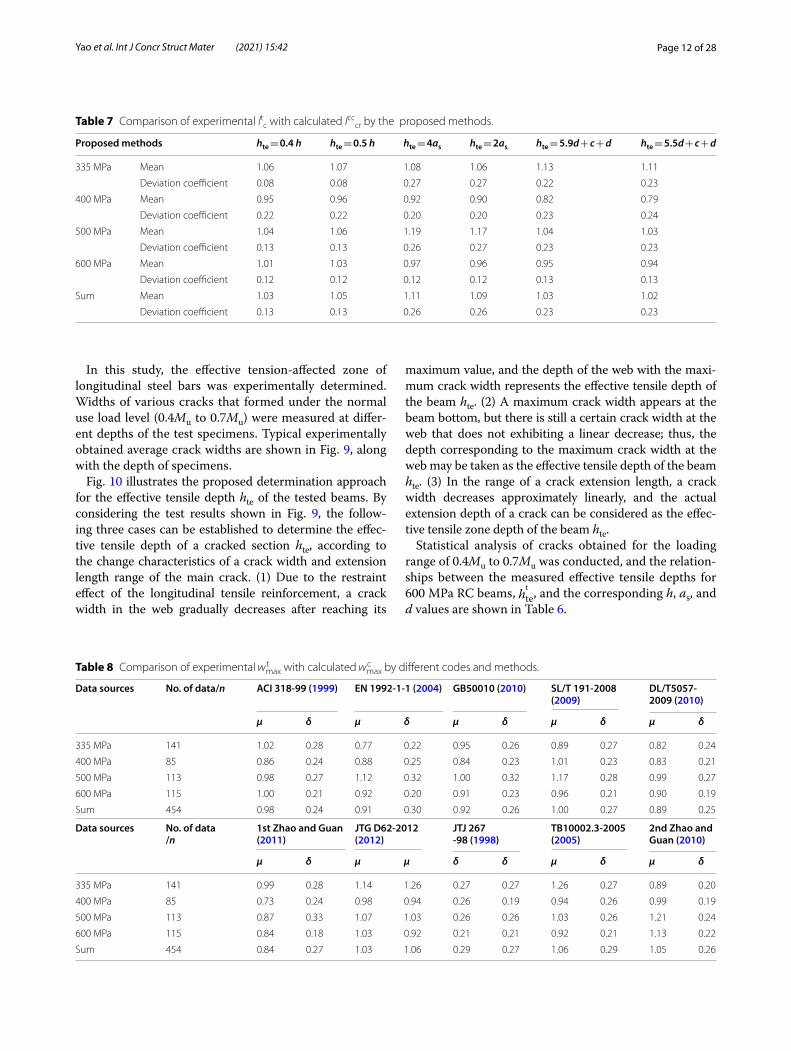
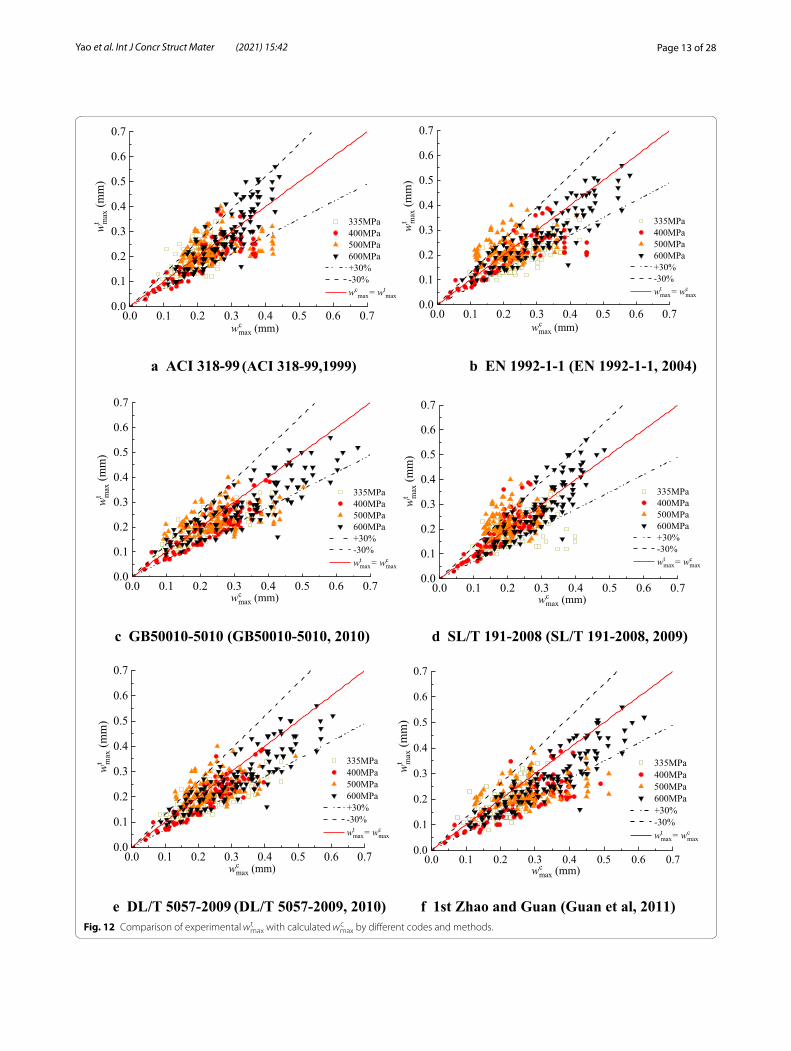
Table 8 Comparison of experimental wtmax with calculated wc
max by different codes and methods.
Data sources No. of data/n ACI 318-99 (1999) EN 1992-1-1 (2004) GB50010 (2010) SL/T 191-2008 (2009)
DL/T5057-2009 (2010)
μ δ μ δ μ δ μ δ μ δ
335 MPa 141 1.02 0.28 0.77 0.22 0.95 0.26 0.89 0.27 0.82 0.24
400 MPa 85 0.86 0.24 0.88 0.25 0.84 0.23 1.01 0.23 0.83 0.21
500 MPa 113 0.98 0.27 1.12 0.32 1.00 0.32 1.17 0.28 0.99 0.27
600 MPa 115 1.00 0.21 0.92 0.20 0.91 0.23 0.96 0.21 0.90 0.19
Sum 454 0.98 0.24 0.91 0.30 0.92 0.26 1.00 0.27 0.89 0.25
Data sources No. of data /n
1st Zhao and Guan (2011)
JTG D62-2012 (2012)
JTJ 267-98 (1998)
TB10002.3-2005 (2005)
2nd Zhao and Guan (2010)
μ δ μ μ δ δ μ δ μ δ
335 MPa 141 0.99 0.28 1.14 1.26 0.27 0.27 1.26 0.27 0.89 0.20
400 MPa 85 0.73 0.24 0.98 0.94 0.26 0.19 0.94 0.26 0.99 0.19
500 MPa 113 0.87 0.33 1.07 1.03 0.26 0.26 1.03 0.26 1.21 0.24
600 MPa 115 0.84 0.18 1.03 0.92 0.21 0.21 0.92 0.21 1.13 0.22
Sum 454 0.84 0.27 1.03 1.06 0.29 0.27 1.06 0.29 1.05 0.26
Page 13 of 28Yao et al. Int J Concr Struct Mater (2021) 15:42
0.0 0.1 0.2 0.3 0.4 0.5 0.6 0.70.0
0.1
0.2
0.3
0.4
0.5
0.6
0.7
335MPa 400MPa 500MPa 600MPa +30% -30%wc
max= wtmax
wcmax (mm)
wt max
(mm
)
0.0 0.1 0.2 0.3 0.4 0.5 0.6 0.70.0
0.1
0.2
0.3
0.4
0.5
0.6
0.7
wt m
ax (m
m)
wcmax (mm)
335MPa 400MPa 500MPa 600MPa +30% -30%wt
max= wcmax
-1-1 (EN 1992-1-1, 2004)
0.0 0.1 0.2 0.3 0.4 0.5 0.6 0.70.0
0.1
0.2
0.3
0.4
0.5
0.6
0.7
wt max
(mm
)
wcmax (mm)
335MPa 400MPa 500MPa 600MPa +30% -30%wt
max= wcmax
0.0 0.1 0.2 0.3 0.4 0.5 0.6 0.70.0
0.1
0.2
0.3
0.4
0.5
0.6
0.7wt m
ax (m
m)
wcmax (mm)
335MPa 400MPa 500MPa 600MPa +30% -30%wt
max= wcmax
c -5010 (GB50010-5010, 2010) /T 191-2008 (SL/T 191-2008, 2009)
0.0 0.1 0.2 0.3 0.4 0.5 0.6 0.70.0
0.1
0.2
0.3
0.4
0.5
0.6
0.7
335MPa 400MPa 500MPa 600MPa +30% -30%wt
max= wcmax
wt m
ax (m
m)
wcmax (mm)
0.0 0.1 0.2 0.3 0.4 0.5 0.6 0.70.0
0.1
0.2
0.3
0.4
0.5
0.6
0.7
wcmax (mm)
wt m
ax (m
m)
335MPa 400MPa 500MPa 600MPa +30% -30%wt
max= wcmax
/T 5057-2009 (DL/T 5057-2009, 2010) (Guan et al, 2011)
(ACI 318-99,1999)
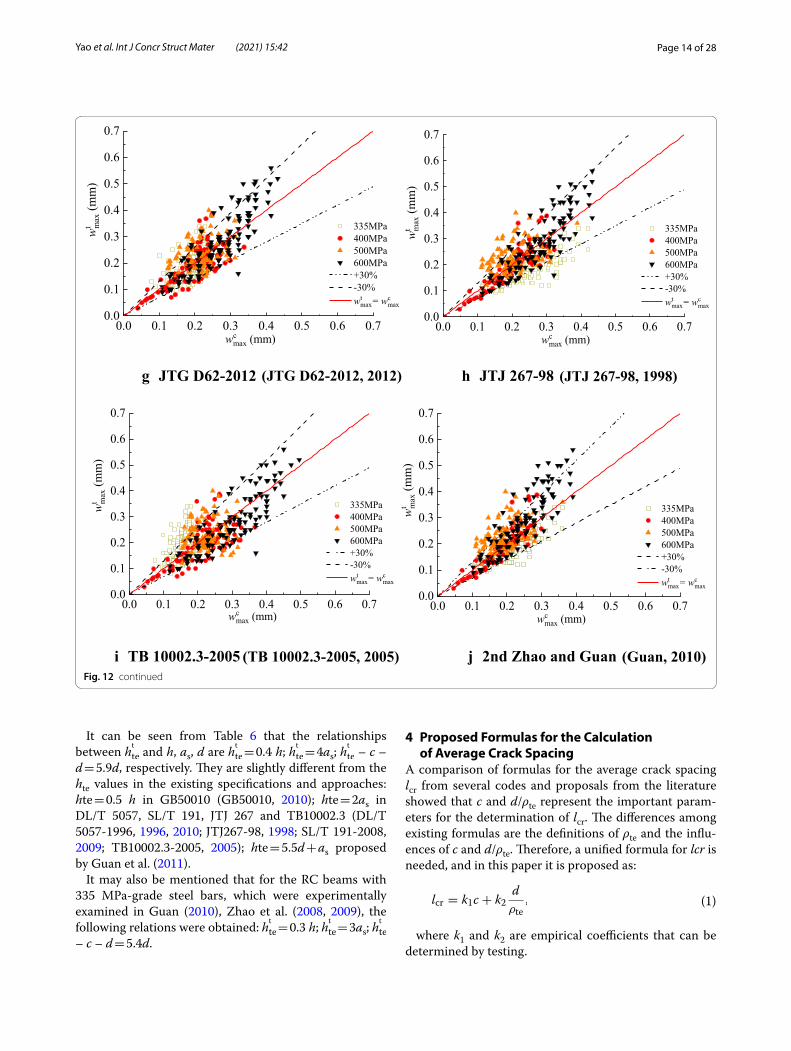
Fig. 12 Comparison of experimental wtmax with calculated wc
max by different codes and methods.
Page 14 of 28Yao et al. Int J Concr Struct Mater (2021) 15:42
It can be seen from Table 6 that the relationships between ht
te and h, as, d are ht
te = 0.4 h; ht
te = 4as; ht
te – c – d = 5.9d, respectively. They are slightly different from the hte values in the existing specifications and approaches: hte = 0.5 h in GB50010 (GB50010, 2010); hte = 2as in DL/T 5057, SL/T 191, JTJ 267 and TB10002.3 (DL/T 5057-1996, 1996, 2010; JTJ267-98, 1998; SL/T 191-2008, 2009; TB10002.3-2005, 2005); hte = 5.5d + as proposed by Guan et al. (2011).
It may also be mentioned that for the RC beams with 335 MPa-grade steel bars, which were experimentally examined in Guan (2010), Zhao et al. (2008, 2009), the following relations were obtained: ht
te = 0.3 h; ht
te = 3as; ht
te – c – d = 5.4d.
0.0 0.1 0.2 0.3 0.4 0.5 0.6 0.70.0
0.1
0.2
0.3
0.4
0.5
0.6
0.7
wt m
ax (m
m)
wcmax (mm)
335MPa 400MPa 500MPa 600MPa +30% -30%wt
max= wcmax
0.0 0.1 0.2 0.3 0.4 0.5 0.6 0.70.0
0.1
0.2
0.3
0.4
0.5
0.6
0.7
wt m
ax (m
m)
wcmax (mm)
335MPa 400MPa 500MPa 600MPa +30% -30%wt
max= wcmax
0.0 0.1 0.2 0.3 0.4 0.5 0.6 0.70.0
0.1
0.2
0.3
0.4
0.5
0.6
0.7
wt m
ax (m
m)
wcmax (mm)
335MPa 400MPa 500MPa 600MPa +30% -30%wt
max= wcmax
0.0 0.1 0.2 0.3 0.4 0.5 0.6 0.70.0
0.1
0.2
0.3
0.4
0.5
0.6
0.7
335MPa 400MPa 500MPa 600MPa +30% -30%wt
max= wcmax
wt m
ax (m
m)
wcmax (mm)
(JTG D62-2012, 2012) (JTJ 267-98, 1998)
(TB 10002.3-2005, 2005) (Guan, 2010)Fig. 12 continued
4 Proposed Formulas for the Calculation of Average Crack Spacing
A comparison of formulas for the average crack spacing lcr from several codes and proposals from the literature showed that c and d/ρte represent the important param-eters for the determination of lcr. The differences among existing formulas are the definitions of ρte and the influ-ences of c and d/ρte. Therefore, a unified formula for lcr is needed, and in this paper it is proposed as:
where k1 and k2 are empirical coefficients that can be determined by testing.
(1)lcr = k1c + k2d
ρte,
Page 15 of 28Yao et al. Int J Concr Struct Mater (2021) 15:42
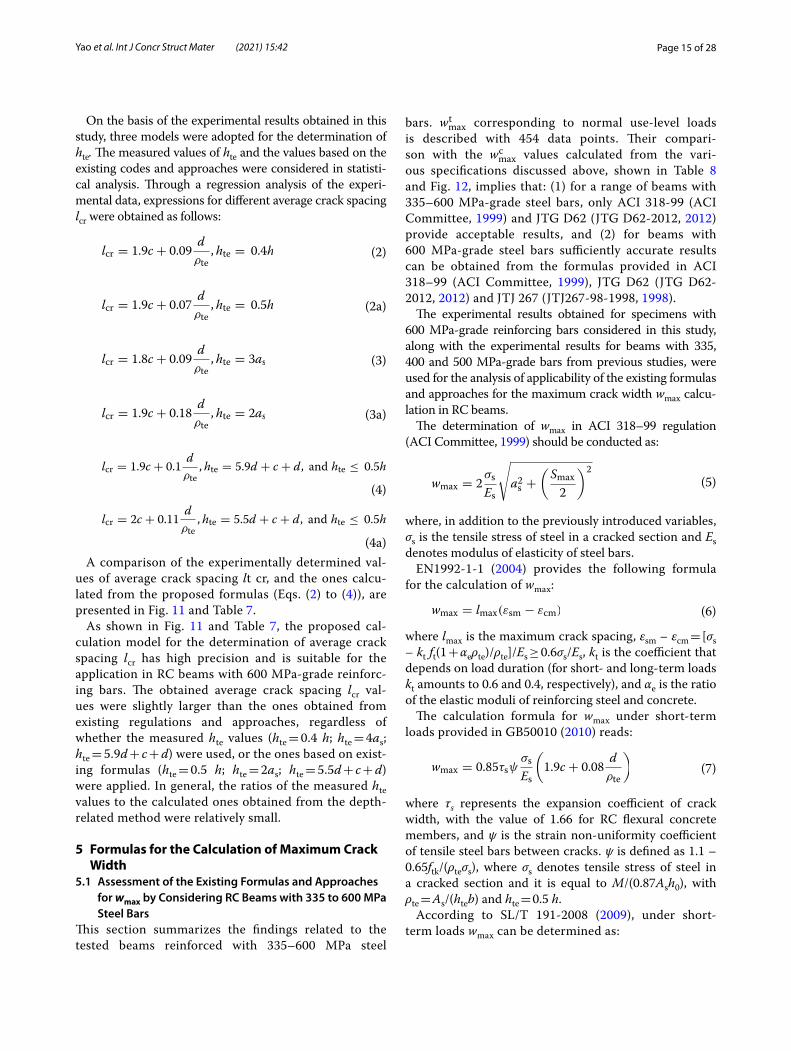
On the basis of the experimental results obtained in this study, three models were adopted for the determination of hte. The measured values of hte and the values based on the existing codes and approaches were considered in statisti-cal analysis. Through a regression analysis of the experi-mental data, expressions for different average crack spacing lcr were obtained as follows:
A comparison of the experimentally determined val-ues of average crack spacing lt cr, and the ones calcu-lated from the proposed formulas (Eqs. (2) to (4)), are presented in Fig. 11 and Table 7.
As shown in Fig. 11 and Table 7, the proposed cal-culation model for the determination of average crack spacing lcr has high precision and is suitable for the application in RC beams with 600 MPa-grade reinforc-ing bars. The obtained average crack spacing lcr val-ues were slightly larger than the ones obtained from existing regulations and approaches, regardless of whether the measured hte values (hte = 0.4 h; hte = 4as; hte = 5.9d + c + d) were used, or the ones based on exist-ing formulas (hte = 0.5 h; hte = 2as; hte = 5.5d + c + d) were applied. In general, the ratios of the measured hte values to the calculated ones obtained from the depth-related method were relatively small.
5 Formulas for the Calculation of Maximum Crack Width
5.1 Assessment of the Existing Formulas and Approaches for wmax by Considering RC Beams with 335 to 600 MPa Steel Bars
This section summarizes the findings related to the tested beams reinforced with 335–600 MPa steel
(2)lcr = 1.9c + 0.09d
ρte, hte = 0.4h
(2a)lcr = 1.9c + 0.07d
ρte, hte = 0.5h
(3)lcr = 1.8c + 0.09d
ρte, hte = 3as
(3a)lcr = 1.9c + 0.18d
ρte, hte = 2as
(4)
lcr = 1.9c + 0.1d
ρte, hte = 5.9d + c + d, and hte ≤ 0.5h
(4a)
lcr = 2c + 0.11d
ρte, hte = 5.5d + c + d, and hte ≤ 0.5h
bars. wtmax corresponding to normal use-level loads
is described with 454 data points. Their compari-son with the wc
max values calculated from the vari-ous specifications discussed above, shown in Table 8 and Fig. 12, implies that: (1) for a range of beams with 335–600 MPa-grade steel bars, only ACI 318-99 (ACI Committee, 1999) and JTG D62 (JTG D62-2012, 2012) provide acceptable results, and (2) for beams with 600 MPa-grade steel bars sufficiently accurate results can be obtained from the formulas provided in ACI 318–99 (ACI Committee, 1999), JTG D62 (JTG D62-2012, 2012) and JTJ 267 (JTJ267-98-1998, 1998).
The experimental results obtained for specimens with 600 MPa-grade reinforcing bars considered in this study, along with the experimental results for beams with 335, 400 and 500 MPa-grade bars from previous studies, were used for the analysis of applicability of the existing formulas and approaches for the maximum crack width wmax calcu-lation in RC beams.
The determination of wmax in ACI 318–99 regulation (ACI Committee, 1999) should be conducted as:
where, in addition to the previously introduced variables, σs is the tensile stress of steel in a cracked section and Es denotes modulus of elasticity of steel bars.
EN1992-1-1 (2004) provides the following formula for the calculation of wmax:
where lmax is the maximum crack spacing, εsm – εcm = [σs – kt ft(1 + αeρte)/ρte]/Es ≥ 0.6σs/Es, kt is the coefficient that depends on load duration (for short- and long-term loads kt amounts to 0.6 and 0.4, respectively), and αe is the ratio of the elastic moduli of reinforcing steel and concrete.
The calculation formula for wmax under short-term loads provided in GB50010 (2010) reads:
where τs represents the expansion coefficient of crack width, with the value of 1.66 for RC flexural concrete members, and ψ is the strain non-uniformity coefficient of tensile steel bars between cracks. ψ is defined as 1.1 – 0.65ftk/(ρteσs), where σs denotes tensile stress of steel in a cracked section and it is equal to M/(0.87Ash0), with ρte = As/(hteb) and hte = 0.5 h.
According to SL/T 191-2008 (2009), under short-term loads wmax can be determined as:
(5)wmax = 2σs
Es
√
a2s +(
Smax
2
)2
(6)wmax = lmax(εsm − εcm)
(7)wmax = 0.85τsψσs
Es
(
1.9c + 0.08d
ρte
)

Page 16 of 28Yao et al. Int J Concr Struct Mater (2021) 15:42
for ρte = As/(hteb), hte = 2as.Under short-term loads, based on DL/T 5057-2009
(2010), wmax should be calculated as:
for ψ = 1 – 1.1ftk/(ρte σs) and hte = 2as.Calculation formula for wmax, applicable to large-size
RC members with large concrete cover, was proposed by Guan et al. (2011):
(8)wmax = 1.4σs
Es
(
30+ c + 0.07d
ρte
)
(9)wmax = 1.27ψσs
Es
(
2.2c + 0.09d
ρte
)
(10)
wmax = 1.60.7
0.875+ 0.00025h
σs
Es
(
1−0.5ft
ρteσs
)
(
1.9c + 0.014d
ρte
h
as
)
where hte = 5.5d + as applies for a single row of steel bars and hte = 5.5d + s + as applies for two rows of steel bars, as shown in Fig. 8c.
Formula for wmax under short-term loads based on JTG D62 provisions (JTG D62-2012, 2012) reads:
where C1 is the surface shape coefficient of reinforc-ing bars and C2 denotes the coefficient related to the mechanical properties of a member.
According to JTJ 267 (1998), under short-term loads wmax can be obtained as:
for hte = 2as.TB10002.3 (2005) provides the following expression
for the determination of wmax under short-term loads:
where K1 depends on bar surface shape (K1 = 0.8 for ribbed bars), and K2 depends on load characteristics. K2 is defined as (1 + αM1/M + 0.5M2/M), where α = 0.3 for ribbed bars, M1 is the bending moment under live load action, M2 is the bending moment under constant load action and M is the bending moment under the action of all loads. Furthermore, γ is the ratio of a distance between the neutral axis and concrete face and a dis-tance between the neutral axis and center of gravity of reinforced bars (for beams it is equal to 1.1). For Eq. (13), hte = 2as applies.
The calculation formula for wmax, applicable to large-size RC members with large concrete cover, was pro-posed by Guan et al. (2010):
where hte is introduced above.Equations (5) to (10) are semi-theoretical and semi-
empirical. The following formulas, i.e., Eqs. (11) to (14), can be considered as statistical ones. Accordingly, the sub-figures (a) ~ (f ) in Fig. 12 are the comparative anal-ysis results of calculated values and measured values based on semi-theoretical and semi-empirical modes. In Fig. 12, the sub-figures (g) ~( j) are the comparative analy-sis results of calculated and measured values based on a mathematical statistics model.
From Table 8 and Fig. 12, it can be deduced that: (1) for the beams with 335–600 MPa-grade steel bars, only ACI
(11)wmax = C1C2
σs
Es
(
30+ d
0.28+ 10ρ
)
(12)wmax = C1C2
σs
Es
(
c + d
0.3+ 1.4ρte
)
(13)wmax = K1K2γσs
Es
(
80+8+ 0.4d√ρte
)
(14)wmax =σs
Es
(
0.76c + d
0.3+ 1.4ρte
)
0.0 0.3 0.6 0.9 1.2 1.5 1.8 2.1 2.40
100
200
300
400
500
Freq
uenc
y
wi /wcr
Normal distribuion
Fig. 13 Probability distribution histogram of wi/wcr.
Fig. 14 Relationship between γs and M.
Page 17 of 28Yao et al. Int J Concr Struct Mater (2021) 15:42
318-99 (ACI Committee, 1999) and JTG D62 (JTGD62-2012, 2012) hold good and provide satisfactory results, and (2) for beams with 600 MPa-grade steel bars suf-ficiently accurate results can be obtained from the for-mulas provided in ACI 318-99 (ACI Committee, 1999), JTG D62 (JTG D62-2012, 2012) and JTJ 267 (JTJ267-98, 1998).
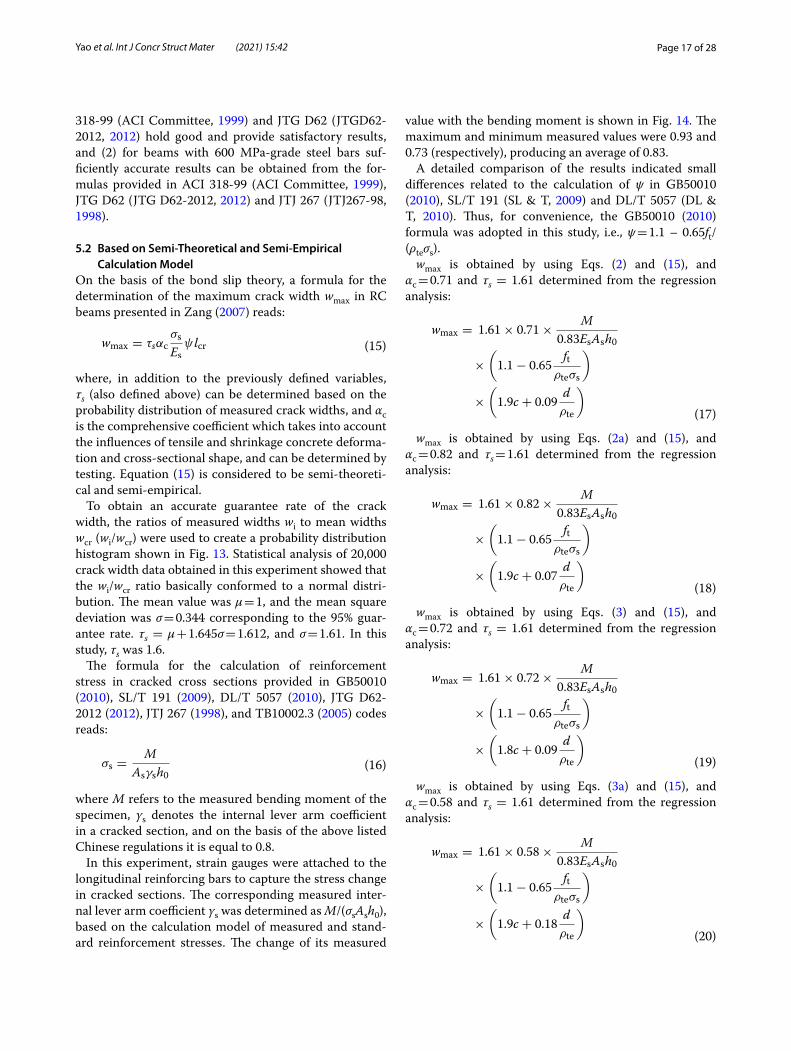
5.2 Based on Semi-Theoretical and Semi-Empirical Calculation Model
On the basis of the bond slip theory, a formula for the determination of the maximum crack width wmax in RC beams presented in Zang (2007) reads:
where, in addition to the previously defined variables, τs (also defined above) can be determined based on the probability distribution of measured crack widths, and αc is the comprehensive coefficient which takes into account the influences of tensile and shrinkage concrete deforma-tion and cross-sectional shape, and can be determined by testing. Equation (15) is considered to be semi-theoreti-cal and semi-empirical.
To obtain an accurate guarantee rate of the crack width, the ratios of measured widths wi to mean widths wcr (wi/wcr) were used to create a probability distribution histogram shown in Fig. 13. Statistical analysis of 20,000 crack width data obtained in this experiment showed that the wi/wcr ratio basically conformed to a normal distri-bution. The mean value was μ = 1, and the mean square deviation was σ = 0.344 corresponding to the 95% guar-antee rate. τs = µ + 1.645σ = 1.612, and σ = 1.61. In this study, τs was 1.6.
The formula for the calculation of reinforcement stress in cracked cross sections provided in GB50010 (2010), SL/T 191 (2009), DL/T 5057 (2010), JTG D62-2012 (2012), JTJ 267 (1998), and TB10002.3 (2005) codes reads:
where M refers to the measured bending moment of the specimen, γs denotes the internal lever arm coefficient in a cracked section, and on the basis of the above listed Chinese regulations it is equal to 0.8.
In this experiment, strain gauges were attached to the longitudinal reinforcing bars to capture the stress change in cracked sections. The corresponding measured inter-nal lever arm coefficient γs was determined as M/(σsAsh0), based on the calculation model of measured and stand-ard reinforcement stresses. The change of its measured
(15)wmax = τsαcσs
Esψ lcr
(16)σs =M
Asγsh0
value with the bending moment is shown in Fig. 14. The maximum and minimum measured values were 0.93 and 0.73 (respectively), producing an average of 0.83.
A detailed comparison of the results indicated small differences related to the calculation of ψ in GB50010 (2010), SL/T 191 (SL & T, 2009) and DL/T 5057 (DL & T, 2010). Thus, for convenience, the GB50010 (2010) formula was adopted in this study, i.e., ψ = 1.1 – 0.65ft/(ρteσs).
wmax is obtained by using Eqs. (2) and (15), and αc = 0.71 and τs = 1.61 determined from the regression analysis:
wmax is obtained by using Eqs. (2a) and (15), and αc = 0.82 and τs = 1.61 determined from the regression analysis:
wmax is obtained by using Eqs. (3) and (15), and αc = 0.72 and τs = 1.61 determined from the regression analysis:
wmax is obtained by using Eqs. (3a) and (15), and αc = 0.58 and τs = 1.61 determined from the regression analysis:
(17)
wmax = 1.61× 0.71×M
0.83EsAsh0
×(
1.1− 0.65ft
ρteσs
)
×(
1.9c + 0.09d
ρte
)
(18)
wmax = 1.61× 0.82×M
0.83EsAsh0
×(
1.1− 0.65ft
ρteσs
)
×(
1.9c + 0.07d
ρte
)
(19)
wmax = 1.61× 0.72×M
0.83EsAsh0
×(
1.1− 0.65ft
ρteσs
)
×(
1.8c + 0.09d
ρte
)
(20)
wmax = 1.61× 0.58×M
0.83EsAsh0
×(
1.1− 0.65ft
ρteσs
)
×(
1.9c + 0.18d
ρte
)
Page 18 of 28Yao et al. Int J Concr Struct Mater (2021) 15:42
0.0 0.1 0.2 0.3 0.4 0.50.0
0.1
0.2
0.3
0.4
0.5w
t max
(mm
)
wc1max (mm)
(Guan, 2010) +30% -30%wt
max = wc1max
0.0 0.1 0.2 0.3 0.4 0.50.0
0.1
0.2
0.3
0.4
0.5
wt m
ax(m
m)
wc1max (mm)
(Guan, 2010) +30% -30%wt
max = wc1max
a hte= 0.4h b hte= 0.5h
0.0 0.1 0.2 0.3 0.4 0.50.0
0.1
0.2
0.3
0.4
0.5
wc1max (mm)
(Guan, 2010) +30% -30%wt
max = wc1max
wt m
ax(m
m)
0.0 0.1 0.2 0.3 0.4 0.50.0
0.1
0.2
0.3
0.4
0.5
wc1max (mm)
(Guan, 2010) +30% -30%wt
max = wc1max
wt m
ax(m
m)
c hte= 4as d hte= 2as
0.0 0.1 0.2 0.3 0.4 0.50.0
0.1
0.2
0.3
0.4
0.5
wc1max (mm)
(Guan, 2010) +30% -30%wt
max = wc1max
wt m
ax(m
m)
0.0 0.1 0.2 0.3 0.4 0.50.0
0.1
0.2
0.3
0.4
0.5
wc1max (mm)
(Guan, 2010) +30% -30%wt
max = wc1max
wt m
ax(m
m)
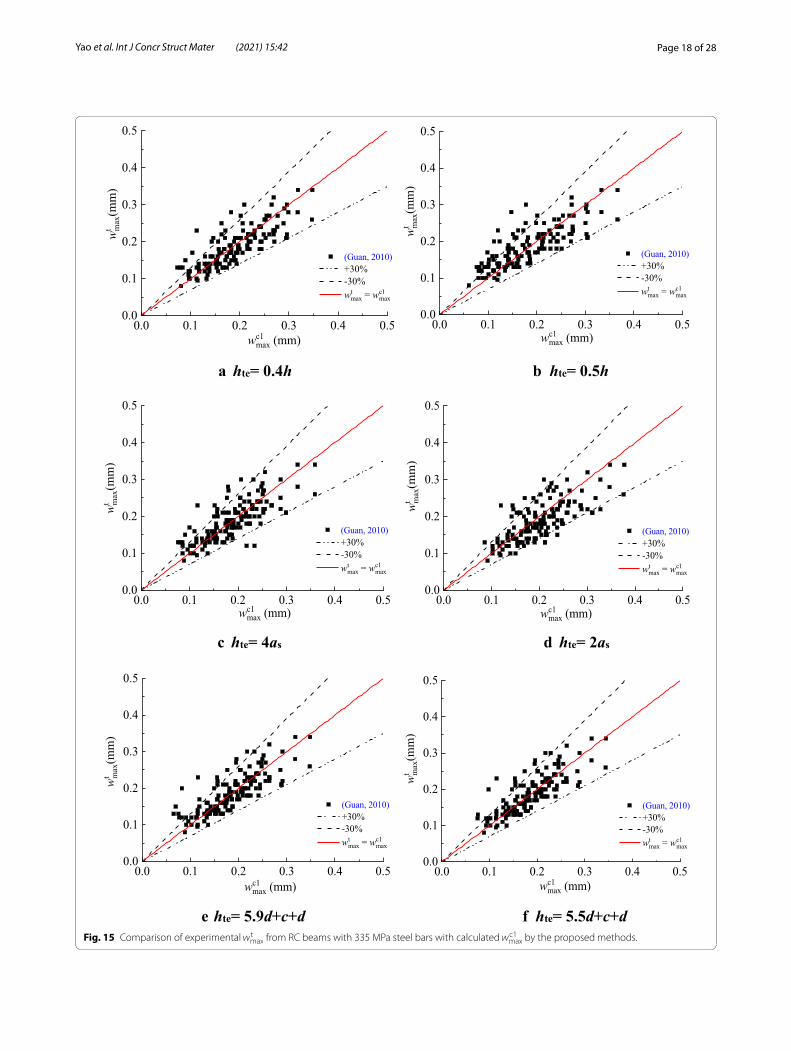
e hte= 5.9d+c+d f hte= 5.5d+c+dFig. 15 Comparison of experimental wt
max from RC beams with 335 MPa steel bars with calculated wc1max by the proposed methods.
Page 19 of 28Yao et al. Int J Concr Struct Mater (2021) 15:42
Table 9 Comparison results of wtmax from RC beams with 335 MPa steel bars with wc1
max by the proposed methods.
Data sources No.of data/n
hte = 0.4 h hte = 0.5 h hte = 4as hte = 2as hte = 5.9d + c + d hte = 5.5d + c + d
μ δ μ δ μ δ μ δ μ δ μ δ
Guan (2010) 141 1.02 0.22 1.08 0.24 1.04 0.22 0.96 0.23 1.05 0.25 1.03 0.21
0.0 0.1 0.2 0.3 0.4 0.50.0
0.1
0.2
0.3
0.4
0.5
wt max
(mm
)
wc1max(mm)
CR60-1 CR60-2(Na, 2006) (Shang, 2004) (Xiao, 2006) (Zhu et al, 2018) +30% -30%wt
max= wc1max
0.0 0.1 0.2 0.3 0.4 0.50.0
0.1
0.2
0.3
0.4
0.5
wt m
ax(m
m)
wc1max(mm)
CR60-1 CR60-2(Na, 2006)
(Shang, 2004) (Xiao, 2006) (Zhu et al, 2018) +30% -30%wt
max= wc1max
a) hte= 0.4h b) hte= 0.5h
0.0 0.1 0.2 0.3 0.4 0.50.0
0.1
0.2
0.3
0.4
0.5
wt max
(mm
)
wc1max(mm)
CR60-1 CR60-2(Na, 2006) (Shang, 2004) (Xiao, 2006) (Zhu et al, 2018) +30% -30%wt
max= wc1max
0.0 0.1 0.2 0.3 0.4 0.50.0
0.1
0.2
0.3
0.4
0.5
wt max
(mm
)
wc1max(mm)
CR60-1 CR60-2(Na, 2006) (Shang, 2004) (Xiao, 2006) (Zhu et al, 2018) +30% -30%wt
max= wc1max
c) hte= 4as d) hte= 2as
0.0 0.1 0.2 0.3 0.4 0.50.0
0.1
0.2
0.3
0.4
0.5
CR60-1 CR60-2(Na, 2006) (Shang, 2004) (Xiao, 2006) (Zhu et al, 2018) +30% -30%wt
max= wc1max
wt max
(mm
)
wc1max(mm)
0.0 0.1 0.2 0.3 0.4 0.50.0
0.1
0.2
0.3
0.4
0.5
CR60-1 CR60-2(Na, 2006)
(Shang, 2004) (Xiao, 2006) (Zhu et al, 2018) +30% -30%wt
max= wc1max
wt m
ax(m
m)
wc1max(mm)
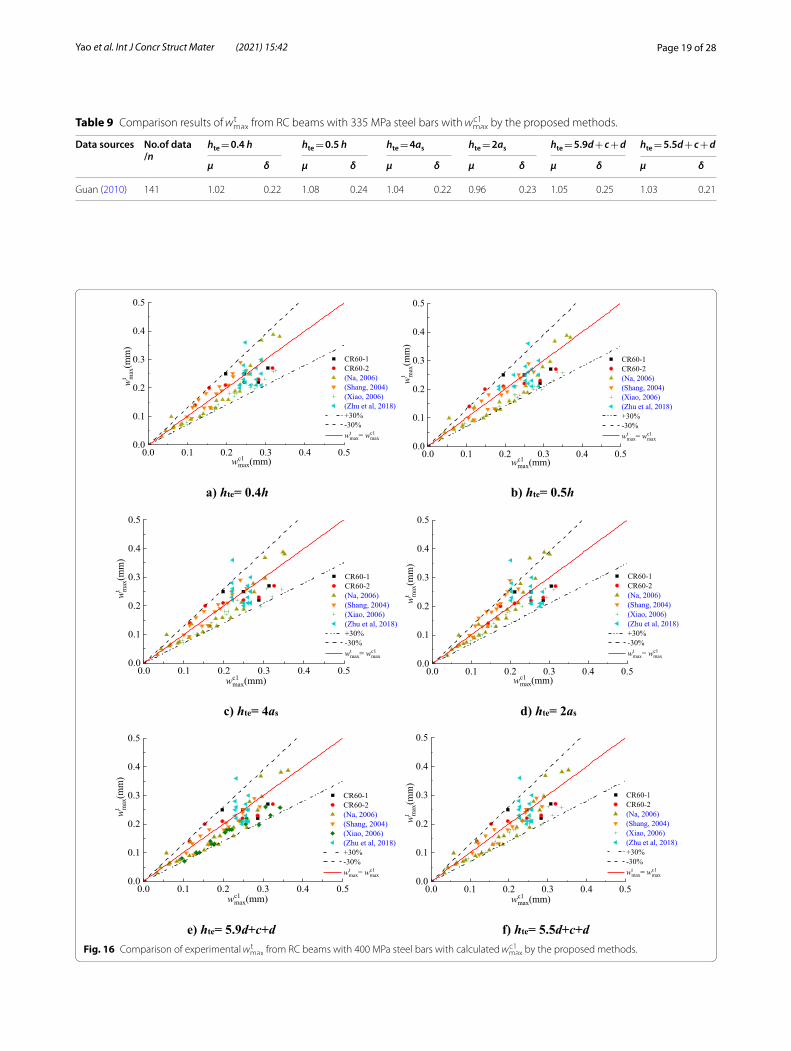
e) hte= 5.9d+c+d f) hte= 5.5d+c+dFig. 16 Comparison of experimental wt
max from RC beams with 400 MPa steel bars with calculated wc1max by the proposed methods.

Page 20 of 28Yao et al. Int J Concr Struct Mater (2021) 15:42
wmax is obtained by using Eqs. (4) and (15), and αc = 0.66 and τs = 1.61 determined from the regression analysis:
wmax is obtained by using Eqs. (4a) and (15), and αc = 0.66 and τs = 1.61 determined from the regression analysis:
(21)
wmax = 1.61× 0.66×M
0.83EsAsh0
×(
1.1− 0.65ft
ρteσs
)
×(
1.9c + 0.1d
ρte
)
(22)
wmax = 1.61× 0.61×M
0.83EsAsh0
×(
1.1− 0.65ft
ρteσs
)
×(
2c + 0.11d
ρte
)
5.2.1 Assessment of the Method for RC Beams with Steel Bars of Various Yield Strengths
(1) Beams with 335 MPa-Grade Steel Bars
For RC beams with 335 MPa steel bars, a compari-son between maximum crack widths wt
max obtained from the tests under serviceability-level loads and the wc1
max values calculated by using the proposed method is shown in Fig. 15 and Table 9. The results indicate that the proposed method leads to a good estimation of maximum crack widths in the case of RC beams with 335 MPa steel bars.
(2) Beams with 400 MPa-Grade Steel Bars For RC beams with 400 MPa steel bars, a compari-
son between maximum crack widths wtmax obtained
from the tests under serviceability-level loads and the wc1
max values calculated by using the proposed method is shown in Fig. 16 and Table 10. The results indicate that the proposed method leads to a good estimation of maximum crack widths in the case of RC beams with 400 MPa steel bars.
Table 10 Comparison results of wtmax from RC beams with 400 MPa steel bars with wc1
max by the proposed methods.
Data sources No. of data/n
hte = 0.4 h hte = 0.5 h hte = 4as hte = 2as hte = 5.9d + c + d hte = 5.5d + c + d
μ δ μ δ μ δ μ δ μ δ μ δ
CR60-1-1 4 0.99 0.21 0.97 0.24 0.97 0.22 0.96 0.18 0.98 0.22 0.98 0.22
CR60-1-2 6 1.01 0.19 1.04 0.24 1.02 0.21 0.94 0.13 1.02 0.21 1.02 0.20
Na (2006) 25 0.96 0.22 0.90 0.26 0.94 0.24 1.01 0.20 0.94 0.24 0.95 0.23
Shang (2004) 15 1.07 0.12 0.98 0.13 1.05 0.12 1.18 0.13 0.94 0.13 0.96 0.13
Xiao (2006) 19 0.79 0.06 0.75 0.06 0.81 0.08 0.87 0.10 0.79 0.08 0.80 0.08
Zhu et al. (2018) 16 0.95 0.18 0.99 0.16 1.01 0.22 1.05 0.27 1.00 0.20 1.02 0.20
Sum 85 0.94 0.20 0.91 0.22 0.95 0.21 1.01 0.21 0.92 0.20 0.94 0.20
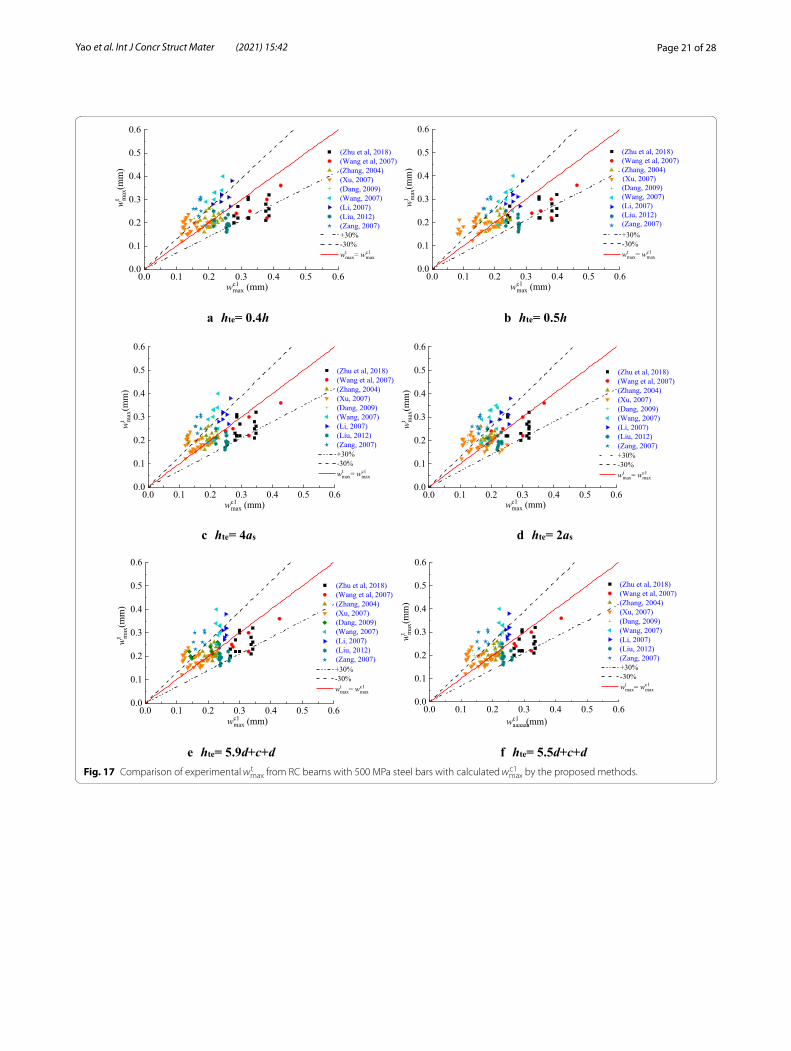
Table 11 Comparison results of wtmax from RC beams with 500 MPa steel bars with wc1
max by the proposed methods.
Data sources No. of data/n hte = 0.4 h hte = 0.5 h hte = 4as hte = 2as hte = 5.9d + c + d hte = 5.5d + c + d
μ δ μ δ μ δ μ δ μ δ μ δ
Zhu et al. (2018) 16 0.75 0.16 0.75 0.21 0.81 0.16 0.86 0.19 0.80 0.15 0.82 0.15
Wang et al. (2007) 5 0.77 0.14 0.72 0.12 0.87 0.13 0.99 0.17 0.84 0.12 0.86 0.12
Zhang (2004) 18 1.01 0.14 1.01 0.16 1.06 0.13 1.12 0.17 1.01 0.12 1.03 0.12
Xu (2007) 30 1.26 0.21 1.32 0.31 1.21 0.22 1.23 0.29 1.20 0.24 1.22 0.25
Dang (2009) 9 1.09 0.15 1.09 0.22 1.29 0.21 1.34 0.19 1.14 0.21 1.16 0.21
Wang (2007) 9 1.33 0.20 1.23 0.21 1.38 0.21 1.45 0.19 1.26 0.24 1.29 0.24
Li (2007) 7 1.26 0.10 1.17 0.10 1.26 0.10 1.31 0.11 1.22 0.11 1.24 0.11
Liu (2012) 12 0.81 0.19 0.75 0.18 0.82 0.17 0.93 0.18 0.81 0.15 0.83 0.15
Zang (2007) 7 1.62 0.10 1.54 0.10 1.69 0.10 1.70 0.10 1.57 0.13 1.60 0.12
Sum 113 1.09 0.29 1.08 0.33 1.13 0.28 1.14 0.28 1.08 0.27 1.10 0.27
Page 21 of 28Yao et al. Int J Concr Struct Mater (2021) 15:42
0.0 0.1 0.2 0.3 0.4 0.5 0.60.0
0.1
0.2
0.3
0.4
0.5
0.6wt m
ax(m
m)
wc1max (mm)
(Zhu et al, 2018) (Wang et al, 2007) (Zhang, 2004) (Xu, 2007) (Dang, 2009) (Wang, 2007) (Li, 2007) (Liu, 2012) (Zang, 2007) +30% -30%wt
max= wc1max
0.0 0.1 0.2 0.3 0.4 0.5 0.60.0
0.1
0.2
0.3
0.4
0.5
0.6
(Zhu et al, 2018)(Wang et al, 2007)(Zhang, 2004)(Xu, 2007)(Dang, 2009)(Wang, 2007)(Li, 2007)(Liu, 2012)(Zang, 2007) +30% -30%wt
max= wc1max
wt m
ax(m
m)
wc1max (mm)
a hte= 0.4h b hte= 0.5h
0.0 0.1 0.2 0.3 0.4 0.5 0.60.0
0.1
0.2
0.3
0.4
0.5
0.6
+30% -30%wt
max= wc1max
wt m
ax(m
m)
wc1max (mm)
0.0 0.1 0.2 0.3 0.4 0.5 0.60.0
0.1
0.2
0.3
0.4
0.5
0.6
+30% -30%wt
max= wc1max
wt m
ax(m
m)
wc1max (mm)
c hte= 4as d hte= 2as
0.0 0.1 0.2 0.3 0.4 0.5 0.60.0
0.1
0.2
0.3
0.4
0.5
0.6
+30% -30%wt
max= wc1max
wt m
ax(m
m)
wc1max (mm)
0.0 0.1 0.2 0.3 0.4 0.5 0.60.0
0.1
0.2
0.3
0.4
0.5
0.6
+30% -30%wt
max= wc1max
wt max
(mm
)
wc1aaaaaa (mm)
e hte= 5.9d+c+d f hte= 5.5d+c+d
(Zhu et al, 2018) (Wang et al, 2007) (Zhang, 2004) (Xu, 2007) (Dang, 2009) (Wang, 2007) (Li, 2007) (Liu, 2012) (Zang, 2007)
(Zhu et al, 2018) (Wang et al, 2007) (Zhang, 2004) (Xu, 2007) (Dang, 2009) (Wang, 2007) (Li, 2007) (Liu, 2012) (Zang, 2007)
(Zhu et al, 2018) (Wang et al, 2007) (Zhang, 2004) (Xu, 2007) (Dang, 2009) (Wang, 2007) (Li, 2007) (Liu, 2012) (Zang, 2007)
(Zhu et al, 2018) (Wang et al, 2007) (Zhang, 2004) (Xu, 2007) (Dang, 2009) (Wang, 2007) (Li, 2007) (Liu, 2012) (Zang, 2007)
Fig. 17 Comparison of experimental wtmax from RC beams with 500 MPa steel bars with calculated wc1
max by the proposed methods.
Page 22 of 28Yao et al. Int J Concr Struct Mater (2021) 15:42
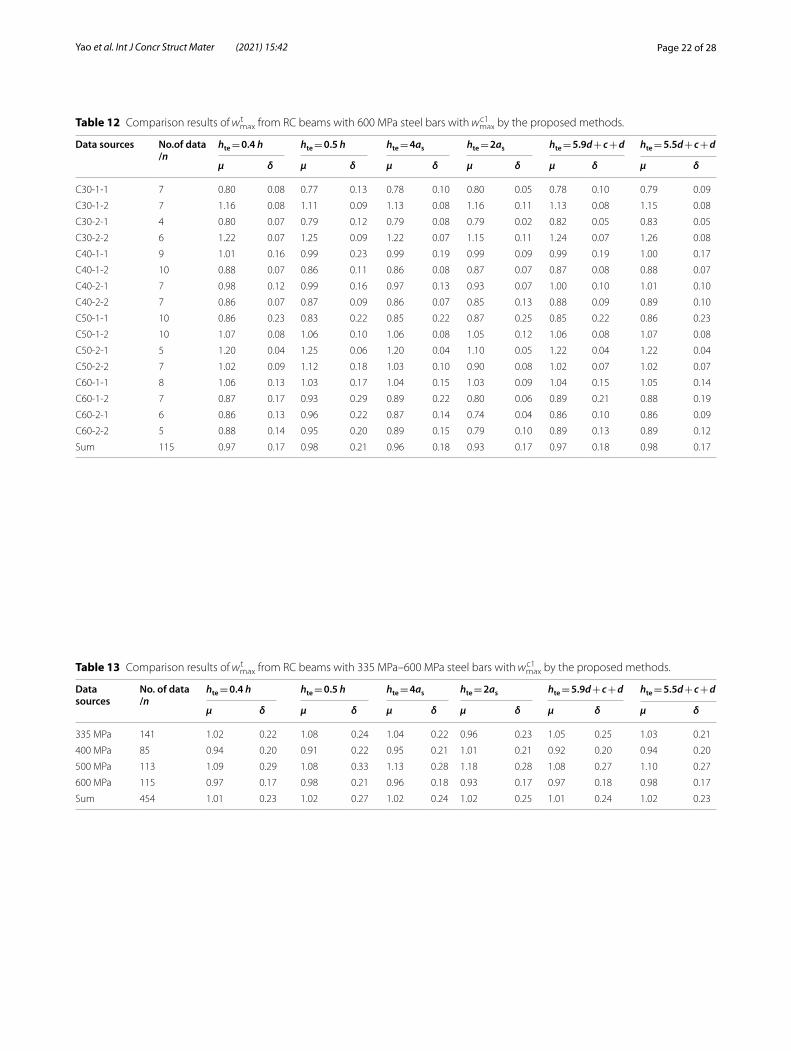
Table 12 Comparison results of wtmax from RC beams with 600 MPa steel bars with wc1
max by the proposed methods.
Data sources No.of data/n
hte = 0.4 h hte = 0.5 h hte = 4as hte = 2as hte = 5.9d + c + d hte = 5.5d + c + d
μ δ μ δ μ δ μ δ μ δ μ δ
C30-1-1 7 0.80 0.08 0.77 0.13 0.78 0.10 0.80 0.05 0.78 0.10 0.79 0.09
C30-1-2 7 1.16 0.08 1.11 0.09 1.13 0.08 1.16 0.11 1.13 0.08 1.15 0.08
C30-2-1 4 0.80 0.07 0.79 0.12 0.79 0.08 0.79 0.02 0.82 0.05 0.83 0.05
C30-2-2 6 1.22 0.07 1.25 0.09 1.22 0.07 1.15 0.11 1.24 0.07 1.26 0.08
C40-1-1 9 1.01 0.16 0.99 0.23 0.99 0.19 0.99 0.09 0.99 0.19 1.00 0.17
C40-1-2 10 0.88 0.07 0.86 0.11 0.86 0.08 0.87 0.07 0.87 0.08 0.88 0.07
C40-2-1 7 0.98 0.12 0.99 0.16 0.97 0.13 0.93 0.07 1.00 0.10 1.01 0.10
C40-2-2 7 0.86 0.07 0.87 0.09 0.86 0.07 0.85 0.13 0.88 0.09 0.89 0.10
C50-1-1 10 0.86 0.23 0.83 0.22 0.85 0.22 0.87 0.25 0.85 0.22 0.86 0.23
C50-1-2 10 1.07 0.08 1.06 0.10 1.06 0.08 1.05 0.12 1.06 0.08 1.07 0.08
C50-2-1 5 1.20 0.04 1.25 0.06 1.20 0.04 1.10 0.05 1.22 0.04 1.22 0.04
C50-2-2 7 1.02 0.09 1.12 0.18 1.03 0.10 0.90 0.08 1.02 0.07 1.02 0.07
C60-1-1 8 1.06 0.13 1.03 0.17 1.04 0.15 1.03 0.09 1.04 0.15 1.05 0.14
C60-1-2 7 0.87 0.17 0.93 0.29 0.89 0.22 0.80 0.06 0.89 0.21 0.88 0.19
C60-2-1 6 0.86 0.13 0.96 0.22 0.87 0.14 0.74 0.04 0.86 0.10 0.86 0.09
C60-2-2 5 0.88 0.14 0.95 0.20 0.89 0.15 0.79 0.10 0.89 0.13 0.89 0.12
Sum 115 0.97 0.17 0.98 0.21 0.96 0.18 0.93 0.17 0.97 0.18 0.98 0.17
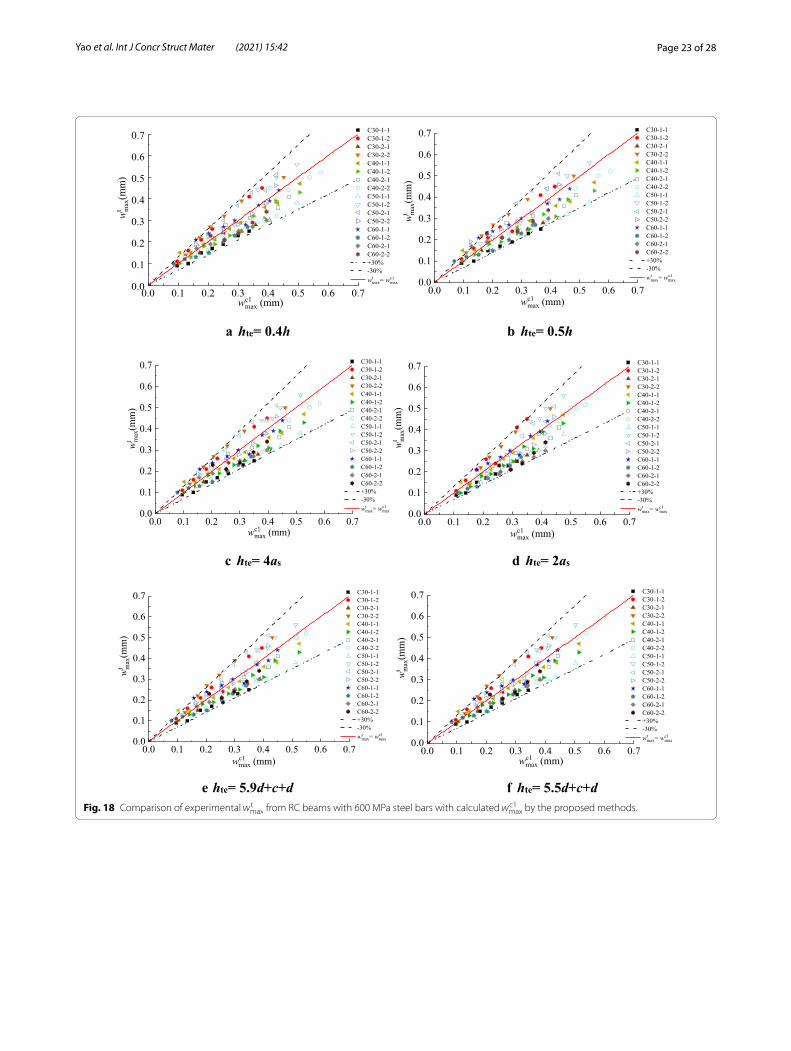
Table 13 Comparison results of wtmax from RC beams with 335 MPa–600 MPa steel bars with wc1
max by the proposed methods.
Data sources
No. of data/n
hte = 0.4 h hte = 0.5 h hte = 4as hte = 2as hte = 5.9d + c + d hte = 5.5d + c + d
μ δ μ δ μ δ μ δ μ δ μ δ
335 MPa 141 1.02 0.22 1.08 0.24 1.04 0.22 0.96 0.23 1.05 0.25 1.03 0.21
400 MPa 85 0.94 0.20 0.91 0.22 0.95 0.21 1.01 0.21 0.92 0.20 0.94 0.20
500 MPa 113 1.09 0.29 1.08 0.33 1.13 0.28 1.18 0.28 1.08 0.27 1.10 0.27
600 MPa 115 0.97 0.17 0.98 0.21 0.96 0.18 0.93 0.17 0.97 0.18 0.98 0.17
Sum 454 1.01 0.23 1.02 0.27 1.02 0.24 1.02 0.25 1.01 0.24 1.02 0.23
Page 23 of 28Yao et al. Int J Concr Struct Mater (2021) 15:42
0.0 0.1 0.2 0.3 0.4 0.5 0.6 0.70.0
0.1
0.2
0.3
0.4
0.5
0.6
0.7
wc1max (mm)
wt max
(mm
) C30-1-1 C30-1-2 C30-2-1 C30-2-2 C40-1-1 C40-1-2 C40-2-1 C40-2-2 C50-1-1 C50-1-2 C50-2-1 C50-2-2 C60-1-1 C60-1-2 C60-2-1 C60-2-2 +30% -30%wt
max= wc1max
0.0 0.1 0.2 0.3 0.4 0.5 0.6 0.70.0
0.1
0.2
0.3
0.4
0.5
0.6
0.7
wt max
(mm
)
wc1max (mm)
C30-1-1 C30-1-2 C30-2-1 C30-2-2 C40-1-1 C40-1-2 C40-2-1 C40-2-2 C50-1-1 C50-1-2 C50-2-1 C50-2-2 C60-1-1 C60-1-2 C60-2-1 C60-2-2 +30% -30%wt
max= wc1max
a hte= 0.4h b hte= 0.5h
0.0 0.1 0.2 0.3 0.4 0.5 0.6 0.70.0
0.1
0.2
0.3
0.4
0.5
0.6
0.7 C30-1-1 C30-1-2 C30-2-1 C30-2-2 C40-1-1 C40-1-2 C40-2-1 C40-2-2 C50-1-1 C50-1-2 C50-2-1 C50-2-2 C60-1-1 C60-1-2 C60-2-1 C60-2-2 +30% -30%wt
max= wc1max
wt m
ax(m
m)
wc1max (mm)
0.0 0.1 0.2 0.3 0.4 0.5 0.6 0.70.0
0.1
0.2
0.3
0.4
0.5
0.6
0.7 C30-1-1 C30-1-2 C30-2-1 C30-2-2 C40-1-1 C40-1-2 C40-2-1 C40-2-2 C50-1-1 C50-1-2 C50-2-1 C50-2-2 C60-1-1 C60-1-2 C60-2-1 C60-2-2 +30% -30%wt
max= wc1max
wt max
(mm
)
wc1max (mm)
c hte= 4as d hte= 2as
0.0 0.1 0.2 0.3 0.4 0.5 0.6 0.70.0
0.1
0.2
0.3
0.4
0.5
0.6
0.7 C30-1-1 C30-1-2 C30-2-1 C30-2-2 C40-1-1 C40-1-2 C40-2-1 C40-2-2 C50-1-1 C50-1-2 C50-2-1 C50-2-2 C60-1-1 C60-1-2 C60-2-1 C60-2-2 +30% -30%wt
max= wc1max
wt max
(mm
)
wc1max (mm)
0.0 0.1 0.2 0.3 0.4 0.5 0.6 0.70.0
0.1
0.2
0.3
0.4
0.5
0.6
0.7 C30-1-1 C30-1-2 C30-2-1 C30-2-2 C40-1-1 C40-1-2 C40-2-1 C40-2-2 C50-1-1 C50-1-2 C50-2-1 C50-2-2 C60-1-1 C60-1-2 C60-2-1 C60-2-2 +30% -30%wt
max= wc1max
wt max
(mm
)
wc1max (mm)
e hte= 5.9d+c+d f hte= 5.5d+c+dFig. 18 Comparison of experimental wt
max from RC beams with 600 MPa steel bars with calculated wc1max by the proposed methods.
Page 24 of 28Yao et al. Int J Concr Struct Mater (2021) 15:42
a hte= 0.4h b hte= 0.5h
c d hte= 4as hte= 2as
e hte= 5.9d+c+d f hte= 5.5d+c+d
0.0 0.1 0.2 0.3 0.4 0.5 0.6 0.70.0
0.1
0.2
0.3
0.4
0.5
0.6
0.7
335MPa400MPa500MPa600MPa+30%-30%wt
max=wc1max
wt max
(mm
)
wc1max (mm)
0.0 0.1 0.2 0.3 0.4 0.5 0.6 0.70.0
0.1
0.2
0.3
0.4
0.5
0.6
0.7
wt m
ax(m
m)
335MPa400MPa500MPa600MPa+30%-30%wt
max=wc1max
wc1max (mm)
0.0 0.1 0.2 0.3 0.4 0.5 0.6 0.70.0
0.1
0.2
0.3
0.4
0.5
0.6
0.7
wt max
(mm
)
335MPa400MPa500MPa600MPa+30%-30%wt
max=wc1max
wc1max (mm)
0.0 0.1 0.2 0.3 0.4 0.5 0.6 0.70.0
0.1
0.2
0.3
0.4
0.5
0.6
0.7wt m
ax(m
m)
335MPa400MPa500MPa600MPa+30%-30%wt
max=wc1max
wc1max (mm)
0.0 0.1 0.2 0.3 0.4 0.5 0.6 0.70.0
0.1
0.2
0.3
0.4
0.5
0.6
0.7
wt max
(mm
)
335MPa400MPa500MPa600MPa+30%-30%wt
max=wc1max
wc1max (mm)
0.0 0.1 0.2 0.3 0.4 0.5 0.6 0.70.0
0.1
0.2
0.3
0.4
0.5
0.6
0.7
wt m
ax(m
m)
335MPa400MPa500MPa600MPa+30%-30%wt
max=wc1max
wc1max (mm)
Fig. 19 Comparison of experimental wtmax from RC beams with 335 MPa to 600 MPa steel bars with calculated wc1
max by the proposed methods.
Page 25 of 28Yao et al. Int J Concr Struct Mater (2021) 15:42
a The relation between σs and wmax b The relation between d and wmax
c The relation between ρ and wmax d The relation between c and wmax
e The relation between fcu and wmax
0.0 0.1 0.2 0.3 0.4 0.5 0.6 0.70.0
0.1
0.2
0.3
0.4
0.5
0.6
0.7335MPa400MPa500MPa600MPay=0.67xy=0.30xy=1.10x
wmax/m
m
×103σs / MPa0 5 10 15 20 25 30 35 40
0.0
0.1
0.2
0.3
0.4
0.5
0.6
0.7 335MPa400MPa500MPa600MPa
wmax/m
m
d / mm
0.00 0.01 0.02 0.030.0
0.1
0.2
0.3
0.4
0.5
0.6
0.7335MPa400MPa500MPa600MPa
wmax/m
m
ρ / %0 10 20 30 40 50 60 70
0.0
0.1
0.2
0.3
0.4
0.5
0.6
0.7335MPa400MPa500MPa600MPa
wmax/m
m
c / mm
0 5 10 15 20 25 30 35 40 45 50 55 60 65 700.0
0.1
0.2
0.3
0.4
0.5
0.6
0.7335MPa400MPa500MPa600MPa
wmax/m
m
fcu / MPa
Fig. 20 Comparison of wmax and different parameters such as σ s, d, ρ, c, fcu from RC beams with 335 MPa–600 MPa steel bars.
Page 26 of 28Yao et al. Int J Concr Struct Mater (2021) 15:42
(3) Beams with 500 MPa-Grade Steel Bars For RC beams with 500 MPa steel bars, a compari-
son between maximum crack widths wtmax obtained
from the tests under serviceability-level loads and the wc1
max values calculated by using the proposed method is shown in Fig. 17 and Table 11. The results indicate that the proposed method leads to a good estimation of maximum crack widths in the case of RC beams with 500 MPa steel bars.
(4) Beams with 600 MPa-Grade steel Bars For RC beams with 600 MPa steel bars, a compari-
son between maximum crack widths wtmax obtained
from the tests under serviceability-level loads and the wc1
max values calculated by using the proposed method is shown in Fig. 18 and Table 12. The results indicate that the proposed method leads to a good estimation of maximum crack widths in the case of RC beams with 600 MPa steel bars.
(5) Beams with 335 to 600 MPa-Grade Steel Bars For RC beams with 335 to 600 MPa steel bars, a
comparison between maximum crack widths wtmax obtained from the tests under serviceability-
level loads and the wc1max values calculated by using
the method is shown in Fig. 19 and Table 13. The results indicate that the method leads to a good estimation of maximum crack widths in the case of RC beams with 335 to 600 MPa steel bars. Addi-tionally, the accuracy results for beams with 500–600 MPa steel bar is improved compared to the existing approaches.
6 A Unified Formula for the Calculation of Maximum Crack Width for RC Beams with 335–600 MPa‑Grade Steel Bars
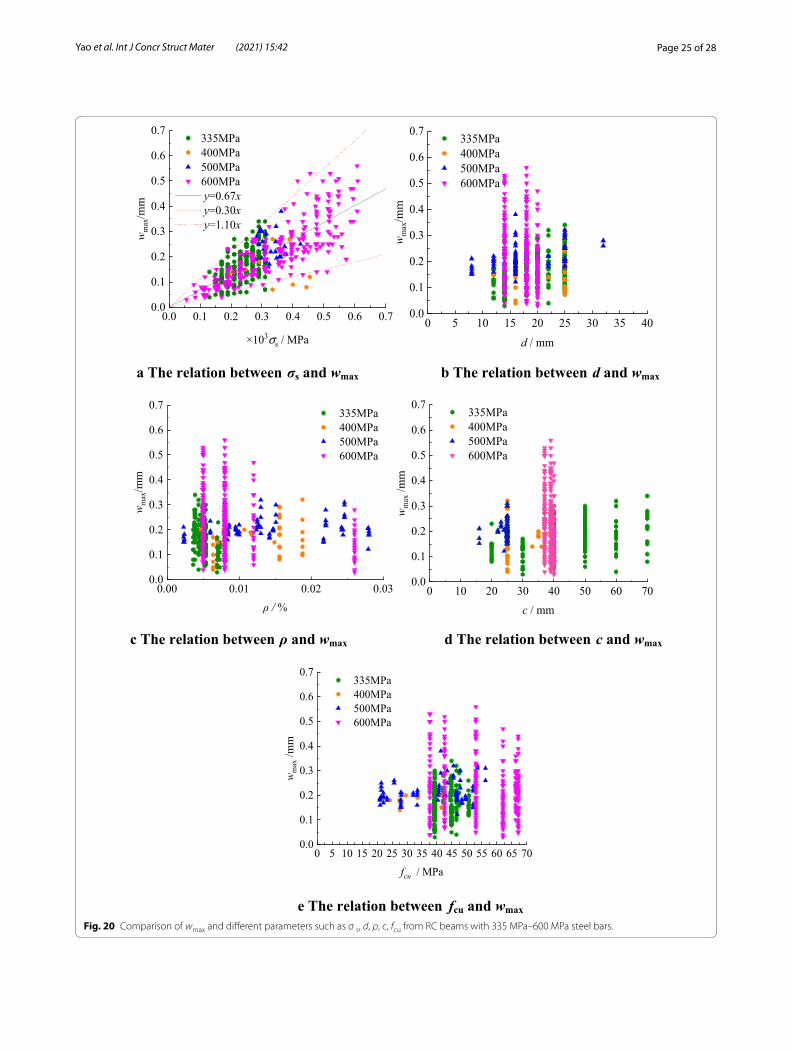
From the analysis presented and discussed above, it can be seen that the parameters for the calculation of maxi-mum crack width are complex and inconvenient to use. According to different codes, a maximum crack width of an RC beam is related to: longitudinal reinforce-ment stress, reinforcement diameter, longitudinal rein-forcement ratio, concrete cover and concrete strength. Based on a large number of experimental data for RC beams with 335–600 MPa steel bars, the obtained rela-tionships are presented in Fig. 20. A comparison shows that the longitudinal reinforcement stress provides suf-ficient accuracy when calculating the maximum crack width for RC beams with 335–600 MPa steel bars. The most influential factor on the maximum crack width of reinforced concrete beams is the longitudinal reinforce-ment stress, which has a particular linear relationship with the maximum crack width (Fig. 20a). However, the influence of reinforcement diameter, longitudinal rein-forcement ratio, protective layer thickness and concrete
strength on the maximum crack width was not notice-able. The data scatter was relatively large (Fig. 20b–e). The longitudinal reinforcement stress was selected as the main parameter, and the regression analysis was carried out using mathematical statistics method. The expres-sion between the longitudinal reinforcement stress and the maximum crack width wmax is y = 0.67x, and the test data points are mainly distributed between the straight lines y = 0.30x and y = 1.10x in Fig. 20 a). The developed unified expression is useful as it provides a reference and guiding tool for different engineering applications.
7 ConclusionsThe occurrence and development of cracks and their width variation were determined experimentally under various load levels. The obtained test results were used for the establishment of calculation models for the deter-mination of crack spacing and width applicable to beams with 335–600 MPa. The main conclusions are provided below.
1. Statistical analysis of the cracks developed in beams (reinforced with 600 MPa steel bars) under pure bending indicated a continuous extension of cracks under differ-ent loads after an initial cracking, or their rapid progres-sion toward the neutral axis.
2. The following relationships were established for RC beams with 600 MPa and 400 MPa steel bars corre-sponding to normal load levels, respectively: ht
te = 0.4 h, ht
te = 4as, and ht
te = 5.9d.3. The measured values of average crack spacing
obtained in this study differed from the values deter-mined from other codes. The ratios between the calcu-lated and measured values of maximum crack widths were relatively large.
4. An expression for the calculation of average crack spacing in concrete beams with steel bars of various yield strengths (335 to 600 MPa) has been proposed in this paper. Also, expressions for the calculation of the maxi-mum crack width have been developed.
5. A unified formula with RC beams with 335–600 MPa-grade steel bars to calculate maximum crack width has been proposed. The application of longitudi-nal reinforcement stress provided sufficient accuracy of the calculated maximum crack widths in RC beams with 335–600 MPa-grade steel bars.
AcknowledgementsNot applicable.
Authors’ contributionsXY and JG designed the experiments. LZ and JX carried out the experiments. XY, JG and LL analyzed the experimental results. XY and JG reviewed and edited the manuscript. JG received the funding. All authors read and approved the final manuscript.
Page 27 of 28Yao et al. Int J Concr Struct Mater (2021) 15:42
Authors’ informationXianhua Yao is lecturer in School of Civil Engineering and Communication, North China University of Water Resources and Electric Power, Zhengzhou 450045, Henan, China.Junfeng Guan is Professor in School of Civil Engineering and Communication, North China University of Water Resources and Electric Power, Zhengzhou 450045, Henan, China.Lei Zhang is Senior Engineer in Institute of Engineering Mechanics, Yellow River Institute of Hydraulic Research, Zhengzhou 450099, Henan, China.Junyi Xi is Postgraduate student in School of Civil Engineering and Com-munication, North China University of Water Resources and Electric Power, Zhengzhou 450045, Henan, China.Lielie Li is lecturer in School of Civil Engineering and Communication, North China University of Water Resources and Electric Power, Zhengzhou 450045, Henan, China.
FundingThis project was sponsored by the National Natural Science Foundation of China (51779095, 52179132), Program for Science and Technology Innovation Talents in Universities of Henan Province (20HASTIT013), Sichuan Univ, State Key Lab Hydraul and Mt River Engn (SKHL2007).
Availability of data and materials The datasets used and/or analyzed during the current study are available from the corresponding author on reasonable request.
Declarations
Competing interestsThe authors declare no conflicts of interest to this work.
Author details1 School of Civil Engineering and Communication, North China University of Water Resources and Electric Power, Zhengzhou 450045, Henan, China. 2 Institute of Engineering Mechanics, Yellow River Institute of Hydraulic Research, Zhengzhou 450099, Henan, China.
Received: 22 July 2021 Accepted: 2 October 2021
ReferencesACI Committee 318. (1971). Building code requirement for structural concrete (ACI
318–71). American Concrete Institute.ACI Committee 318. (1995). Building code requirement for structural concrete
(ACI 318–95) and commentary (ACI 318R-95). American Concrete Institute.ACI Committee 318. (1999). Building code requirement for structural concrete (ACI
318–99) and commentary (ACI 318R-99). American Concrete Institute.ACI Committee 318. (2014). Building code requirement for structural concrete (ACI
318–14) and commentary (ACI 318R-14). American Concrete Institute.ASTM A706/A706M-14. (2014). Standard specification for deformed and plain
low-alloy steel bars for concrete reinforcement. West Conshohocken: ASTM International.
Beeby, A. W. (2004). The influence of the parameter Ø/ρeff on crack widths. Structural Concrete, 5(2), 71–83.
Dang, L. B. (2009). The study of crack width of HRB500 reinforced concrete mem-bers. Zhengzhou University. (in Chinese).
DL/T 5057–1996. (1996). . Design specification for hydraulic concrete structures. China Electric Power Press. (in Chinese).
DL/T 5057–2009. (2010). Design specification for hydraulic concrete structures. China Electric Power Press. (in Chinese).
Du, M. M., & Su, X. Z. (2012). Study on the crack width at different positions of post-tensioned bonded prestressed concrete beams with 500MPa steel bars. Journal of Building Structures, 33(09), 141–147. (in Chinese).
EN1992-1-1. (2004). Euro-code2: Design for concrete structures-Part1: General rules and rules for building. European Committee for Standardization.
Frosch, R. J. (2002). Modeling and control of size face beam cracking. ACI Structural Journal, 99(3), 376–385.
GB50010. (2010). Code for design of concrete structures. Chinese Building Press. (in Chinese).
General Administration of Quality Supervision, Inspection and Quarantine; and National Standardizing Committee. (2007). “Common Portland cement.” Chinese Standard GB 175–2007, Beijing, the People’s Republic of China. (in Chinese)
Guan, J. F., Zhao, S. B., Li, X. K., et al. (2011). Experiment and calculation method of crack width of reinforced concrete beams. China Journal of Highway and Transport, 24(5), 74–81. (in Chinese).
Guan, J. F. (2010). Research on theory and application of simulation model test for reinforced concrete structure. Dalian University of Technology. (in Chinese).
Guan, J. F., Liu, L. A., Bai, W. F., et al. (2020). Experimental study on the stiffness of 600MPa high-strength steel bars and high-strength concrete beams. Journal of Applied Basic Science and Engineering, 28(05), 1197–1211. (in Chinese).
Guan, J. F., Liu, L. A., Zhang, Q., et al. (2021). Experimental study and calculation method of mid-span deflection of 600 MPa high-strength reinforced concrete beams. Journal of Building Structures, 42(08), 59–72. (in Chinese).
Guan, J. F., Zhang, Q., Wang, W. S., et al. (2016). Resistance against cracking of reinforced concrete beams with 600MPa seismic steel bar. Concrete, 7, 49–52. (in Chinese).
Guan, J. F., Zhang, Q., Wang, D., et al. (2018). Research on mechanical properties and constitutive model of 600MPa seismic steel bar. Journal of Basic Sci-ence and Engineering, 26(1), 122–131. (in Chinese).
JTG D62–2012. (2012) Code for design of highway reinforced concrete and prestressed concrete bridges and culverts. China Communication Press. (in Chinese).
JTJ267–98. (1998). Design code for harbour engineering concrete structures. China Communication Press. (in Chinese).
Na, L. Y. (2006). The experimental study on the crack behavior of concrete bending members reinforced with HRB400 steel. Hunan University. (in Chinese).
Li, X. K., Li, C. Y., Zhao, M. L., et al. (2019). Testing and prediction of shear per-formance for steel fiber reinforced expanded-shale lightweight concrete beams without web reinforcements. Materials, 12(10), 1–18.
Li, Y. Y. (2007). Experimental research on behaviors of reinforced concrete beams with 500MPa steel bars. Tianjin University. (in Chinese).
Li, Y. Z., Cao, S. Y., Liang, H., et al. (2018). Axial compressive behavior of concrete columns with grade 600 MPa reinforcing bars. Engineering Structures, 172, 497–507.
Liu, P. (2012). Experimental and Theoretical research on beams with HRB 500 high strength steel bars. Hebei University of Technology. (in Chinese).
Liu, Y. Y., Fan, Y. F., & Charis, A. (2019). Experimental study on flexural behavior of prestressed concrete beams reinforced by CFRP under chloride environ-ment. Advances in Civil Engineering, 984, 230–238.
Shang, S. Z. (2004). Experimental study on flexural behavior of reinforced concrete beams with stiff and strong. Shanghai University. (in Chinese).
SL/T 191–2008. (2009). Design code for hydraulic concrete structures. China Water Power Press. (in Chinese)
TB10002.3–2005. (2005). Code for design of railroad reinforced concrete and prestressed concrete bridges and culverts. China Railway Press. (in Chinese)
Wang, M. P., Zhang, Z. Q., & Geng, S. J. (2007). Experiment of reinforced con-crete simply supported beam with 500MPa ribbed carbon bars under bending. Industrial Construction, 37(8), 39–42. (in Chinese).
Wang, X. L. (2007). Experimental research on bend performance of RC beams with high-strength rebar. Tianjin University. (in Chinese).
Xiao, H. J. (2006). Experimental research on bend behavior of HRB400 reinforced concrete beams. Zhengzhou University. (in Chinese).
Xiong, H., Ge, J., Feng, J., et al. (2018). Experimental study on the mechanical properties and service performance of HRB600 steel bars. Journal of Build-ing Structures, 39(S2), 387–393. (in Chinese).
Xu, F. B. (2007). Experimental and theoretical research on flexural behavior of rein-forced concrete beams with HRB 500 bars. Hunan University. (in Chinese).
Yao, X. H., Zhang, Y. L., Guan, J. F., et al. (2020). Experimental study and reliability analysis of flexural capacity of RC beams reinforced with 600 MPa grade steel. Advances in Civil Engineering, 2020(4), 1–26.
Zang, P. (2007). The experimental study on bending behavior of RC beams with 500MPa steel bar. Hebei University of Technology. (in Chinese).
Zhang, T. (2004). The study of mechanical property of HRB500 reinforced concrete members. Zhengzhou University. (in Chinese).

Page 28 of 28Yao et al. Int J Concr Struct Mater (2021) 15:42
Zhang, J. W., Li, C., Li, X. Y., et al. (2019). Experimental study on seismic perfor-mance of HRB600 reinforced high-strength concrete columns. China Civil Engineering Journal, 52(08), 6–17. (in Chinese).
Zhang, J. W., Liu, J., Li, X. Y., et al. (2021). Seismic behavior of steel fiber-rein-forced high-strength concrete mid-rise shear walls with high-strength steel rebar. Journal of Building Engineering, 42, 102462.
Zhao, S. B., Guan, J. F., Zhang, X. P., et al. (2008). Statistical analysis and experi-mental study of crack patterns of reinforced concrete beams. Engineering Mechanics, 25(12), 141–146. (in Chinese).
Zhao, S. B., Guan, J. F., Zhang, X. P., et al. (2009). Experimental study on effect of cross sectional depth of concrete beams on crack patterns. Journal of Hydraulic Engineering, 40(1), 88–93. (in Chinese).
Zhu, E. Y., Li, D. D., Qi, M., et al. (2018). Experimental research on crack calcula-tion of hydraulic RC beams with high-strength rebars. SHUILI XUEBAO, 49(05), 580–587. (in Chinese).
Publisher’s NoteSpringer Nature remains neutral with regard to jurisdictional claims in pub-lished maps and institutional affiliations.


![Analytical Model for the Calculation of Long Term Crack Width · shown in Fig. 1 (c). Al-Zaid [1] developed an analytical model for the calculation of long term cracking moment. The](https://static.fdocuments.in/doc/165x107/5e1f0ef62f32c624f35756ff/analytical-model-for-the-calculation-of-long-term-crack-width-shown-in-fig-1-c.jpg)