Introduction to Autodesk Storm and Sanitary...
28
Introduction to Autodesk Storm and Sanitary Analysis Charlie Ogden, P.E. – Autodesk, Inc. CI4352-L & CI6901-L This hands-on lab focuses on the interface of Autodesk Storm and Sanitary Analysis software and its capabilities. A special emphasis will be made on using stormwater data from AutoCAD® Civil 3D® software. The class will cover workflows for exporting a model from Civil 3D into Storm and Sanitary Analysis and performing an analysis. If you design pipe networks and you have been wondering how to start using this analysis tool, then this class is for you. Learning Objectives At the end of this class, you will be able to: Use the Storm and Sanitary Analysis interface to successfully set up and model a stormwater system Share model information between Civil 3D and Storm and Sanitary Analysis Identify the capabilities and limitations of Storm and Sanitary Analysis using Civil 3D data Analyze stormwater runoff, pipe networks, bypass, and detention ponds About the Speaker Charlie Ogden is a Sr. Quality Assurance Analyst at Autodesk, and a Professional Engineer licensed in Massachusetts. Prior to joining Autodesk, Charlie was a Solutions Specialist at a leading Autodesk reseller, providing Civil 3D implementation, consulting and training services for engineers and firms across the USA. He has 16 years of civil engineering and surveying experience, including residential subdivisions, commercial site plans, storm water management, and sewer and septic system designs. He holds a Bachelor of Science degree in Civil and Environmental Engineering, and an Associates of Science degree in Architectural Engineering Technology. He is a Civil 3D Implementation Certified Expert, and a Civil 3D Certified Professional. [email protected]
Transcript of Introduction to Autodesk Storm and Sanitary...

Introduction to Autodesk Storm and Sanitary Analysis Charlie Ogden, P.E. – Autodesk, Inc.
CI4352-L & CI6901-L This hands-on lab focuses on the interface of Autodesk Storm and
Sanitary Analysis software and its capabilities. A special emphasis will be made on using stormwater data from AutoCAD® Civil 3D® software. The class will cover workflows for exporting a model from Civil 3D into Storm and Sanitary Analysis and performing an analysis. If you design pipe networks and you have been wondering how to start using this analysis tool, then this class is for you.
Learning Objectives At the end of this class, you will be able to:
Use the Storm and Sanitary Analysis interface to successfully set up and model a stormwater system
Share model information between Civil 3D and Storm and Sanitary Analysis
Identify the capabilities and limitations of Storm and Sanitary Analysis using Civil 3D data
Analyze stormwater runoff, pipe networks, bypass, and detention ponds
About the Speaker
Charlie Ogden is a Sr. Quality Assurance Analyst at Autodesk, and a Professional Engineer licensed in
Massachusetts. Prior to joining Autodesk, Charlie was a Solutions Specialist at a leading Autodesk
reseller, providing Civil 3D implementation, consulting and training services for engineers and firms
across the USA. He has 16 years of civil engineering and surveying experience, including residential
subdivisions, commercial site plans, storm water management, and sewer and septic system designs.
He holds a Bachelor of Science degree in Civil and Environmental Engineering, and an Associates of
Science degree in Architectural Engineering Technology. He is a Civil 3D Implementation Certified
Expert, and a Civil 3D Certified Professional.
Introduction to Autodesk Storm and Sanitary Analysis
2
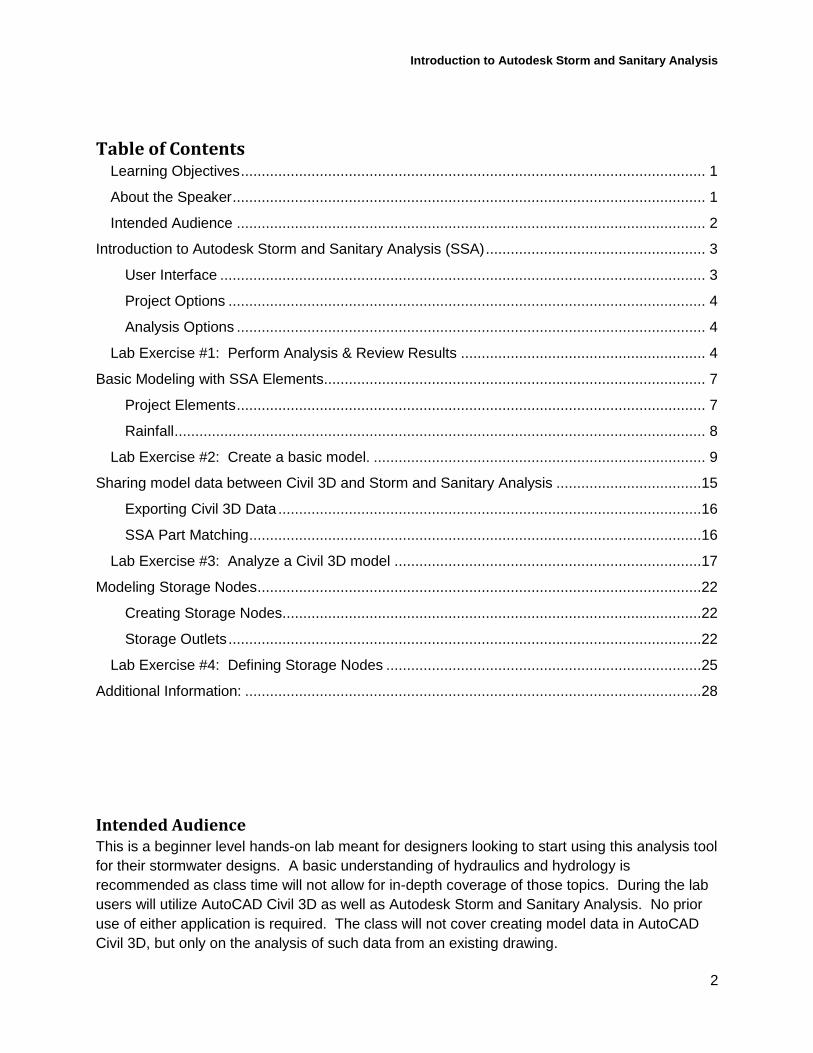
Table of Contents Learning Objectives ................................................................................................................ 1
About the Speaker .................................................................................................................. 1
Intended Audience ................................................................................................................. 2
Introduction to Autodesk Storm and Sanitary Analysis (SSA) ..................................................... 3
User Interface ..................................................................................................................... 3
Project Options ................................................................................................................... 4
Analysis Options ................................................................................................................. 4
Lab Exercise #1: Perform Analysis & Review Results ........................................................... 4
Basic Modeling with SSA Elements ............................................................................................ 7
Project Elements ................................................................................................................. 7
Rainfall ................................................................................................................................ 8
Lab Exercise #2: Create a basic model. ................................................................................ 9
Sharing model data between Civil 3D and Storm and Sanitary Analysis ...................................15
Exporting Civil 3D Data ......................................................................................................16
SSA Part Matching .............................................................................................................16
Lab Exercise #3: Analyze a Civil 3D model ..........................................................................17
Modeling Storage Nodes ...........................................................................................................22
Creating Storage Nodes .....................................................................................................22
Storage Outlets ..................................................................................................................22
Lab Exercise #4: Defining Storage Nodes ............................................................................25
Additional Information: ..............................................................................................................28
Intended Audience This is a beginner level hands-on lab meant for designers looking to start using this analysis tool
for their stormwater designs. A basic understanding of hydraulics and hydrology is
recommended as class time will not allow for in-depth coverage of those topics. During the lab
users will utilize AutoCAD Civil 3D as well as Autodesk Storm and Sanitary Analysis. No prior
use of either application is required. The class will not cover creating model data in AutoCAD
Civil 3D, but only on the analysis of such data from an existing drawing.

Introduction to Autodesk Storm and Sanitary Analysis
3
Introduction to Autodesk Storm and Sanitary Analysis (SSA) This class will introduce users to the use Autodesk Storm and Sanitary Analysis (“SSA”) for
analysis of stormwater networks. The main focus will be on modeling network data within SSA.
A stormwater model can either be created from scratch within SSA or imported from various
sources such as AutoCAD Civil 3D, AutoCAD Map 3D, or GIS data.
SSA allows users to model stormwater networks using various hydrology and hydraulic
computational methods; it can also be used to model sanitary sewer networks.
First off, there are a few ways to launch SSA:
1. Autodesk Storm and Sanitary Analysis shortcut on the desktop;
2. StartSSA Command within Civil 3D - which simply launches SSA;
3. EditInSSA command within Civil 3D - this launches SSA and transfers
Pipe Network data.
User Interface

Introduction to Autodesk Storm and Sanitary Analysis
4
Project Options
Assign the hydrology and hydraulic routing methods as well as default settings for elements to
be used for the project. The following shows some of the available methods:
Hydrology Methods: Time of Concentration methods: Hydraulic Routing Methods:
The User Guide discusses each of these methods in detail.
Analysis Options
Assign the time step settings as well as the design storms to be calculated.
Time Steps & Storm Duration
Storm Selection
o Rain Gage - Rainfall Time Series (used for most hydrology methods)
o IDF Curve (used for Rational methods)
Lab Exercise #1: Perform Analysis & Review Results 1. Launch SSA from the desktop shortcut.
2. Open TR-20.spf
a. File > Open…
b. C:\Program Files (x86)\Autodesk\SSA 2013\Samples\Hydrology Methods\TR-
20.spf
3. Save the file to the Desktop
(Please don’t save any changes to the original sample file)
a. File > Save As…
b. File name: Lab1
c. Select Save
4. Explore the Menus…
5. Explore the Toolbars… (hover over the icons to reveal the command name)
6. Explore the Data Tree… (the tree lists the types of data that could be in a model)
7. Explore the Plan View canvas (model view)…
8. Select Input > Project Options
9. On the General tab, confirm that the following are set - make changes where required.
a. Units System US Units
EPA SWMM Rational Modified Rational Santa Barbara UH SCS TR-20 SCS TR-55 HEC-1 UK Modified Rational
Carter Eagleson FAA Harris County, TX Kirpich Papadakis-Kazan SCS TR-55 User-Defined
Hydrodynamic Kinematic Wave Steady Flow
Introduction to Autodesk Storm and Sanitary Analysis
5
b. Hydrology Method SCS TR-20
c. Time of concentration (TOC): Kirpich
d. Link routing method Hydrodynamic
10. Explore the settings on the ID Labels tab (used to name new elements)
11. Explore the settings on the Element Prototypes tab (used to provide default values)
12. Select OK to close the dialog box
13. Select Analysis > Analysis Options…
14. On the General tab, review the Time steps and Dates: Start and End Analysis on times.
15. On the Storm Selection tab see that the selected storm uses the assigned rain gage
instead of a specific rainfall time series. (more on this in lab exercise 2)
16. Select OK to close the dialog box
17. Perform Analysis
a. Use either the Perform Analysis button ( ) or from the menu: Analysis >
Perform Analysis
b. Select OK
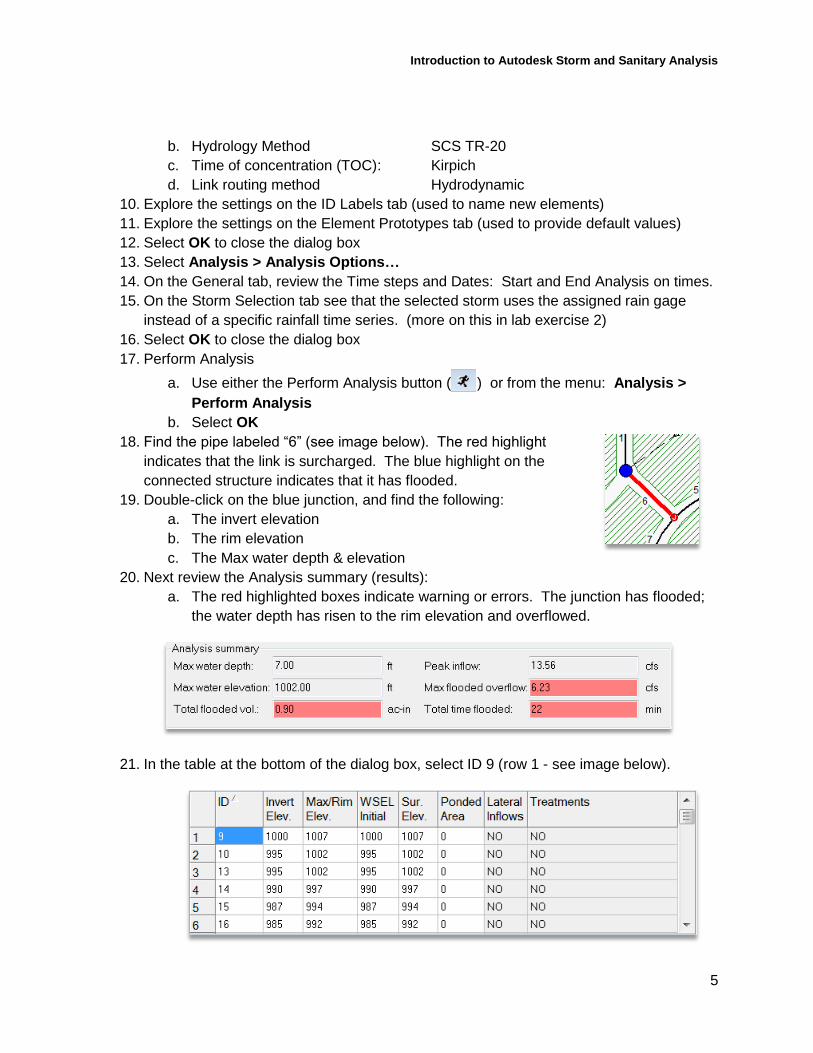
18. Find the pipe labeled “6” (see image below). The red highlight
indicates that the link is surcharged. The blue highlight on the
connected structure indicates that it has flooded.
19. Double-click on the blue junction, and find the following:
a. The invert elevation
b. The rim elevation
c. The Max water depth & elevation
20. Next review the Analysis summary (results):
a. The red highlighted boxes indicate warning or errors. The junction has flooded;
the water depth has risen to the rim elevation and overflowed.
21. In the table at the bottom of the dialog box, select ID 9 (row 1 - see image below).

Introduction to Autodesk Storm and Sanitary Analysis
6
a. Use the up and down arrows on your keyboard to scroll through the results of all
the other Junctions in the model. The values in the dialog box will change to
reflect those for the element selected in the table. Close when finished.
22. Double-click on the red pipe labeled “6”, and review the information in the dialog box,
and find the following:
a. The link type and shape
b. The link’s size: diameter & length
c. The link’s invert elevations & slope
23. Next review the Analysis summary (results):
a. The red highlighted boxes indicate warnings or errors. Notice that the link is
marked as “Surcharged” and the peak flow during analysis is greater than the
design flow capacity.
24. Increase the pipe’s diameter to 15 (do not press <enter> - instead click in a different cell)
and notice the change to the Design flow capacity, if it’s still not larger than the Peak
flow during analysis value, then increase it until it is, then press Close.
25. Select Perform Analysis ( ) again.
26. Review the results for the link again:
27. Change diameter to 18, and Perform Analysis ( ) - The Conveyance Links dialog box
can remain open while performing the analysis, but you’ll need to pick inside a cell to
see the values update.

Introduction to Autodesk Storm and Sanitary Analysis
7
28. At the bottom of the Conveyance Links dialog box select ID 1 (row 1), and review the
Analysis summary for any warnings.
29. Use the up and down arrows to scroll through the results of all the other Conveyance
Links in the model.
30. Please Do NOT Save changes to the original sample file (we want the next Lab to
see the original values). Thank you.
31. STOP
Basic Modeling with SSA Elements
Project Elements
Now let’s look at some of the element types that we can model in Storm and Sanitary Analysis.
System modeling in SSA is node-link-node based, so link elements are used to connect nodal
elements. Many elements can be added to the model using the Elements toolbar:
Subbasins
Subbasins are used to model the drainage areas for runoff flowing into the stormwater model.
Later we’ll see that Catchment objects from Civil 3D will be imported as Subbasins. Values
must be specified for drainage area, runoff coefficient (or curve number) and time of
concentration.
Connect the subbasins to Inlet elements using the following:
Right-click on a Subbasin > Connect To > select the Inlet
Introduction to Autodesk Storm and Sanitary Analysis
8
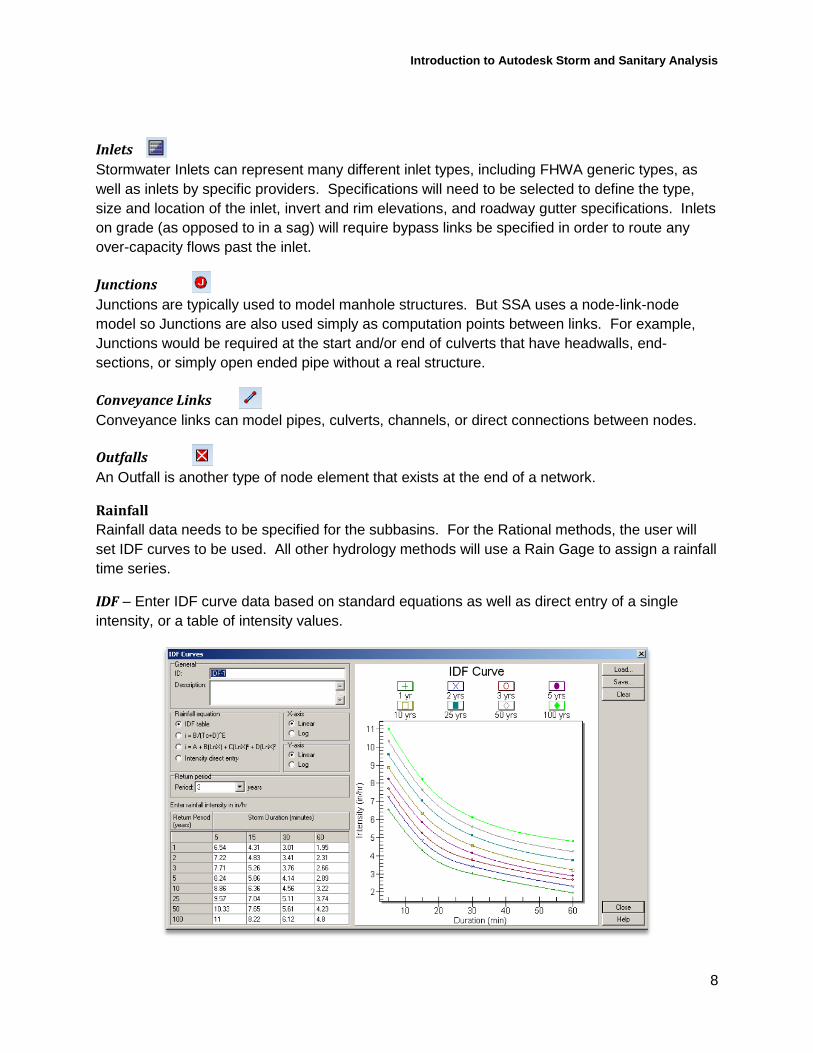
Inlets
Stormwater Inlets can represent many different inlet types, including FHWA generic types, as
well as inlets by specific providers. Specifications will need to be selected to define the type,
size and location of the inlet, invert and rim elevations, and roadway gutter specifications. Inlets
on grade (as opposed to in a sag) will require bypass links be specified in order to route any
over-capacity flows past the inlet.
Junctions
Junctions are typically used to model manhole structures. But SSA uses a node-link-node
model so Junctions are also used simply as computation points between links. For example,
Junctions would be required at the start and/or end of culverts that have headwalls, end-
sections, or simply open ended pipe without a real structure.
Conveyance Links
Conveyance links can model pipes, culverts, channels, or direct connections between nodes.
Outfalls
An Outfall is another type of node element that exists at the end of a network.
Rainfall
Rainfall data needs to be specified for the subbasins. For the Rational methods, the user will
set IDF curves to be used. All other hydrology methods will use a Rain Gage to assign a rainfall
time series.
IDF – Enter IDF curve data based on standard equations as well as direct entry of a single
intensity, or a table of intensity values.

Introduction to Autodesk Storm and Sanitary Analysis
9
Rain Gage – Use the Rainfall Designer to assign standard rainfall data. Typical rainfall depths
are available for each county in the United States. Many Storm Distribution curves are available
as well, including the various SCS curves.
Lab Exercise #2: Create a basic model. 1. Import the background image
a. Launch SSA from the desktop shortcut (if it’s not still open)
b. File > New (don’t save the current file if it’s still open)
c. View > Layer Manager
d. Select the ellipses ( ) for Image/CAD file:
e. Browse to and open:
<lab_dataset_location>\DATASET\Conceptual\ConceptDrainage.tif
f. Notice that the World coordinate file is also located.
g. Select OK
h. The image should be brought into the Plan View canvas. This is a screen
capture from an Autodesk Infrastructure Modeler conceptual design, but you
could also use an AutoCAD DWG file as a background - as we’ll see later.
i. You could use the measurement tools ( ) to see that the image is sized
realistically.

Introduction to Autodesk Storm and Sanitary Analysis
10
Note: It is not necessary to use geo-referenced images for realistic dimensions because
areas and lengths can be entered directly. However, it does make things easier!
2. Setup the Project Options
a. From the menu: Input > Project Options
b. Select the following options on the General tab:
Unit System: US Units
Flow units: CFS
Elevation type: Elevation
Hydrology Method: SCS TR-20
Time of Concentration: SCS TR-55
Minimum allowable TOC: 5 min
Link Routing Method: Hydrodynamic
c. Select OK
3. Create a Subbasin: For simplicity, let’s assume we need to fill in the island created by
the three roads to add new homes. Assume runoff on this area still flows toward the
new road…
a. Select the Add Subbasin icon ( )
b. Trace the centerline of the roads to create a closed shape for the subbasin.
Double-click on your last point to end drawing the subbasin.

Introduction to Autodesk Storm and Sanitary Analysis
11
Right-click anywhere and choose Select
Alternative: Add the subbasin with a double-click in canvas, and manually enter the area
(a default area will be used initially). This is helpful if the shape or size of the subbasin
cannot be traced. Note: Double-clicking to create other elements will actually create two.
4. Let’s create a simple network consisting of an Inlet, a Junction and an Outfall before the
detention pond. Something like this:
Introduction to Autodesk Storm and Sanitary Analysis
12
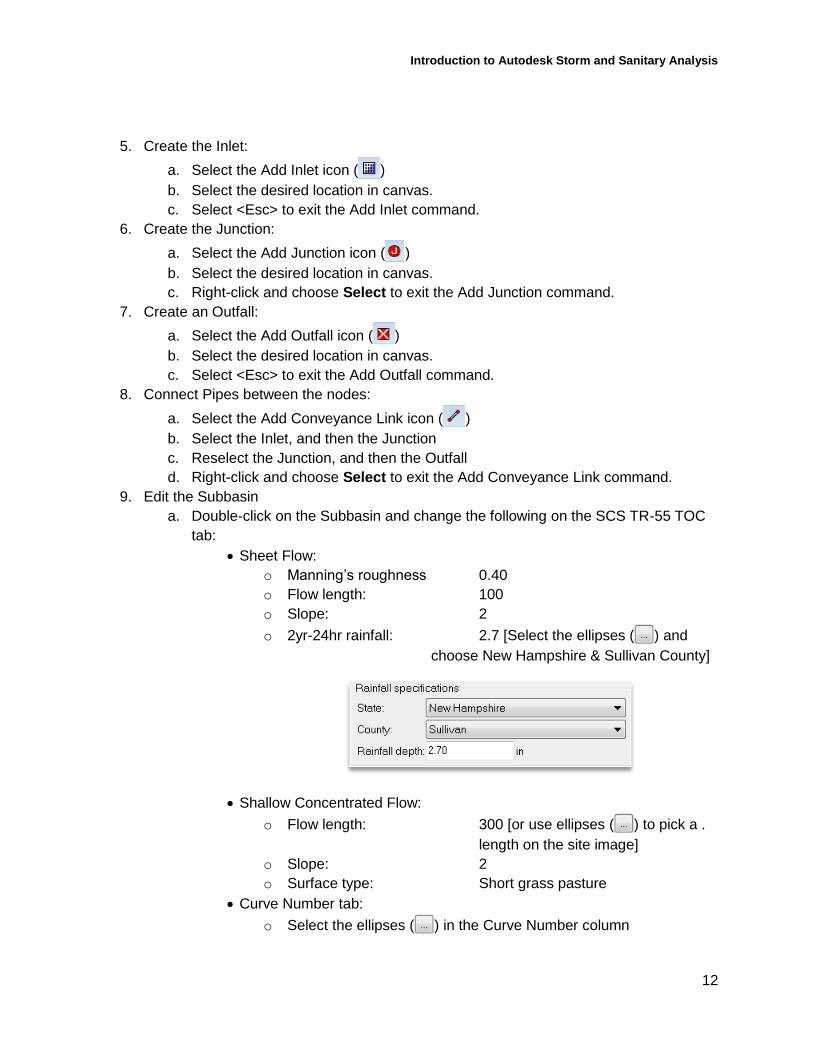
5. Create the Inlet:
a. Select the Add Inlet icon ( )
b. Select the desired location in canvas.
c. Select <Esc> to exit the Add Inlet command.
6. Create the Junction:
a. Select the Add Junction icon ( )
b. Select the desired location in canvas.
c. Right-click and choose Select to exit the Add Junction command.
7. Create an Outfall:
a. Select the Add Outfall icon ( )
b. Select the desired location in canvas.
c. Select <Esc> to exit the Add Outfall command.
8. Connect Pipes between the nodes:
a. Select the Add Conveyance Link icon ( )
b. Select the Inlet, and then the Junction
c. Reselect the Junction, and then the Outfall
d. Right-click and choose Select to exit the Add Conveyance Link command.
9. Edit the Subbasin
a. Double-click on the Subbasin and change the following on the SCS TR-55 TOC
tab:
Sheet Flow:
o Manning’s roughness 0.40
o Flow length: 100
o Slope: 2
o 2yr-24hr rainfall: 2.7 [Select the ellipses ( ) and
choose New Hampshire & Sullivan County]
Shallow Concentrated Flow:
o Flow length: 300 [or use ellipses ( ) to pick a .
length on the site image]
o Slope: 2
o Surface type: Short grass pasture
Curve Number tab:
o Select the ellipses ( ) in the Curve Number column
Introduction to Autodesk Storm and Sanitary Analysis
13
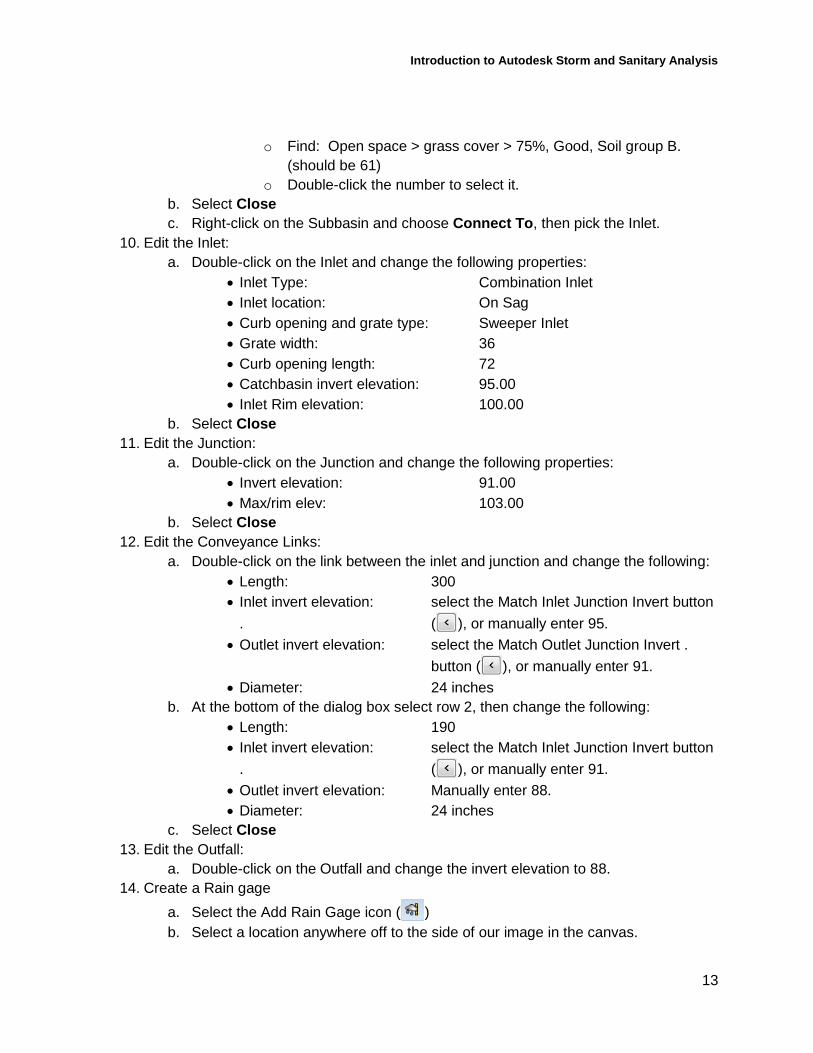
o Find: Open space > grass cover > 75%, Good, Soil group B.
(should be 61)
o Double-click the number to select it.
b. Select Close
c. Right-click on the Subbasin and choose Connect To, then pick the Inlet.
10. Edit the Inlet:
a. Double-click on the Inlet and change the following properties:
Inlet Type: Combination Inlet
Inlet location: On Sag
Curb opening and grate type: Sweeper Inlet
Grate width: 36
Curb opening length: 72
Catchbasin invert elevation: 95.00
Inlet Rim elevation: 100.00
b. Select Close
11. Edit the Junction:
a. Double-click on the Junction and change the following properties:
Invert elevation: 91.00
Max/rim elev: 103.00
b. Select Close
12. Edit the Conveyance Links:
a. Double-click on the link between the inlet and junction and change the following:
Length: 300
Inlet invert elevation: select the Match Inlet Junction Invert button
. ( ), or manually enter 95.
Outlet invert elevation: select the Match Outlet Junction Invert .
button ( ), or manually enter 91.
Diameter: 24 inches
b. At the bottom of the dialog box select row 2, then change the following:
Length: 190
Inlet invert elevation: select the Match Inlet Junction Invert button
. ( ), or manually enter 91.
Outlet invert elevation: Manually enter 88.
Diameter: 24 inches
c. Select Close
13. Edit the Outfall:
a. Double-click on the Outfall and change the invert elevation to 88.
14. Create a Rain gage
a. Select the Add Rain Gage icon ( )
b. Select a location anywhere off to the side of our image in the canvas.
Introduction to Autodesk Storm and Sanitary Analysis
14
c. Right-click and choose Select to exit the Add Rain Gage command.
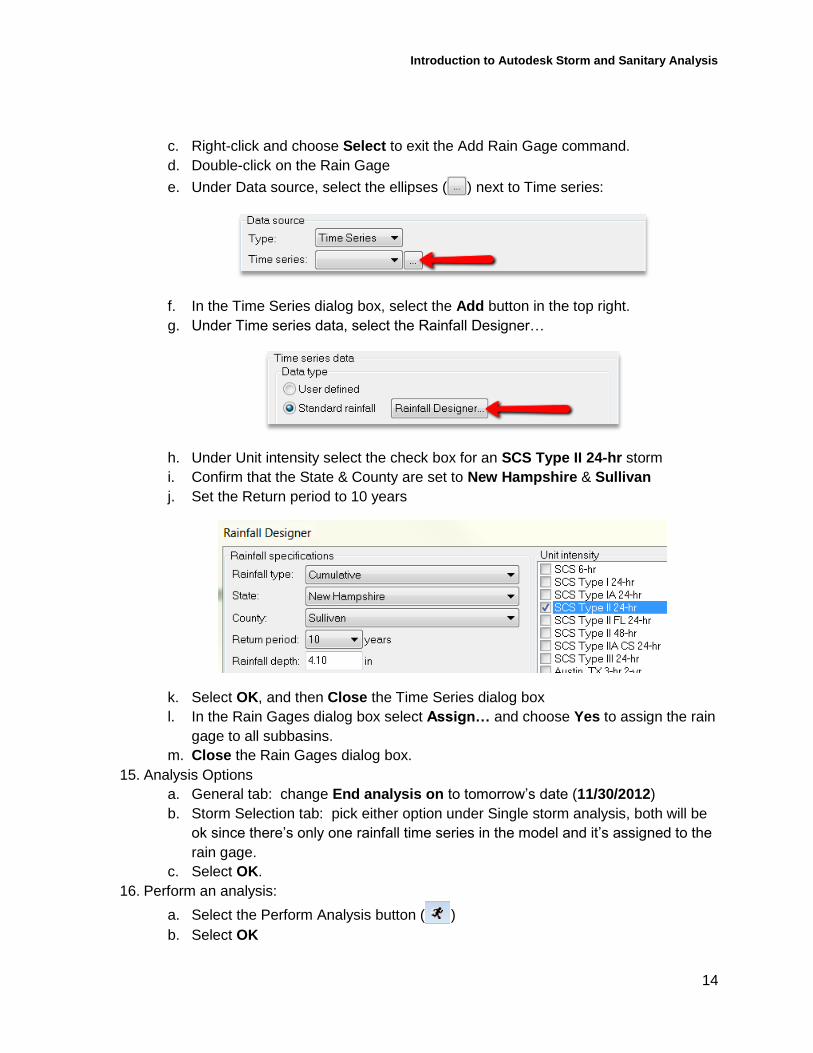
d. Double-click on the Rain Gage
e. Under Data source, select the ellipses ( ) next to Time series:
f. In the Time Series dialog box, select the Add button in the top right.
g. Under Time series data, select the Rainfall Designer…
h. Under Unit intensity select the check box for an SCS Type II 24-hr storm
i. Confirm that the State & County are set to New Hampshire & Sullivan
j. Set the Return period to 10 years
k. Select OK, and then Close the Time Series dialog box
l. In the Rain Gages dialog box select Assign… and choose Yes to assign the rain
gage to all subbasins.
m. Close the Rain Gages dialog box.
15. Analysis Options
a. General tab: change End analysis on to tomorrow’s date (11/30/2012)
b. Storm Selection tab: pick either option under Single storm analysis, both will be
ok since there’s only one rainfall time series in the model and it’s assigned to the
rain gage.
c. Select OK.
16. Perform an analysis:
a. Select the Perform Analysis button ( )
b. Select OK

Introduction to Autodesk Storm and Sanitary Analysis
15
17. BONUS (if time remains): Determine a preliminary size for a detention basin:
a. Select the Time Series Plot button ( ) found below the Plan View tree in the
bottom left of the application.
b. In the Time Series Plot tree expand Nodes > Total Inflow
c. Select the Outfall (Out-01)
d. In the Total Inflow Summary Table below the canvas, enter the Max flow allowed
as 10.
e. Press Enter (then hover mouse over the plot area so that numbers update).
f. The required Detention Storage is reported in the table, and displayed as the
cyan shaded area on the Time Series Plot.
18. STOP
Sharing model data between Civil 3D and Storm and Sanitary Analysis A recommended approach for using these products together harnesses the stronger abilities of
each product to best perform a design. Creating Catchments, Pipe and Structure elements in
Civil 3D instead of in SSA can take advantage of other model elements in a way that SSA
cannot (for example, surface elevations, alignment stations and offsets, and full profiles). Pipe
Network rules can be used for initial pipe inverts and slopes. However, some hydrology and
hydraulic properties (e.g. inlets, and channels) are more appropriately entered in SSA which
allows for the detail needed to perform an analysis.
Profiles within SSA only show ground data by connecting the rim elevations of structures, and
therefore do not show the full profiled surface between structures; and there’s no terrain model.
Some other tools within Civil 3D are worth noting as they can be used to gather important
information for analysis from the Civil 3D model that is not readily available inside of SSA.
1. Water Drop: to assist with Catchment placement;
2. Stage Storage Tool: to calculate storage volumes;
3. Hydraflow Hydrographs: Pond tools to calculate complex Stage-Discharge data

Introduction to Autodesk Storm and Sanitary Analysis
16
Exporting Civil 3D Data
The data transfer method between Civil 3D and SSA uses Autodesk’s Hydraflow Storm Sewers
data file, so Civil 3D uses the same settings that it uses to transfer data to and from Hydraflow
Storm Sewers. It is also important to understand how SSA transfers data to and from this file.
This file has an extension of .stm and I may refer to it as an “STM file”. Please note that actual
use of Hydraflow Storm Sewers is NOT required for this data transfer.
Some important details of the settings used within Civil 3D and SSA are described below.
Storm Sewers Migration Defaults
These defaults control how Civil 3D exports and imports STM file data. These settings are
accessed from the Settings tab.
Part Matching Defaults
Controls the matching between Civil 3D Part Family’s and Storm Sewers Part Types for
both Import into Civil 3D and Export from Civil 3D.
Parts List Used for Migration
A best practice is to select a Full Parts List for Migration. This will ensure that all Part
Families and default sizes are available when importing data from an STM file.
Allow Part Family Swapping
Turning this off will allow you to avoid matching to an unexpected family. For example, if
you have a mixed material network (some concrete pipes and some plastic pipes) you
won’t want all your pipes reimported as concrete pipe because the Storm Sewers file
and SSA only recognize the shape of pipe, not the material.
Use Imported Part ID for Part Family
This option would only be used for advanced part matching that uses an XML file to
more directly match Part Family’s to SSA Part Types. Unfortunately due to time
constraints this is beyond the scope of this course (see note at bottom of page 17).
SSA Part Matching
SSA must make an interpretation between the Storm Sewers part types and the available SSA
elements. The Storm Sewers format is limited to only ten (10) different part types. There are
many more types available in SSA. When importing and exporting STM files, SSA will assign
an element and/or inlet type based on the following chart (reading from left to right shows the
STM part types exported from Civil 3D that become SSA parts upon import, and then the
exported STM parts that will be imported into Civil 3D. ** denotes items that will not round-trip.

Introduction to Autodesk Storm and Sanitary Analysis
17
STM Part Type
Exported from
Civil 3D
→ Corresponding SSA Part Type
→ STM Part Type
Imported into
Civil 3D
Manhole
Junction
Manhole
Combination
Inlet
Inlet - FHWA Combination
Combination
Inlet
Curb Inlet
Inlet - FHWA Curb (on Grade)
Curb Inlet
Grate Inlet
Inlet - FHWA Grate
(Rectangular)
Grate Inlet
Drop Grate
Inlet - Median & Ditch
Drop Grate
Drop Curb
Inlet - FHWA Curb (on Sag)
Drop Curb
Generic
Generic
Headwall
Junction (or Outfall if end of
run)
Manhole**
No Structure
Junction
Manhole**
Outfall
Outfall
Outfall
N/A
Inlet - FHWA Grate (Circular)
Grate Inlet
N/A
Storage Node
Manhole
N/A
Diversion
Manhole
Advanced: There is also a part matching XML file that can be created to better control
matching parts between Civil 3D or Map 3D and SSA. This is beyond the scope of the lab, but
more information can be found in the Civil 3D User’s Guide under: Catchments and Flow Path
Analysis > Analyzing Catchments in Storm and Sanitary Analysis > Part Matching Between
AutoCAD Civil 3D and Storm and Sanitary Analysis.
Lab Exercise #3: Analyze a Civil 3D model 1. Open the Civil 3D drawing
a. Launch Civil 3D
b. File > Open
c. Open: <lab dataset location>\DATASET\Civil3D\ _AU2012Lab-A.dwg
2. Examine a Catchment and it’s connected part

Introduction to Autodesk Storm and Sanitary Analysis
18
a. On Prospector expand Catchments > Proposed
b. Select CB-7, right-click and choose ZoomTo
c. From Prospector, right-click on CB-7 again and choose Properties…
d. Find the Reference Pipe Network Structure property and verify that it’s value is
CB-7
e. Familiarize yourself with the other properties and then select OK.
3. Examine Pipe Network parts used
a. On Prospector expand Pipe Networks > Networks > StormDrains_C
b. Select Structures
c. In the Item Preview list select CB-7, right-click and choose Structure
Properties…
d. On the Part Properties tab find Part Data > Part Description
i. It should be a Concentric Cylindrical Structure, select OK
e. Repeat the above steps for MH-106
i. It should be an Eccentric Cylindrical Structure, select OK
4. Review the Part Matching settings
a. Select the Settings tab of Toolspace
b. Right-click on Pipe Network and choose Edit Feature Settings…
c. Expand Storm Sewers Migration Defaults
d. Select in the empty cell for Part Matching Defaults, and then press the ellipsis
e. Change to the Export tab and view the settings for our part types, and make the
following changes if necessary:
i. Concentric Cylindrical Structure: Combination Inlet Rectangular
ii. Eccentric Cylindrical Structure: Manhole Circular
f. On the Import tab confirm that the above matching is set in the opposite
direction by making the following changes, if necessary:
i. Combination Inlet Rectangular Concentric Cylindrical Structure
ii. Combination Inlet Circular Concentric Cylindrical Structure
iii. Manhole Circular Eccentric Cylindrical Structure
iv. Manhole Rectangular Eccentric Cylindrical Structure
g. Select OK, and then OK again
5. Analyze the network in Storm and Sanitary Analysis
a. From the ribbon, select Analyze > Edit in Storm and Sanitary Analysis ( )
b. Confirm that the three Pipe Networks are selected, and press OK.

Introduction to Autodesk Storm and Sanitary Analysis
19
c. Once SSA opens, select OK to Create a new project… wait for it to import.
d. Select No, not to save the log file
e. Select the Plan View tab and you should see the Civil 3D model in the canvas
with SSA elements for the network parts.
f. Find and Review the following elements that were imported:
i. Subbasin CB-7 double-click the element type from the Data Tree
ii. Inlet CB-7 find the element in the list, then pick Show
iii. Pipe - (73)
6. Setup the Project Options: before we can analyze the network
we must setup the model…
a. Double-click on Project Options on the Plan View tree
(or use Input > Project Options)
b. Confirm that the model is using:
i. Hydrology Method: Rational
ii. Time of Concentration: SCS TR-55

Introduction to Autodesk Storm and Sanitary Analysis
20
c. Change the following:
i. Link routing method: Hydrodynamic
d. Select OK
7. Setup the Analysis Options
a. Double-click on Analysis Options on the Plan View tree (or Analysis > Analysis
Options)
b. Change the End Analysis on: time to 03:00:00, so the Analysis Duration is 3 hrs:
c. On the Storm Selection tab Use return period 2 years.
d. Select OK.
8. Perform Analysis
a. Perform Analysis ( )
b. There may be a number of surcharged pipes (highlighted red) and flooded
structures (highlighted blue). For now let’s just fix a few…
9. Edit the model: Let’s make some changes to some of the elements in the model:
a. Subbasins:
i. From the Plan View tree double-click on Subbasins
ii. Find Subbasin CB-7 in the list at the bottom of the dialog box, and select
the Show button in the top right - this will highlight the subbasin in the
canvas… zoom in to the network fed by this subbasin.
iii. Edit the two Subbasins so that the runoff coefficients are 0.50
b. Inlets CB-7 & CB-8
i. Equal Length Inlet, change to: Sweeper Inlet
ii. Grate width: 48 (double grate into the road)
iii. Curb opening length: 72
iv. Gutter Depression: 3”
c. Change the pipe diameters for the following pipes (Conveyance Links):
i. Pipe-(72): 18”
ii. Pipe-(73): 24”
iii. Pipe-(74): 24”
iv. Pipe-(75): 24”
v. Pipe-(76): 18”
d. Perform the Analysis ( ) again
10. Profile Plot: Let’s view a profile of the network:
a. Select the Profile Plot button ( ) below the data tree

Introduction to Autodesk Storm and Sanitary Analysis
21
b. Select Inlet CB-7 for the starting point,
c. Select the Outfall at the end of the run as the ending point
d. Right-click and choose Show Plot:
e. Select Output > Output Animation
f. Press Play ( )
BONUS (if time remains):
11. Export changes back to Civil 3D
a. File > Export > Hydraflow Storm Sewers File…
b. Give the file a name and save it where you can find it.
c. You can select No, not to save the log file.
d. File > Save the Storm and Sanitary Analysis file for the next Lab exercise.
12. Import changes back into Civil 3D
a. From Civil 3D ribbon: Insert > Import > Storm Sewers
b. Browse to the file you just exported from SSA
c. Select Update the existing pipe network
d. You’ll see messages regarding the Outfalls not being matched exactly - that’s
because the STM file used to transfer the data does not retain the outfall size.
13. STOP

Introduction to Autodesk Storm and Sanitary Analysis
22
Modeling Storage Nodes Storage nodes are network elements with associated storage volume. They can represent
storage facilities as small as a catchbasin, or more commonly as a detention pond, and as large
as a reservoir or lake. They can represent open surface storage or sub-surface storage.
Creating Storage Nodes
There are two types of Storage Node definitions in SSA:
Functional type is used to define the relationship between the surface area and depth using
the following formula:
Area = (Constant Surface Area) + B * DepthC
For storage tanks (and other fixed footprint structures with vertical walls) only the
Constant Area entry is specified (ft2 or m2), the Coefficient B and Exponent C values
need to remain blank (or entered as 0).
Storage Curve type allows the user to define the relationship of area or volume per depth (or
stage). The curve created by this data is known as a Stage-Storage Curve. The stage values
are a depth in the pond instead of an actual elevation value. This makes the curve reusable for
other storage nodes, and also easier to raise and lower, since it's independent of the surface
elevations. Results from Civil 3D's Stage Storage calculations can be used to define this curve.
Storage Outlets
Various elements can be used to model discharge from a storage node. There could be
multiple elements used in combination in order to control discharge for different storm events.
Available outlets include Conveyance Links, Weirs, Orifices, generic Outlets, and Exfiltration.
Weirs
Weirs can be used either as part of an emergency spillway, or part of an outlet structure. In
SSA they are represented as a link connecting two nodes, where the weir itself is located at the
upstream node. Some typical shapes that can be modeled with SSA are shown below:
V-Notch Trapezoidal (& Rectangular)

Introduction to Autodesk Storm and Sanitary Analysis
23
Side Flow Transverse
Orifices
Orifices are often used to control the rate of flow out of a pond. They are often cut into a
concrete wall or structure as a certain size and elevation to best control the outflow for a
particular storm event. They are often used as part of an outlet structure.
In SSA they are represented as a link connecting two nodes, where the orifice itself is located at
the upstream node. They can be either a circular or rectangular shape in the side or bottom of
the wall.
Side Bottom
Outlets
Outlets are flow control devices that cannot easily be characterized by pipes, orifices, or weirs.
They are modeled by either a discharge function or a stage-discharge rating curve. This makes
it easy to model any special outlet for which this discharge information is known.

Introduction to Autodesk Storm and Sanitary Analysis
24
Exfiltration
Exfiltration refers to the flow of water out of the pond as it infiltrates into the ground below. The
method of exfiltration is set for the project in the Project Options dialog box. The available
options are:
Constant Flow Rate – a value in cubic feet per second or cubic meters per second.
Constant Exfiltration Rate – an average rate in in/hr. or mm/hr.
Horton Exfiltration Method – A more complex method that models the decreasing rate of
exfiltration over time as the soil becomes more saturated.
The actual properties for each Storage node are defined inside the Storage node dialog box.
The user sets where and when the exfiltration occurs, and specifies a value.
No Exfiltration - No exfiltration losses will occur from the detention pond structure.
At All Elevations - Exfiltration losses will be considered to occur for all water surface
elevations within the detention pond structure.
Above Elevation (or Above Depth) - Exfiltration losses will occur above the specified
elevation (or depth). This commonly occurs when there is a pond liner to maintain a
minimum water surface elevation within a basin - such as a wet retention pond.
Introduction to Autodesk Storm and Sanitary Analysis
25
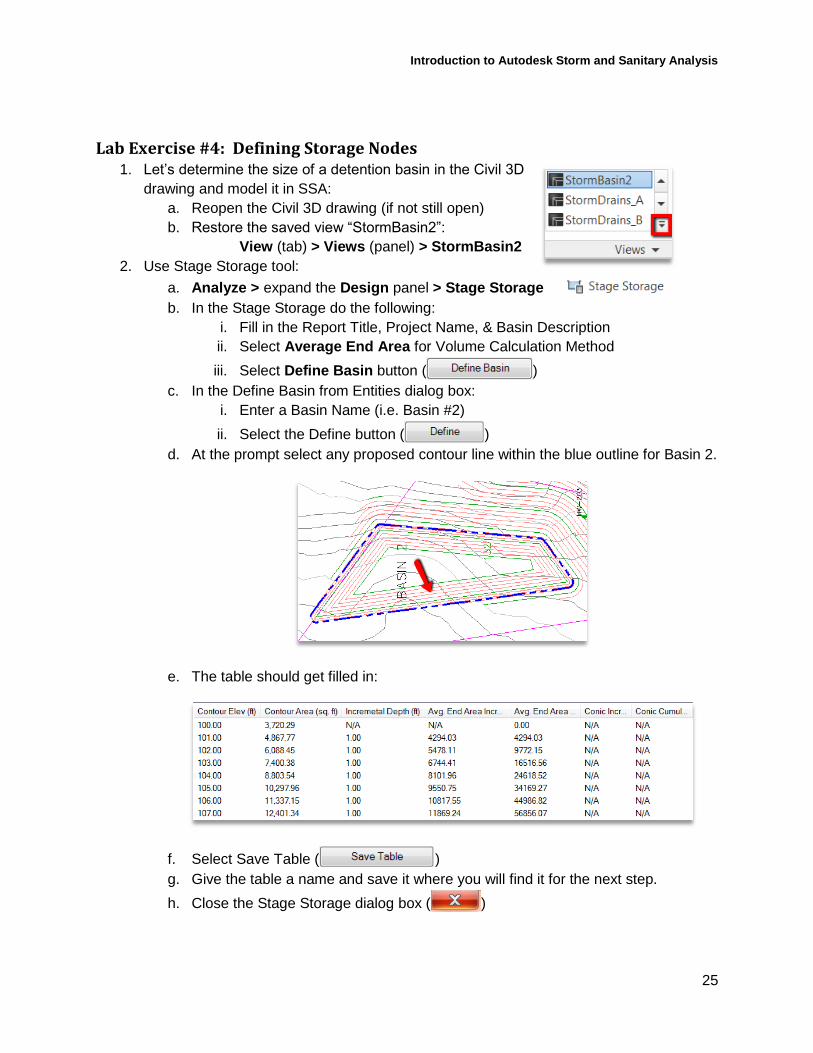
Lab Exercise #4: Defining Storage Nodes 1. Let’s determine the size of a detention basin in the Civil 3D
drawing and model it in SSA:
a. Reopen the Civil 3D drawing (if not still open)
b. Restore the saved view “StormBasin2”:
View (tab) > Views (panel) > StormBasin2
2. Use Stage Storage tool:
a. Analyze > expand the Design panel > Stage Storage
b. In the Stage Storage do the following:
i. Fill in the Report Title, Project Name, & Basin Description
ii. Select Average End Area for Volume Calculation Method
iii. Select Define Basin button ( )
c. In the Define Basin from Entities dialog box:
i. Enter a Basin Name (i.e. Basin #2)
ii. Select the Define button ( )
d. At the prompt select any proposed contour line within the blue outline for Basin 2.
e. The table should get filled in:
f. Select Save Table ( )
g. Give the table a name and save it where you will find it for the next step.
h. Close the Stage Storage dialog box ( )

Introduction to Autodesk Storm and Sanitary Analysis
26
3. Create a storage node in SSA
a. If you’ve already closed SSA project from the previous exercise, then do the
following, otherwise continue to step b.
i. At the Command line in Civil 3D enter: STARTSSA
ii. Press <Enter>
iii. Open the project from the previous exercise, or alternatively you may
open: …\DATASET\Civil3D\_AU2012Lab-B.spf
b. Zoom to the area near Basin 2 (or MH-108)
c. Add a Storage Node in the center of the basin using the Add Storage Node
button ( )
d. Right-click and choose Select
e. Double-click on the new Storage Node,
and change the following:
i. Invert elevation: 100.00
ii. Maximum elev: 107.00
iii. Type: Storage .
Curve
f. Select the ellipses next to the Storage
curve property
g. In the Storage Curves dialog box:
i. Select Add
ii. Select Load
iii. Change Files of Type to:
iv. Browse to and open the Stage Storage Table saved from Civil 3D
Alternative: you may load the file:
…\Dataset\Civil3D\Basin2.AeccSST
v. Select Close, and then Close again to get back to the Plan View.
4. Route the Pipe Network through the Storage Node. The current Outfall should be a
Junction, and connected to the Storage Node with a “Direct” Conveyance Link.

Introduction to Autodesk Storm and Sanitary Analysis
27
TIP: If possible retain the Outfall imported from Civil 3D as an Outfall so that when imported
back to Civil 3D it will be recognized as the same Pipe Network. So we’ll create a new
junction, connect the existing pipe to it, and move the outfall.
a. Select the Outfall ( ) near Basin 2,
b. Right-click and choose Duplicate,
c. Pick a point next to the original location.
d. Right-click the new Outfall and choose
Convert to > Junction
e. Select the Conveyance Link connected to the
Outfall,
f. Right-click and choose Connect From/To
g. Pick the upstream Junction and then the new
Junction.
h. Move the Outfall to a location to the west of
Basin 2 (see image to right).
i. Change the Outfall’s invert elevation to 100.
j. Select Add Conveyance Link ( )
k. Pick the new Junction and then the Storage
Node
l. Right-click and choose Select
m. Double-click on the new conveyance link
i. For Inlet Invert Elevation pick the Match
Inlet Junction Elevation button ( ).
ii. Outlet Invert Elevation: 107.00
iii. Change the Shape to Direct ( )
TIP: You won’t be able to change the invert elevation after changing the shape to
direct… which is fine, but won’t look very good on a Profile Plot.
iv. Close the Conveyance Links dialog box
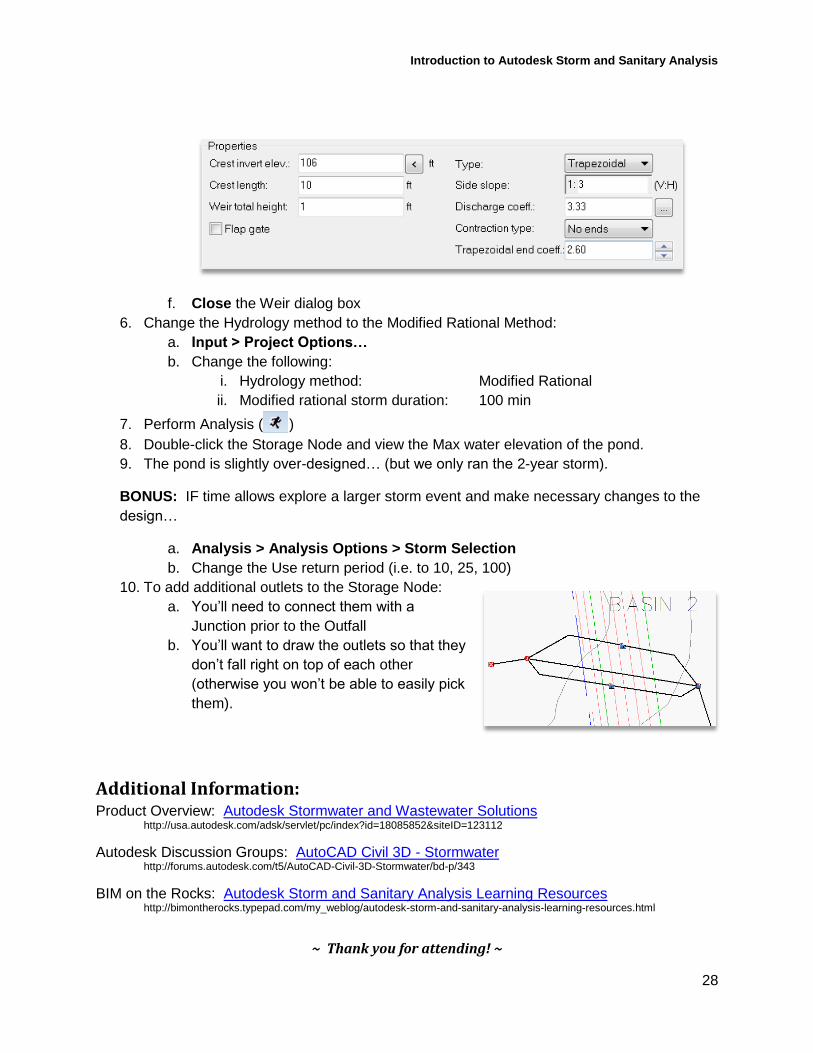
5. Lastly the model needs an outlet from the storage node. We’ll add a weir, but you could
also add pipe(s), orifice(s) or a combination of multiple outlets.
a. Select the Add Weir button ( )
b. Pick the Storage Node and then the Outfall
c. Press <Esc> to end the command
d. Double-click on the Weir (notice that weir’s are represented by links not nodes)
e. Select the following properties:
Introduction to Autodesk Storm and Sanitary Analysis
28
f. Close the Weir dialog box
6. Change the Hydrology method to the Modified Rational Method:
a. Input > Project Options…
b. Change the following:
i. Hydrology method: Modified Rational
ii. Modified rational storm duration: 100 min
7. Perform Analysis ( )
8. Double-click the Storage Node and view the Max water elevation of the pond.
9. The pond is slightly over-designed… (but we only ran the 2-year storm).
BONUS: IF time allows explore a larger storm event and make necessary changes to the
design…
a. Analysis > Analysis Options > Storm Selection
b. Change the Use return period (i.e. to 10, 25, 100)
10. To add additional outlets to the Storage Node:
a. You’ll need to connect them with a
Junction prior to the Outfall
b. You’ll want to draw the outlets so that they
don’t fall right on top of each other
(otherwise you won’t be able to easily pick
them).
Additional Information: Product Overview: Autodesk Stormwater and Wastewater Solutions
http://usa.autodesk.com/adsk/servlet/pc/index?id=18085852&siteID=123112
Autodesk Discussion Groups: AutoCAD Civil 3D - Stormwater http://forums.autodesk.com/t5/AutoCAD-Civil-3D-Stormwater/bd-p/343
BIM on the Rocks: Autodesk Storm and Sanitary Analysis Learning Resources http://bimontherocks.typepad.com/my_weblog/autodesk-storm-and-sanitary-analysis-learning-resources.html
~ Thank you for attending! ~