Feasibility Study Storm & Sanitary Servicing
91
Storm & Sanitary Servicing Feasibility Study Jasper Gates RioCan Real Estate Investment Trust 1161 107735 Prepared for: City of Edmonton Prepared by: Stantec Consulting Ltd. Suite #400, 10220 – 103 Ave NW Edmonton, AB T5J 0K4 Tel: (780) 917-7000 December 20, 2019
Transcript of Feasibility Study Storm & Sanitary Servicing

Storm & Sanitary Servicing Feasibility Study
Jasper Gates
RioCan Real Estate Investment Trust
1161 107735
Prepared for:City of Edmonton
Prepared by:Stantec Consulting Ltd.Suite #400, 10220 – 103 Ave NWEdmonton, AB T5J 0K4Tel: (780) 917-7000
December 20, 2019

STORM & SANITARY SERVICING FEASIBILITY STUDY
August 21, 2019
en v:\1161\active\1161107735\reports\servicing feasibility report\01_report\2019 12 19_jaspergates_servicingrpt.docx 1.1
Table of Contents
1.0 INTRODUCTION................................................................................................................21.1 SITE INFORMATION & PURPOSE OF REPORT...................................................................21.2 EXISTING CONDITIONS .....................................................................................................21.3 BACKGROUND INFORMATION .......................................................................................2
2.0 STORM SERVICING ..........................................................................................................42.1 APPROACH TO DOWNSTREAM STORM CAPACITY REVIEW .........................................42.2 EXISTING STORM SERVICE AND PRE-DEVELOPMENT FLOW ..........................................42.3 POST-DEVELOPMENT FLOW.............................................................................................52.4 STORAGE VOLUME...........................................................................................................52.5 PROPOSED STORM SERVICING LOCATION AND STORMWATER FLOW
CHANGES..........................................................................................................................72.6 IMPACT TO EXISTING DRAINAGE NETWORK ..................................................................7
3.0 SANITARY SERVICING .....................................................................................................93.1 APPROACH TO DOWNSTREAM SANITARY CAPACITY REVIEW.....................................93.2 EXISTING SANITARY SERVICES..........................................................................................93.3 PROPOSED SANITARY SERVICING & REDEVELOPMENT SEWAGE FLOW ...................103.4 IMPACT TO EXISTING DRAINAGE NETWORK ................................................................11
4.0 CONCLUSION ................................................................................................................13
LIST OF TABLESTable 1 – Existing Storm Flow.......................................................................................................4Table 2 – Proposed Storm Flow - Peak Flow..............................................................................5Table 3 - Storage Volume Calculation Summary ....................................................................6Table 4 - Existing Storm Sewer Capacity ...................................................................................7Table 5 - Existing Sanitary Flow ...................................................................................................9Table 6 – Proposed Sanitary Flow (City of Edmonton) ..........................................................10Table 7 - Existing Sanitary Sewer Capacity.............................................................................11
LIST OF FIGURESFigure 1 – Site Location
LIST OF APPENDICESAppendix A – Existing Plan & ResourcesAppendix B – Storm ServicingAppendix C – Sanitary ServicingAppendix D – Overall Drainage Network Plan
STORM & SANITARY SERVICING FEASIBILITY STUDY
August 21, 2019
en v:\1161\active\1161107735\reports\servicing feasibility report\01_report\2019 12 19_jaspergates_servicingrpt.docx 1.2
1.0 Introduction
1.1 SITE INFORMATION & PURPOSE OF REPORT
RioCan Estate Investment Trust is proposing to rezone a lot located on the south west corner of Stony Plain Road and 149 Street within the West Jasper Place neighbourhood to DC2. The site is currently zoned as CB1 in the City of Edmonton. This sanitary and storm servicing study has been prepared on behalf of the client for the 4.291 ha redevelopment located in Lots 5-8 Block 61 Plan 9022422.
The site is proposed to be a mixed-use development consisting of public spaces and amenity areas, low to high-rise residential buildings and retail commercial spaces.
Specifically, this report shall provide an inventory of existing storm and sanitary outlets from the site and considers the capacity of the downstream sewer systems.
The purpose of this report is to assess the storm and sanitary flows anticipated to discharge from the subject site and to seek acceptance from the City of Edmonton for the proposed servicing strategy.
1.2 EXISTING CONDITIONS
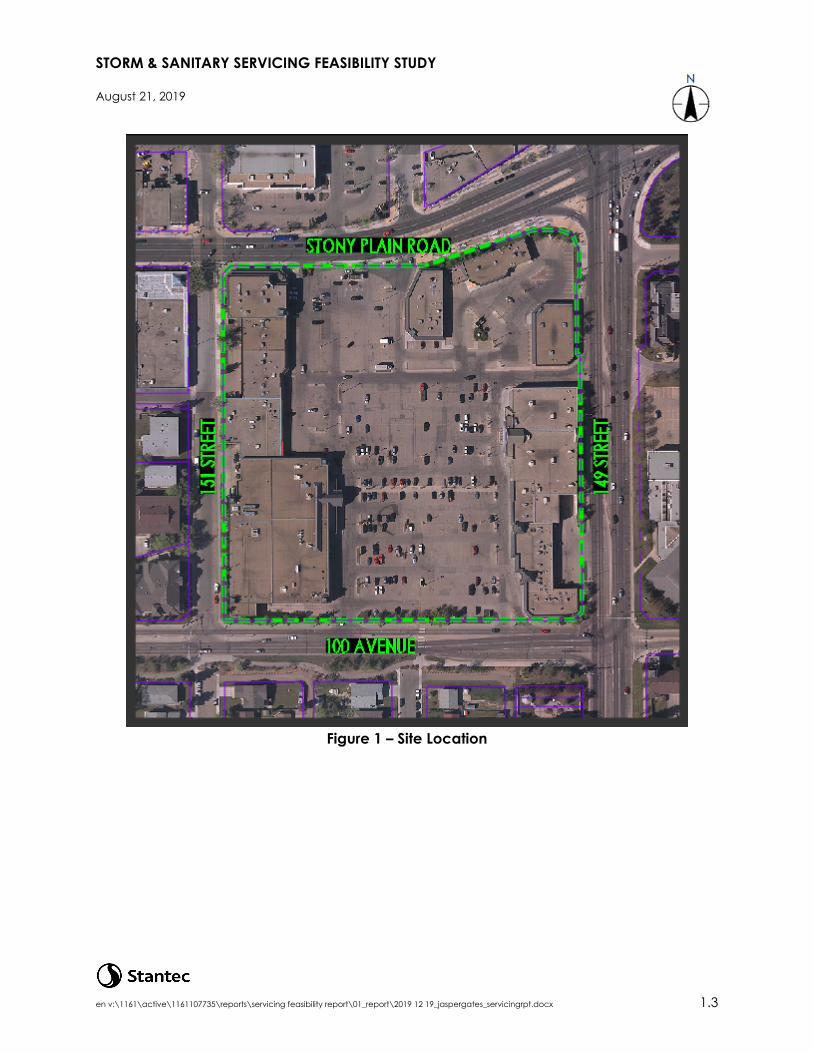
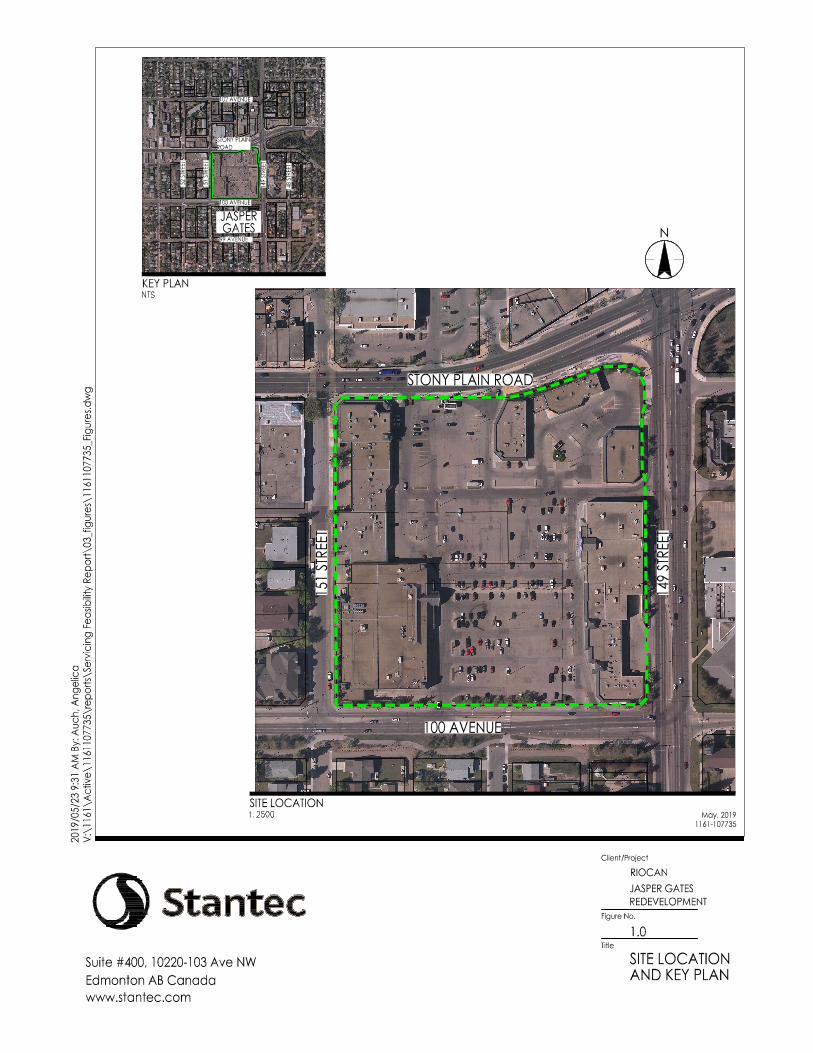
The subject site is currently comprised of several commercial areas and parking spaces which encompass a total area of approximately 4.291 ha. The subject site is primarily surrounded by residential areas to the south and west and other commercial and institutional areas to the north and east. See Figure 1 for an aerial image of the areas and site location plan.
1.3 BACKGROUND INFORMATION
The information presented in this report is based on the review of the following information:
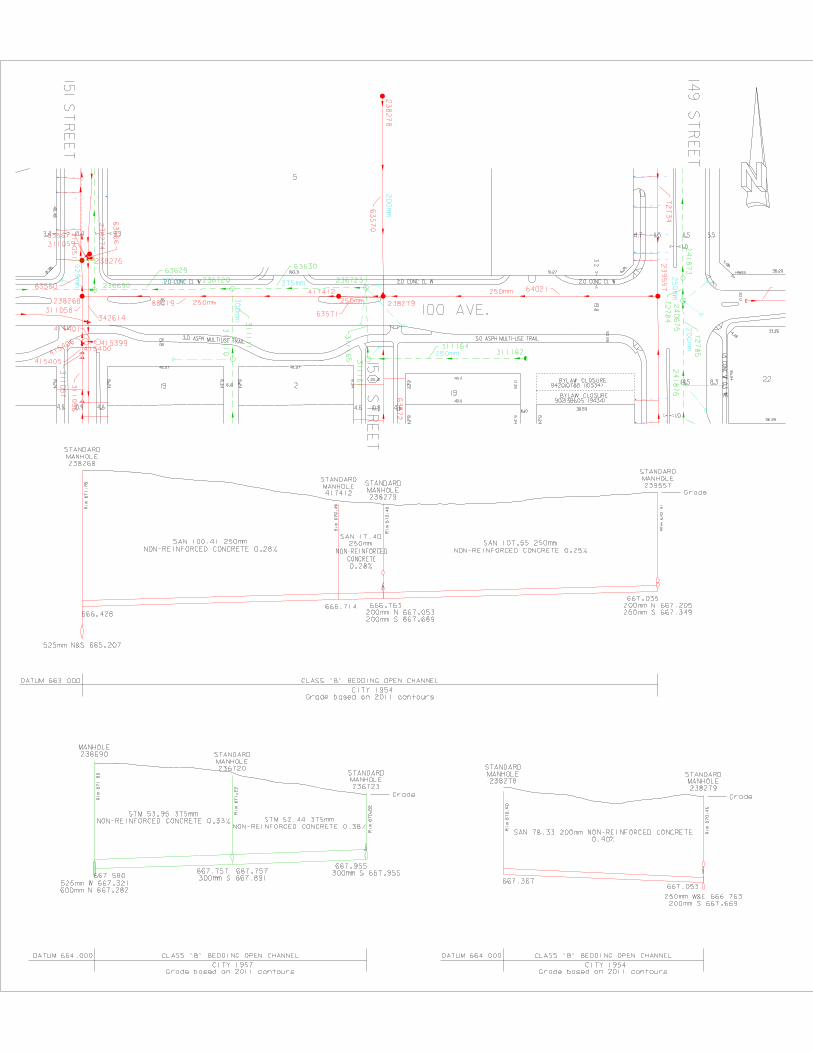
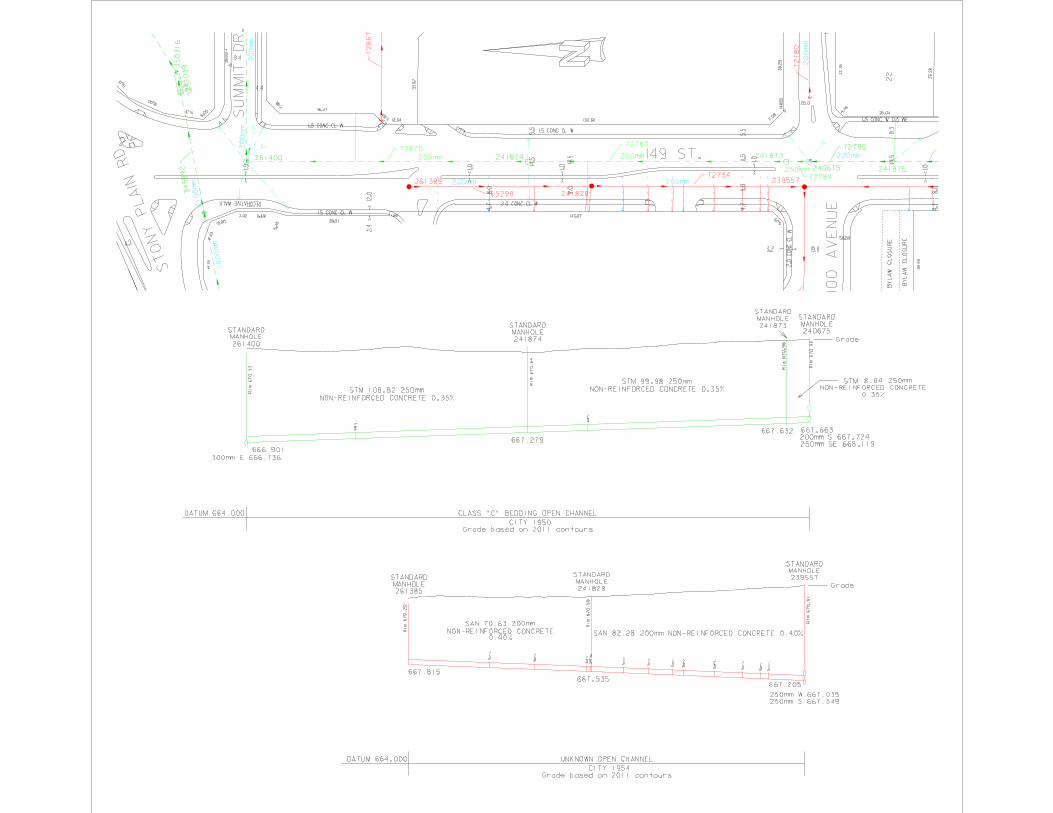
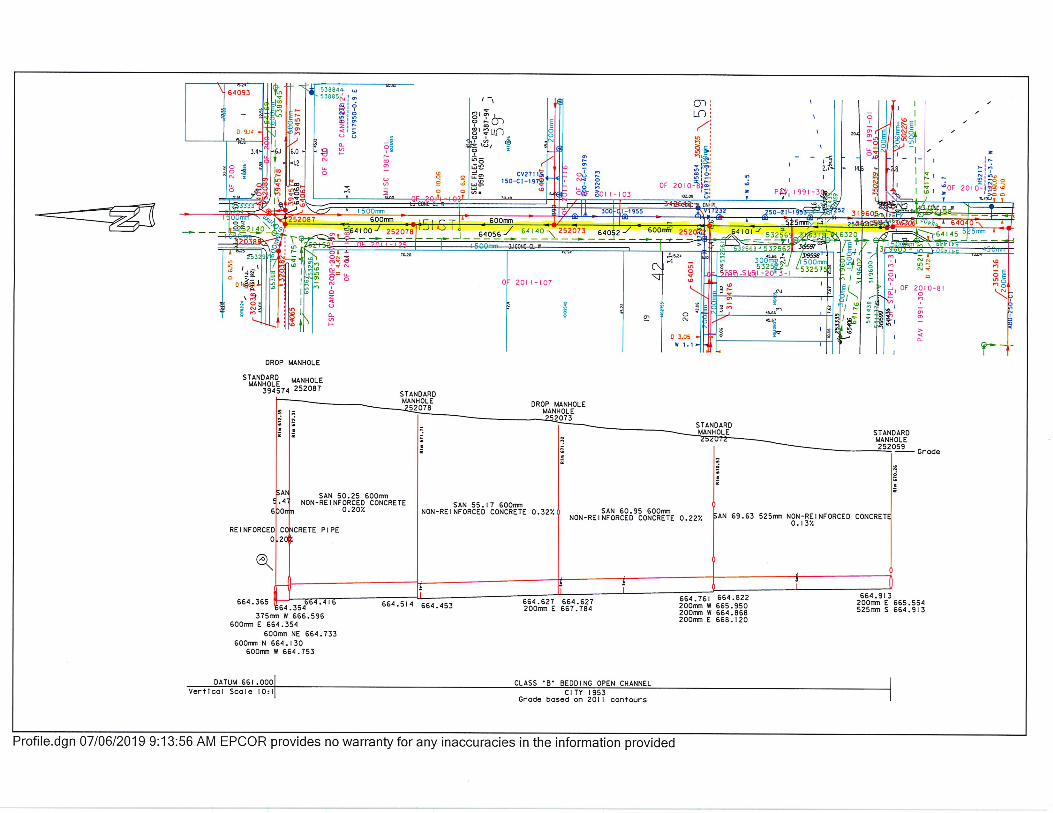
As-constructed drawings on file with the City of Edmonton for the external services on bordering roads (Stony Plain Road, 151 Street, 100 Avenue, 149 Street).
City of Edmonton Design Standards and Specifications
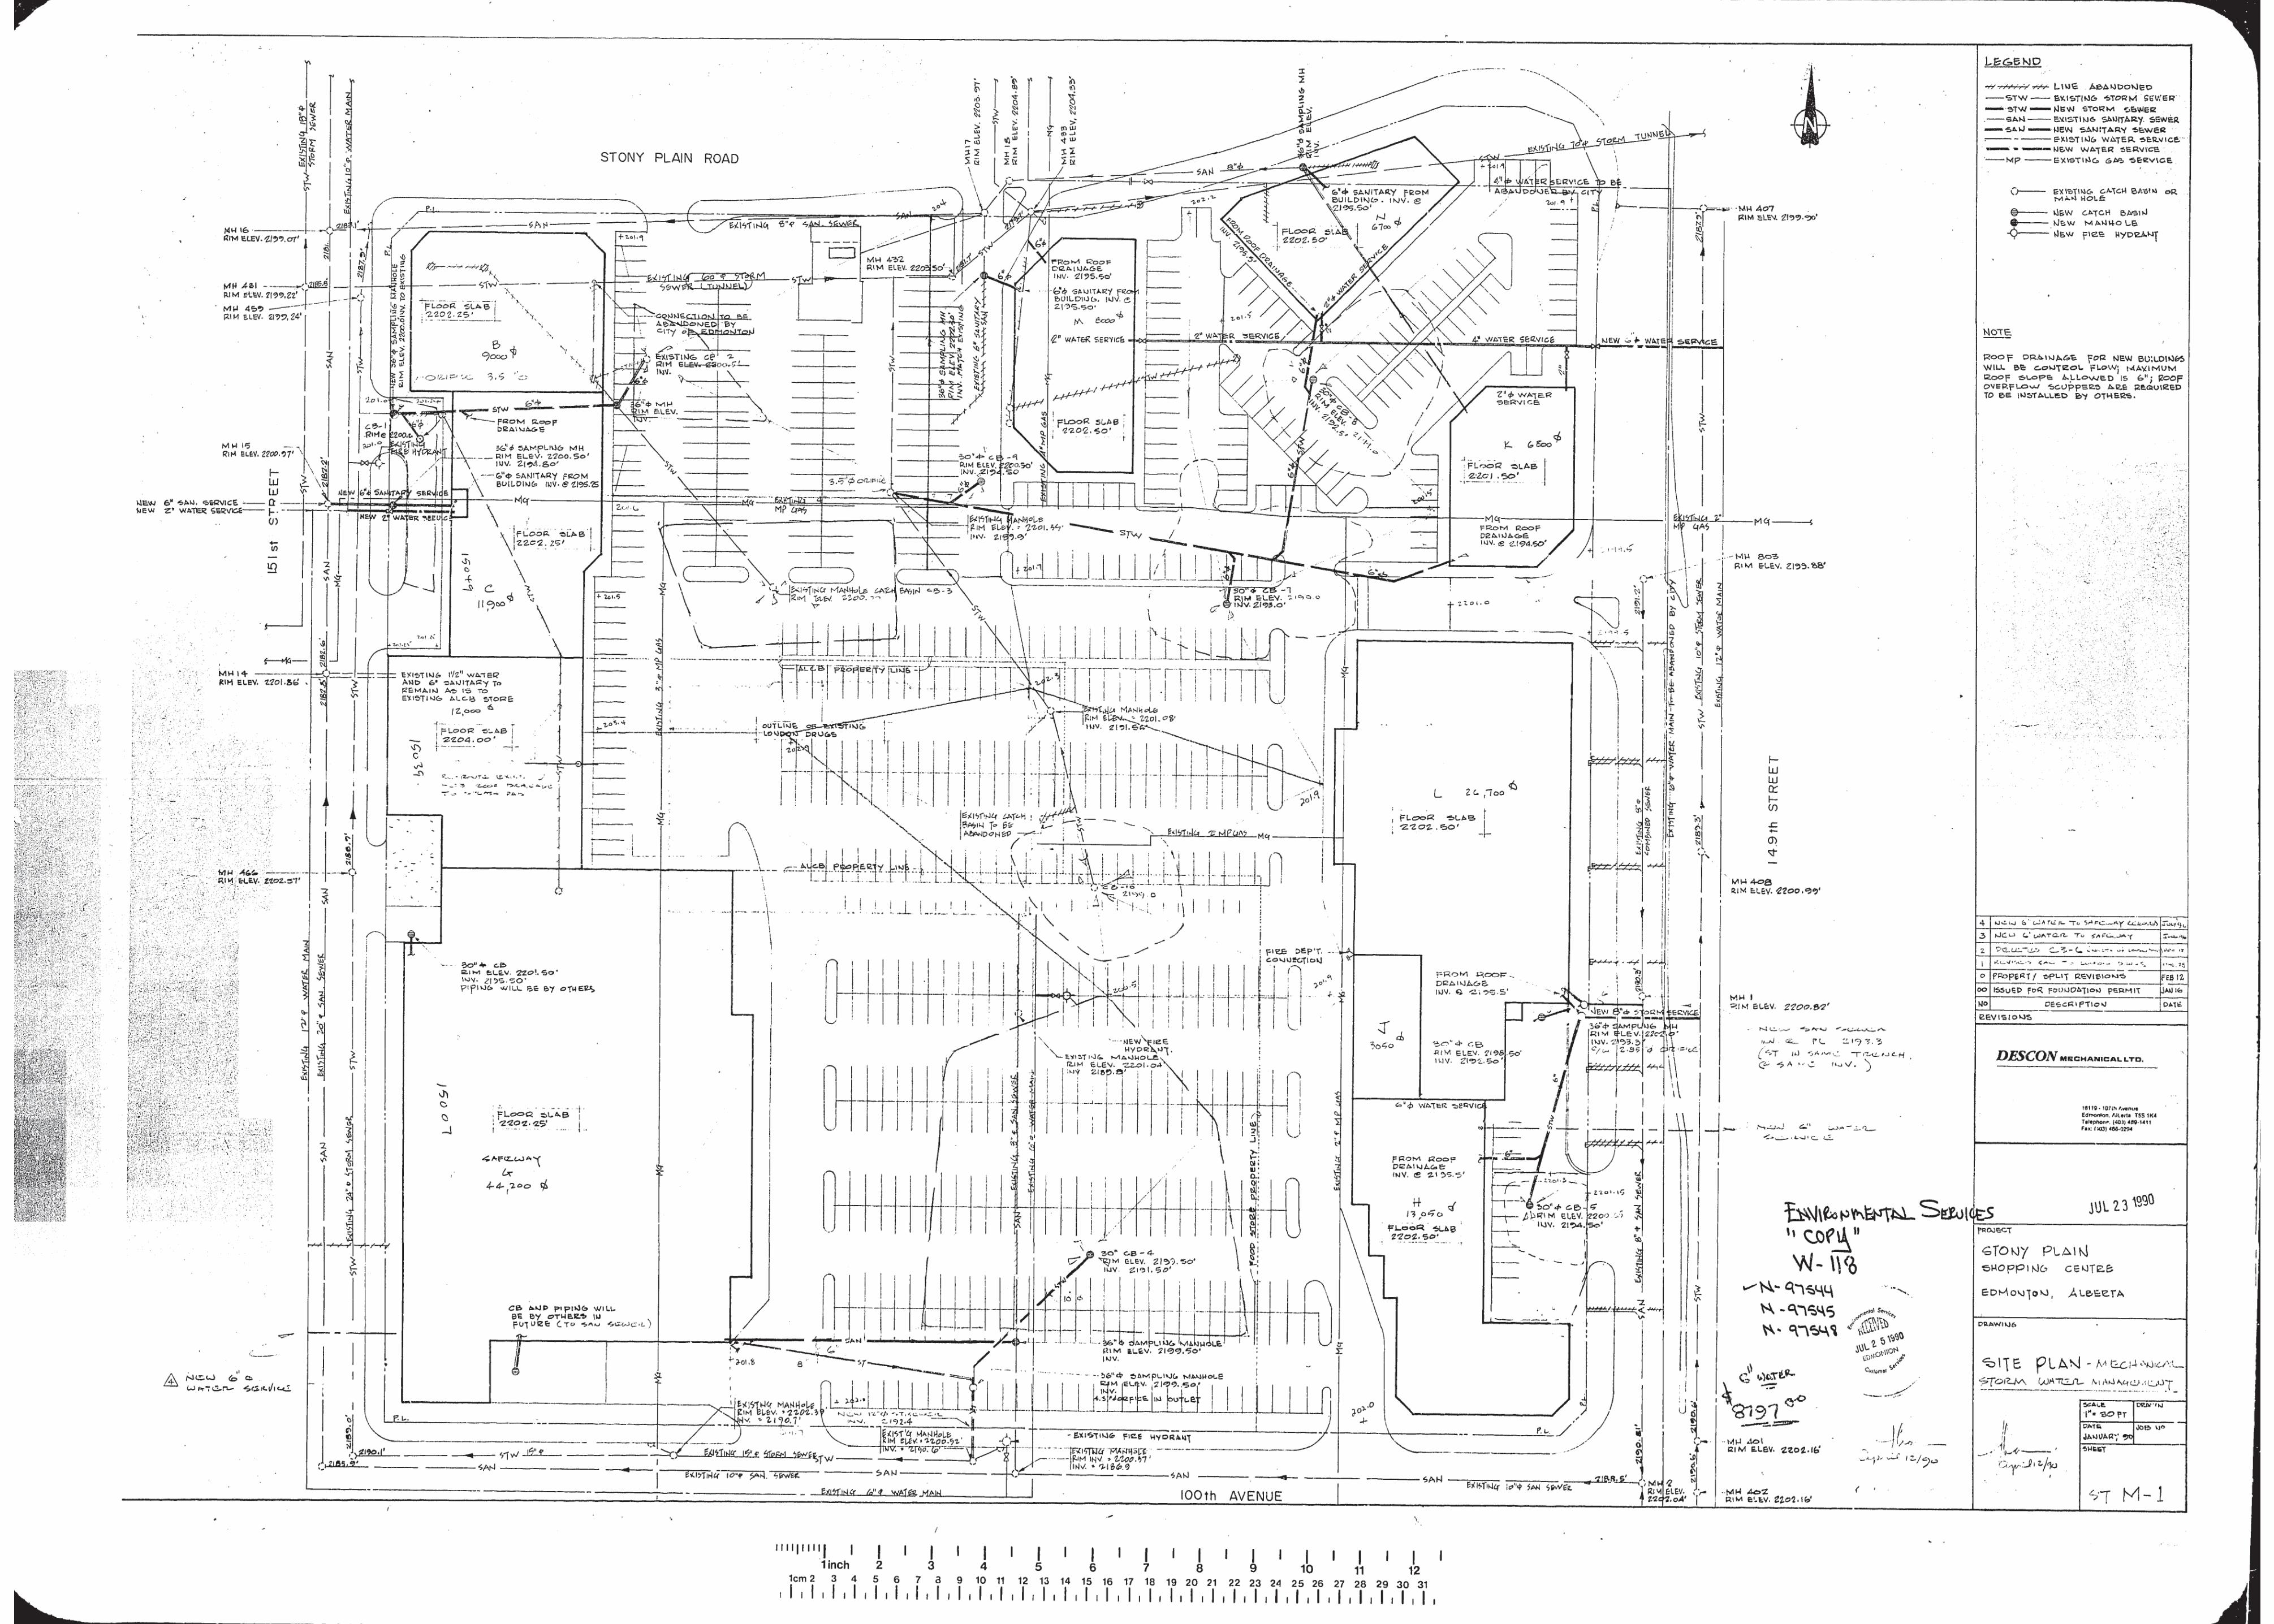
Stony Plain Shopping Centre Site Plan – Mechanical and Storm Water Management (Descon Mechanical Ltd., July 1990)
Survey of the exiting conditions of the subject site (Stantec, April 2019)
City of Edmonton Drainage Service Report – Terms of Reference (July 2018)
STORM & SANITARY SERVICING FEASIBILITY STUDY
August 21, 2019
en v:\1161\active\1161107735\reports\servicing feasibility report\01_report\2019 12 19_jaspergates_servicingrpt.docx 1.3
Figure 1 – Site Location
STORM & SANITARY SERVICING FEASIBILITY STUDY
August 21, 2019
en v:\1161\active\1161107735\reports\servicing feasibility report\01_report\2019 12 19_jaspergates_servicingrpt.docx 1.4
2.0 Storm Servicing
2.1 APPROACH TO DOWNSTREAM STORM CAPACITY REVIEW
Below is an analysis of the existing storm system for the subject site, followed by an analysis of restricted post development stormwater flow. This section outlines the anticipated changes in stormwater flow to the system, models the existing storm system and provides recommendations for site servicing based on an interpretation of the downstream capacity.
2.2 EXISTING STORM SERVICE AND PRE-DEVELOPMENT FLOW
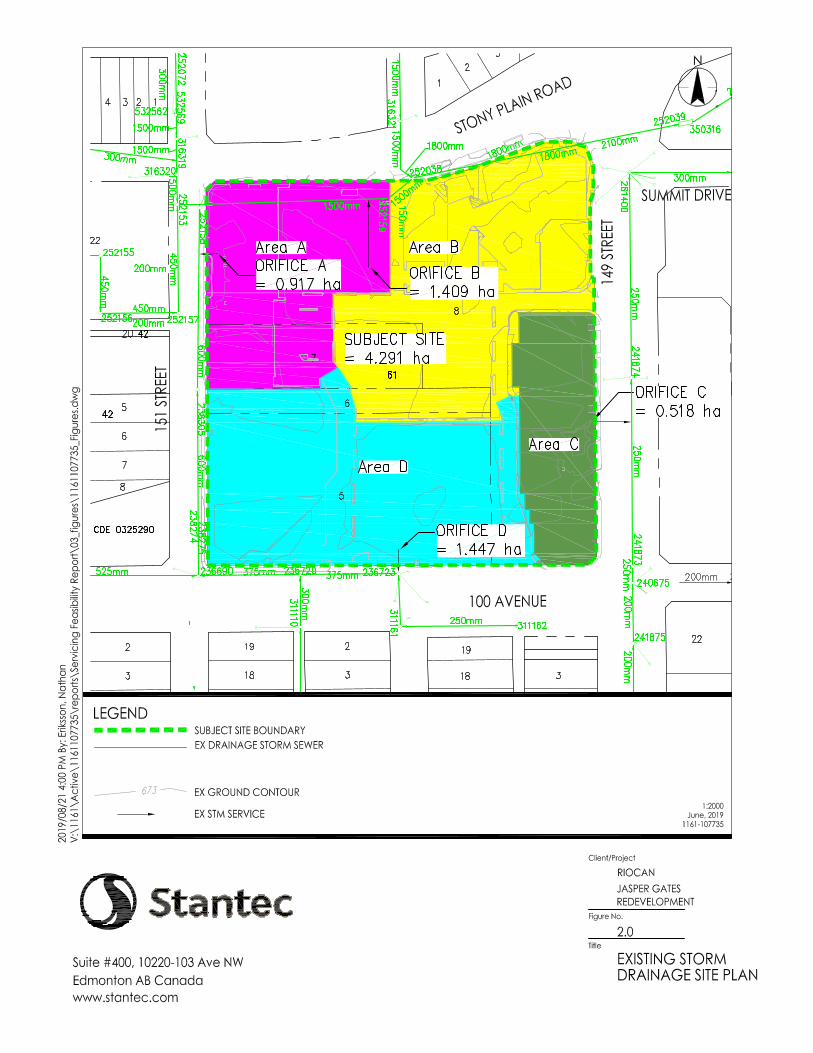
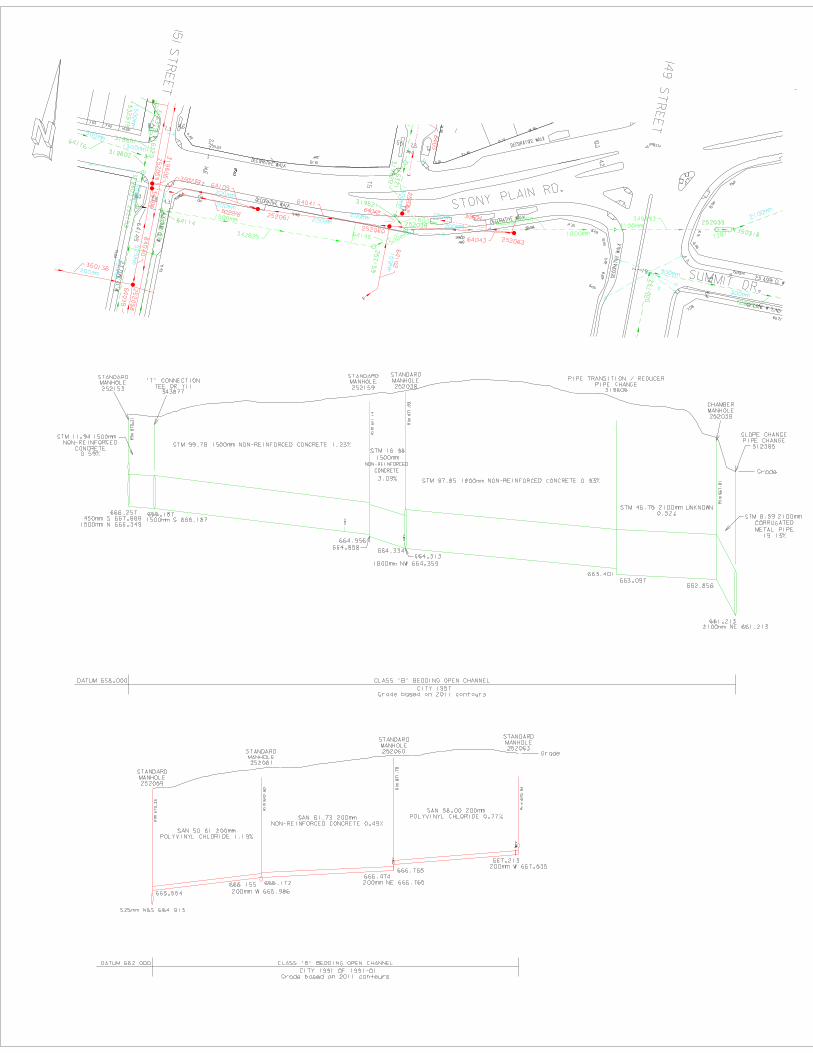
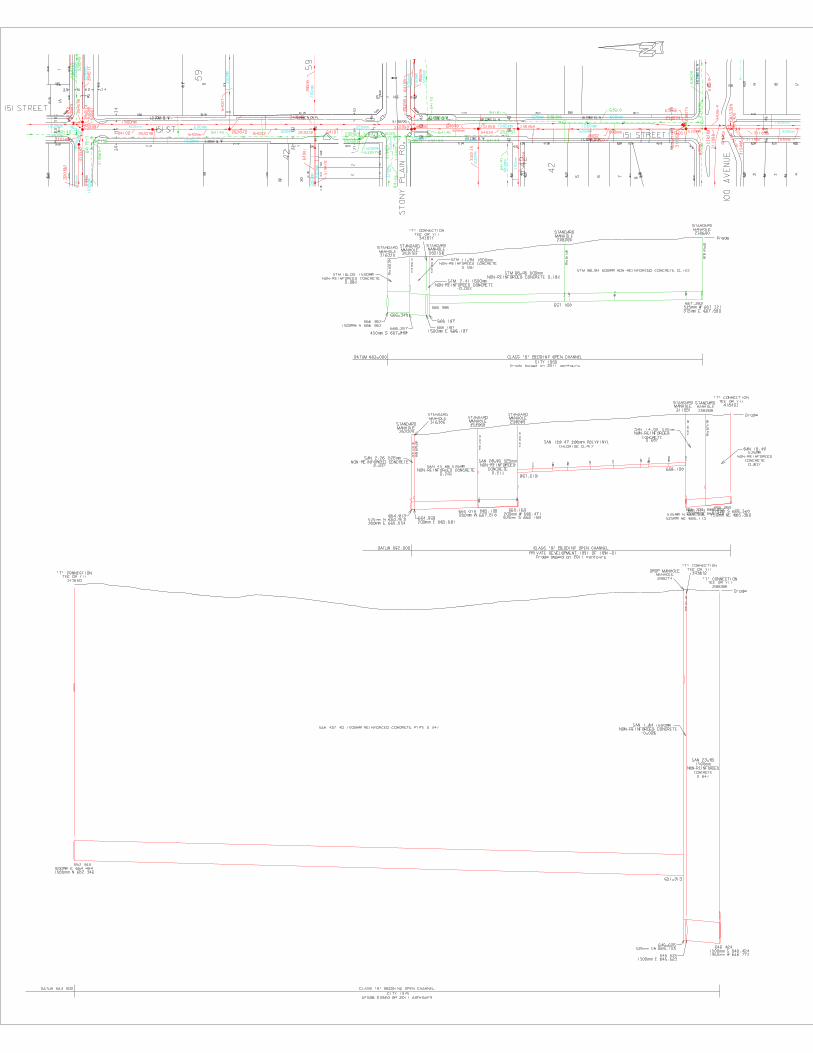
As per the background information mentioned above, the existing site is comprised of impervious surfaces. The overland drainage is split and is directed to different catch basins which then drains to manholes complete with orifices that restricts the flow at the outlet.
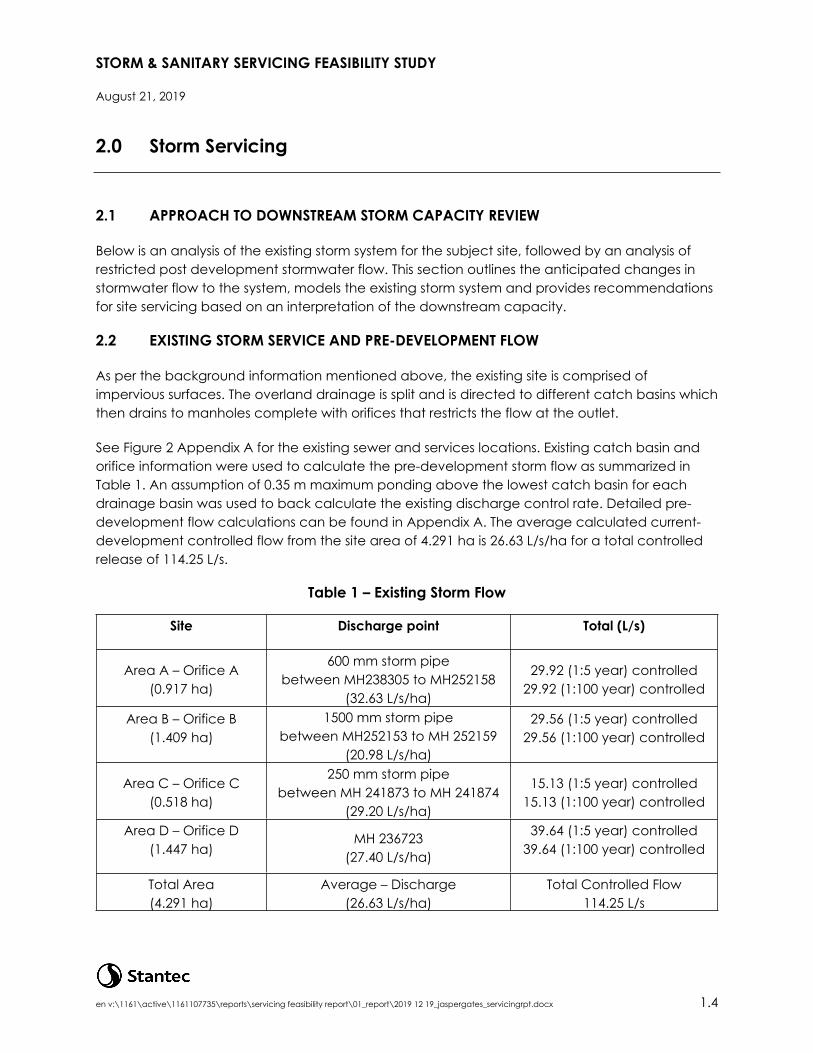
See Figure 2 Appendix A for the existing sewer and services locations. Existing catch basin and orifice information were used to calculate the pre-development storm flow as summarized in Table 1. An assumption of 0.35 m maximum ponding above the lowest catch basin for each drainage basin was used to back calculate the existing discharge control rate. Detailed pre-development flow calculations can be found in Appendix A. The average calculated current-development controlled flow from the site area of 4.291 ha is 26.63 L/s/ha for a total controlled release of 114.25 L/s.
Table 1 – Existing Storm Flow
Site Discharge point Total (L/s)
Area A – Orifice A(0.917 ha)
600 mm storm pipebetween MH238305 to MH252158
(32.63 L/s/ha)
29.92 (1:5 year) controlled29.92 (1:100 year) controlled
Area B – Orifice B(1.409 ha)
1500 mm storm pipebetween MH252153 to MH 252159
(20.98 L/s/ha)
29.56 (1:5 year) controlled29.56 (1:100 year) controlled
Area C – Orifice C(0.518 ha)
250 mm storm pipebetween MH 241873 to MH 241874
(29.20 L/s/ha)
15.13 (1:5 year) controlled15.13 (1:100 year) controlled
Area D – Orifice D(1.447 ha)
MH 236723(27.40 L/s/ha)
39.64 (1:5 year) controlled39.64 (1:100 year) controlled
Total Area(4.291 ha)
Average – Discharge(26.63 L/s/ha)
Total Controlled Flow114.25 L/s
STORM & SANITARY SERVICING FEASIBILITY STUDY
August 21, 2019
en v:\1161\active\1161107735\reports\servicing feasibility report\01_report\2019 12 19_jaspergates_servicingrpt.docx 1.5
2.3 POST-DEVELOPMENT FLOW
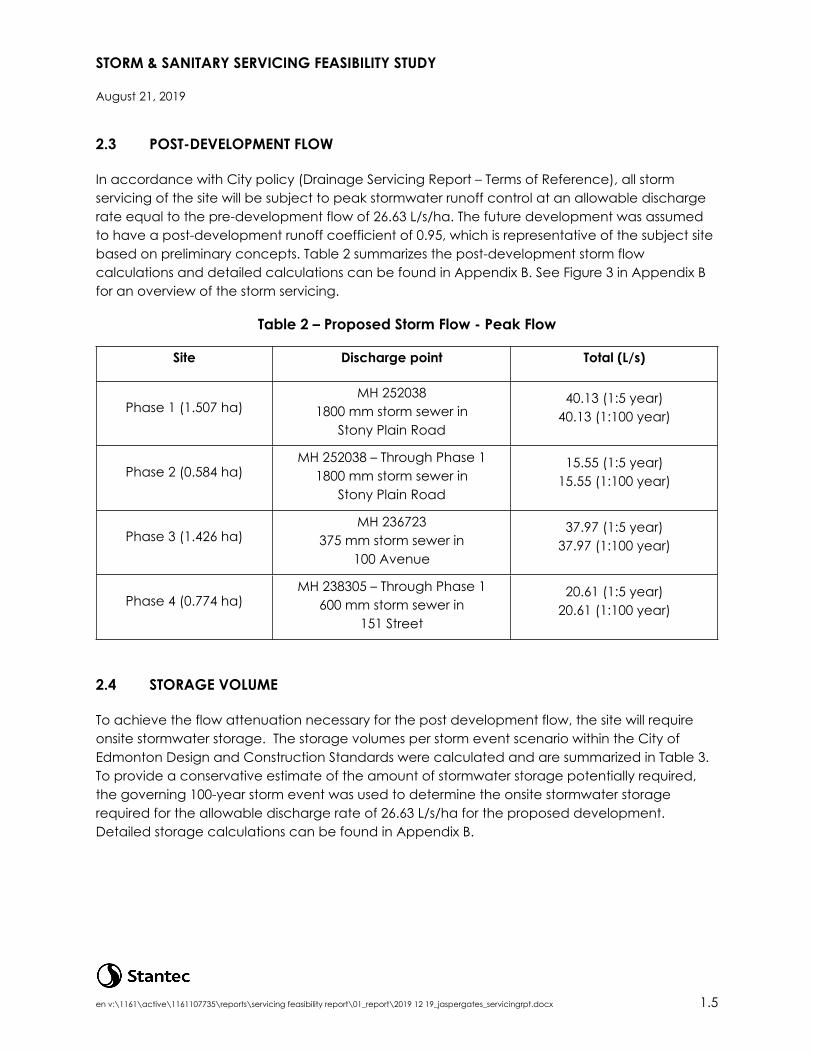
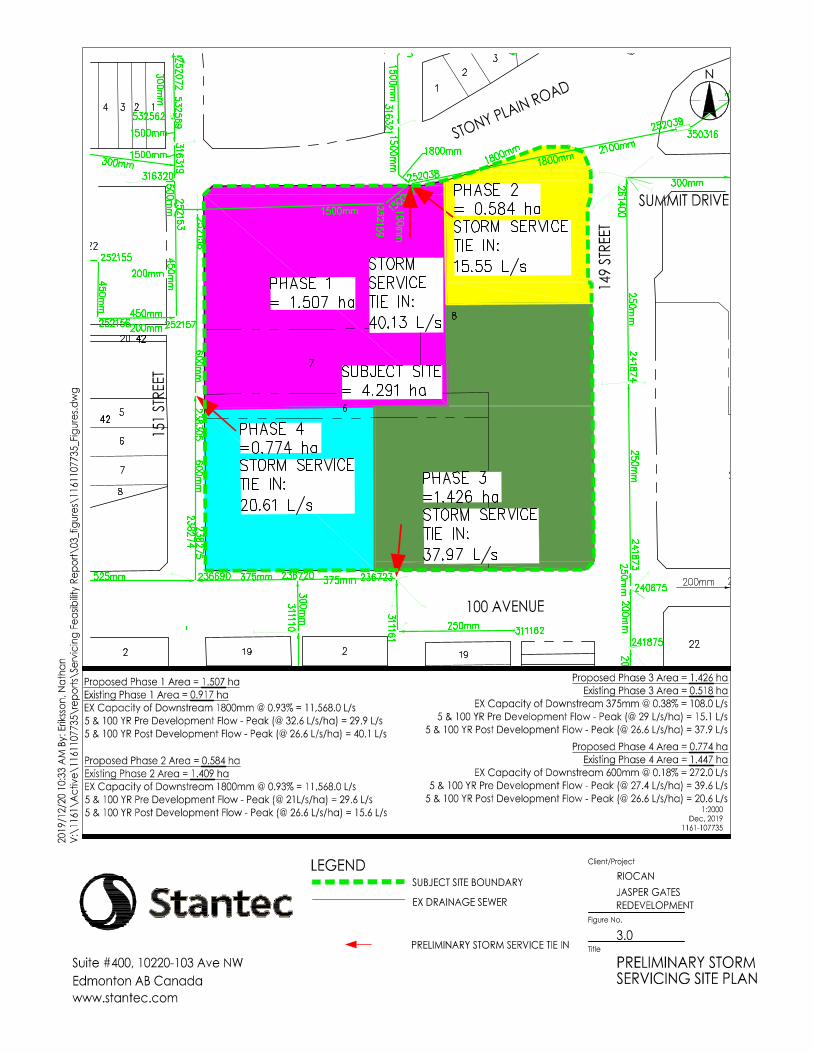
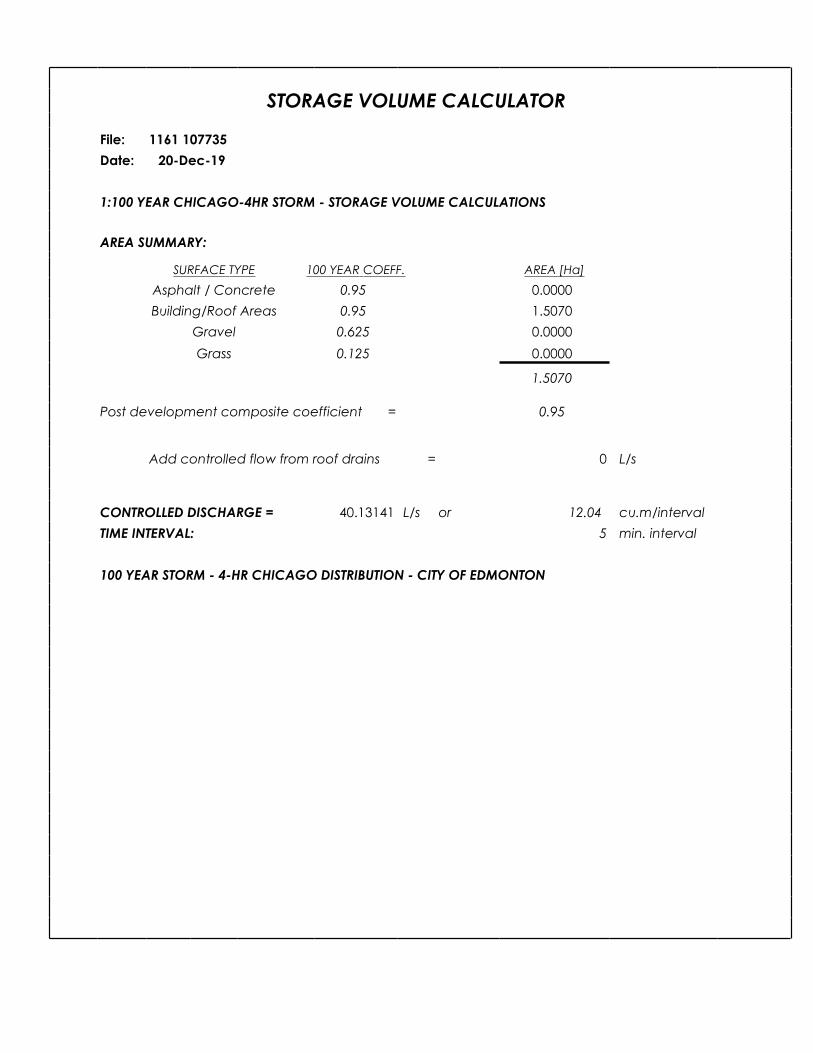
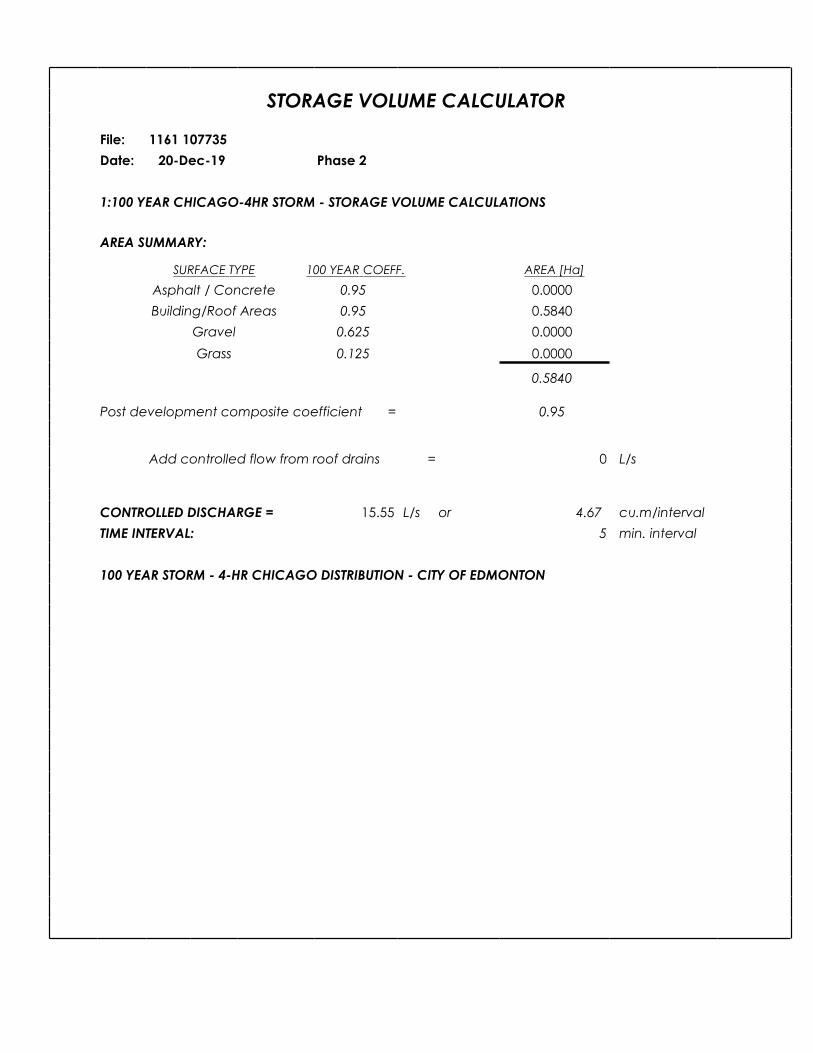
In accordance with City policy (Drainage Servicing Report – Terms of Reference), all storm servicing of the site will be subject to peak stormwater runoff control at an allowable discharge rate equal to the pre-development flow of 26.63 L/s/ha. The future development was assumed to have a post-development runoff coefficient of 0.95, which is representative of the subject site based on preliminary concepts. Table 2 summarizes the post-development storm flow calculations and detailed calculations can be found in Appendix B. See Figure 3 in Appendix B for an overview of the storm servicing.
Table 2 – Proposed Storm Flow - Peak Flow
Site Discharge point Total (L/s)
Phase 1 (1.507 ha)MH 252038
1800 mm storm sewer in Stony Plain Road
40.13 (1:5 year)40.13 (1:100 year)
Phase 2 (0.584 ha)MH 252038 – Through Phase 1
1800 mm storm sewer in Stony Plain Road
15.55 (1:5 year)15.55 (1:100 year)
Phase 3 (1.426 ha)MH 236723
375 mm storm sewer in 100 Avenue
37.97 (1:5 year)37.97 (1:100 year)
Phase 4 (0.774 ha)MH 238305 – Through Phase 1
600 mm storm sewer in 151 Street
20.61 (1:5 year)20.61 (1:100 year)
2.4 STORAGE VOLUME
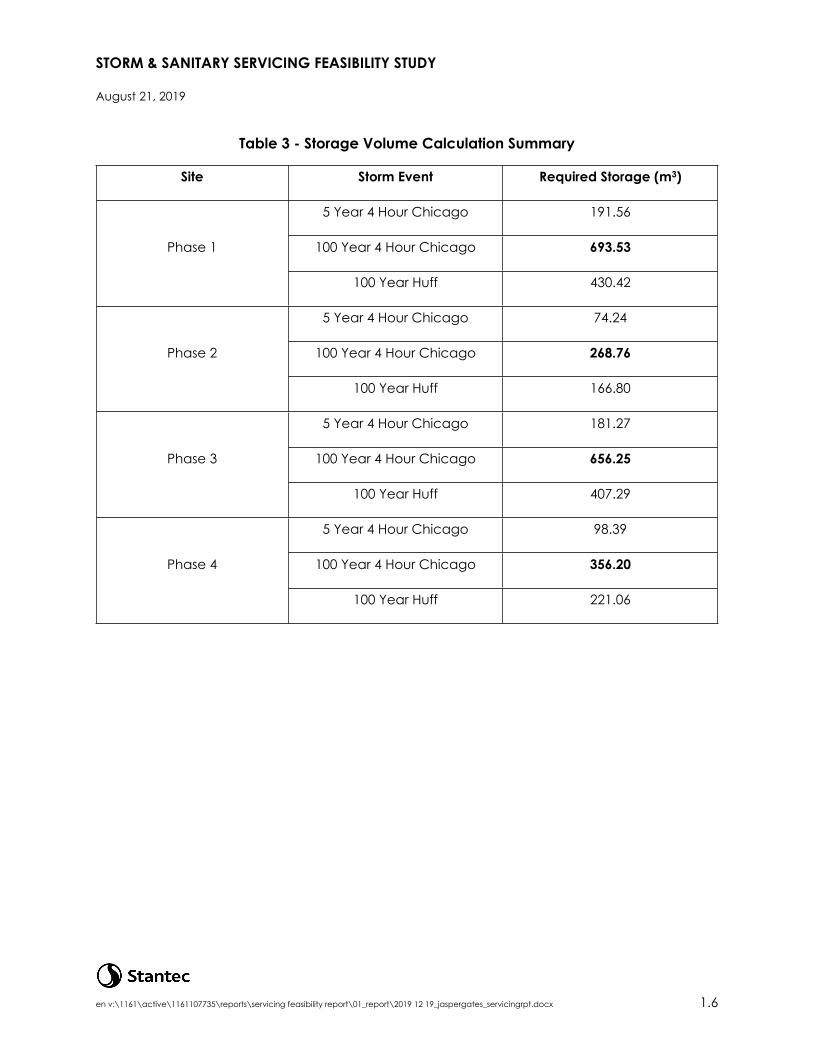
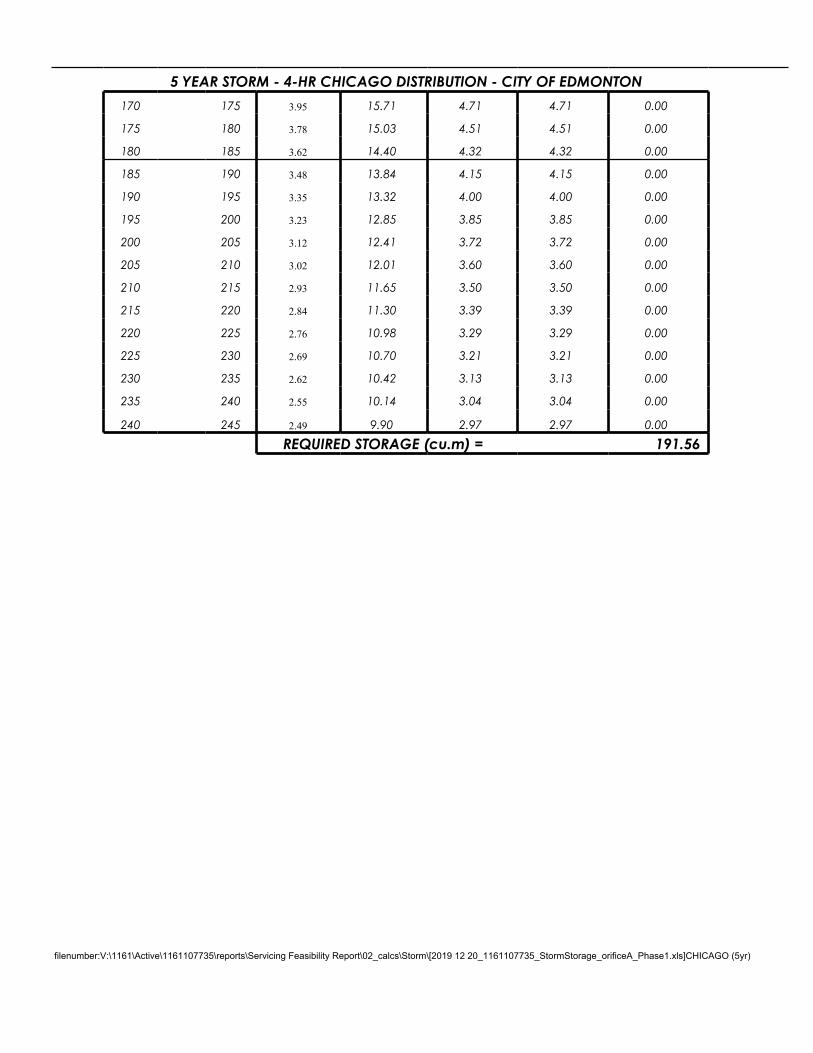
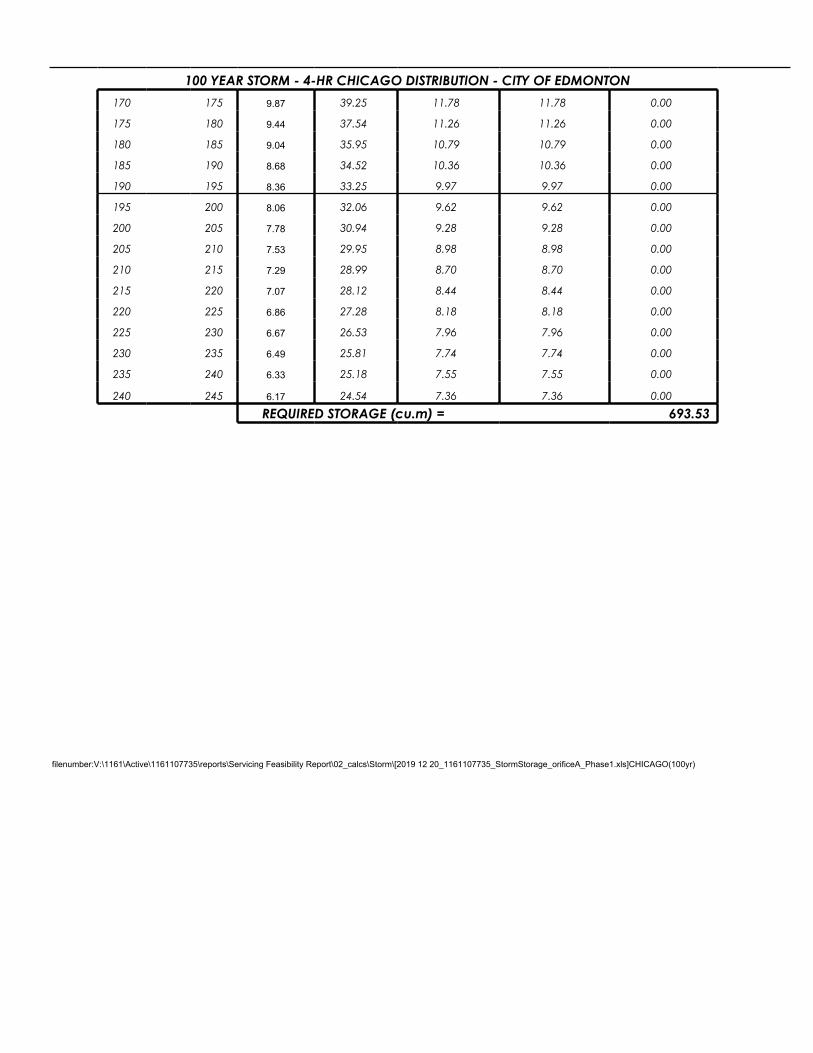
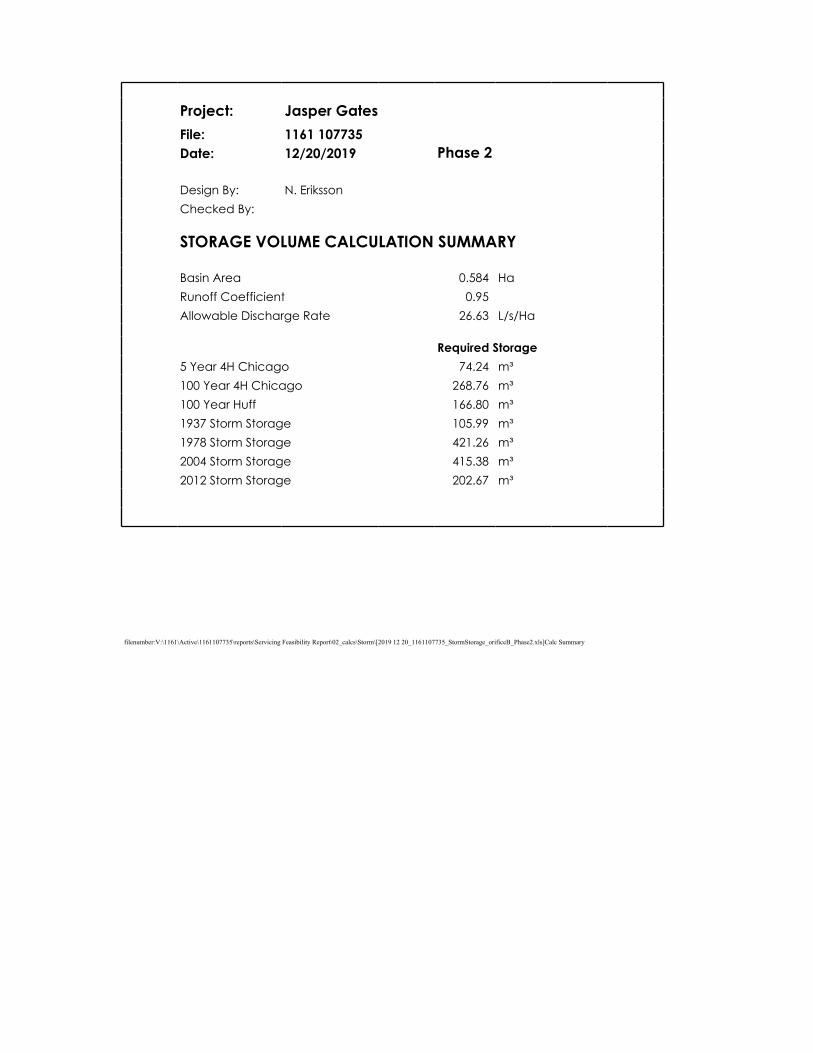
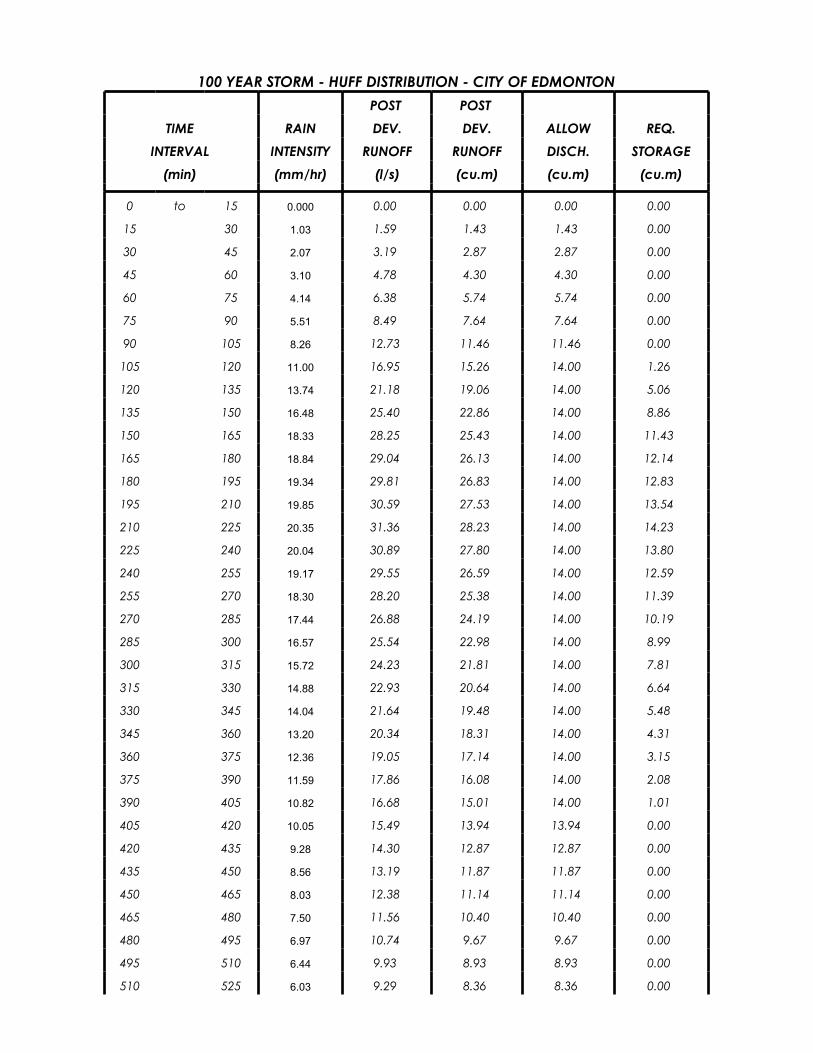
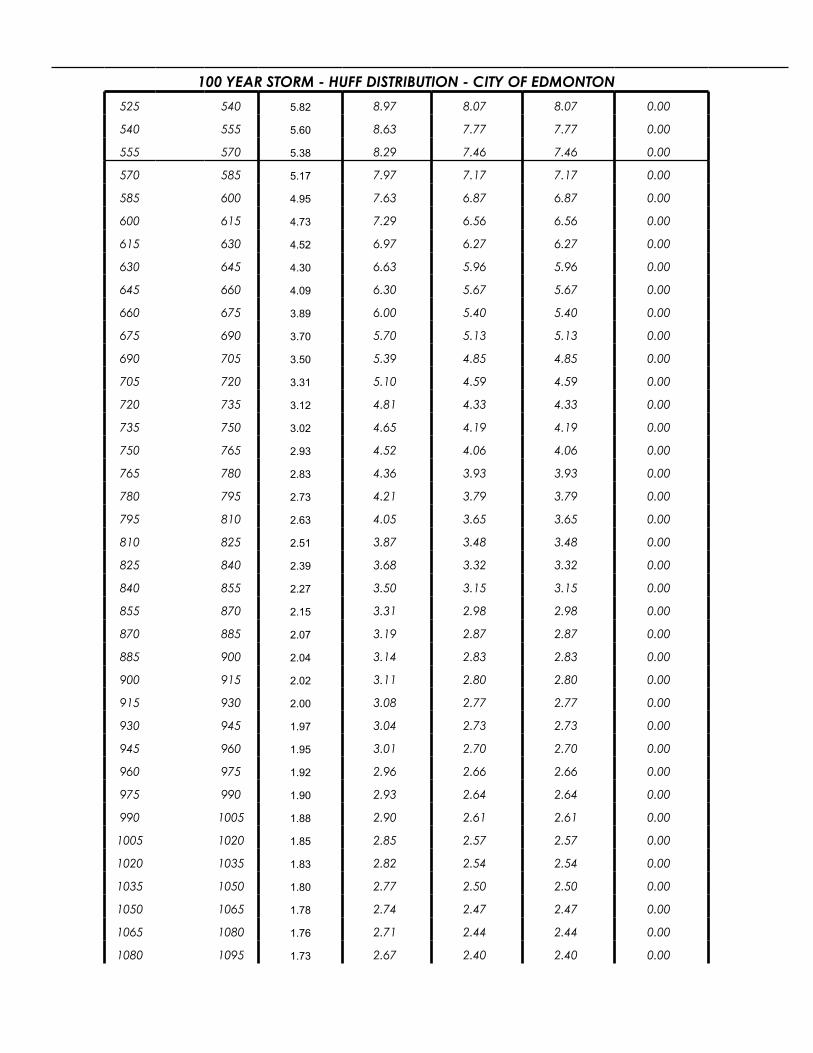
To achieve the flow attenuation necessary for the post development flow, the site will require onsite stormwater storage. The storage volumes per storm event scenario within the City of Edmonton Design and Construction Standards were calculated and are summarized in Table 3. To provide a conservative estimate of the amount of stormwater storage potentially required, the governing 100-year storm event was used to determine the onsite stormwater storage required for the allowable discharge rate of 26.63 L/s/ha for the proposed development. Detailed storage calculations can be found in Appendix B.
STORM & SANITARY SERVICING FEASIBILITY STUDY
August 21, 2019
en v:\1161\active\1161107735\reports\servicing feasibility report\01_report\2019 12 19_jaspergates_servicingrpt.docx 1.6
Table 3 - Storage Volume Calculation Summary
Site Storm Event Required Storage (m3)
5 Year 4 Hour Chicago 191.56
100 Year 4 Hour Chicago 693.53Phase 1
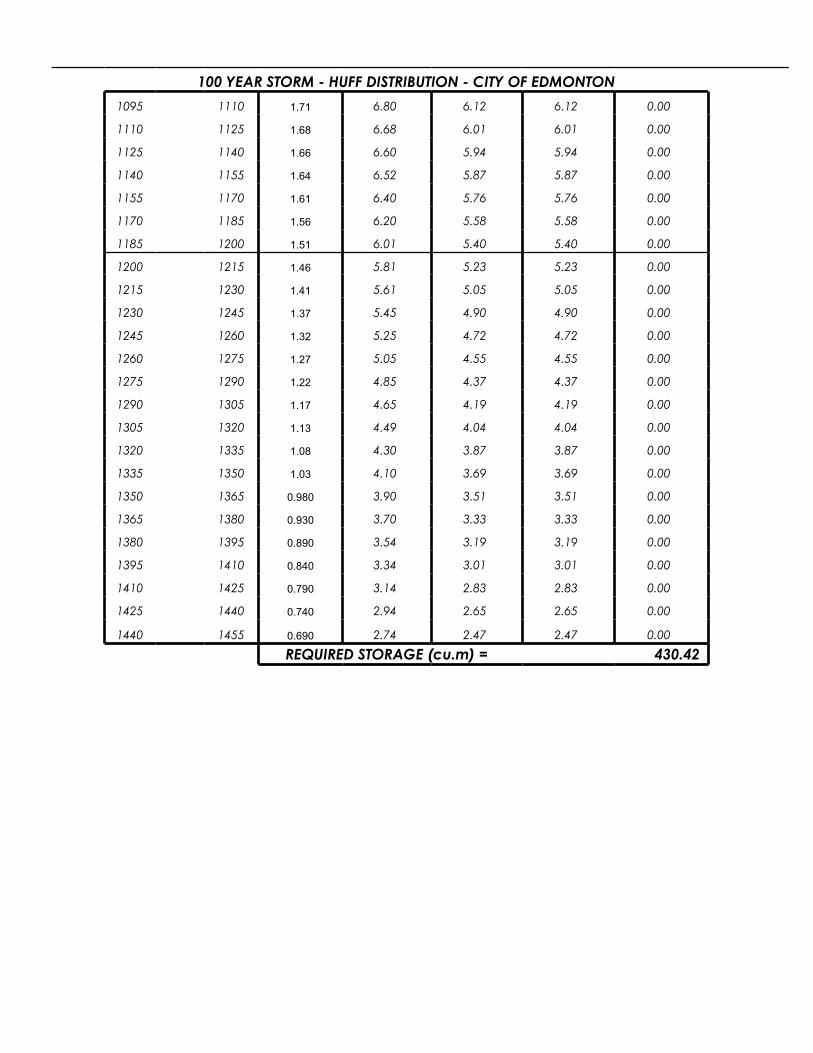
100 Year Huff 430.42
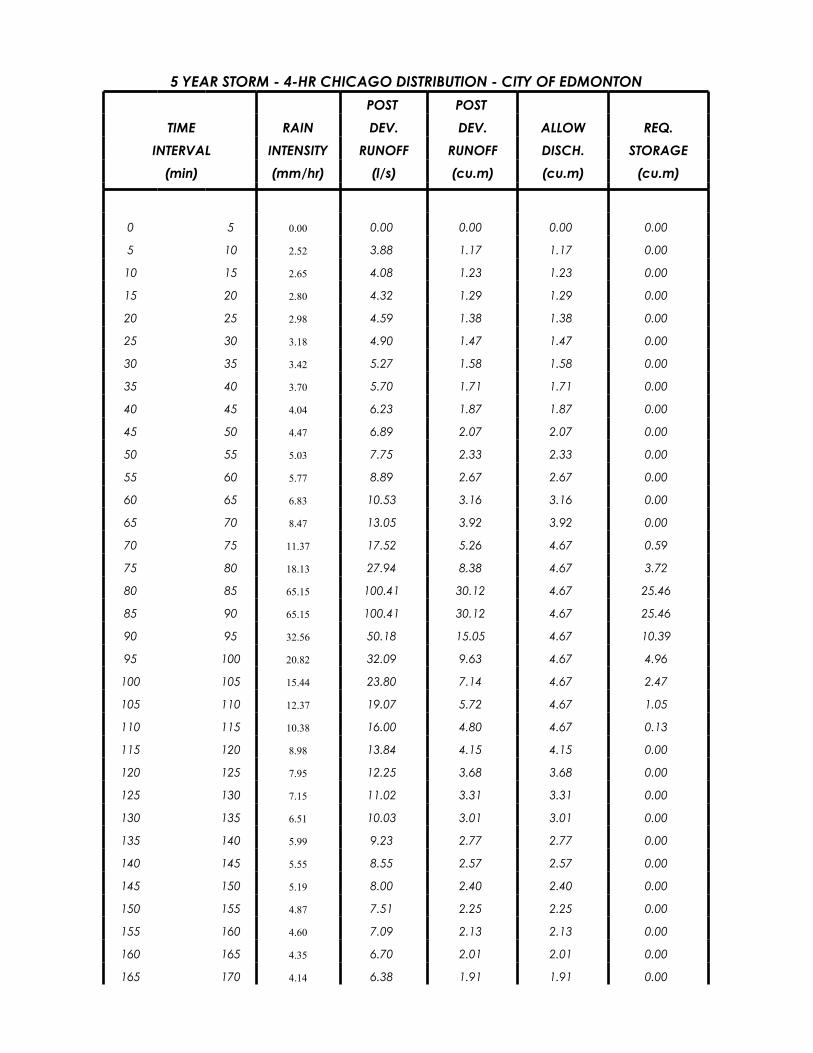
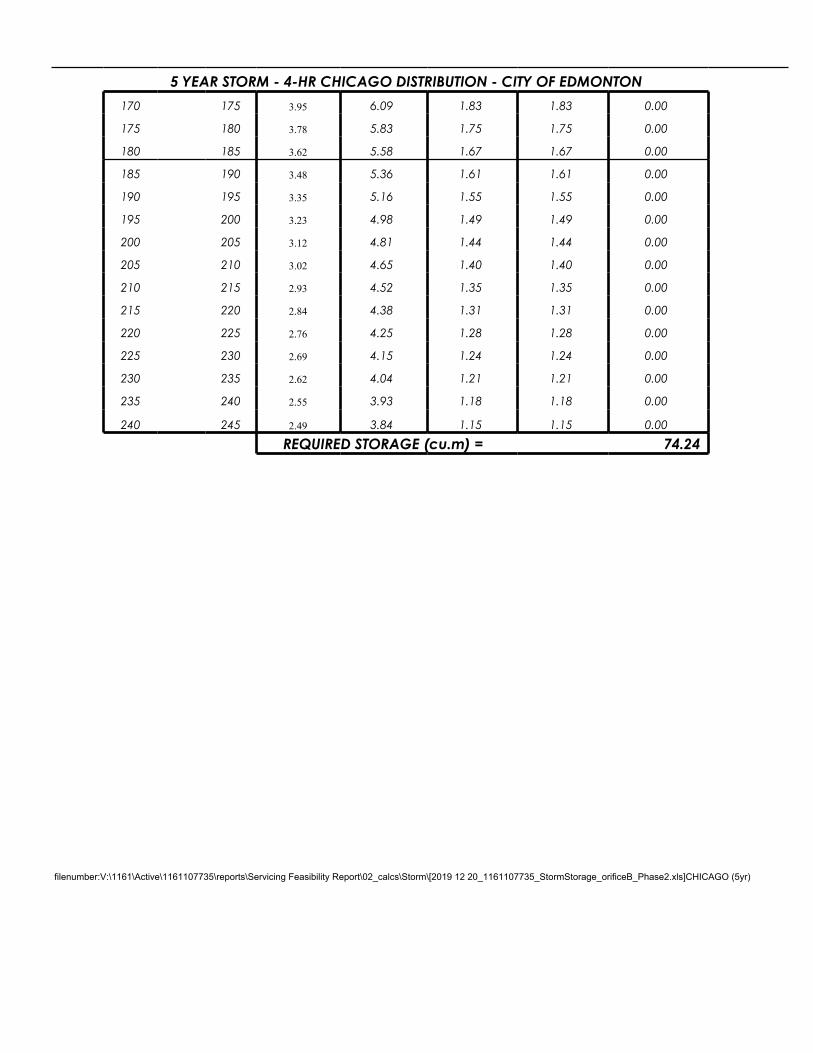
5 Year 4 Hour Chicago 74.24
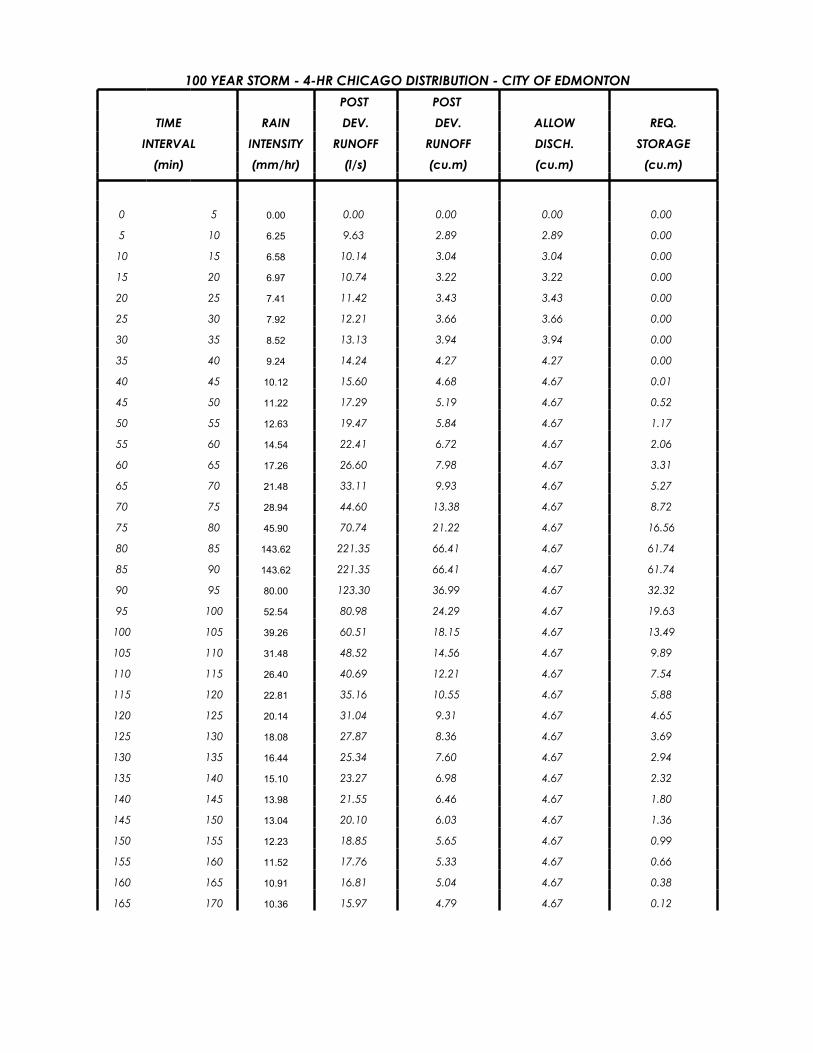
100 Year 4 Hour Chicago 268.76Phase 2
100 Year Huff 166.80
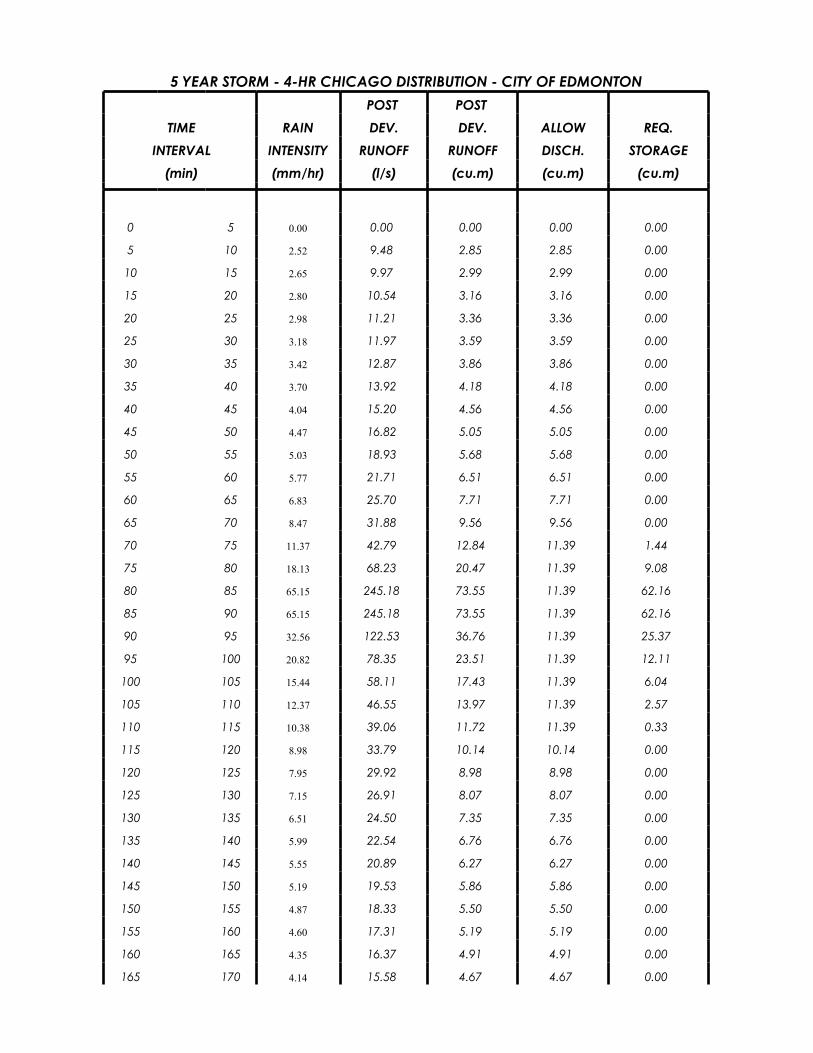
5 Year 4 Hour Chicago 181.27
100 Year 4 Hour Chicago 656.25Phase 3
100 Year Huff 407.29
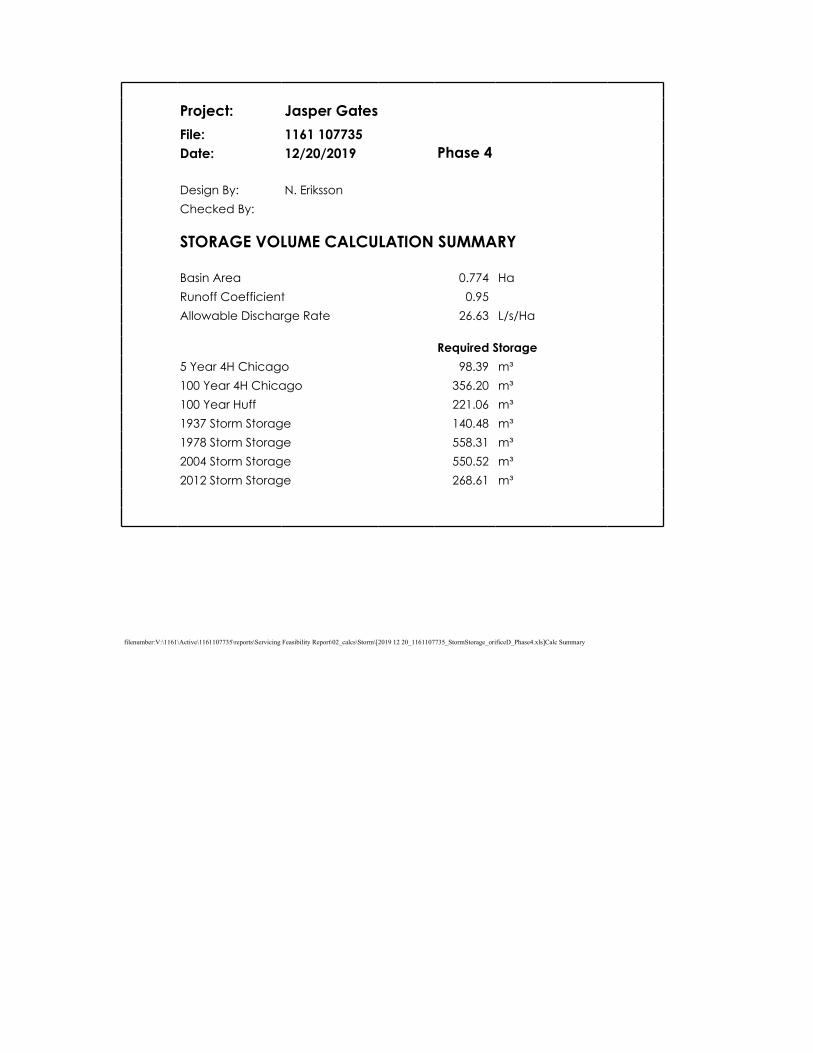
5 Year 4 Hour Chicago 98.39
100 Year 4 Hour Chicago 356.20Phase 4
100 Year Huff 221.06
STORM & SANITARY SERVICING FEASIBILITY STUDY
August 21, 2019
en v:\1161\active\1161107735\reports\servicing feasibility report\01_report\2019 12 19_jaspergates_servicingrpt.docx 1.7
2.5 PROPOSED STORM SERVICING LOCATION AND STORMWATER FLOW CHANGES
The controlled peak outflows from Phase 1, 2, 3, and 4 shown in Table 2 will ultimately discharge into the existing storm sewers located adjacent to the four Phases. See Figure 3 in Appendix B for an overview of the storm servicing.
The onsite storage can be provided by way of several options or combination of options such as rooftop storage or onsite underground storage tanks. As well, a flow control mechanism, for example an orifice plate, may be required for tie-in to the city system. Another option is to implement LID (Low Impact Development) in the redevelopment which can reduce the volume of stormwater runoff. This will be addressed further at the detailed design stage and based on the actual site development and servicing location plans.
2.6 IMPACT TO EXISTING DRAINAGE NETWORK
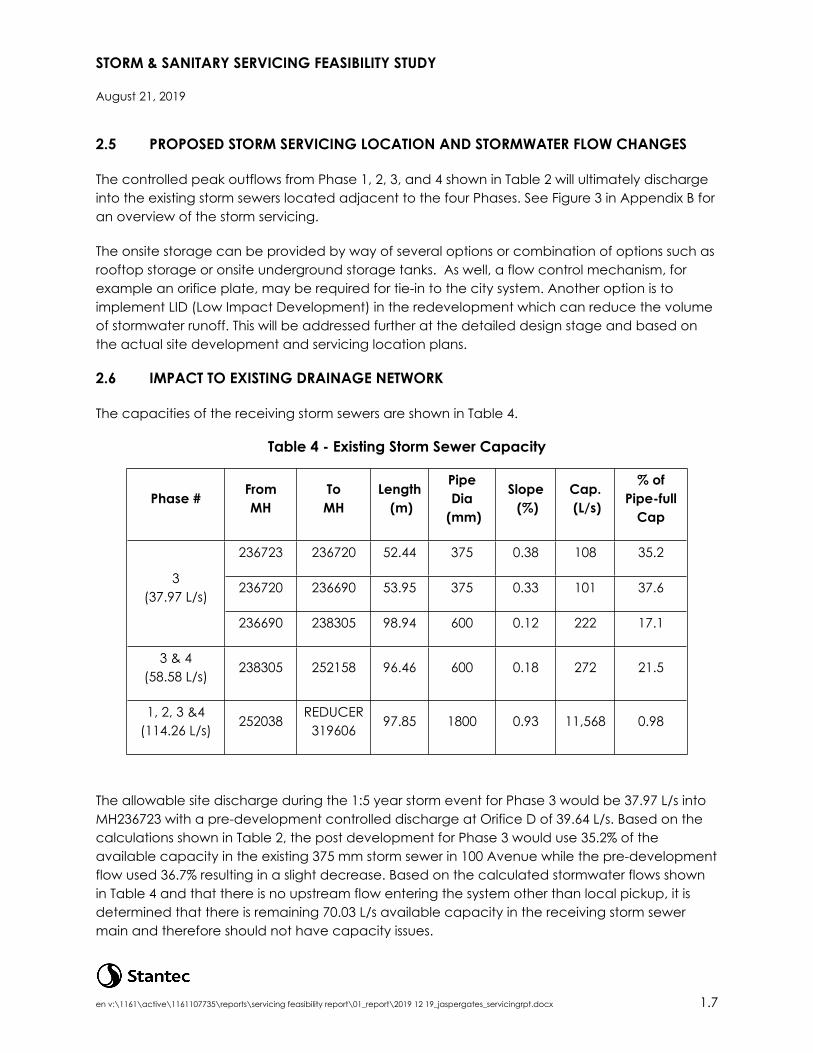
The capacities of the receiving storm sewers are shown in Table 4.
Table 4 - Existing Storm Sewer Capacity
Phase # From MH
ToMH
Length (m)
Pipe Dia
(mm)
Slope (%)
Cap. (L/s)
% of Pipe-full
Cap
236723 236720 52.44 375 0.38 108 35.2
236720 236690 53.95 375 0.33 101 37.63
(37.97 L/s)
236690 238305 98.94 600 0.12 222 17.1
3 & 4(58.58 L/s)
238305 252158 96.46 600 0.18 272 21.5
1, 2, 3 &4(114.26 L/s)
252038REDUCER
31960697.85 1800 0.93 11,568 0.98
The allowable site discharge during the 1:5 year storm event for Phase 3 would be 37.97 L/s into MH236723 with a pre-development controlled discharge at Orifice D of 39.64 L/s. Based on the calculations shown in Table 2, the post development for Phase 3 would use 35.2% of the available capacity in the existing 375 mm storm sewer in 100 Avenue while the pre-development flow used 36.7% resulting in a slight decrease. Based on the calculated stormwater flows shown in Table 4 and that there is no upstream flow entering the system other than local pickup, it is determined that there is remaining 70.03 L/s available capacity in the receiving storm sewer main and therefore should not have capacity issues.
STORM & SANITARY SERVICING FEASIBILITY STUDY
August 21, 2019
en v:\1161\active\1161107735\reports\servicing feasibility report\01_report\2019 12 19_jaspergates_servicingrpt.docx 1.8
The allowable site discharge during the 1:5 year storm event for Phase 4 would be 20.61 L/s into MH233805 with a pre-development controlled discharge at Orifice A into 600mm pipe downstream of MH233805 of 29.92 L/s. Combined with Phase 3 flows, the discharge would be 58.58 L/s compared to a pre-development flow of 69.56 L/s. Based on the calculations shown in Table 2, the post development flow for Phase 3 & 4 would use 21.5% of the available capacity in the existing 600 mm storm sewer in 151 Street compared to a pre-development flow utilization of 25.6% before draining into the existing 1500 mm storm sewer.
The allowable site discharge during the 1:5-year storm event for Phase 1 & 2 would be 58.58 L/s into MH 252038 with a pre-development controlled discharge to Orifice B of 29.56 L/s. Combined with Phase 3 & 4 flows the discharge would be 114.26L/s compared to a pre-development flow of 99.12L/s. This increase is due to the larger area of the site being directed to this area which was initially discharged to a different basin (Orifice C – 15.13L/s). Based on the calculations shown in Table 2, the post development for Phase 1-4 would use 0.98% of the available capacity in the existing 1800 mm. This compares to the pre-development that used 0.86%. Based on the City’s policy (Drainage Servicing Report – Terms of Reference), there should be no further analysis required for proposed peak storm flow contributions less than 10%.
Discharge to 149 Street has been removed due to capacity issues for the 250 mm storm service that we were tying into. This would remove 15.13 L/s of storm flow from the system.
STORM & SANITARY SERVICING FEASIBILITY STUDY
August 21, 2019
en v:\1161\active\1161107735\reports\servicing feasibility report\01_report\2019 12 19_jaspergates_servicingrpt.docx 1.9
3.0 Sanitary Servicing
3.1 APPROACH TO DOWNSTREAM SANITARY CAPACITY REVIEW
Below is an analysis of the existing sanitary system for the subject site, followed by an analysis of the proposed sanitary contributions with the redevelopment. This section outlines the anticipated changes in sanitary flow to the system and provides recommendations for site servicing based on an interpretation of the downstream capacity.
3.2 EXISTING SANITARY SERVICES
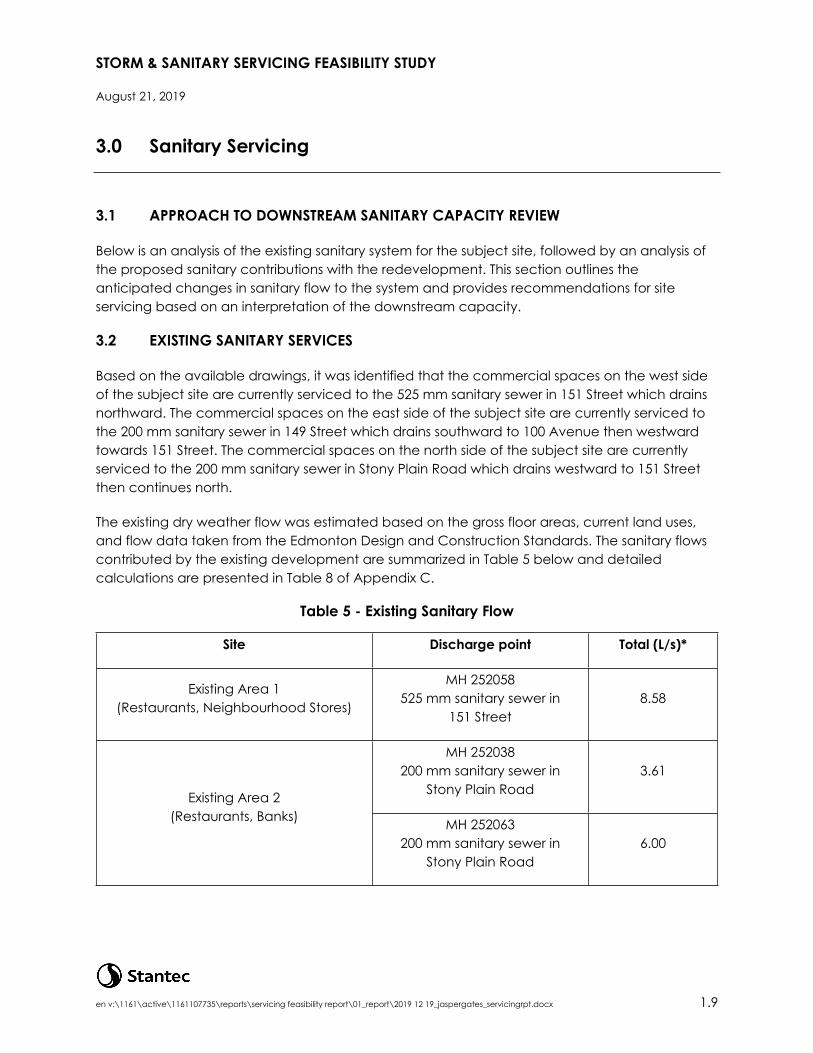
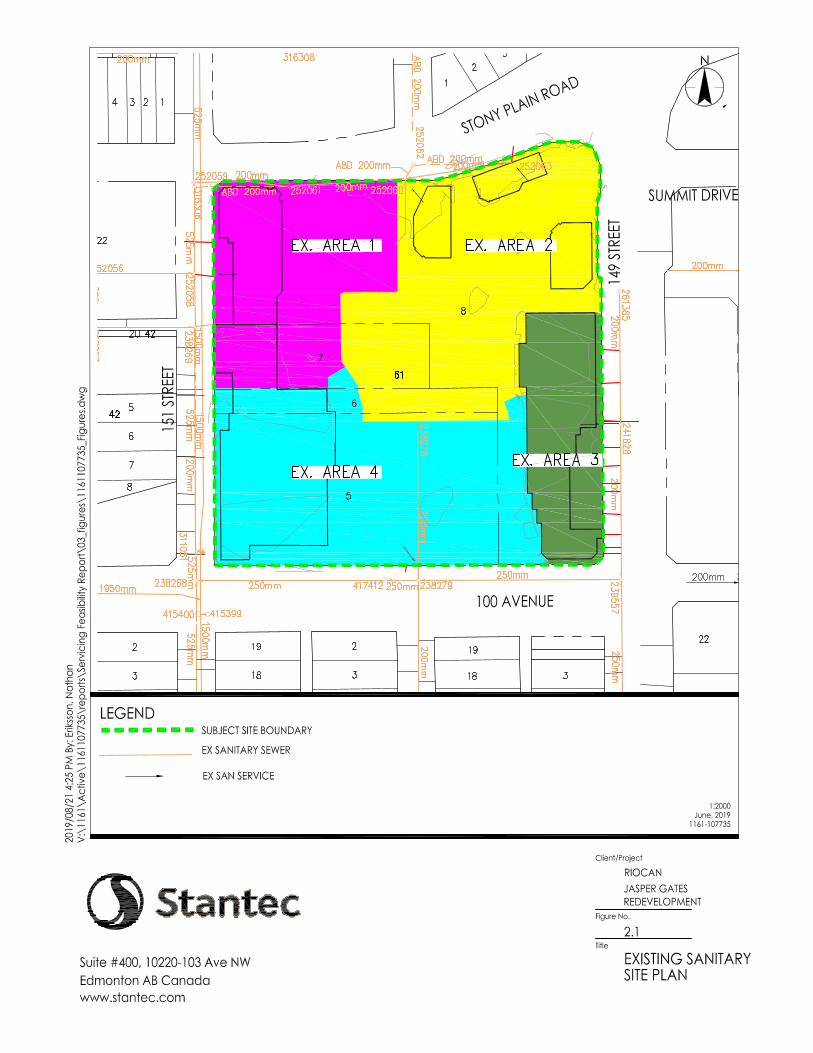
Based on the available drawings, it was identified that the commercial spaces on the west side of the subject site are currently serviced to the 525 mm sanitary sewer in 151 Street which drains northward. The commercial spaces on the east side of the subject site are currently serviced to the 200 mm sanitary sewer in 149 Street which drains southward to 100 Avenue then westward towards 151 Street. The commercial spaces on the north side of the subject site are currently serviced to the 200 mm sanitary sewer in Stony Plain Road which drains westward to 151 Street then continues north.
The existing dry weather flow was estimated based on the gross floor areas, current land uses, and flow data taken from the Edmonton Design and Construction Standards. The sanitary flows contributed by the existing development are summarized in Table 5 below and detailed calculations are presented in Table 8 of Appendix C.
Table 5 - Existing Sanitary Flow
Site Discharge point Total (L/s)*
Existing Area 1(Restaurants, Neighbourhood Stores)
MH 252058525 mm sanitary sewer in
151 Street8.58
MH 252038200 mm sanitary sewer in
Stony Plain Road3.61
Existing Area 2(Restaurants, Banks) MH 252063
200 mm sanitary sewer in Stony Plain Road
6.00
STORM & SANITARY SERVICING FEASIBILITY STUDY
August 21, 2019
en v:\1161\active\1161107735\reports\servicing feasibility report\01_report\2019 12 19_jaspergates_servicingrpt.docx 1.10
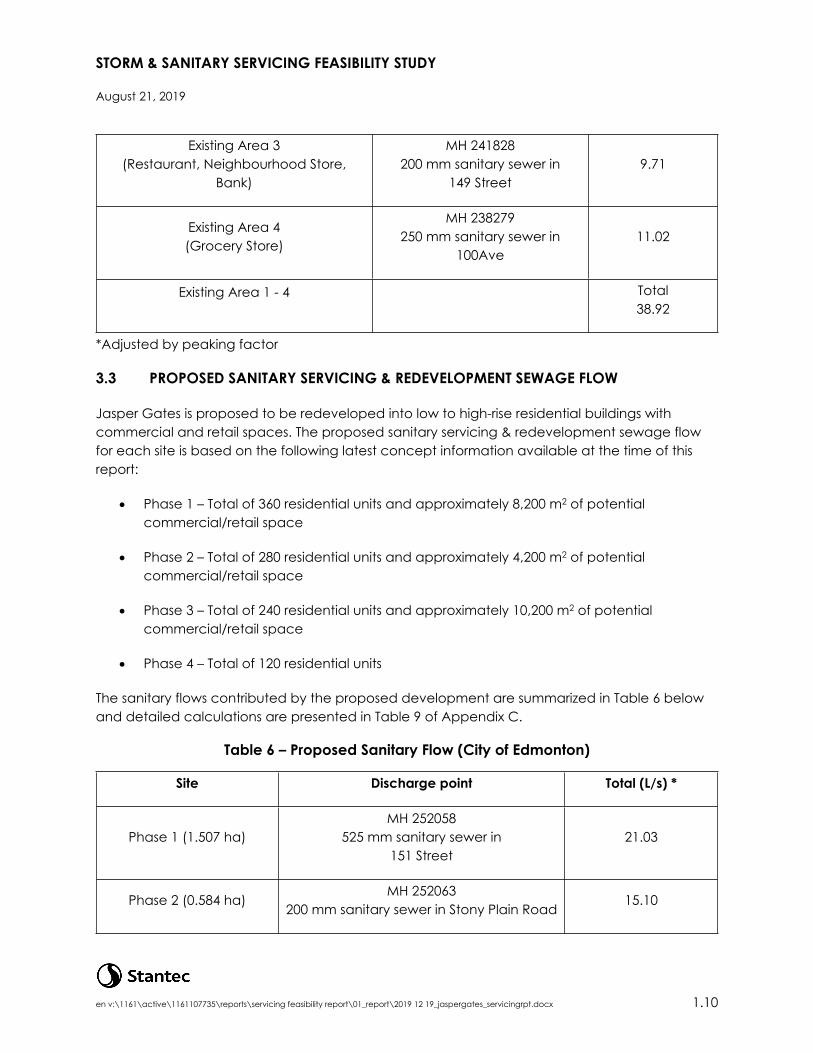
Existing Area 3(Restaurant, Neighbourhood Store,
Bank)
MH 241828200 mm sanitary sewer in
149 Street9.71
Existing Area 4(Grocery Store)
MH 238279250 mm sanitary sewer in
100Ave11.02
Existing Area 1 - 4 Total38.92
*Adjusted by peaking factor
3.3 PROPOSED SANITARY SERVICING & REDEVELOPMENT SEWAGE FLOW
Jasper Gates is proposed to be redeveloped into low to high-rise residential buildings with commercial and retail spaces. The proposed sanitary servicing & redevelopment sewage flow for each site is based on the following latest concept information available at the time of this report:
Phase 1 – Total of 360 residential units and approximately 8,200 m2 of potential commercial/retail space
Phase 2 – Total of 280 residential units and approximately 4,200 m2 of potential commercial/retail space
Phase 3 – Total of 240 residential units and approximately 10,200 m2 of potential commercial/retail space
Phase 4 – Total of 120 residential units
The sanitary flows contributed by the proposed development are summarized in Table 6 below and detailed calculations are presented in Table 9 of Appendix C.
Table 6 – Proposed Sanitary Flow (City of Edmonton)
Site Discharge point Total (L/s) *
Phase 1 (1.507 ha)MH 252058
525 mm sanitary sewer in 151 Street
21.03
Phase 2 (0.584 ha)MH 252063
200 mm sanitary sewer in Stony Plain Road15.10
STORM & SANITARY SERVICING FEASIBILITY STUDY
August 21, 2019
en v:\1161\active\1161107735\reports\servicing feasibility report\01_report\2019 12 19_jaspergates_servicingrpt.docx 1.11
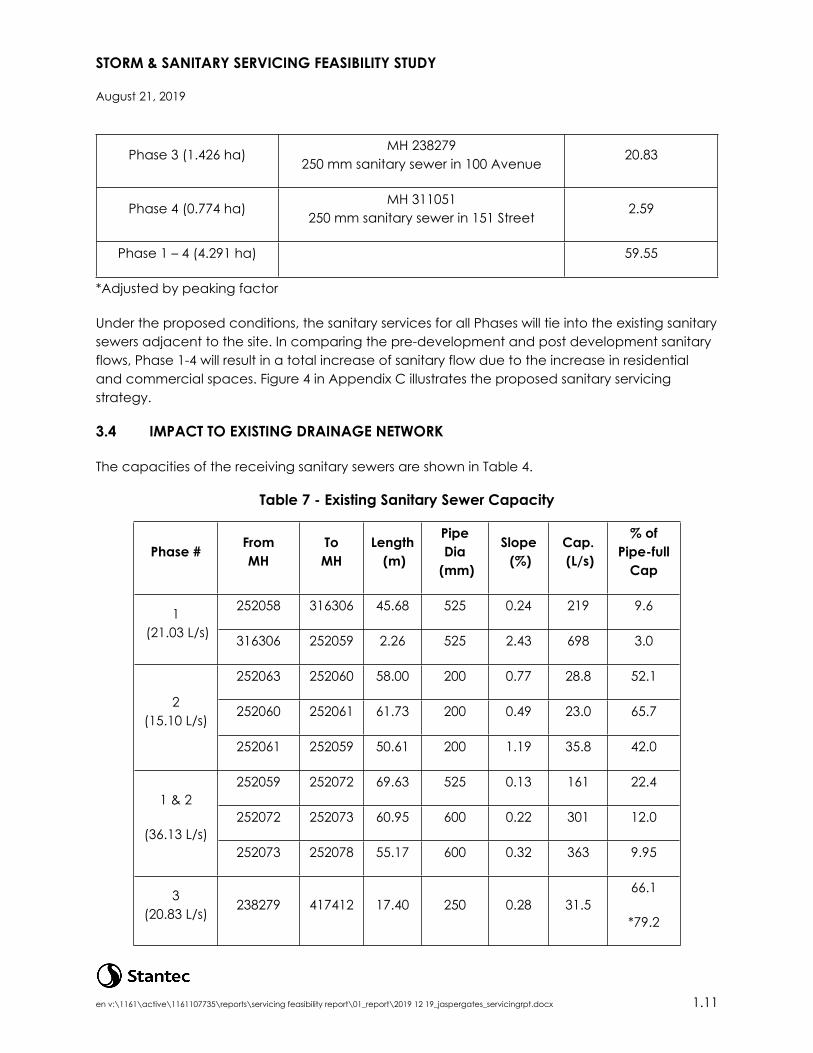
Phase 3 (1.426 ha)MH 238279
250 mm sanitary sewer in 100 Avenue 20.83
Phase 4 (0.774 ha)MH 311051
250 mm sanitary sewer in 151 Street2.59
Phase 1 – 4 (4.291 ha) 59.55
*Adjusted by peaking factor
Under the proposed conditions, the sanitary services for all Phases will tie into the existing sanitary sewers adjacent to the site. In comparing the pre-development and post development sanitary flows, Phase 1-4 will result in a total increase of sanitary flow due to the increase in residential and commercial spaces. Figure 4 in Appendix C illustrates the proposed sanitary servicing strategy.
3.4 IMPACT TO EXISTING DRAINAGE NETWORK
The capacities of the receiving sanitary sewers are shown in Table 4.
Table 7 - Existing Sanitary Sewer Capacity
Phase # From MH
ToMH
Length (m)
Pipe Dia
(mm)
Slope (%)
Cap. (L/s)
% of Pipe-full
Cap
252058 316306 45.68 525 0.24 219 9.61 (21.03 L/s) 316306 252059 2.26 525 2.43 698 3.0
252063 252060 58.00 200 0.77 28.8 52.1
252060 252061 61.73 200 0.49 23.0 65.72
(15.10 L/s)
252061 252059 50.61 200 1.19 35.8 42.0
252059 252072 69.63 525 0.13 161 22.4
252072 252073 60.95 600 0.22 301 12.01 & 2
(36.13 L/s)252073 252078 55.17 600 0.32 363 9.95
3(20.83 L/s)
238279 417412 17.40 250 0.28 31.566.1
*79.2
STORM & SANITARY SERVICING FEASIBILITY STUDY
August 21, 2019
en v:\1161\active\1161107735\reports\servicing feasibility report\01_report\2019 12 19_jaspergates_servicingrpt.docx 1.12
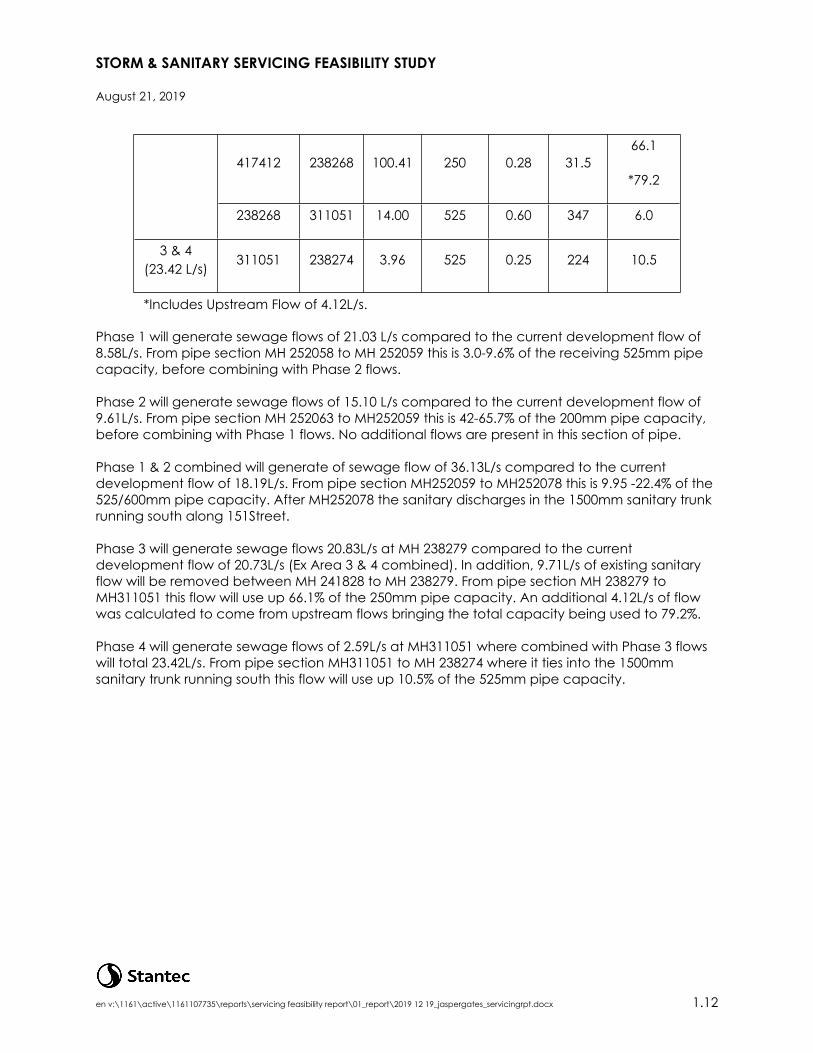
417412 238268 100.41 250 0.28 31.566.1
*79.2
238268 311051 14.00 525 0.60 347 6.0
3 & 4(23.42 L/s)
311051 238274 3.96 525 0.25 224 10.5
*Includes Upstream Flow of 4.12L/s.
Phase 1 will generate sewage flows of 21.03 L/s compared to the current development flow of 8.58L/s. From pipe section MH 252058 to MH 252059 this is 3.0-9.6% of the receiving 525mm pipe capacity, before combining with Phase 2 flows.
Phase 2 will generate sewage flows of 15.10 L/s compared to the current development flow of 9.61L/s. From pipe section MH 252063 to MH252059 this is 42-65.7% of the 200mm pipe capacity, before combining with Phase 1 flows. No additional flows are present in this section of pipe.
Phase 1 & 2 combined will generate of sewage flow of 36.13L/s compared to the current development flow of 18.19L/s. From pipe section MH252059 to MH252078 this is 9.95 -22.4% of the 525/600mm pipe capacity. After MH252078 the sanitary discharges in the 1500mm sanitary trunk running south along 151Street.
Phase 3 will generate sewage flows 20.83L/s at MH 238279 compared to the current development flow of 20.73L/s (Ex Area 3 & 4 combined). In addition, 9.71L/s of existing sanitary flow will be removed between MH 241828 to MH 238279. From pipe section MH 238279 to MH311051 this flow will use up 66.1% of the 250mm pipe capacity. An additional 4.12L/s of flow was calculated to come from upstream flows bringing the total capacity being used to 79.2%.
Phase 4 will generate sewage flows of 2.59L/s at MH311051 where combined with Phase 3 flows will total 23.42L/s. From pipe section MH311051 to MH 238274 where it ties into the 1500mm sanitary trunk running south this flow will use up 10.5% of the 525mm pipe capacity.
STORM & SANITARY SERVICING FEASIBILITY STUDY
August 21, 2019
en v:\1161\active\1161107735\reports\servicing feasibility report\01_report\2019 12 19_jaspergates_servicingrpt.docx 1.13
4.0 Conclusion
This report was prepared to provide an assessment of the storm and sanitary servicing and the anticipated effects of sanitary flow and storm discharge from the redevelopment of the Jasper Gates site located corner of Stony Plain Road and 149 Street and to provide context for future discussion.
Phase 1 storm service will tie into MH252038 and will drain to an existing 1800 mm storm sewer pipe in Stony Plain Road. An onsite stormwater storage of approximately 693.53 m3 is recommended with a 26.63 L/s/ha allowable discharge rate. The sanitary service will tie into MH252058 and will drain to an existing 525 mm sanitary sewer pipe in 151 Street.
Phase 2 storm service will tie into MH252038 and will drain to an existing 1800 mm storm sewer pipe in Stony Plain Road. An onsite stormwater storage of approximately 268.76 m3 is recommended with a 26.63 L/s/ha allowable discharge rate. The sanitary service will tie into MH141063 and will drain to an existing 200 mm sanitary sewer pipe also in Stony Plain Road.
Phase 3 storm service will tie into MH236723 and will drain to an existing 375 mm storm sewer pipe in 100 Avenue. An onsite stormwater storage of approximately 656.25 m3 is recommended with a 26.63 L/s/ha allowable discharge rate. The sanitary service will tie into MH238279 and will drain to an existing 250 mm sanitary sewer pipe in 100 Avenue.
Phase 4 storm service will tie into MH238305 and will drain to an existing 600 mm storm sewer pipe in 151 Street. An onsite stormwater storage of approximately 314.25 m3 is recommended with a 35 L/s/ha allowable discharge rate. The sanitary service will tie into MH311051 and will drain to an existing 1500 mm sanitary sewer trunk in 151 Street.
The total proposed stormwater discharge will stay the same at 114.25 L/s. As the average pre-development discharge of 26.63L/s/ha will stay the same post development. The total proposed sanitary flows generated by the redevelopment will result in an increase from 38.92 L/s to 59.55L/s. This increase is due to the added commercial and residential spaces in the subject site. These increases are negligible considering that there is available capacity remaining in the downstream sewer trunks based on the calculations.
We trust this meets with your requirements and the City can confirm and provide acceptance of the proposed servicing strategy presented in this report.
Should you have any questions, or require further information, please contact our office.

APPENDIX A
Existing Plan & Resources
STONY PLAIN ROAD
100 AVENUE
151
STRE
ET
149
STRE
ET
JASPERGATES
STONY PLAINROAD
100 AVENUE
149
STRE
ET
148
STRE
ET
151
STRE
ET
152
STRE
ET
99 AVENUE
102 AVENUEV:
\116
1\Ac
tive\
1161
1077
35\r
epor
ts\Se
rvic
ing
Feas
ibilit
y Re
port\
03_f
igur
es\1
1611
0773
5_Fig
ures
.dw
g20
19/0
5/23
9:3
1 AM B
y: Au
ch, A
ngel
ica
N
www.stantec.com
Suite #400, 10220-103 Ave NWEdmonton AB Canada
SITE LOCATION
KEY PLAN
Figure No.
Client/Project
Title
RIOCANJASPER GATESREDEVELOPMENT
1.0
SITE LOCATIONAND KEY PLAN
May, 20191161-107735

APPENDIX B
Storm Servicing
149
STRE
ET
151
STRE
ET
100 AVENUE
STONY PLAIN ROAD
SUMMIT DRIVE
V:\1
161\
Activ
e\11
6110
7735
\rep
orts\
Serv
icin
g Fe
asib
ility
Repo
rt\03
_fig
ures
\116
1107
735_
Figur
es.d
wg
2019
/12/
20 1
0:33
AM By:
Eriks
son,
Nat
han
N
www.stantec.com
Suite #400, 10220-103 Ave NWEdmonton AB Canada
Figure No.
Client/Project
Title
RIOCANJASPER GATESREDEVELOPMENT
3.0
PRELIMINARY STORMSERVICING SITE PLAN
Dec, 20191161-107735
1:2000
EX DRAINAGE SEWERSUBJECT SITE BOUNDARY
PRELIMINARY STORM SERVICE TIE IN
Proposed Phase 1 Area = 1.507 haExisting Phase 1 Area = 0.917 haEX Capacity of Downstream 1800mm @ 0.93% = 11,568.0 L/s5 & 100 YR Pre Development Flow - Peak (@ 32.6 L/s/ha) = 29.9 L/s5 & 100 YR Post Development Flow - Peak (@ 26.6 L/s/ha) = 40.1 L/s
LEGEND
Proposed Phase 2 Area = 0.584 haExisting Phase 2 Area = 1.409 haEX Capacity of Downstream 1800mm @ 0.93% = 11,568.0 L/s5 & 100 YR Pre Development Flow - Peak (@ 21L/s/ha) = 29.6 L/s5 & 100 YR Post Development Flow - Peak (@ 26.6 L/s/ha) = 15.6 L/s
Proposed Phase 3 Area = 1.426 haExisting Phase 3 Area = 0.518 ha
EX Capacity of Downstream 375mm @ 0.38% = 108.0 L/s5 & 100 YR Pre Development Flow - Peak (@ 29 L/s/ha) = 15.1 L/s
5 & 100 YR Post Development Flow - Peak (@ 26.6 L/s/ha) = 37.9 L/sProposed Phase 4 Area = 0.774 ha
Existing Phase 4 Area = 1.447 haEX Capacity of Downstream 600mm @ 0.18% = 272.0 L/s
5 & 100 YR Pre Development Flow - Peak (@ 27.4 L/s/ha) = 39.6 L/s5 & 100 YR Post Development Flow - Peak (@ 26.6 L/s/ha) = 20.6 L/s
STORM CALCULATIONS
Storage Volume Calculation Summary 1:5 Year - Predevelopment vs. Post Development Flow Comparison
1:100 Year - Predevelopment vs. Post Development Flow Comparison 1:5 Year Chicago – 4hr Storm – Storage Volume Calculations
1:100 Year Chicago – 4hr Storm – Storage Volume Calculations 1:100 Year Huff Storage Volume Calculations

PROJECT : 35 L/s/ha - Discharge CalculationJOB No. : A= 0.9170 HaDATE : Q= 0.03210 m3/sDES. BY :
Where:C = 0.600 Discharge coefficient (0.60)
ORIFICE EQUATION : A = 0.006 Orifice area (m2)(pi/4*D2)D = 0.089 Diameter of orifice (m) From existing site plan 3.5" orificeg = 9.810 gravitational acceleration (9.81 m/sec2)H = 3.276 Head (m) (HWL - (invert + D/2))
HWL = 670.97 High water level (m) Assume HWL is 0.35 above lowest CB (from Invert = 667.65 (m) From existing onsite plans
Q = 0.02992 Discharge (L/s)A = 0.917 Area discharging to orifice (m2)
32.63 L/s/haCalculated Controlled Discharge =
ORIFICE 'A' CALCULATION
Jasper Gates1161-107735August 21, 2019N. Eriksson
gHCAQ 2=
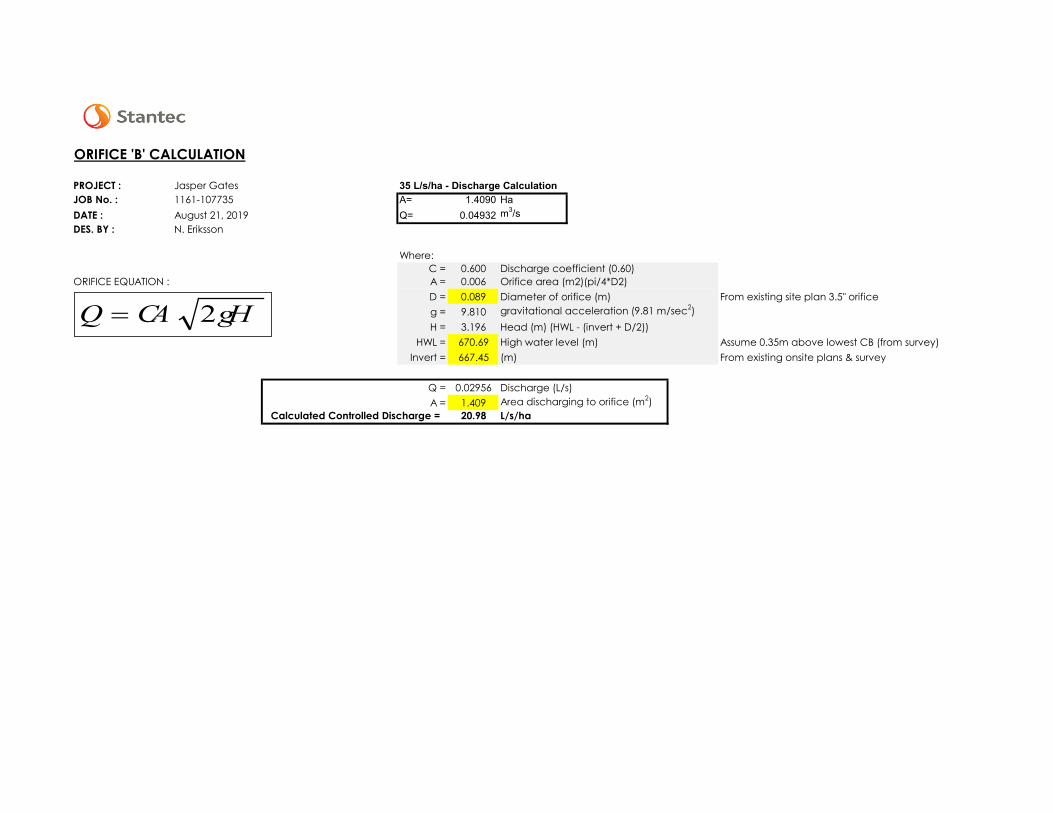
PROJECT : 35 L/s/ha - Discharge CalculationJOB No. : A= 1.4090 HaDATE : Q= 0.04932 m3/sDES. BY :
Where:C = 0.600 Discharge coefficient (0.60)
ORIFICE EQUATION : A = 0.006 Orifice area (m2)(pi/4*D2)D = 0.089 Diameter of orifice (m) From existing site plan 3.5" orificeg = 9.810 gravitational acceleration (9.81 m/sec2)H = 3.196 Head (m) (HWL - (invert + D/2))
HWL = 670.69 High water level (m) Assume 0.35m above lowest CB (from survey)Invert = 667.45 (m) From existing onsite plans & survey
Q = 0.02956 Discharge (L/s)A = 1.409 Area discharging to orifice (m2)
20.98 L/s/ha
ORIFICE 'B' CALCULATION
Jasper Gates1161-107735August 21, 2019N. Eriksson
Calculated Controlled Discharge =
gHCAQ 2=
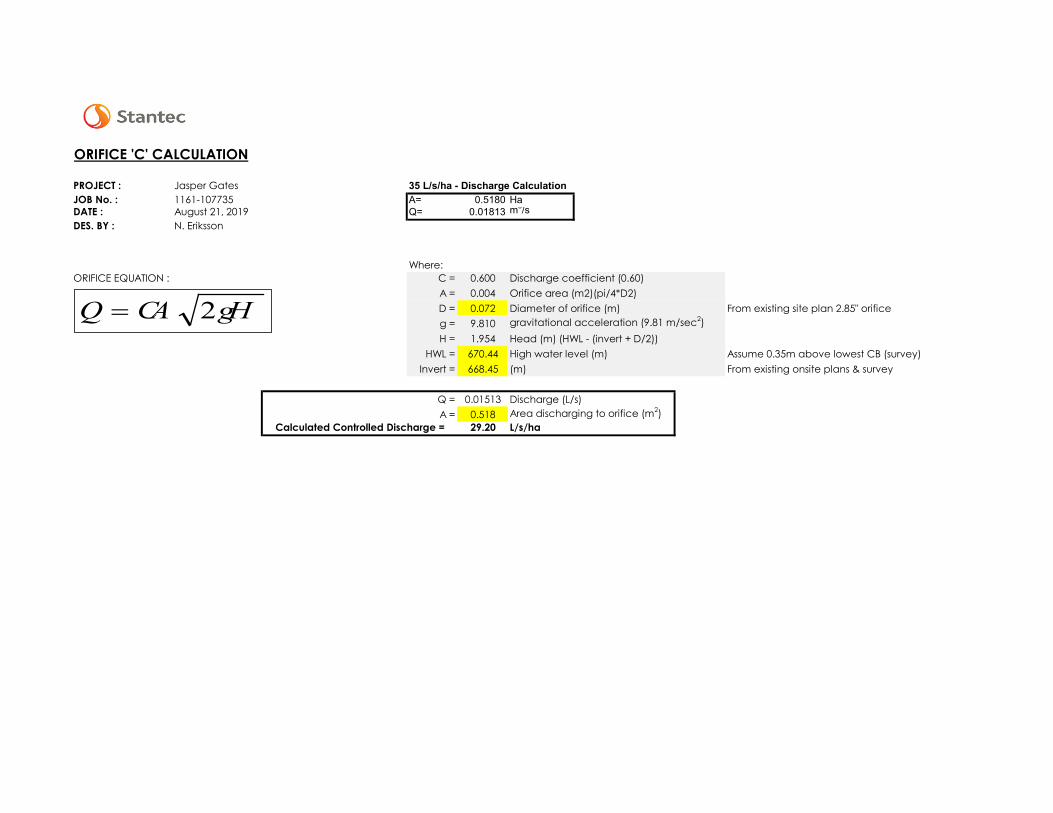
PROJECT : 35 L/s/ha - Discharge CalculationJOB No. : A= 0.5180 HaDATE : Q= 0.01813 m3/sDES. BY :
Where:ORIFICE EQUATION : C = 0.600 Discharge coefficient (0.60)
A = 0.004 Orifice area (m2)(pi/4*D2)D = 0.072 Diameter of orifice (m) From existing site plan 2.85" orificeg = 9.810 gravitational acceleration (9.81 m/sec2)H = 1.954 Head (m) (HWL - (invert + D/2))
HWL = 670.44 High water level (m) Assume 0.35m above lowest CB (survey)Invert = 668.45 (m) From existing onsite plans & survey
Q = 0.01513 Discharge (L/s)A = 0.518 Area discharging to orifice (m2)
29.20 L/s/ha
ORIFICE 'C' CALCULATION
Jasper Gates1161-107735August 21, 2019N. Eriksson
Calculated Controlled Discharge =
gHCAQ 2=
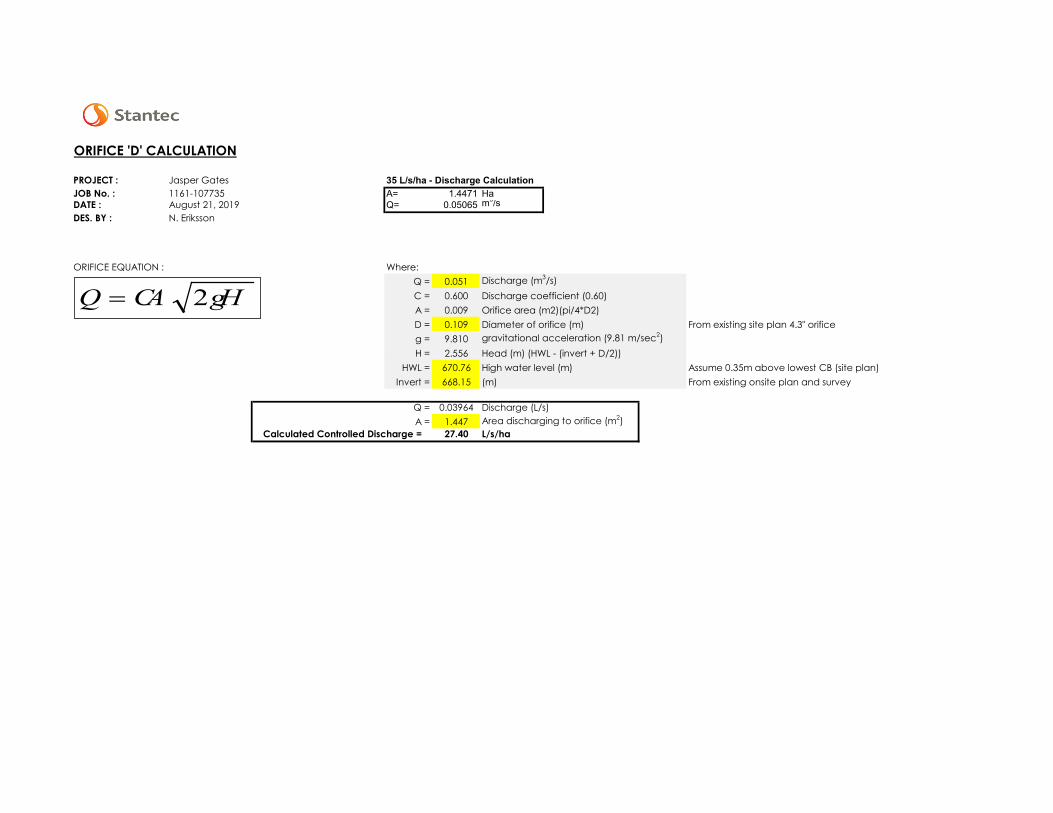
PROJECT : 35 L/s/ha - Discharge CalculationJOB No. : A= 1.4471 HaDATE : Q= 0.05065 m3/sDES. BY :
ORIFICE EQUATION : Where:Q = 0.051 Discharge (m3/s)C = 0.600 Discharge coefficient (0.60)A = 0.009 Orifice area (m2)(pi/4*D2)D = 0.109 Diameter of orifice (m) From existing site plan 4.3" orificeg = 9.810 gravitational acceleration (9.81 m/sec2)H = 2.556 Head (m) (HWL - (invert + D/2))
HWL = 670.76 High water level (m) Assume 0.35m above lowest CB (site plan)Invert = 668.15 (m) From existing onsite plan and survey
Q = 0.03964 Discharge (L/s)A = 1.447 Area discharging to orifice (m2)
27.40 L/s/ha
ORIFICE 'D' CALCULATION
Jasper Gates1161-107735August 21, 2019N. Eriksson
Calculated Controlled Discharge =
gHCAQ 2=

Project: Jasper GatesFile: 1161 107735Date: 12/20/2019 Phase 1 Design By: N. ErikssonChecked By:
STORAGE VOLUME CALCULATION SUMMARY
Basin Area 1.507 HaRunoff Coefficient 0.95Allowable Discharge Rate 26.63 L/s/Ha
Required Storage5 Year 4H Chicago 191.56 m³100 Year 4H Chicago 693.53 m³100 Year Huff 430.42 m³1937 Storm Storage 273.51 m³1978 Storm Storage 1,087.05 m³2004 Storm Storage 1,071.88 m³2012 Storm Storage 522.99 m³
filenumber:V:\1161\Active\1161107735\reports\Servicing Feasibility Report\02_calcs\Storm\[2019 12 20_1161107735_StormStorage_orificeA_Phase1.xls]Calc Summary
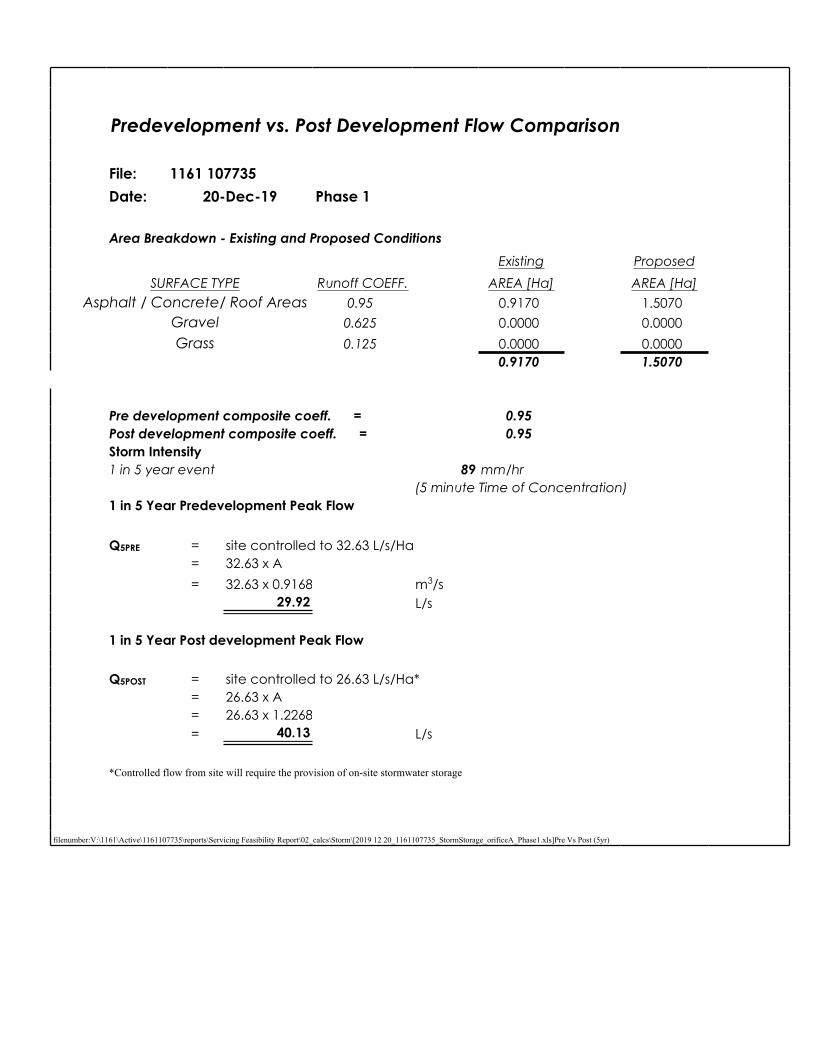
Predevelopment vs. Post Development Flow Comparison
File: 1161 107735 Date: 20-Dec-19 Phase 1
Area Breakdown - Existing and Proposed Conditions
Existing ProposedSURFACE TYPE Runoff COEFF. AREA [Ha] AREA [Ha]
Asphalt / Concrete/ Roof Areas 0.95 0.9170 1.5070Gravel 0.625 0.0000 0.0000Grass 0.125 0.0000 0.0000
0.9170 1.5070
Pre development composite coeff. = 0.95Post development composite coeff. = 0.95Storm Intensity1 in 5 year event 89 mm/hr
(5 minute Time of Concentration)1 in 5 Year Predevelopment Peak Flow
Q5PRE = site controlled to 32.63 L/s/Ha = 32.63 x A= 32.63 x 0.9168 m3/s
29.92 L/s
1 in 5 Year Post development Peak Flow
Q5POST = site controlled to 26.63 L/s/Ha*= 26.63 x A= 26.63 x 1.2268= 40.13 L/s
*Controlled flow from site will require the provision of on-site stormwater storage
filenumber:V:\1161\Active\1161107735\reports\Servicing Feasibility Report\02_calcs\Storm\[2019 12 20_1161107735_StormStorage_orificeA_Phase1.xls]Pre Vs Post (5yr)

Predevelopment vs. Post Development Flow Comparison
File: 1161 107735 Date: 20-Dec-19 Phase 1
Area Breakdown - Existing Conditions
Existing ProposedSURFACE TYPE Runoff COEFF. AREA [Ha] AREA [Ha]
Asphalt / Concrete/ Roof Areas 0.95 0.9170 1.5070Gravel 0.625 0.0000 0.0000Grass 0.125 0.0000 0.0000
0.9170 1.5070
Pre development composite coeff. = 0.95Post development composite coeff. = 0.95Storm Intensity1 in 100 year event 188.4 mm/hr
(5 minute Time of Concentration)1 in 100 Year Predevelopment Peak Flow
Q100PRE = site controlled to 32.63 L/s/Ha= 32.63 x A= 32.63 x 0.9168 m3/s
29.92 L/s
1 in 100 Year Post development Peak Flow (Controlled)
Q100POST = site controlled to 26.63 L/s/Ha*= 35 x A= 35 x 1.5066= 40.13 L/s
*Controlled flow from site will require the provision of on-site stormwater storage
filenumber:V:\1161\Active\1161107735\reports\Servicing Feasibility Report\02_calcs\Storm\[2019 12 20_1161107735_StormStorage_orificeA_Phase1.xls]Pre Vs Post (100yr)

STORAGE VOLUME CALCULATOR
File: 1161 107735 Date: 20-Dec-19 1:5 YEAR CHICAGO-4HR STORM - STORAGE VOLUME CALCULATIONS
AREA SUMMARY:
SURFACE TYPE 100 YEAR COEFF. AREA [Ha]Asphalt / Concrete 0.95 0.0000Building/Roof Areas 0.95 1.5070
Gravel 0.625 0.0000Grass 0.125 0.0000
1.5070
Post development composite coefficient = 0.95
Add controlled flow from roof drains = 0 L/s
CONTROLLED DISCHARGE = 40.13141 L/s or 12.04 cu.m/intervalTIME INTERVAL: 5 min. interval
5 YEAR STORM - 4-HR CHICAGO DISTRIBUTION - CITY OF EDMONTON
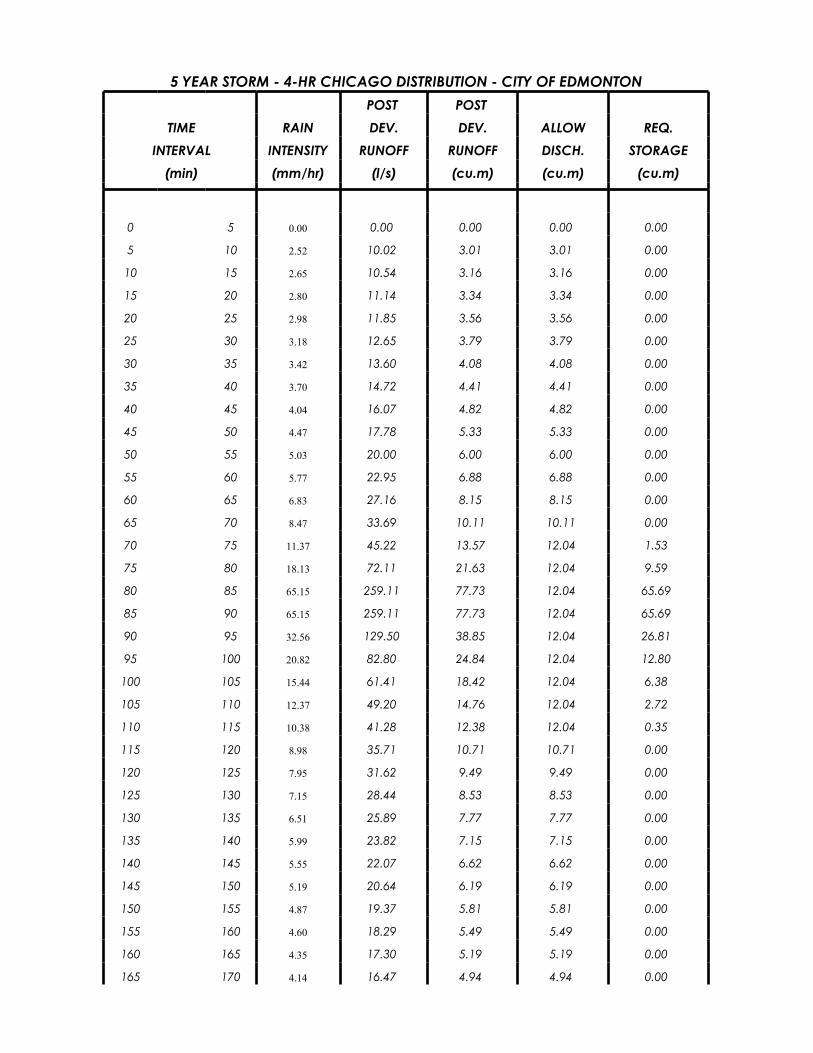
5 YEAR STORM - 4-HR CHICAGO DISTRIBUTION - CITY OF EDMONTONPOST POST
TIME RAIN DEV. DEV. ALLOW REQ.INTERVAL INTENSITY RUNOFF RUNOFF DISCH. STORAGE
(min) (mm/hr) (l/s) (cu.m) (cu.m) (cu.m)
0 5 0.00 0.00 0.00 0.00 0.00
5 10 2.52 10.02 3.01 3.01 0.00
10 15 2.65 10.54 3.16 3.16 0.00
15 20 2.80 11.14 3.34 3.34 0.00
20 25 2.98 11.85 3.56 3.56 0.00
25 30 3.18 12.65 3.79 3.79 0.00
30 35 3.42 13.60 4.08 4.08 0.00
35 40 3.70 14.72 4.41 4.41 0.00
40 45 4.04 16.07 4.82 4.82 0.00
45 50 4.47 17.78 5.33 5.33 0.00
50 55 5.03 20.00 6.00 6.00 0.00
55 60 5.77 22.95 6.88 6.88 0.00
60 65 6.83 27.16 8.15 8.15 0.00
65 70 8.47 33.69 10.11 10.11 0.00
70 75 11.37 45.22 13.57 12.04 1.53
75 80 18.13 72.11 21.63 12.04 9.59
80 85 65.15 259.11 77.73 12.04 65.69
85 90 65.15 259.11 77.73 12.04 65.69
90 95 32.56 129.50 38.85 12.04 26.81
95 100 20.82 82.80 24.84 12.04 12.80
100 105 15.44 61.41 18.42 12.04 6.38
105 110 12.37 49.20 14.76 12.04 2.72
110 115 10.38 41.28 12.38 12.04 0.35
115 120 8.98 35.71 10.71 10.71 0.00
120 125 7.95 31.62 9.49 9.49 0.00
125 130 7.15 28.44 8.53 8.53 0.00
130 135 6.51 25.89 7.77 7.77 0.00
135 140 5.99 23.82 7.15 7.15 0.00
140 145 5.55 22.07 6.62 6.62 0.00
145 150 5.19 20.64 6.19 6.19 0.00
150 155 4.87 19.37 5.81 5.81 0.00
155 160 4.60 18.29 5.49 5.49 0.00
160 165 4.35 17.30 5.19 5.19 0.00
165 170 4.14 16.47 4.94 4.94 0.00
170 175 3.95 15.71 4.71 4.71 0.00
175 180 3.78 15.03 4.51 4.51 0.00
180 185 3.62 14.40 4.32 4.32 0.00
185 190 3.48 13.84 4.15 4.15 0.00
190 195 3.35 13.32 4.00 4.00 0.00
195 200 3.23 12.85 3.85 3.85 0.00
200 205 3.12 12.41 3.72 3.72 0.00
205 210 3.02 12.01 3.60 3.60 0.00
210 215 2.93 11.65 3.50 3.50 0.00
215 220 2.84 11.30 3.39 3.39 0.00
220 225 2.76 10.98 3.29 3.29 0.00
225 230 2.69 10.70 3.21 3.21 0.00
230 235 2.62 10.42 3.13 3.13 0.00
235 240 2.55 10.14 3.04 3.04 0.00
240 245 2.49 9.90 2.97 2.97 0.00 REQUIRED STORAGE (cu.m) = 191.56
filenumber:V:\1161\Active\1161107735\reports\Servicing Feasibility Report\02_calcs\Storm\[2019 12 20_1161107735_StormStorage_orificeA_Phase1.xls]CHICAGO (5yr)
5 YEAR STORM - 4-HR CHICAGO DISTRIBUTION - CITY OF EDMONTON
STORAGE VOLUME CALCULATOR
File: 1161 107735 Date: 20-Dec-19 1:100 YEAR CHICAGO-4HR STORM - STORAGE VOLUME CALCULATIONS
AREA SUMMARY:
SURFACE TYPE 100 YEAR COEFF. AREA [Ha]Asphalt / Concrete 0.95 0.0000Building/Roof Areas 0.95 1.5070
Gravel 0.625 0.0000Grass 0.125 0.0000
1.5070
Post development composite coefficient = 0.95
Add controlled flow from roof drains = 0 L/s
CONTROLLED DISCHARGE = 40.13141 L/s or 12.04 cu.m/intervalTIME INTERVAL: 5 min. interval
100 YEAR STORM - 4-HR CHICAGO DISTRIBUTION - CITY OF EDMONTON

100 YEAR STORM - 4-HR CHICAGO DISTRIBUTION - CITY OF EDMONTONPOST POST
TIME RAIN DEV. DEV. ALLOW REQ.INTERVAL INTENSITY RUNOFF RUNOFF DISCH. STORAGE
(min) (mm/hr) (l/s) (cu.m) (cu.m) (cu.m)
0 5 0.00 0.00 0.00 0.00 0.00
5 10 6.25 24.86 7.46 7.46 0.00
10 15 6.58 26.17 7.85 7.85 0.00
15 20 6.97 27.72 8.32 8.32 0.00
20 25 7.41 29.47 8.84 8.84 0.00
25 30 7.92 31.50 9.45 9.45 0.00
30 35 8.52 33.89 10.17 10.17 0.00
35 40 9.24 36.75 11.02 11.02 0.00
40 45 10.12 40.25 12.07 12.04 0.04
45 50 11.22 44.62 13.39 12.04 1.35
50 55 12.63 50.23 15.07 12.04 3.03
55 60 14.54 57.83 17.35 12.04 5.31
60 65 17.26 68.65 20.59 12.04 8.55
65 70 21.48 85.43 25.63 12.04 13.59
70 75 28.94 115.10 34.53 12.04 22.49
75 80 45.90 182.55 54.76 12.04 42.73
80 85 143.62 571.19 171.36 12.04 159.32
85 90 143.62 571.19 171.36 12.04 159.32
90 95 80.00 318.17 95.45 12.04 83.41
95 100 52.54 208.96 62.69 12.04 50.65
100 105 39.26 156.14 46.84 12.04 34.80
105 110 31.48 125.20 37.56 12.04 25.52
110 115 26.40 105.00 31.50 12.04 19.46
115 120 22.81 90.72 27.22 12.04 15.18
120 125 20.14 80.10 24.03 12.04 11.99
125 130 18.08 71.91 21.57 12.04 9.53
130 135 16.44 65.38 19.62 12.04 7.58
135 140 15.10 60.05 18.02 12.04 5.98
140 145 13.98 55.60 16.68 12.04 4.64
145 150 13.04 51.86 15.56 12.04 3.52
150 155 12.23 48.64 14.59 12.04 2.55
155 160 11.52 45.82 13.74 12.04 1.71
160 165 10.91 43.39 13.02 12.04 0.98
165 170 10.36 41.20 12.36 12.04 0.32
170 175 9.87 39.25 11.78 11.78 0.00
175 180 9.44 37.54 11.26 11.26 0.00
180 185 9.04 35.95 10.79 10.79 0.00
185 190 8.68 34.52 10.36 10.36 0.00
190 195 8.36 33.25 9.97 9.97 0.00
195 200 8.06 32.06 9.62 9.62 0.00
200 205 7.78 30.94 9.28 9.28 0.00
205 210 7.53 29.95 8.98 8.98 0.00
210 215 7.29 28.99 8.70 8.70 0.00
215 220 7.07 28.12 8.44 8.44 0.00
220 225 6.86 27.28 8.18 8.18 0.00
225 230 6.67 26.53 7.96 7.96 0.00
230 235 6.49 25.81 7.74 7.74 0.00
235 240 6.33 25.18 7.55 7.55 0.00
240 245 6.17 24.54 7.36 7.36 0.00
REQUIRED STORAGE (cu.m) = 693.53
filenumber:V:\1161\Active\1161107735\reports\Servicing Feasibility Report\02_calcs\Storm\[2019 12 20_1161107735_StormStorage_orificeA_Phase1.xls]CHICAGO(100yr)
100 YEAR STORM - 4-HR CHICAGO DISTRIBUTION - CITY OF EDMONTON
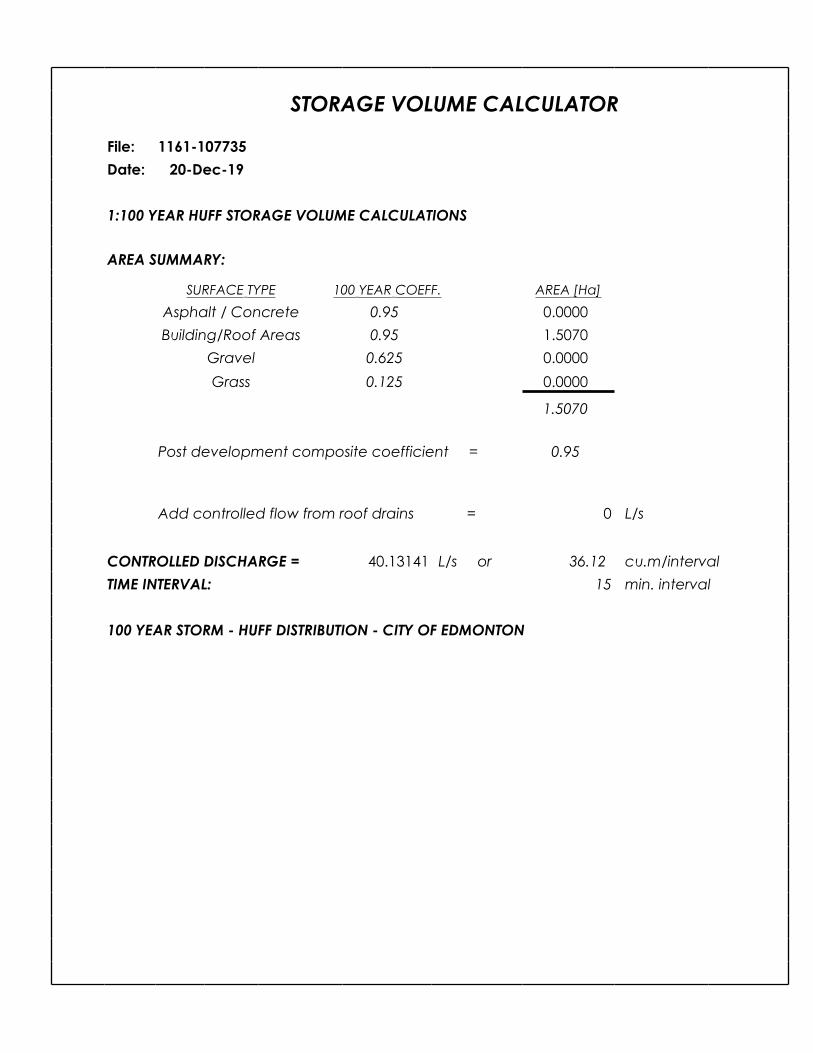
STORAGE VOLUME CALCULATOR
File: 1161-107735 Date: 20-Dec-19
1:100 YEAR HUFF STORAGE VOLUME CALCULATIONS
AREA SUMMARY:
SURFACE TYPE 100 YEAR COEFF. AREA [Ha]
Asphalt / Concrete 0.95 0.0000Building/Roof Areas 0.95 1.5070
Gravel 0.625 0.0000Grass 0.125 0.0000
1.5070
Post development composite coefficient = 0.95
Add controlled flow from roof drains = 0 L/s CONTROLLED DISCHARGE = 40.13141 L/s or 36.12 cu.m/intervalTIME INTERVAL: 15 min. interval
100 YEAR STORM - HUFF DISTRIBUTION - CITY OF EDMONTON
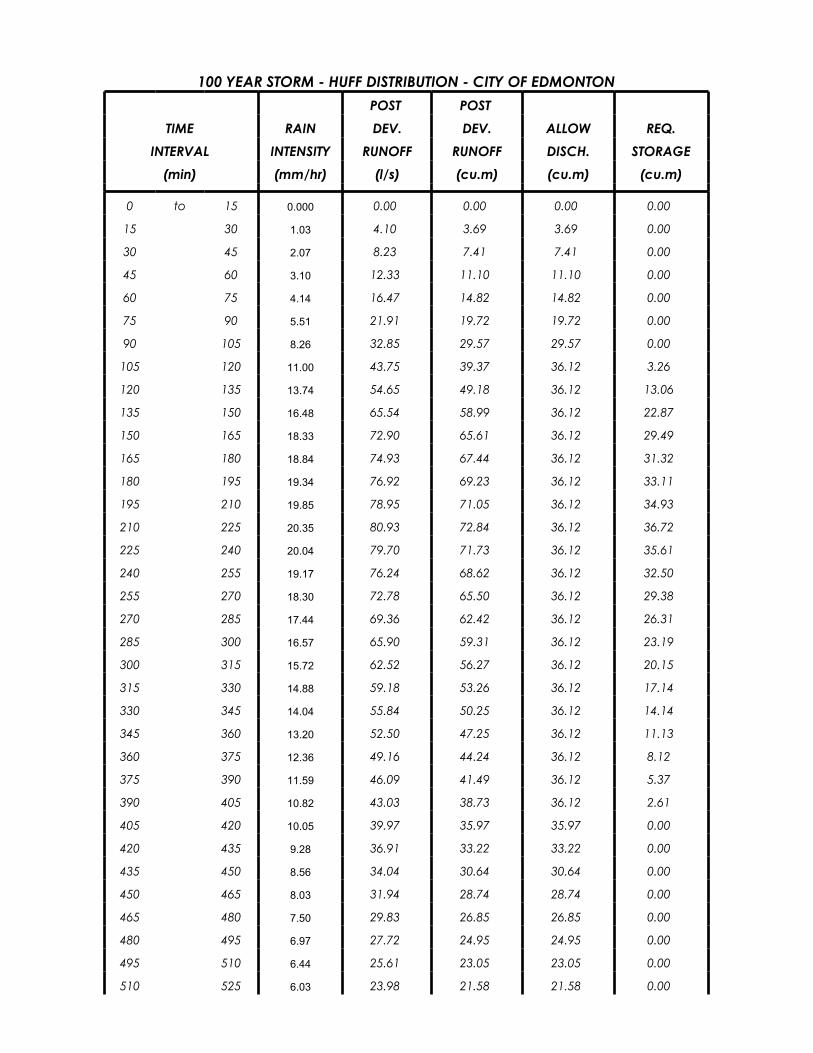
100 YEAR STORM - HUFF DISTRIBUTION - CITY OF EDMONTONPOST POST
TIME RAIN DEV. DEV. ALLOW REQ.INTERVAL INTENSITY RUNOFF RUNOFF DISCH. STORAGE
(min) (mm/hr) (l/s) (cu.m) (cu.m) (cu.m)
0 to 15 0.000 0.00 0.00 0.00 0.00
15 30 1.03 4.10 3.69 3.69 0.00
30 45 2.07 8.23 7.41 7.41 0.00
45 60 3.10 12.33 11.10 11.10 0.00
60 75 4.14 16.47 14.82 14.82 0.00
75 90 5.51 21.91 19.72 19.72 0.00
90 105 8.26 32.85 29.57 29.57 0.00
105 120 11.00 43.75 39.37 36.12 3.26
120 135 13.74 54.65 49.18 36.12 13.06
135 150 16.48 65.54 58.99 36.12 22.87
150 165 18.33 72.90 65.61 36.12 29.49
165 180 18.84 74.93 67.44 36.12 31.32
180 195 19.34 76.92 69.23 36.12 33.11
195 210 19.85 78.95 71.05 36.12 34.93
210 225 20.35 80.93 72.84 36.12 36.72
225 240 20.04 79.70 71.73 36.12 35.61
240 255 19.17 76.24 68.62 36.12 32.50
255 270 18.30 72.78 65.50 36.12 29.38
270 285 17.44 69.36 62.42 36.12 26.31
285 300 16.57 65.90 59.31 36.12 23.19
300 315 15.72 62.52 56.27 36.12 20.15
315 330 14.88 59.18 53.26 36.12 17.14
330 345 14.04 55.84 50.25 36.12 14.14
345 360 13.20 52.50 47.25 36.12 11.13
360 375 12.36 49.16 44.24 36.12 8.12
375 390 11.59 46.09 41.49 36.12 5.37
390 405 10.82 43.03 38.73 36.12 2.61
405 420 10.05 39.97 35.97 35.97 0.00
420 435 9.28 36.91 33.22 33.22 0.00
435 450 8.56 34.04 30.64 30.64 0.00
450 465 8.03 31.94 28.74 28.74 0.00
465 480 7.50 29.83 26.85 26.85 0.00
480 495 6.97 27.72 24.95 24.95 0.00
495 510 6.44 25.61 23.05 23.05 0.00
510 525 6.03 23.98 21.58 21.58 0.00
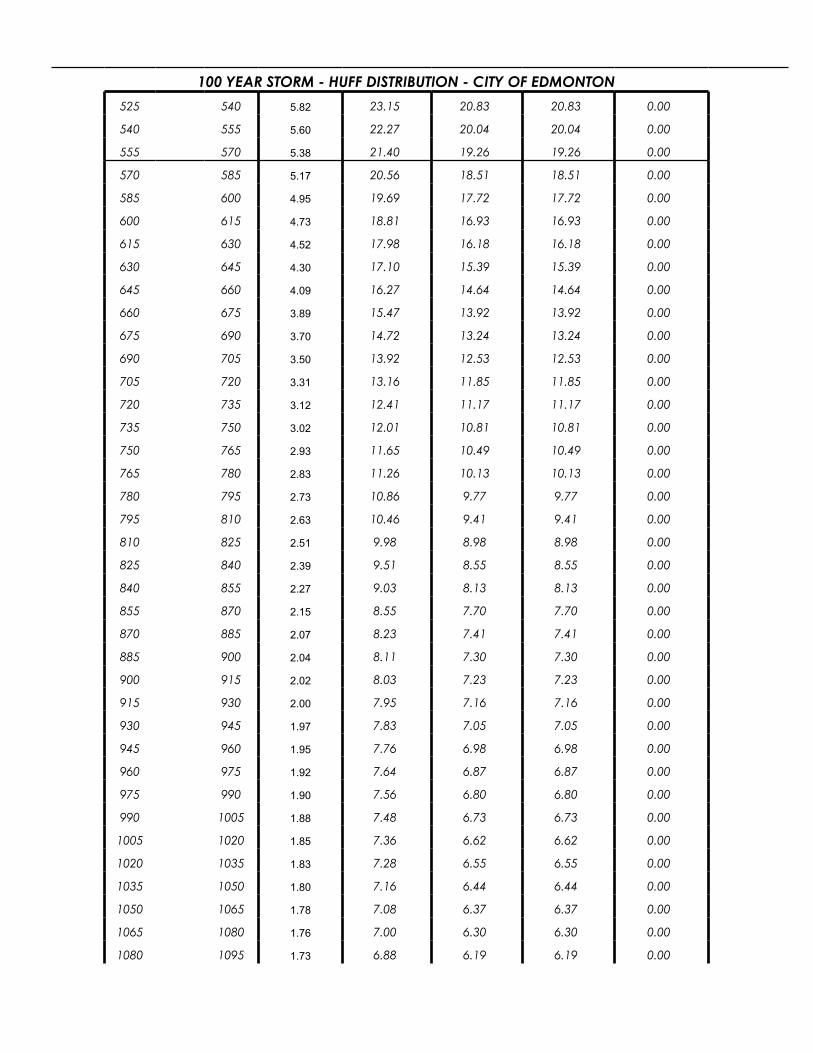
525 540 5.82 23.15 20.83 20.83 0.00
540 555 5.60 22.27 20.04 20.04 0.00
555 570 5.38 21.40 19.26 19.26 0.00
570 585 5.17 20.56 18.51 18.51 0.00
585 600 4.95 19.69 17.72 17.72 0.00
600 615 4.73 18.81 16.93 16.93 0.00
615 630 4.52 17.98 16.18 16.18 0.00
630 645 4.30 17.10 15.39 15.39 0.00
645 660 4.09 16.27 14.64 14.64 0.00
660 675 3.89 15.47 13.92 13.92 0.00
675 690 3.70 14.72 13.24 13.24 0.00
690 705 3.50 13.92 12.53 12.53 0.00
705 720 3.31 13.16 11.85 11.85 0.00
720 735 3.12 12.41 11.17 11.17 0.00
735 750 3.02 12.01 10.81 10.81 0.00
750 765 2.93 11.65 10.49 10.49 0.00
765 780 2.83 11.26 10.13 10.13 0.00
780 795 2.73 10.86 9.77 9.77 0.00
795 810 2.63 10.46 9.41 9.41 0.00
810 825 2.51 9.98 8.98 8.98 0.00
825 840 2.39 9.51 8.55 8.55 0.00
840 855 2.27 9.03 8.13 8.13 0.00
855 870 2.15 8.55 7.70 7.70 0.00
870 885 2.07 8.23 7.41 7.41 0.00
885 900 2.04 8.11 7.30 7.30 0.00
900 915 2.02 8.03 7.23 7.23 0.00
915 930 2.00 7.95 7.16 7.16 0.00
930 945 1.97 7.83 7.05 7.05 0.00
945 960 1.95 7.76 6.98 6.98 0.00
960 975 1.92 7.64 6.87 6.87 0.00
975 990 1.90 7.56 6.80 6.80 0.00
990 1005 1.88 7.48 6.73 6.73 0.00
1005 1020 1.85 7.36 6.62 6.62 0.00
1020 1035 1.83 7.28 6.55 6.55 0.00
1035 1050 1.80 7.16 6.44 6.44 0.00
1050 1065 1.78 7.08 6.37 6.37 0.00
1065 1080 1.76 7.00 6.30 6.30 0.00
1080 1095 1.73 6.88 6.19 6.19 0.00
100 YEAR STORM - HUFF DISTRIBUTION - CITY OF EDMONTON
1095 1110 1.71 6.80 6.12 6.12 0.00
1110 1125 1.68 6.68 6.01 6.01 0.00
1125 1140 1.66 6.60 5.94 5.94 0.00
1140 1155 1.64 6.52 5.87 5.87 0.00
1155 1170 1.61 6.40 5.76 5.76 0.00
1170 1185 1.56 6.20 5.58 5.58 0.00
1185 1200 1.51 6.01 5.40 5.40 0.00
1200 1215 1.46 5.81 5.23 5.23 0.00
1215 1230 1.41 5.61 5.05 5.05 0.00
1230 1245 1.37 5.45 4.90 4.90 0.00
1245 1260 1.32 5.25 4.72 4.72 0.00
1260 1275 1.27 5.05 4.55 4.55 0.00
1275 1290 1.22 4.85 4.37 4.37 0.00
1290 1305 1.17 4.65 4.19 4.19 0.00
1305 1320 1.13 4.49 4.04 4.04 0.00
1320 1335 1.08 4.30 3.87 3.87 0.00
1335 1350 1.03 4.10 3.69 3.69 0.00
1350 1365 0.980 3.90 3.51 3.51 0.00
1365 1380 0.930 3.70 3.33 3.33 0.00
1380 1395 0.890 3.54 3.19 3.19 0.00
1395 1410 0.840 3.34 3.01 3.01 0.00
1410 1425 0.790 3.14 2.83 2.83 0.00
1425 1440 0.740 2.94 2.65 2.65 0.00
1440 1455 0.690 2.74 2.47 2.47 0.00 REQUIRED STORAGE (cu.m) = 430.42
100 YEAR STORM - HUFF DISTRIBUTION - CITY OF EDMONTON
Project: Jasper GatesFile: 1161 107735Date: 12/20/2019 Phase 2 Design By: N. ErikssonChecked By:
STORAGE VOLUME CALCULATION SUMMARY
Basin Area 0.584 HaRunoff Coefficient 0.95Allowable Discharge Rate 26.63 L/s/Ha
Required Storage5 Year 4H Chicago 74.24 m³100 Year 4H Chicago 268.76 m³100 Year Huff 166.80 m³1937 Storm Storage 105.99 m³1978 Storm Storage 421.26 m³2004 Storm Storage 415.38 m³2012 Storm Storage 202.67 m³
filenumber:V:\1161\Active\1161107735\reports\Servicing Feasibility Report\02_calcs\Storm\[2019 12 20_1161107735_StormStorage_orificeB_Phase2.xls]Calc Summary
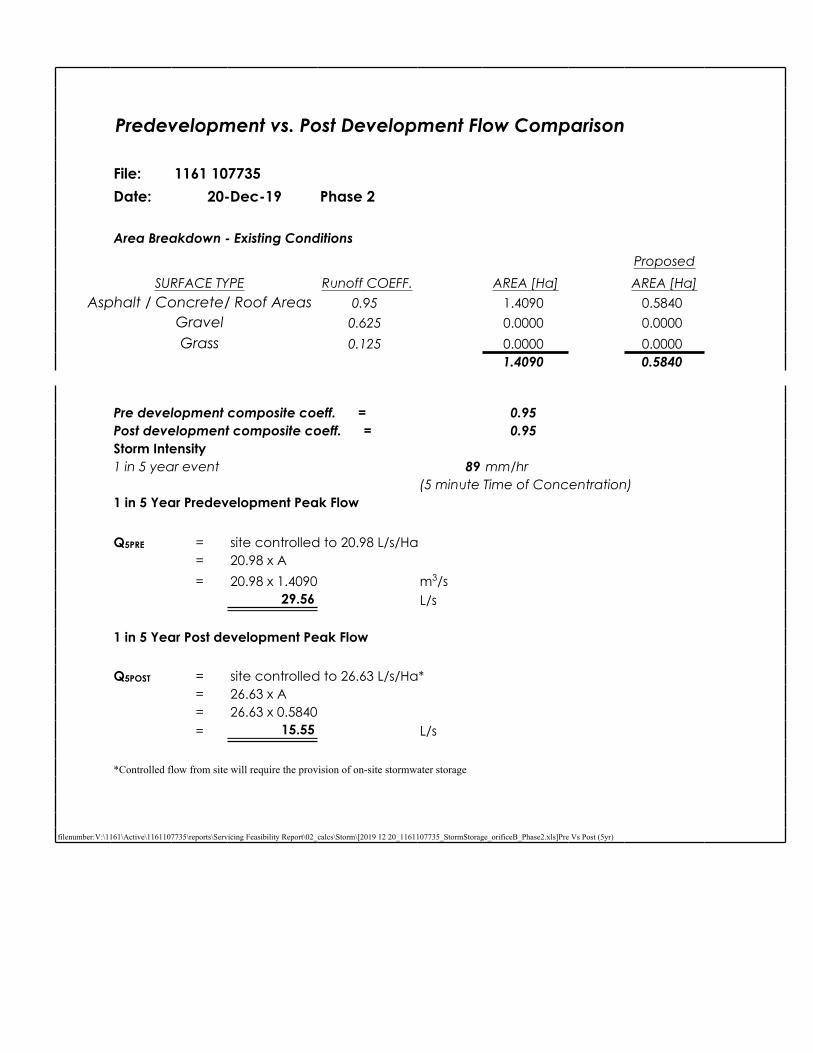
Predevelopment vs. Post Development Flow Comparison
File: 1161 107735 Date: 20-Dec-19 Phase 2
Area Breakdown - Existing Conditions
ProposedSURFACE TYPE Runoff COEFF. AREA [Ha] AREA [Ha]
Asphalt / Concrete/ Roof Areas 0.95 1.4090 0.5840Gravel 0.625 0.0000 0.0000Grass 0.125 0.0000 0.0000
1.4090 0.5840
Pre development composite coeff. = 0.95Post development composite coeff. = 0.95Storm Intensity1 in 5 year event 89 mm/hr
(5 minute Time of Concentration)1 in 5 Year Predevelopment Peak Flow
Q5PRE = site controlled to 20.98 L/s/Ha= 20.98 x A= 20.98 x 1.4090 m3/s
29.56 L/s
1 in 5 Year Post development Peak Flow
Q5POST = site controlled to 26.63 L/s/Ha*= 26.63 x A= 26.63 x 0.5840= 15.55 L/s
*Controlled flow from site will require the provision of on-site stormwater storage
filenumber:V:\1161\Active\1161107735\reports\Servicing Feasibility Report\02_calcs\Storm\[2019 12 20_1161107735_StormStorage_orificeB_Phase2.xls]Pre Vs Post (5yr)
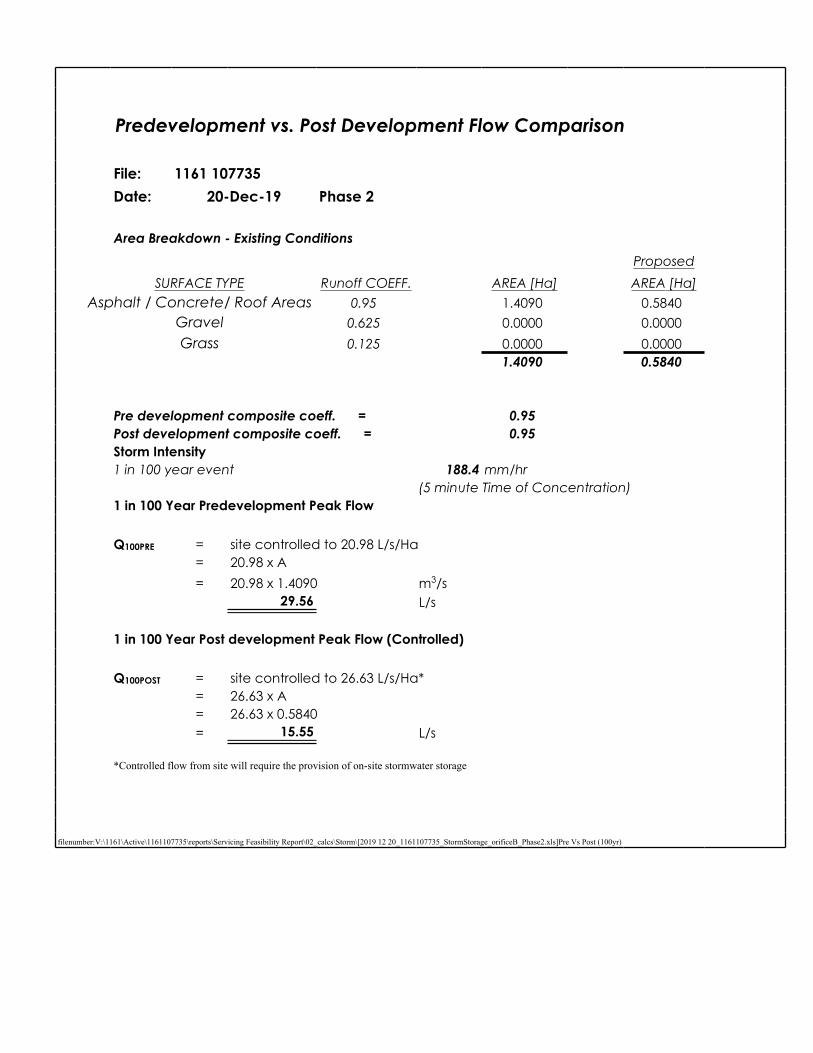
Predevelopment vs. Post Development Flow Comparison
File: 1161 107735 Date: 20-Dec-19 Phase 2
Area Breakdown - Existing Conditions
ProposedSURFACE TYPE Runoff COEFF. AREA [Ha] AREA [Ha]
Asphalt / Concrete/ Roof Areas 0.95 1.4090 0.5840Gravel 0.625 0.0000 0.0000Grass 0.125 0.0000 0.0000
1.4090 0.5840
Pre development composite coeff. = 0.95Post development composite coeff. = 0.95Storm Intensity1 in 100 year event 188.4 mm/hr
(5 minute Time of Concentration)1 in 100 Year Predevelopment Peak Flow
Q100PRE = site controlled to 20.98 L/s/Ha= 20.98 x A= 20.98 x 1.4090 m3/s
29.56 L/s
1 in 100 Year Post development Peak Flow (Controlled)
Q100POST = site controlled to 26.63 L/s/Ha*= 26.63 x A= 26.63 x 0.5840= 15.55 L/s
*Controlled flow from site will require the provision of on-site stormwater storage
filenumber:V:\1161\Active\1161107735\reports\Servicing Feasibility Report\02_calcs\Storm\[2019 12 20_1161107735_StormStorage_orificeB_Phase2.xls]Pre Vs Post (100yr)
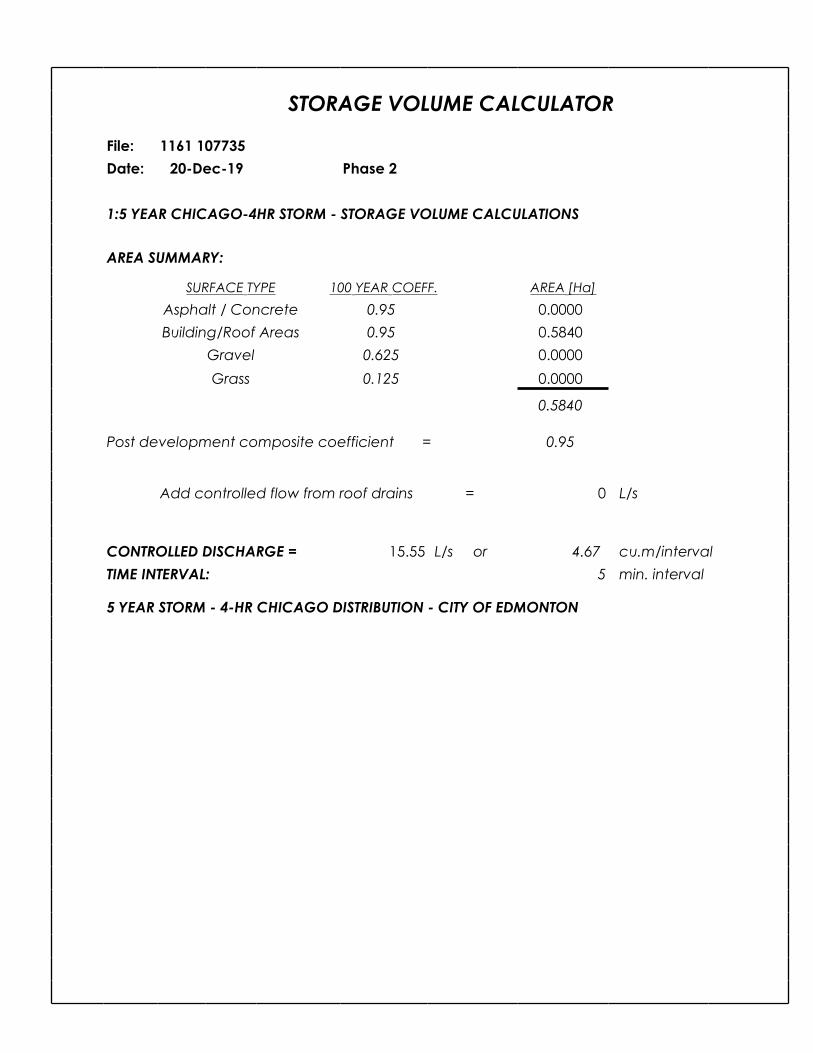
STORAGE VOLUME CALCULATOR
File: 1161 107735 Date: 20-Dec-19 Phase 2 1:5 YEAR CHICAGO-4HR STORM - STORAGE VOLUME CALCULATIONS
AREA SUMMARY:
SURFACE TYPE 100 YEAR COEFF. AREA [Ha]Asphalt / Concrete 0.95 0.0000Building/Roof Areas 0.95 0.5840
Gravel 0.625 0.0000Grass 0.125 0.0000
0.5840
Post development composite coefficient = 0.95
Add controlled flow from roof drains = 0 L/s
CONTROLLED DISCHARGE = 15.55 L/s or 4.67 cu.m/intervalTIME INTERVAL: 5 min. interval
5 YEAR STORM - 4-HR CHICAGO DISTRIBUTION - CITY OF EDMONTON
5 YEAR STORM - 4-HR CHICAGO DISTRIBUTION - CITY OF EDMONTONPOST POST
TIME RAIN DEV. DEV. ALLOW REQ.INTERVAL INTENSITY RUNOFF RUNOFF DISCH. STORAGE
(min) (mm/hr) (l/s) (cu.m) (cu.m) (cu.m)
0 5 0.00 0.00 0.00 0.00 0.00
5 10 2.52 3.88 1.17 1.17 0.00
10 15 2.65 4.08 1.23 1.23 0.00
15 20 2.80 4.32 1.29 1.29 0.00
20 25 2.98 4.59 1.38 1.38 0.00
25 30 3.18 4.90 1.47 1.47 0.00
30 35 3.42 5.27 1.58 1.58 0.00
35 40 3.70 5.70 1.71 1.71 0.00
40 45 4.04 6.23 1.87 1.87 0.00
45 50 4.47 6.89 2.07 2.07 0.00
50 55 5.03 7.75 2.33 2.33 0.00
55 60 5.77 8.89 2.67 2.67 0.00
60 65 6.83 10.53 3.16 3.16 0.00
65 70 8.47 13.05 3.92 3.92 0.00
70 75 11.37 17.52 5.26 4.67 0.59
75 80 18.13 27.94 8.38 4.67 3.72
80 85 65.15 100.41 30.12 4.67 25.46
85 90 65.15 100.41 30.12 4.67 25.46
90 95 32.56 50.18 15.05 4.67 10.39
95 100 20.82 32.09 9.63 4.67 4.96
100 105 15.44 23.80 7.14 4.67 2.47
105 110 12.37 19.07 5.72 4.67 1.05
110 115 10.38 16.00 4.80 4.67 0.13
115 120 8.98 13.84 4.15 4.15 0.00
120 125 7.95 12.25 3.68 3.68 0.00
125 130 7.15 11.02 3.31 3.31 0.00
130 135 6.51 10.03 3.01 3.01 0.00
135 140 5.99 9.23 2.77 2.77 0.00
140 145 5.55 8.55 2.57 2.57 0.00
145 150 5.19 8.00 2.40 2.40 0.00
150 155 4.87 7.51 2.25 2.25 0.00
155 160 4.60 7.09 2.13 2.13 0.00
160 165 4.35 6.70 2.01 2.01 0.00
165 170 4.14 6.38 1.91 1.91 0.00
170 175 3.95 6.09 1.83 1.83 0.00
175 180 3.78 5.83 1.75 1.75 0.00
180 185 3.62 5.58 1.67 1.67 0.00
185 190 3.48 5.36 1.61 1.61 0.00
190 195 3.35 5.16 1.55 1.55 0.00
195 200 3.23 4.98 1.49 1.49 0.00
200 205 3.12 4.81 1.44 1.44 0.00
205 210 3.02 4.65 1.40 1.40 0.00
210 215 2.93 4.52 1.35 1.35 0.00
215 220 2.84 4.38 1.31 1.31 0.00
220 225 2.76 4.25 1.28 1.28 0.00
225 230 2.69 4.15 1.24 1.24 0.00
230 235 2.62 4.04 1.21 1.21 0.00
235 240 2.55 3.93 1.18 1.18 0.00
240 245 2.49 3.84 1.15 1.15 0.00 REQUIRED STORAGE (cu.m) = 74.24
filenumber:V:\1161\Active\1161107735\reports\Servicing Feasibility Report\02_calcs\Storm\[2019 12 20_1161107735_StormStorage_orificeB_Phase2.xls]CHICAGO (5yr)
5 YEAR STORM - 4-HR CHICAGO DISTRIBUTION - CITY OF EDMONTON
STORAGE VOLUME CALCULATOR
File: 1161 107735 Date: 20-Dec-19 Phase 2 1:100 YEAR CHICAGO-4HR STORM - STORAGE VOLUME CALCULATIONS
AREA SUMMARY:
SURFACE TYPE 100 YEAR COEFF. AREA [Ha]Asphalt / Concrete 0.95 0.0000Building/Roof Areas 0.95 0.5840
Gravel 0.625 0.0000Grass 0.125 0.0000
0.5840
Post development composite coefficient = 0.95
Add controlled flow from roof drains = 0 L/s
CONTROLLED DISCHARGE = 15.55 L/s or 4.67 cu.m/intervalTIME INTERVAL: 5 min. interval
100 YEAR STORM - 4-HR CHICAGO DISTRIBUTION - CITY OF EDMONTON
100 YEAR STORM - 4-HR CHICAGO DISTRIBUTION - CITY OF EDMONTONPOST POST
TIME RAIN DEV. DEV. ALLOW REQ.INTERVAL INTENSITY RUNOFF RUNOFF DISCH. STORAGE
(min) (mm/hr) (l/s) (cu.m) (cu.m) (cu.m)
0 5 0.00 0.00 0.00 0.00 0.00
5 10 6.25 9.63 2.89 2.89 0.00
10 15 6.58 10.14 3.04 3.04 0.00
15 20 6.97 10.74 3.22 3.22 0.00
20 25 7.41 11.42 3.43 3.43 0.00
25 30 7.92 12.21 3.66 3.66 0.00
30 35 8.52 13.13 3.94 3.94 0.00
35 40 9.24 14.24 4.27 4.27 0.00
40 45 10.12 15.60 4.68 4.67 0.01
45 50 11.22 17.29 5.19 4.67 0.52
50 55 12.63 19.47 5.84 4.67 1.17
55 60 14.54 22.41 6.72 4.67 2.06
60 65 17.26 26.60 7.98 4.67 3.31
65 70 21.48 33.11 9.93 4.67 5.27
70 75 28.94 44.60 13.38 4.67 8.72
75 80 45.90 70.74 21.22 4.67 16.56
80 85 143.62 221.35 66.41 4.67 61.74
85 90 143.62 221.35 66.41 4.67 61.74
90 95 80.00 123.30 36.99 4.67 32.32
95 100 52.54 80.98 24.29 4.67 19.63
100 105 39.26 60.51 18.15 4.67 13.49
105 110 31.48 48.52 14.56 4.67 9.89
110 115 26.40 40.69 12.21 4.67 7.54
115 120 22.81 35.16 10.55 4.67 5.88
120 125 20.14 31.04 9.31 4.67 4.65
125 130 18.08 27.87 8.36 4.67 3.69
130 135 16.44 25.34 7.60 4.67 2.94
135 140 15.10 23.27 6.98 4.67 2.32
140 145 13.98 21.55 6.46 4.67 1.80
145 150 13.04 20.10 6.03 4.67 1.36
150 155 12.23 18.85 5.65 4.67 0.99
155 160 11.52 17.76 5.33 4.67 0.66
160 165 10.91 16.81 5.04 4.67 0.38
165 170 10.36 15.97 4.79 4.67 0.12

170 175 9.87 15.21 4.56 4.56 0.00
175 180 9.44 14.55 4.36 4.36 0.00
180 185 9.04 13.93 4.18 4.18 0.00
185 190 8.68 13.38 4.01 4.01 0.00
190 195 8.36 12.88 3.87 3.87 0.00
195 200 8.06 12.42 3.73 3.73 0.00
200 205 7.78 11.99 3.60 3.60 0.00
205 210 7.53 11.61 3.48 3.48 0.00
210 215 7.29 11.24 3.37 3.37 0.00
215 220 7.07 10.90 3.27 3.27 0.00
220 225 6.86 10.57 3.17 3.17 0.00
225 230 6.67 10.28 3.08 3.08 0.00
230 235 6.49 10.00 3.00 3.00 0.00
235 240 6.33 9.76 2.93 2.93 0.00
240 245 6.17 9.51 2.85 2.85 0.00
REQUIRED STORAGE (cu.m) = 268.76
filenumber:V:\1161\Active\1161107735\reports\Servicing Feasibility Report\02_calcs\Storm\[2019 12 20_1161107735_StormStorage_orificeB_Phase2.xls]CHICAGO(100yr)
100 YEAR STORM - 4-HR CHICAGO DISTRIBUTION - CITY OF EDMONTON

STORAGE VOLUME CALCULATOR
File: 1161-107735 Date: 20-Dec-19 Phase 2
1:100 YEAR HUFF STORAGE VOLUME CALCULATIONS
AREA SUMMARY:
SURFACE TYPE 100 YEAR COEFF. AREA [Ha]
Asphalt / Concrete 0.95 0.0000Building/Roof Areas 0.95 0.5840
Gravel 0.625 0.0000Grass 0.125 0.0000
0.5840
Post development composite coefficient = 0.95
Add controlled flow from roof drains = 0 L/s CONTROLLED DISCHARGE = 15.55 L/s or 14.00 cu.m/intervalTIME INTERVAL: 15 min. interval
100 YEAR STORM - HUFF DISTRIBUTION - CITY OF EDMONTON
100 YEAR STORM - HUFF DISTRIBUTION - CITY OF EDMONTONPOST POST
TIME RAIN DEV. DEV. ALLOW REQ.INTERVAL INTENSITY RUNOFF RUNOFF DISCH. STORAGE
(min) (mm/hr) (l/s) (cu.m) (cu.m) (cu.m)
0 to 15 0.000 0.00 0.00 0.00 0.00
15 30 1.03 1.59 1.43 1.43 0.00
30 45 2.07 3.19 2.87 2.87 0.00
45 60 3.10 4.78 4.30 4.30 0.00
60 75 4.14 6.38 5.74 5.74 0.00
75 90 5.51 8.49 7.64 7.64 0.00
90 105 8.26 12.73 11.46 11.46 0.00
105 120 11.00 16.95 15.26 14.00 1.26
120 135 13.74 21.18 19.06 14.00 5.06
135 150 16.48 25.40 22.86 14.00 8.86
150 165 18.33 28.25 25.43 14.00 11.43
165 180 18.84 29.04 26.13 14.00 12.14
180 195 19.34 29.81 26.83 14.00 12.83
195 210 19.85 30.59 27.53 14.00 13.54
210 225 20.35 31.36 28.23 14.00 14.23
225 240 20.04 30.89 27.80 14.00 13.80
240 255 19.17 29.55 26.59 14.00 12.59
255 270 18.30 28.20 25.38 14.00 11.39
270 285 17.44 26.88 24.19 14.00 10.19
285 300 16.57 25.54 22.98 14.00 8.99
300 315 15.72 24.23 21.81 14.00 7.81
315 330 14.88 22.93 20.64 14.00 6.64
330 345 14.04 21.64 19.48 14.00 5.48
345 360 13.20 20.34 18.31 14.00 4.31
360 375 12.36 19.05 17.14 14.00 3.15
375 390 11.59 17.86 16.08 14.00 2.08
390 405 10.82 16.68 15.01 14.00 1.01
405 420 10.05 15.49 13.94 13.94 0.00
420 435 9.28 14.30 12.87 12.87 0.00
435 450 8.56 13.19 11.87 11.87 0.00
450 465 8.03 12.38 11.14 11.14 0.00
465 480 7.50 11.56 10.40 10.40 0.00
480 495 6.97 10.74 9.67 9.67 0.00
495 510 6.44 9.93 8.93 8.93 0.00
510 525 6.03 9.29 8.36 8.36 0.00
525 540 5.82 8.97 8.07 8.07 0.00
540 555 5.60 8.63 7.77 7.77 0.00
555 570 5.38 8.29 7.46 7.46 0.00
570 585 5.17 7.97 7.17 7.17 0.00
585 600 4.95 7.63 6.87 6.87 0.00
600 615 4.73 7.29 6.56 6.56 0.00
615 630 4.52 6.97 6.27 6.27 0.00
630 645 4.30 6.63 5.96 5.96 0.00
645 660 4.09 6.30 5.67 5.67 0.00
660 675 3.89 6.00 5.40 5.40 0.00
675 690 3.70 5.70 5.13 5.13 0.00
690 705 3.50 5.39 4.85 4.85 0.00
705 720 3.31 5.10 4.59 4.59 0.00
720 735 3.12 4.81 4.33 4.33 0.00
735 750 3.02 4.65 4.19 4.19 0.00
750 765 2.93 4.52 4.06 4.06 0.00
765 780 2.83 4.36 3.93 3.93 0.00
780 795 2.73 4.21 3.79 3.79 0.00
795 810 2.63 4.05 3.65 3.65 0.00
810 825 2.51 3.87 3.48 3.48 0.00
825 840 2.39 3.68 3.32 3.32 0.00
840 855 2.27 3.50 3.15 3.15 0.00
855 870 2.15 3.31 2.98 2.98 0.00
870 885 2.07 3.19 2.87 2.87 0.00
885 900 2.04 3.14 2.83 2.83 0.00
900 915 2.02 3.11 2.80 2.80 0.00
915 930 2.00 3.08 2.77 2.77 0.00
930 945 1.97 3.04 2.73 2.73 0.00
945 960 1.95 3.01 2.70 2.70 0.00
960 975 1.92 2.96 2.66 2.66 0.00
975 990 1.90 2.93 2.64 2.64 0.00
990 1005 1.88 2.90 2.61 2.61 0.00
1005 1020 1.85 2.85 2.57 2.57 0.00
1020 1035 1.83 2.82 2.54 2.54 0.00
1035 1050 1.80 2.77 2.50 2.50 0.00
1050 1065 1.78 2.74 2.47 2.47 0.00
1065 1080 1.76 2.71 2.44 2.44 0.00
1080 1095 1.73 2.67 2.40 2.40 0.00
100 YEAR STORM - HUFF DISTRIBUTION - CITY OF EDMONTON

1095 1110 1.71 2.64 2.37 2.37 0.00
1110 1125 1.68 2.59 2.33 2.33 0.00
1125 1140 1.66 2.56 2.30 2.30 0.00
1140 1155 1.64 2.53 2.27 2.27 0.00
1155 1170 1.61 2.48 2.23 2.23 0.00
1170 1185 1.56 2.40 2.16 2.16 0.00
1185 1200 1.51 2.33 2.09 2.09 0.00
1200 1215 1.46 2.25 2.03 2.03 0.00
1215 1230 1.41 2.17 1.96 1.96 0.00
1230 1245 1.37 2.11 1.90 1.90 0.00
1245 1260 1.32 2.03 1.83 1.83 0.00
1260 1275 1.27 1.96 1.76 1.76 0.00
1275 1290 1.22 1.88 1.69 1.69 0.00
1290 1305 1.17 1.80 1.62 1.62 0.00
1305 1320 1.13 1.74 1.57 1.57 0.00
1320 1335 1.08 1.66 1.50 1.50 0.00
1335 1350 1.03 1.59 1.43 1.43 0.00
1350 1365 0.980 1.51 1.36 1.36 0.00
1365 1380 0.930 1.43 1.29 1.29 0.00
1380 1395 0.890 1.37 1.23 1.23 0.00
1395 1410 0.840 1.29 1.17 1.17 0.00
1410 1425 0.790 1.22 1.10 1.10 0.00
1425 1440 0.740 1.14 1.03 1.03 0.00
1440 1455 0.690 1.06 0.96 0.96 0.00 REQUIRED STORAGE (cu.m) = 166.80
filenumber:V:\1161\Active\1161107735\reports\Servicing Feasibility Report\02_calcs\Storm\[2019 12 20_1161107735_StormStorage_orificeB_Phase2.xls]HUFF
100 YEAR STORM - HUFF DISTRIBUTION - CITY OF EDMONTON

Project: Jasper GatesFile: 1161 107735Date: 12/20/2019 Phase 3 Design By: N. ErikssonChecked By:
STORAGE VOLUME CALCULATION SUMMARY
Basin Area 1.426 HaRunoff Coefficient 0.95Allowable Discharge Rate 26.63 L/s/Ha
Required Storage5 Year 4H Chicago 181.27 m³100 Year 4H Chicago 656.25 m³100 Year Huff 407.29 m³1937 Storm Storage 258.81 m³1978 Storm Storage 1,028.62 m³2004 Storm Storage 1,014.27 m³2012 Storm Storage 494.88 m³
filenumber:V:\1161\Active\1161107735\reports\Servicing Feasibility Report\02_calcs\Storm\[2019 12 20_1161107735_StormStorage_orificeC_Phase3.xls]Calc Summary
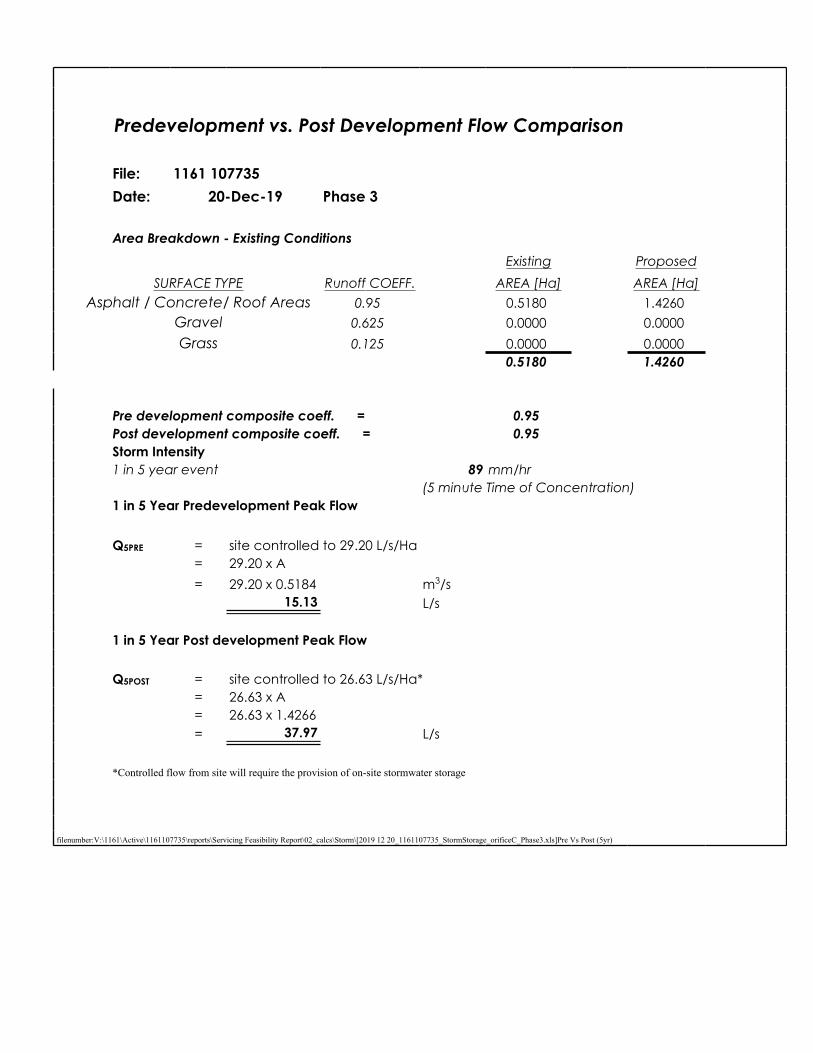
Predevelopment vs. Post Development Flow Comparison
File: 1161 107735 Date: 20-Dec-19 Phase 3
Area Breakdown - Existing Conditions
Existing ProposedSURFACE TYPE Runoff COEFF. AREA [Ha] AREA [Ha]
Asphalt / Concrete/ Roof Areas 0.95 0.5180 1.4260Gravel 0.625 0.0000 0.0000Grass 0.125 0.0000 0.0000
0.5180 1.4260
Pre development composite coeff. = 0.95Post development composite coeff. = 0.95Storm Intensity1 in 5 year event 89 mm/hr
(5 minute Time of Concentration)1 in 5 Year Predevelopment Peak Flow
Q5PRE = site controlled to 29.20 L/s/Ha= 29.20 x A= 29.20 x 0.5184 m3/s
15.13 L/s
1 in 5 Year Post development Peak Flow
Q5POST = site controlled to 26.63 L/s/Ha*= 26.63 x A= 26.63 x 1.4266= 37.97 L/s
*Controlled flow from site will require the provision of on-site stormwater storage
filenumber:V:\1161\Active\1161107735\reports\Servicing Feasibility Report\02_calcs\Storm\[2019 12 20_1161107735_StormStorage_orificeC_Phase3.xls]Pre Vs Post (5yr)

Predevelopment vs. Post Development Flow Comparison
File: 1161 107735 Date: 20-Dec-19 Phase 3
Area Breakdown - Existing Conditions
Existing ProposedSURFACE TYPE Runoff COEFF. AREA [Ha] AREA [Ha]
Asphalt / Concrete/ Roof Areas 0.95 0.5180 1.4260Gravel 0.625 0.0000 0.0000Grass 0.125 0.0000 0.0000
0.5180 1.4260
Pre development composite coeff. = 0.95Post development composite coeff. = 0.95Storm Intensity1 in 100 year event 188.4 mm/hr
(5 minute Time of Concentration)1 in 100 Year Predevelopment Peak Flow
Q100PRE = site controlled to 29.20 L/s/Ha= 29.20 x A= 29.20 x 0.5184 m3/s
15.13 L/s
1 in 100 Year Post development Peak Flow (Controlled)
Q100POST = site controlled to 26.63 L/s/Ha*= 26.63 x A= 26.63 x 1.4266= 37.97 L/s
*Controlled flow from site will require the provision of on-site stormwater storage
filenumber:V:\1161\Active\1161107735\reports\Servicing Feasibility Report\02_calcs\Storm\[2019 12 20_1161107735_StormStorage_orificeC_Phase3.xls]Pre Vs Post (100yr)
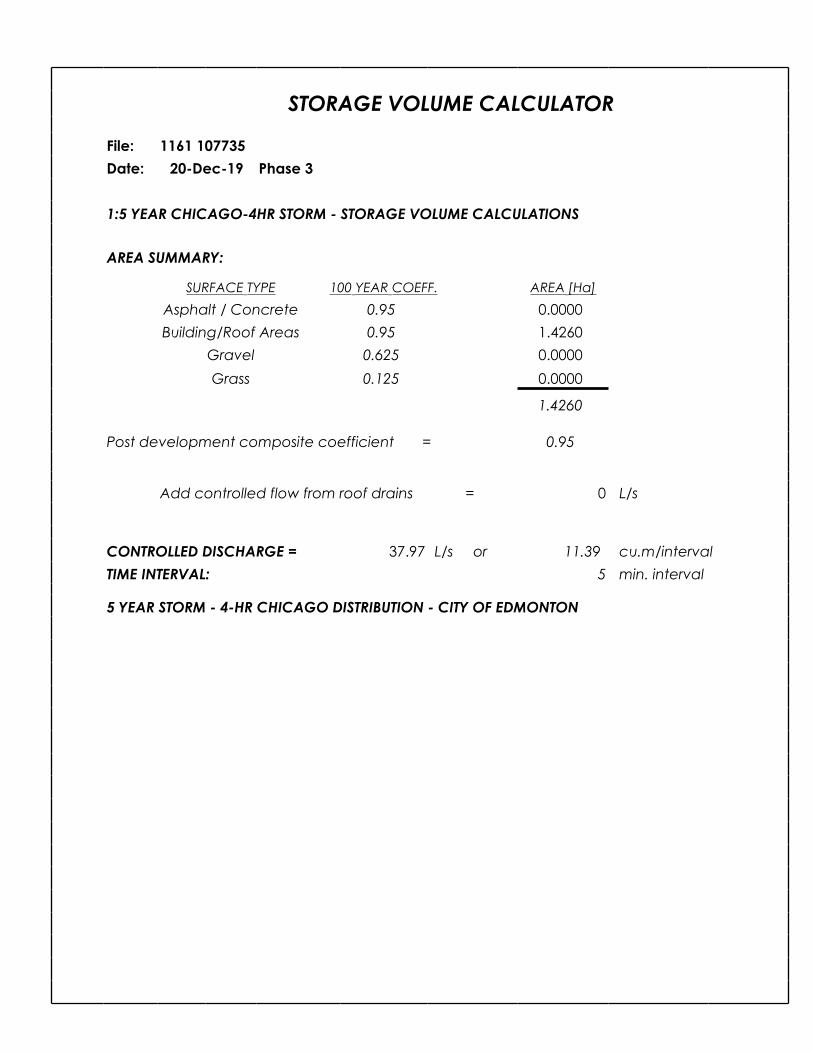
STORAGE VOLUME CALCULATOR
File: 1161 107735 Date: 20-Dec-19 Phase 3 1:5 YEAR CHICAGO-4HR STORM - STORAGE VOLUME CALCULATIONS
AREA SUMMARY:
SURFACE TYPE 100 YEAR COEFF. AREA [Ha]Asphalt / Concrete 0.95 0.0000Building/Roof Areas 0.95 1.4260
Gravel 0.625 0.0000Grass 0.125 0.0000
1.4260
Post development composite coefficient = 0.95
Add controlled flow from roof drains = 0 L/s
CONTROLLED DISCHARGE = 37.97 L/s or 11.39 cu.m/intervalTIME INTERVAL: 5 min. interval
5 YEAR STORM - 4-HR CHICAGO DISTRIBUTION - CITY OF EDMONTON
5 YEAR STORM - 4-HR CHICAGO DISTRIBUTION - CITY OF EDMONTONPOST POST
TIME RAIN DEV. DEV. ALLOW REQ.INTERVAL INTENSITY RUNOFF RUNOFF DISCH. STORAGE
(min) (mm/hr) (l/s) (cu.m) (cu.m) (cu.m)
0 5 0.00 0.00 0.00 0.00 0.00
5 10 2.52 9.48 2.85 2.85 0.00
10 15 2.65 9.97 2.99 2.99 0.00
15 20 2.80 10.54 3.16 3.16 0.00
20 25 2.98 11.21 3.36 3.36 0.00
25 30 3.18 11.97 3.59 3.59 0.00
30 35 3.42 12.87 3.86 3.86 0.00
35 40 3.70 13.92 4.18 4.18 0.00
40 45 4.04 15.20 4.56 4.56 0.00
45 50 4.47 16.82 5.05 5.05 0.00
50 55 5.03 18.93 5.68 5.68 0.00
55 60 5.77 21.71 6.51 6.51 0.00
60 65 6.83 25.70 7.71 7.71 0.00
65 70 8.47 31.88 9.56 9.56 0.00
70 75 11.37 42.79 12.84 11.39 1.44
75 80 18.13 68.23 20.47 11.39 9.08
80 85 65.15 245.18 73.55 11.39 62.16
85 90 65.15 245.18 73.55 11.39 62.16
90 95 32.56 122.53 36.76 11.39 25.37
95 100 20.82 78.35 23.51 11.39 12.11
100 105 15.44 58.11 17.43 11.39 6.04
105 110 12.37 46.55 13.97 11.39 2.57
110 115 10.38 39.06 11.72 11.39 0.33
115 120 8.98 33.79 10.14 10.14 0.00
120 125 7.95 29.92 8.98 8.98 0.00
125 130 7.15 26.91 8.07 8.07 0.00
130 135 6.51 24.50 7.35 7.35 0.00
135 140 5.99 22.54 6.76 6.76 0.00
140 145 5.55 20.89 6.27 6.27 0.00
145 150 5.19 19.53 5.86 5.86 0.00
150 155 4.87 18.33 5.50 5.50 0.00
155 160 4.60 17.31 5.19 5.19 0.00
160 165 4.35 16.37 4.91 4.91 0.00
165 170 4.14 15.58 4.67 4.67 0.00

170 175 3.95 14.87 4.46 4.46 0.00
175 180 3.78 14.23 4.27 4.27 0.00
180 185 3.62 13.62 4.09 4.09 0.00
185 190 3.48 13.10 3.93 3.93 0.00
190 195 3.35 12.61 3.78 3.78 0.00
195 200 3.23 12.16 3.65 3.65 0.00
200 205 3.12 11.74 3.52 3.52 0.00
205 210 3.02 11.37 3.41 3.41 0.00
210 215 2.93 11.03 3.31 3.31 0.00
215 220 2.84 10.69 3.21 3.21 0.00
220 225 2.76 10.39 3.12 3.12 0.00
225 230 2.69 10.12 3.04 3.04 0.00
230 235 2.62 9.86 2.96 2.96 0.00
235 240 2.55 9.60 2.88 2.88 0.00
240 245 2.49 9.37 2.81 2.81 0.00 REQUIRED STORAGE (cu.m) = 181.27
filenumber:V:\1161\Active\1161107735\reports\Servicing Feasibility Report\02_calcs\Storm\[2019 12 20_1161107735_StormStorage_orificeC_Phase3.xls]CHICAGO (5yr)
5 YEAR STORM - 4-HR CHICAGO DISTRIBUTION - CITY OF EDMONTON

STORAGE VOLUME CALCULATOR
File: 1161 107735 Date: 20-Dec-19 Phase 3 1:100 YEAR CHICAGO-4HR STORM - STORAGE VOLUME CALCULATIONS
AREA SUMMARY:
SURFACE TYPE 100 YEAR COEFF. AREA [Ha]Asphalt / Concrete 0.95 0.0000Building/Roof Areas 0.95 1.4260
Gravel 0.625 0.0000Grass 0.125 0.0000
1.4260
Post development composite coefficient = 0.95
Add controlled flow from roof drains = 0 L/s
CONTROLLED DISCHARGE = 37.97 L/s or 11.39 cu.m/intervalTIME INTERVAL: 5 min. interval
100 YEAR STORM - 4-HR CHICAGO DISTRIBUTION - CITY OF EDMONTON

100 YEAR STORM - 4-HR CHICAGO DISTRIBUTION - CITY OF EDMONTONPOST POST
TIME RAIN DEV. DEV. ALLOW REQ.INTERVAL INTENSITY RUNOFF RUNOFF DISCH. STORAGE
(min) (mm/hr) (l/s) (cu.m) (cu.m) (cu.m)
0 5 0.00 0.00 0.00 0.00 0.00
5 10 6.25 23.52 7.06 7.06 0.00
10 15 6.58 24.76 7.43 7.43 0.00
15 20 6.97 26.23 7.87 7.87 0.00
20 25 7.41 27.89 8.37 8.37 0.00
25 30 7.92 29.81 8.94 8.94 0.00
30 35 8.52 32.06 9.62 9.62 0.00
35 40 9.24 34.77 10.43 10.43 0.00
40 45 10.12 38.09 11.43 11.39 0.03
45 50 11.22 42.22 12.67 11.39 1.28
50 55 12.63 47.53 14.26 11.39 2.87
55 60 14.54 54.72 16.42 11.39 5.02
60 65 17.26 64.96 19.49 11.39 8.09
65 70 21.48 80.84 24.25 11.39 12.86
70 75 28.94 108.91 32.67 11.39 21.28
75 80 45.90 172.74 51.82 11.39 40.43
80 85 143.62 540.49 162.15 11.39 150.76
85 90 143.62 540.49 162.15 11.39 150.76
90 95 80.00 301.07 90.32 11.39 78.93
95 100 52.54 197.73 59.32 11.39 47.93
100 105 39.26 147.75 44.32 11.39 32.93
105 110 31.48 118.47 35.54 11.39 24.15
110 115 26.40 99.35 29.81 11.39 18.41
115 120 22.81 85.84 25.75 11.39 14.36
120 125 20.14 75.79 22.74 11.39 11.35
125 130 18.08 68.04 20.41 11.39 9.02
130 135 16.44 61.87 18.56 11.39 7.17
135 140 15.10 56.83 17.05 11.39 5.66
140 145 13.98 52.61 15.78 11.39 4.39
145 150 13.04 49.07 14.72 11.39 3.33
150 155 12.23 46.03 13.81 11.39 2.42
155 160 11.52 43.35 13.01 11.39 1.61
160 165 10.91 41.06 12.32 11.39 0.93
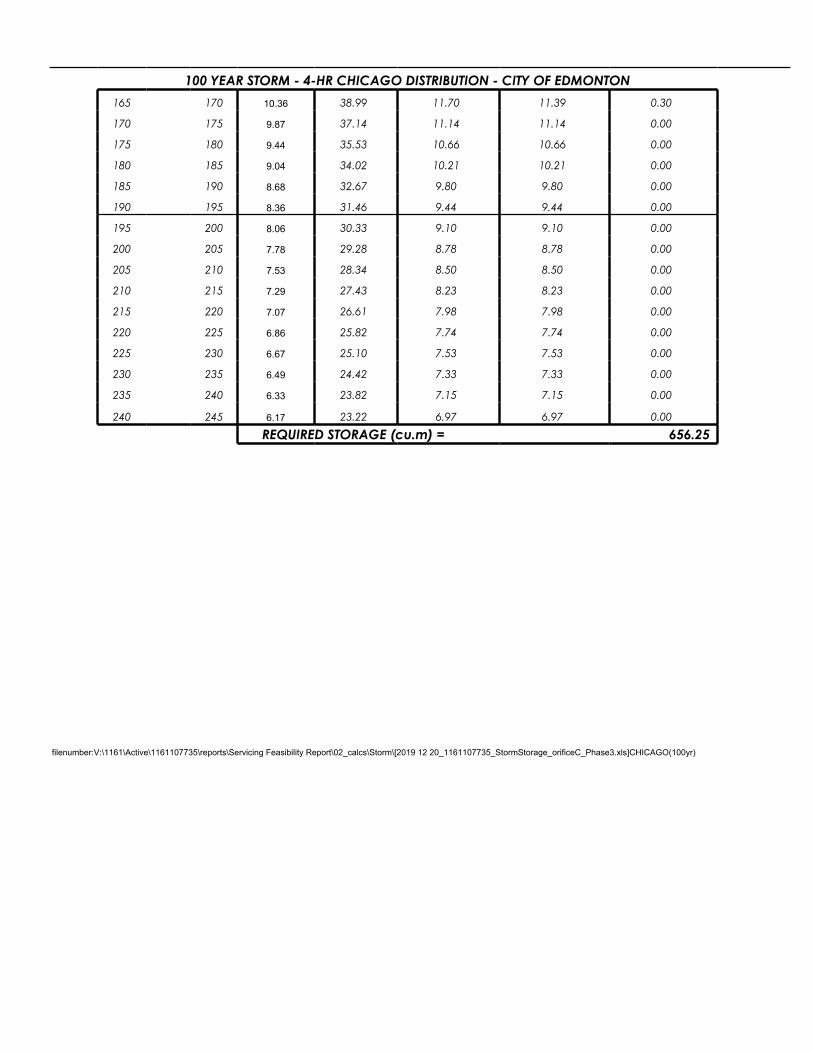
165 170 10.36 38.99 11.70 11.39 0.30
170 175 9.87 37.14 11.14 11.14 0.00
175 180 9.44 35.53 10.66 10.66 0.00
180 185 9.04 34.02 10.21 10.21 0.00
185 190 8.68 32.67 9.80 9.80 0.00
190 195 8.36 31.46 9.44 9.44 0.00
195 200 8.06 30.33 9.10 9.10 0.00
200 205 7.78 29.28 8.78 8.78 0.00
205 210 7.53 28.34 8.50 8.50 0.00
210 215 7.29 27.43 8.23 8.23 0.00
215 220 7.07 26.61 7.98 7.98 0.00
220 225 6.86 25.82 7.74 7.74 0.00
225 230 6.67 25.10 7.53 7.53 0.00
230 235 6.49 24.42 7.33 7.33 0.00
235 240 6.33 23.82 7.15 7.15 0.00
240 245 6.17 23.22 6.97 6.97 0.00
REQUIRED STORAGE (cu.m) = 656.25
filenumber:V:\1161\Active\1161107735\reports\Servicing Feasibility Report\02_calcs\Storm\[2019 12 20_1161107735_StormStorage_orificeC_Phase3.xls]CHICAGO(100yr)
100 YEAR STORM - 4-HR CHICAGO DISTRIBUTION - CITY OF EDMONTON

STORAGE VOLUME CALCULATOR
File: 1161-107735 Date: 20-Dec-19 Phase 3
1:100 YEAR HUFF STORAGE VOLUME CALCULATIONS
AREA SUMMARY:
SURFACE TYPE 100 YEAR COEFF. AREA [Ha]
Asphalt / Concrete 0.95 0.0000Building/Roof Areas 0.95 1.4260
Gravel 0.625 0.0000Grass 0.125 0.0000
1.4260
Post development composite coefficient = 0.95
Add controlled flow from roof drains = 0 L/s CONTROLLED DISCHARGE = 37.97 L/s or 34.18 cu.m/intervalTIME INTERVAL: 15 min. interval
100 YEAR STORM - HUFF DISTRIBUTION - CITY OF EDMONTON

100 YEAR STORM - HUFF DISTRIBUTION - CITY OF EDMONTONPOST POST
TIME RAIN DEV. DEV. ALLOW REQ.INTERVAL INTENSITY RUNOFF RUNOFF DISCH. STORAGE
(min) (mm/hr) (l/s) (cu.m) (cu.m) (cu.m)
0 to 15 0.000 0.00 0.00 0.00 0.00
15 30 1.03 3.88 3.49 3.49 0.00
30 45 2.07 7.79 7.01 7.01 0.00
45 60 3.10 11.67 10.50 10.50 0.00
60 75 4.14 15.58 14.02 14.02 0.00
75 90 5.51 20.74 18.66 18.66 0.00
90 105 8.26 31.09 27.98 27.98 0.00
105 120 11.00 41.40 37.26 34.18 3.08
120 135 13.74 51.71 46.54 34.18 12.36
135 150 16.48 62.02 55.82 34.18 21.64
150 165 18.33 68.98 62.08 34.18 27.91
165 180 18.84 70.90 63.81 34.18 29.63
180 195 19.34 72.78 65.50 34.18 31.33
195 210 19.85 74.70 67.23 34.18 33.06
210 225 20.35 76.58 68.93 34.18 34.75
225 240 20.04 75.42 67.88 34.18 33.70
240 255 19.17 72.14 64.93 34.18 30.75
255 270 18.30 68.87 61.98 34.18 27.81
270 285 17.44 65.63 59.07 34.18 24.89
285 300 16.57 62.36 56.12 34.18 21.95
300 315 15.72 59.16 53.24 34.18 19.07
315 330 14.88 56.00 50.40 34.18 16.22
330 345 14.04 52.84 47.55 34.18 13.38
345 360 13.20 49.68 44.71 34.18 10.53
360 375 12.36 46.52 41.86 34.18 7.69
375 390 11.59 43.62 39.26 34.18 5.08
390 405 10.82 40.72 36.65 34.18 2.47
405 420 10.05 37.82 34.04 34.04 0.00
420 435 9.28 34.92 31.43 31.43 0.00
435 450 8.56 32.21 28.99 28.99 0.00
450 465 8.03 30.22 27.20 27.20 0.00
465 480 7.50 28.23 25.40 25.40 0.00
480 495 6.97 26.23 23.61 23.61 0.00
495 510 6.44 24.24 21.81 21.81 0.00
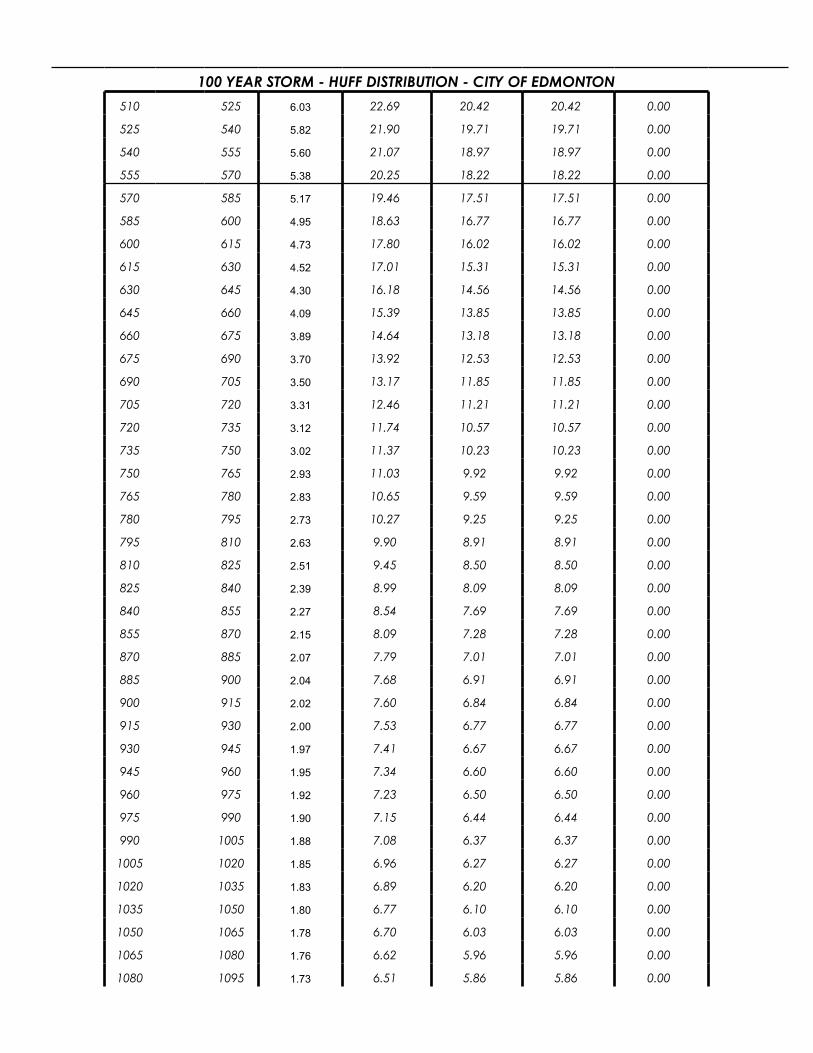
510 525 6.03 22.69 20.42 20.42 0.00
525 540 5.82 21.90 19.71 19.71 0.00
540 555 5.60 21.07 18.97 18.97 0.00
555 570 5.38 20.25 18.22 18.22 0.00
570 585 5.17 19.46 17.51 17.51 0.00
585 600 4.95 18.63 16.77 16.77 0.00
600 615 4.73 17.80 16.02 16.02 0.00
615 630 4.52 17.01 15.31 15.31 0.00
630 645 4.30 16.18 14.56 14.56 0.00
645 660 4.09 15.39 13.85 13.85 0.00
660 675 3.89 14.64 13.18 13.18 0.00
675 690 3.70 13.92 12.53 12.53 0.00
690 705 3.50 13.17 11.85 11.85 0.00
705 720 3.31 12.46 11.21 11.21 0.00
720 735 3.12 11.74 10.57 10.57 0.00
735 750 3.02 11.37 10.23 10.23 0.00
750 765 2.93 11.03 9.92 9.92 0.00
765 780 2.83 10.65 9.59 9.59 0.00
780 795 2.73 10.27 9.25 9.25 0.00
795 810 2.63 9.90 8.91 8.91 0.00
810 825 2.51 9.45 8.50 8.50 0.00
825 840 2.39 8.99 8.09 8.09 0.00
840 855 2.27 8.54 7.69 7.69 0.00
855 870 2.15 8.09 7.28 7.28 0.00
870 885 2.07 7.79 7.01 7.01 0.00
885 900 2.04 7.68 6.91 6.91 0.00
900 915 2.02 7.60 6.84 6.84 0.00
915 930 2.00 7.53 6.77 6.77 0.00
930 945 1.97 7.41 6.67 6.67 0.00
945 960 1.95 7.34 6.60 6.60 0.00
960 975 1.92 7.23 6.50 6.50 0.00
975 990 1.90 7.15 6.44 6.44 0.00
990 1005 1.88 7.08 6.37 6.37 0.00
1005 1020 1.85 6.96 6.27 6.27 0.00
1020 1035 1.83 6.89 6.20 6.20 0.00
1035 1050 1.80 6.77 6.10 6.10 0.00
1050 1065 1.78 6.70 6.03 6.03 0.00
1065 1080 1.76 6.62 5.96 5.96 0.00
1080 1095 1.73 6.51 5.86 5.86 0.00
100 YEAR STORM - HUFF DISTRIBUTION - CITY OF EDMONTON
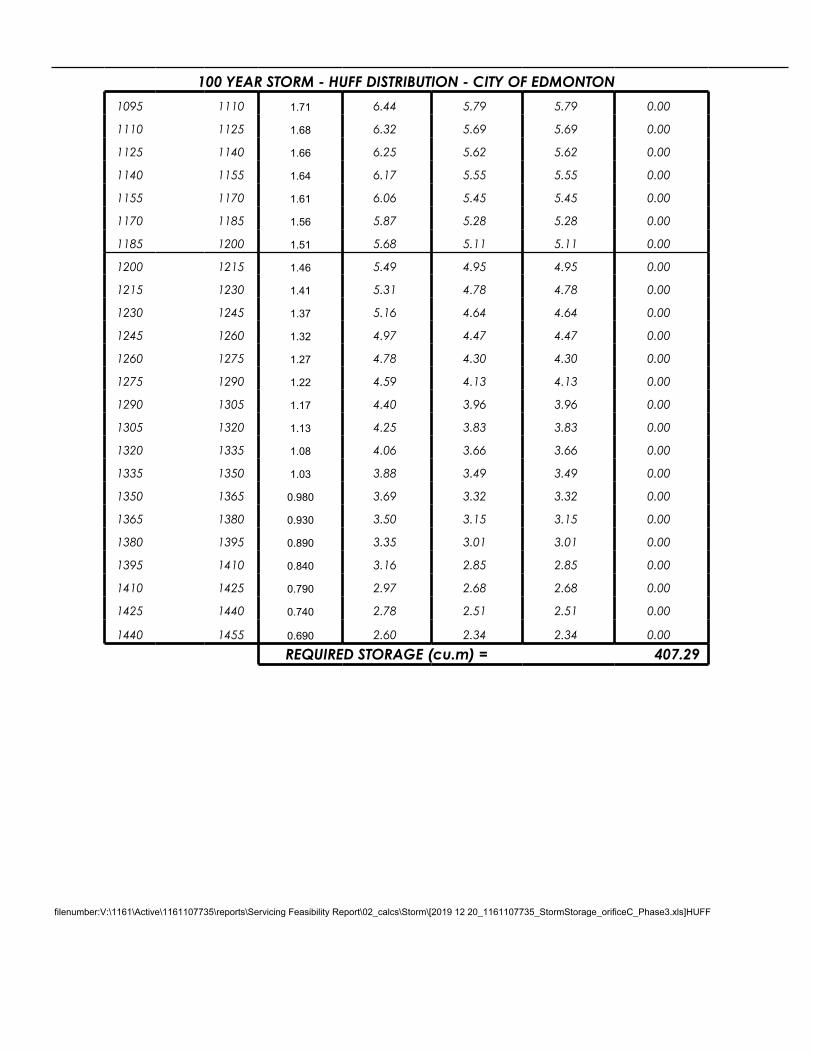
1095 1110 1.71 6.44 5.79 5.79 0.00
1110 1125 1.68 6.32 5.69 5.69 0.00
1125 1140 1.66 6.25 5.62 5.62 0.00
1140 1155 1.64 6.17 5.55 5.55 0.00
1155 1170 1.61 6.06 5.45 5.45 0.00
1170 1185 1.56 5.87 5.28 5.28 0.00
1185 1200 1.51 5.68 5.11 5.11 0.00
1200 1215 1.46 5.49 4.95 4.95 0.00
1215 1230 1.41 5.31 4.78 4.78 0.00
1230 1245 1.37 5.16 4.64 4.64 0.00
1245 1260 1.32 4.97 4.47 4.47 0.00
1260 1275 1.27 4.78 4.30 4.30 0.00
1275 1290 1.22 4.59 4.13 4.13 0.00
1290 1305 1.17 4.40 3.96 3.96 0.00
1305 1320 1.13 4.25 3.83 3.83 0.00
1320 1335 1.08 4.06 3.66 3.66 0.00
1335 1350 1.03 3.88 3.49 3.49 0.00
1350 1365 0.980 3.69 3.32 3.32 0.00
1365 1380 0.930 3.50 3.15 3.15 0.00
1380 1395 0.890 3.35 3.01 3.01 0.00
1395 1410 0.840 3.16 2.85 2.85 0.00
1410 1425 0.790 2.97 2.68 2.68 0.00
1425 1440 0.740 2.78 2.51 2.51 0.00
1440 1455 0.690 2.60 2.34 2.34 0.00 REQUIRED STORAGE (cu.m) = 407.29
filenumber:V:\1161\Active\1161107735\reports\Servicing Feasibility Report\02_calcs\Storm\[2019 12 20_1161107735_StormStorage_orificeC_Phase3.xls]HUFF
100 YEAR STORM - HUFF DISTRIBUTION - CITY OF EDMONTON
Project: Jasper GatesFile: 1161 107735Date: 12/20/2019 Phase 4 Design By: N. ErikssonChecked By:
STORAGE VOLUME CALCULATION SUMMARY
Basin Area 0.774 HaRunoff Coefficient 0.95Allowable Discharge Rate 26.63 L/s/Ha
Required Storage5 Year 4H Chicago 98.39 m³100 Year 4H Chicago 356.20 m³100 Year Huff 221.06 m³1937 Storm Storage 140.48 m³1978 Storm Storage 558.31 m³2004 Storm Storage 550.52 m³2012 Storm Storage 268.61 m³
filenumber:V:\1161\Active\1161107735\reports\Servicing Feasibility Report\02_calcs\Storm\[2019 12 20_1161107735_StormStorage_orificeD_Phase4.xls]Calc Summary

Predevelopment vs. Post Development Flow Comparison
File: 1161 107735 Date: 20-Dec-19 Phase 4
Area Breakdown - Existing Conditions
ProposedSURFACE TYPE Runoff COEFF. AREA [Ha] AREA [Ha]
Asphalt / Concrete/ Roof Areas 0.95 1.4470 0.7740Gravel 0.625 0.0000 0.0000Grass 0.125 0.0000 0.0000
1.4470 0.7740
Pre development composite coeff. = 0.95Post development composite coeff. = 0.95Storm Intensity1 in 5 year event 89 mm/hr
(5 minute Time of Concentration)1 in 5 Year Predevelopment Peak Flow
Q5PRE = site controlled to 27.40 L/s/Ha= 27.40 x A= 27.40 x 1.4471 m3/s
39.65 L/s
1 in 5 Year Post development Peak Flow
Q5POST = site controlled to 26.63 L/s/Ha*= 26.63 x A= 26.63 x 0.7739= 20.61 L/s
*Controlled flow from site will require the provision of on-site stormwater storage
filenumber:V:\1161\Active\1161107735\reports\Servicing Feasibility Report\02_calcs\Storm\[2019 12 20_1161107735_StormStorage_orificeD_Phase4.xls]Pre Vs Post (5yr)
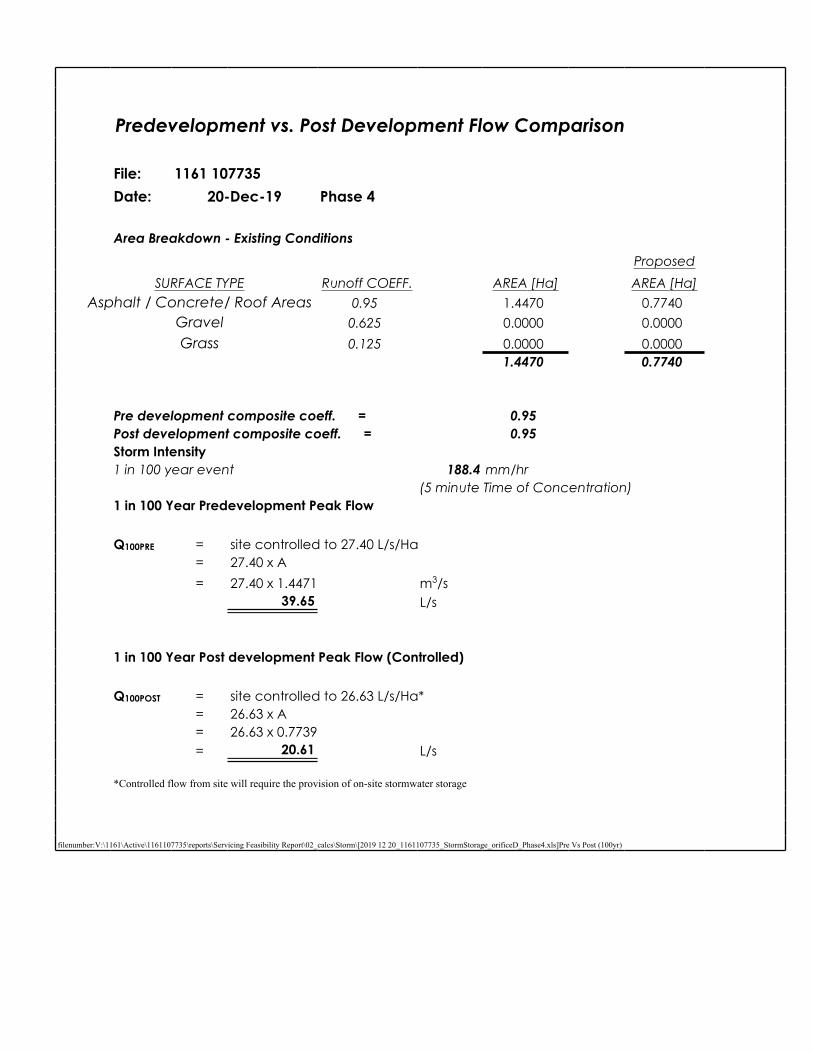
Predevelopment vs. Post Development Flow Comparison
File: 1161 107735 Date: 20-Dec-19 Phase 4
Area Breakdown - Existing Conditions
ProposedSURFACE TYPE Runoff COEFF. AREA [Ha] AREA [Ha]
Asphalt / Concrete/ Roof Areas 0.95 1.4470 0.7740Gravel 0.625 0.0000 0.0000Grass 0.125 0.0000 0.0000
1.4470 0.7740
Pre development composite coeff. = 0.95Post development composite coeff. = 0.95Storm Intensity1 in 100 year event 188.4 mm/hr
(5 minute Time of Concentration)1 in 100 Year Predevelopment Peak Flow
Q100PRE = site controlled to 27.40 L/s/Ha= 27.40 x A= 27.40 x 1.4471 m3/s
39.65 L/s
1 in 100 Year Post development Peak Flow (Controlled)
Q100POST = site controlled to 26.63 L/s/Ha*= 26.63 x A= 26.63 x 0.7739= 20.61 L/s
*Controlled flow from site will require the provision of on-site stormwater storage
filenumber:V:\1161\Active\1161107735\reports\Servicing Feasibility Report\02_calcs\Storm\[2019 12 20_1161107735_StormStorage_orificeD_Phase4.xls]Pre Vs Post (100yr)

STORAGE VOLUME CALCULATOR
File: 1161 107735 Date: 20-Dec-19 Phase 4 1:5 YEAR CHICAGO-4HR STORM - STORAGE VOLUME CALCULATIONS
AREA SUMMARY:
SURFACE TYPE 100 YEAR COEFF. AREA [Ha]Asphalt / Concrete 0.95 0.0000Building/Roof Areas 0.95 0.7740
Gravel 0.625 0.0000Grass 0.125 0.0000
0.7740
Post development composite coefficient = 0.95
Add controlled flow from roof drains = 0 L/s
CONTROLLED DISCHARGE = 20.61 L/s or 6.18 cu.m/intervalTIME INTERVAL: 5 min. interval
5 YEAR STORM - 4-HR CHICAGO DISTRIBUTION - CITY OF EDMONTON
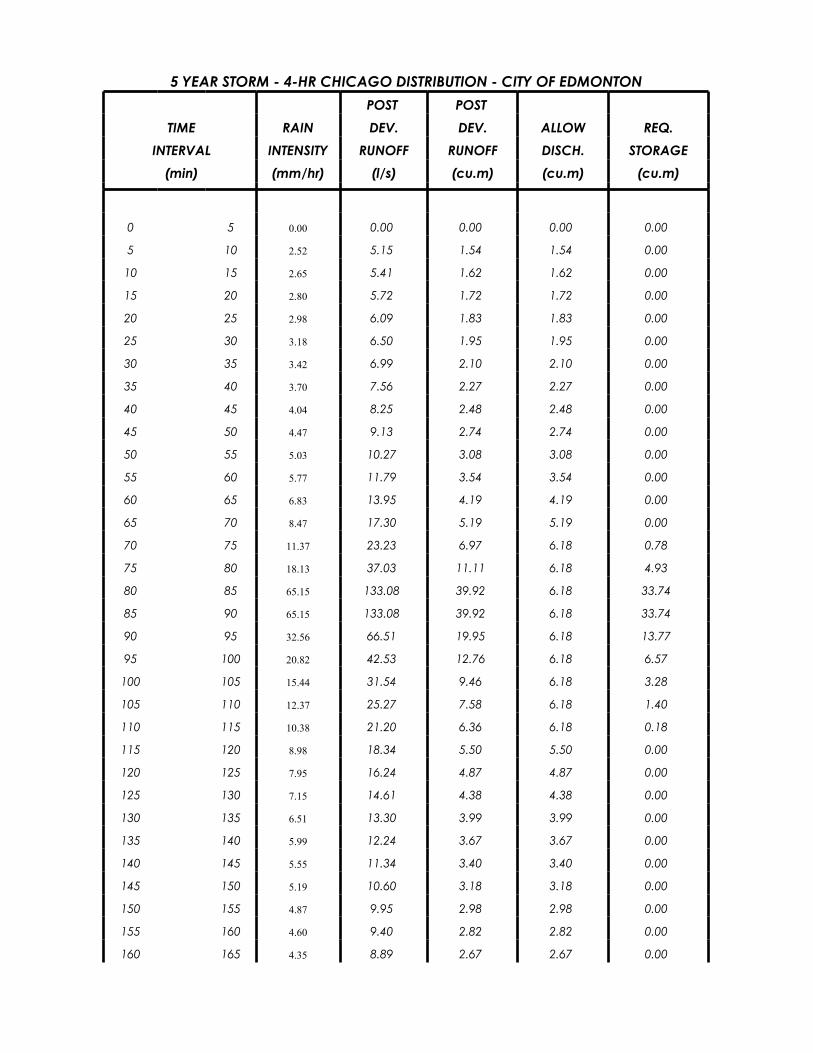
5 YEAR STORM - 4-HR CHICAGO DISTRIBUTION - CITY OF EDMONTONPOST POST
TIME RAIN DEV. DEV. ALLOW REQ.INTERVAL INTENSITY RUNOFF RUNOFF DISCH. STORAGE
(min) (mm/hr) (l/s) (cu.m) (cu.m) (cu.m)
0 5 0.00 0.00 0.00 0.00 0.00
5 10 2.52 5.15 1.54 1.54 0.00
10 15 2.65 5.41 1.62 1.62 0.00
15 20 2.80 5.72 1.72 1.72 0.00
20 25 2.98 6.09 1.83 1.83 0.00
25 30 3.18 6.50 1.95 1.95 0.00
30 35 3.42 6.99 2.10 2.10 0.00
35 40 3.70 7.56 2.27 2.27 0.00
40 45 4.04 8.25 2.48 2.48 0.00
45 50 4.47 9.13 2.74 2.74 0.00
50 55 5.03 10.27 3.08 3.08 0.00
55 60 5.77 11.79 3.54 3.54 0.00
60 65 6.83 13.95 4.19 4.19 0.00
65 70 8.47 17.30 5.19 5.19 0.00
70 75 11.37 23.23 6.97 6.18 0.78
75 80 18.13 37.03 11.11 6.18 4.93
80 85 65.15 133.08 39.92 6.18 33.74
85 90 65.15 133.08 39.92 6.18 33.74
90 95 32.56 66.51 19.95 6.18 13.77
95 100 20.82 42.53 12.76 6.18 6.57
100 105 15.44 31.54 9.46 6.18 3.28
105 110 12.37 25.27 7.58 6.18 1.40
110 115 10.38 21.20 6.36 6.18 0.18
115 120 8.98 18.34 5.50 5.50 0.00
120 125 7.95 16.24 4.87 4.87 0.00
125 130 7.15 14.61 4.38 4.38 0.00
130 135 6.51 13.30 3.99 3.99 0.00
135 140 5.99 12.24 3.67 3.67 0.00
140 145 5.55 11.34 3.40 3.40 0.00
145 150 5.19 10.60 3.18 3.18 0.00
150 155 4.87 9.95 2.98 2.98 0.00
155 160 4.60 9.40 2.82 2.82 0.00
160 165 4.35 8.89 2.67 2.67 0.00

165 170 4.14 8.46 2.54 2.54 0.00
170 175 3.95 8.07 2.42 2.42 0.00
175 180 3.78 7.72 2.32 2.32 0.00
180 185 3.62 7.39 2.22 2.22 0.00
185 190 3.48 7.11 2.13 2.13 0.00
190 195 3.35 6.84 2.05 2.05 0.00
195 200 3.23 6.60 1.98 1.98 0.00
200 205 3.12 6.37 1.91 1.91 0.00
205 210 3.02 6.17 1.85 1.85 0.00
210 215 2.93 5.99 1.80 1.80 0.00
215 220 2.84 5.80 1.74 1.74 0.00
220 225 2.76 5.64 1.69 1.69 0.00
225 230 2.69 5.49 1.65 1.65 0.00
230 235 2.62 5.35 1.61 1.61 0.00
235 240 2.55 5.21 1.56 1.56 0.00
240 245 2.49 5.09 1.53 1.53 0.00 REQUIRED STORAGE (cu.m) = 98.39
filenumber:V:\1161\Active\1161107735\reports\Servicing Feasibility Report\02_calcs\Storm\[2019 12 20_1161107735_StormStorage_orificeD_Phase4.xls]CHICAGO (5yr)
5 YEAR STORM - 4-HR CHICAGO DISTRIBUTION - CITY OF EDMONTON

STORAGE VOLUME CALCULATOR
File: 1161 107735 Date: 20-Dec-19 Phase 4 1:100 YEAR CHICAGO-4HR STORM - STORAGE VOLUME CALCULATIONS
AREA SUMMARY:
SURFACE TYPE 100 YEAR COEFF. AREA [Ha]Asphalt / Concrete 0.95 0.0000Building/Roof Areas 0.95 0.7740
Gravel 0.625 0.0000Grass 0.125 0.0000
0.7740
Post development composite coefficient = 0.95
Add controlled flow from roof drains = 0 L/s
CONTROLLED DISCHARGE = 20.61 L/s or 6.18 cu.m/intervalTIME INTERVAL: 5 min. interval
100 YEAR STORM - 4-HR CHICAGO DISTRIBUTION - CITY OF EDMONTON
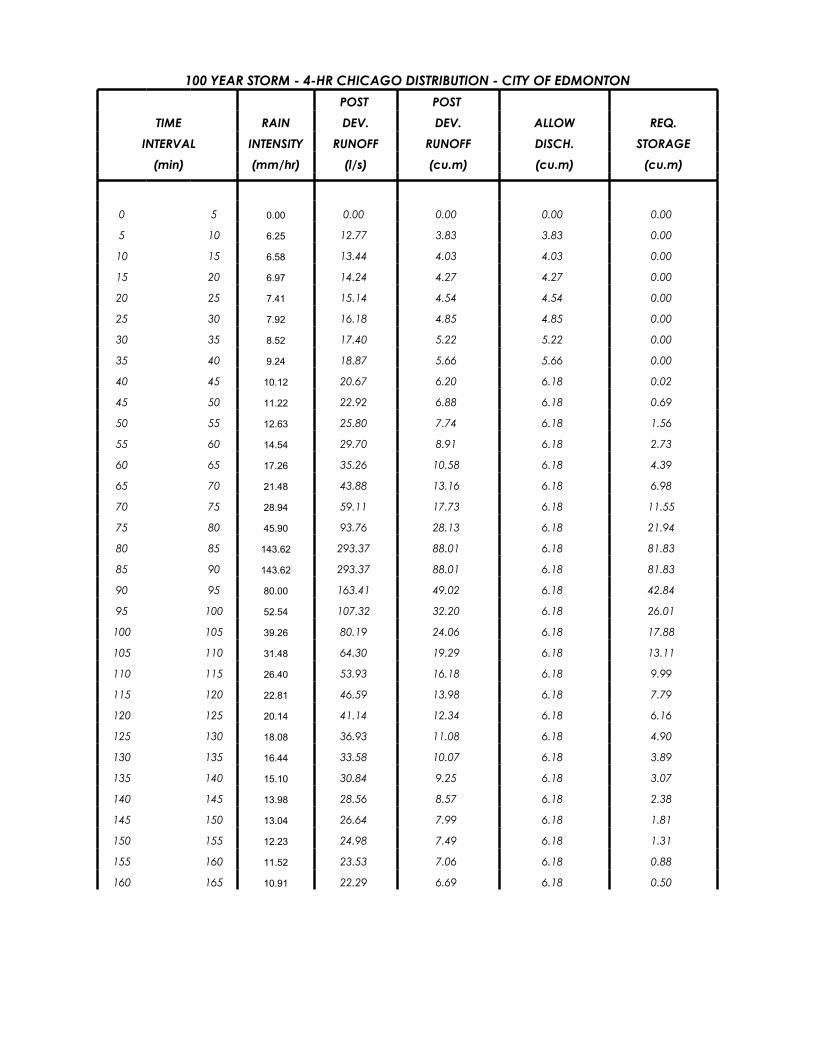
100 YEAR STORM - 4-HR CHICAGO DISTRIBUTION - CITY OF EDMONTONPOST POST
TIME RAIN DEV. DEV. ALLOW REQ.INTERVAL INTENSITY RUNOFF RUNOFF DISCH. STORAGE
(min) (mm/hr) (l/s) (cu.m) (cu.m) (cu.m)
0 5 0.00 0.00 0.00 0.00 0.00
5 10 6.25 12.77 3.83 3.83 0.00
10 15 6.58 13.44 4.03 4.03 0.00
15 20 6.97 14.24 4.27 4.27 0.00
20 25 7.41 15.14 4.54 4.54 0.00
25 30 7.92 16.18 4.85 4.85 0.00
30 35 8.52 17.40 5.22 5.22 0.00
35 40 9.24 18.87 5.66 5.66 0.00
40 45 10.12 20.67 6.20 6.18 0.02
45 50 11.22 22.92 6.88 6.18 0.69
50 55 12.63 25.80 7.74 6.18 1.56
55 60 14.54 29.70 8.91 6.18 2.73
60 65 17.26 35.26 10.58 6.18 4.39
65 70 21.48 43.88 13.16 6.18 6.98
70 75 28.94 59.11 17.73 6.18 11.55
75 80 45.90 93.76 28.13 6.18 21.94
80 85 143.62 293.37 88.01 6.18 81.83
85 90 143.62 293.37 88.01 6.18 81.83
90 95 80.00 163.41 49.02 6.18 42.84
95 100 52.54 107.32 32.20 6.18 26.01
100 105 39.26 80.19 24.06 6.18 17.88
105 110 31.48 64.30 19.29 6.18 13.11
110 115 26.40 53.93 16.18 6.18 9.99
115 120 22.81 46.59 13.98 6.18 7.79
120 125 20.14 41.14 12.34 6.18 6.16
125 130 18.08 36.93 11.08 6.18 4.90
130 135 16.44 33.58 10.07 6.18 3.89
135 140 15.10 30.84 9.25 6.18 3.07
140 145 13.98 28.56 8.57 6.18 2.38
145 150 13.04 26.64 7.99 6.18 1.81
150 155 12.23 24.98 7.49 6.18 1.31
155 160 11.52 23.53 7.06 6.18 0.88
160 165 10.91 22.29 6.69 6.18 0.50

165 170 10.36 21.16 6.35 6.18 0.17
170 175 9.87 20.16 6.05 6.05 0.00
175 180 9.44 19.28 5.78 5.78 0.00
180 185 9.04 18.47 5.54 5.54 0.00
185 190 8.68 17.73 5.32 5.32 0.00
190 195 8.36 17.08 5.12 5.12 0.00
195 200 8.06 16.46 4.94 4.94 0.00
200 205 7.78 15.89 4.77 4.77 0.00
205 210 7.53 15.38 4.61 4.61 0.00
210 215 7.29 14.89 4.47 4.47 0.00
215 220 7.07 14.44 4.33 4.33 0.00
220 225 6.86 14.01 4.20 4.20 0.00
225 230 6.67 13.62 4.09 4.09 0.00
230 235 6.49 13.26 3.98 3.98 0.00
235 240 6.33 12.93 3.88 3.88 0.00
240 245 6.17 12.60 3.78 3.78 0.00
REQUIRED STORAGE (cu.m) = 356.20
filenumber:V:\1161\Active\1161107735\reports\Servicing Feasibility Report\02_calcs\Storm\[2019 12 20_1161107735_StormStorage_orificeD_Phase4.xls]CHICAGO(100yr)
100 YEAR STORM - 4-HR CHICAGO DISTRIBUTION - CITY OF EDMONTON

STORAGE VOLUME CALCULATOR
File: 1161-107735 Date: 20-Dec-19 Phase 4
1:100 YEAR HUFF STORAGE VOLUME CALCULATIONS
AREA SUMMARY:
SURFACE TYPE 100 YEAR COEFF. AREA [Ha]
Asphalt / Concrete 0.95 0.0000Building/Roof Areas 0.95 0.7740
Gravel 0.625 0.0000Grass 0.125 0.0000
0.7740
Post development composite coefficient = 0.95
Add controlled flow from roof drains = 0 L/s CONTROLLED DISCHARGE = 20.61 L/s or 18.55 cu.m/intervalTIME INTERVAL: 15 min. interval
100 YEAR STORM - HUFF DISTRIBUTION - CITY OF EDMONTON
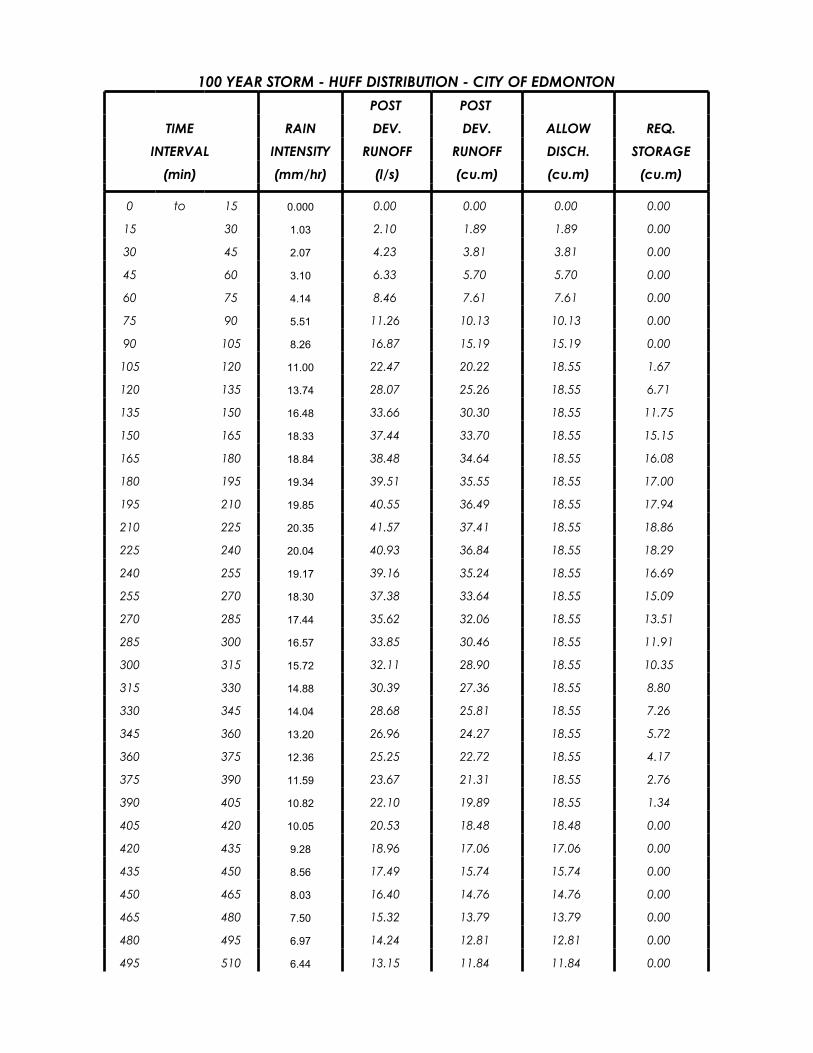
100 YEAR STORM - HUFF DISTRIBUTION - CITY OF EDMONTONPOST POST
TIME RAIN DEV. DEV. ALLOW REQ.INTERVAL INTENSITY RUNOFF RUNOFF DISCH. STORAGE
(min) (mm/hr) (l/s) (cu.m) (cu.m) (cu.m)
0 to 15 0.000 0.00 0.00 0.00 0.00
15 30 1.03 2.10 1.89 1.89 0.00
30 45 2.07 4.23 3.81 3.81 0.00
45 60 3.10 6.33 5.70 5.70 0.00
60 75 4.14 8.46 7.61 7.61 0.00
75 90 5.51 11.26 10.13 10.13 0.00
90 105 8.26 16.87 15.19 15.19 0.00
105 120 11.00 22.47 20.22 18.55 1.67
120 135 13.74 28.07 25.26 18.55 6.71
135 150 16.48 33.66 30.30 18.55 11.75
150 165 18.33 37.44 33.70 18.55 15.15
165 180 18.84 38.48 34.64 18.55 16.08
180 195 19.34 39.51 35.55 18.55 17.00
195 210 19.85 40.55 36.49 18.55 17.94
210 225 20.35 41.57 37.41 18.55 18.86
225 240 20.04 40.93 36.84 18.55 18.29
240 255 19.17 39.16 35.24 18.55 16.69
255 270 18.30 37.38 33.64 18.55 15.09
270 285 17.44 35.62 32.06 18.55 13.51
285 300 16.57 33.85 30.46 18.55 11.91
300 315 15.72 32.11 28.90 18.55 10.35
315 330 14.88 30.39 27.36 18.55 8.80
330 345 14.04 28.68 25.81 18.55 7.26
345 360 13.20 26.96 24.27 18.55 5.72
360 375 12.36 25.25 22.72 18.55 4.17
375 390 11.59 23.67 21.31 18.55 2.76
390 405 10.82 22.10 19.89 18.55 1.34
405 420 10.05 20.53 18.48 18.48 0.00
420 435 9.28 18.96 17.06 17.06 0.00
435 450 8.56 17.49 15.74 15.74 0.00
450 465 8.03 16.40 14.76 14.76 0.00
465 480 7.50 15.32 13.79 13.79 0.00
480 495 6.97 14.24 12.81 12.81 0.00
495 510 6.44 13.15 11.84 11.84 0.00
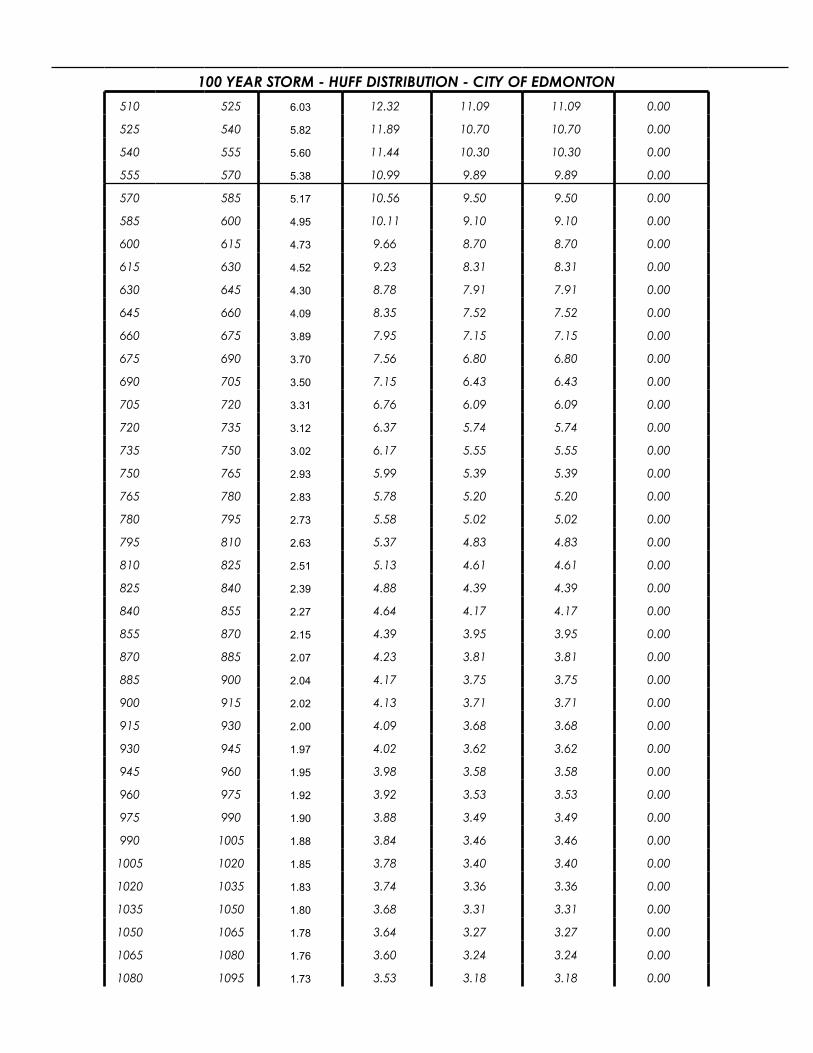
510 525 6.03 12.32 11.09 11.09 0.00
525 540 5.82 11.89 10.70 10.70 0.00
540 555 5.60 11.44 10.30 10.30 0.00
555 570 5.38 10.99 9.89 9.89 0.00
570 585 5.17 10.56 9.50 9.50 0.00
585 600 4.95 10.11 9.10 9.10 0.00
600 615 4.73 9.66 8.70 8.70 0.00
615 630 4.52 9.23 8.31 8.31 0.00
630 645 4.30 8.78 7.91 7.91 0.00
645 660 4.09 8.35 7.52 7.52 0.00
660 675 3.89 7.95 7.15 7.15 0.00
675 690 3.70 7.56 6.80 6.80 0.00
690 705 3.50 7.15 6.43 6.43 0.00
705 720 3.31 6.76 6.09 6.09 0.00
720 735 3.12 6.37 5.74 5.74 0.00
735 750 3.02 6.17 5.55 5.55 0.00
750 765 2.93 5.99 5.39 5.39 0.00
765 780 2.83 5.78 5.20 5.20 0.00
780 795 2.73 5.58 5.02 5.02 0.00
795 810 2.63 5.37 4.83 4.83 0.00
810 825 2.51 5.13 4.61 4.61 0.00
825 840 2.39 4.88 4.39 4.39 0.00
840 855 2.27 4.64 4.17 4.17 0.00
855 870 2.15 4.39 3.95 3.95 0.00
870 885 2.07 4.23 3.81 3.81 0.00
885 900 2.04 4.17 3.75 3.75 0.00
900 915 2.02 4.13 3.71 3.71 0.00
915 930 2.00 4.09 3.68 3.68 0.00
930 945 1.97 4.02 3.62 3.62 0.00
945 960 1.95 3.98 3.58 3.58 0.00
960 975 1.92 3.92 3.53 3.53 0.00
975 990 1.90 3.88 3.49 3.49 0.00
990 1005 1.88 3.84 3.46 3.46 0.00
1005 1020 1.85 3.78 3.40 3.40 0.00
1020 1035 1.83 3.74 3.36 3.36 0.00
1035 1050 1.80 3.68 3.31 3.31 0.00
1050 1065 1.78 3.64 3.27 3.27 0.00
1065 1080 1.76 3.60 3.24 3.24 0.00
1080 1095 1.73 3.53 3.18 3.18 0.00
100 YEAR STORM - HUFF DISTRIBUTION - CITY OF EDMONTON
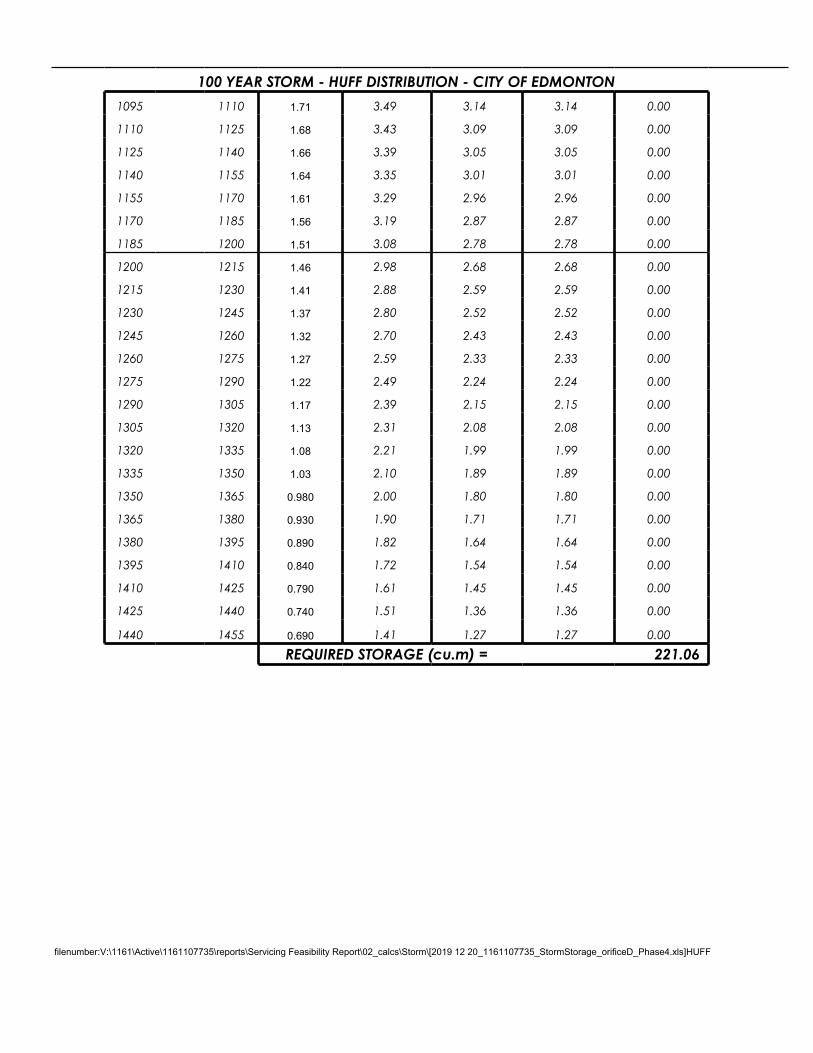
1095 1110 1.71 3.49 3.14 3.14 0.00
1110 1125 1.68 3.43 3.09 3.09 0.00
1125 1140 1.66 3.39 3.05 3.05 0.00
1140 1155 1.64 3.35 3.01 3.01 0.00
1155 1170 1.61 3.29 2.96 2.96 0.00
1170 1185 1.56 3.19 2.87 2.87 0.00
1185 1200 1.51 3.08 2.78 2.78 0.00
1200 1215 1.46 2.98 2.68 2.68 0.00
1215 1230 1.41 2.88 2.59 2.59 0.00
1230 1245 1.37 2.80 2.52 2.52 0.00
1245 1260 1.32 2.70 2.43 2.43 0.00
1260 1275 1.27 2.59 2.33 2.33 0.00
1275 1290 1.22 2.49 2.24 2.24 0.00
1290 1305 1.17 2.39 2.15 2.15 0.00
1305 1320 1.13 2.31 2.08 2.08 0.00
1320 1335 1.08 2.21 1.99 1.99 0.00
1335 1350 1.03 2.10 1.89 1.89 0.00
1350 1365 0.980 2.00 1.80 1.80 0.00
1365 1380 0.930 1.90 1.71 1.71 0.00
1380 1395 0.890 1.82 1.64 1.64 0.00
1395 1410 0.840 1.72 1.54 1.54 0.00
1410 1425 0.790 1.61 1.45 1.45 0.00
1425 1440 0.740 1.51 1.36 1.36 0.00
1440 1455 0.690 1.41 1.27 1.27 0.00 REQUIRED STORAGE (cu.m) = 221.06
filenumber:V:\1161\Active\1161107735\reports\Servicing Feasibility Report\02_calcs\Storm\[2019 12 20_1161107735_StormStorage_orificeD_Phase4.xls]HUFF
100 YEAR STORM - HUFF DISTRIBUTION - CITY OF EDMONTON

APPENDIX C
Sanitary Servicing

149
STRE
ET
151
STRE
ET
100 AVENUE
STONY PLAIN ROAD
SUMMIT DRIVE
V:\1
161\
Activ
e\11
6110
7735
\rep
orts\
Serv
icin
g Fe
asib
ility
Repo
rt\03
_fig
ures
\116
1107
735_
Figur
es.d
wg
2019
/12/
20 1
0:34
AM By:
Eriks
son,
Nat
han
N
www.stantec.com
Suite #400, 10220-103 Ave NWEdmonton AB Canada
Figure No.
Client/Project
Title
RIOCANJASPER GATESREDEVELOPMENT
4.0
PRELIMINARY SANITARYSERVICING SITE PLAN
Dec, 20191161-107735
1:2000
EX SANITARY SEWERSUBJECT SITE BOUNDARY
PRELIMINARY SANITARY SERVICE TIE IN
LEGEND
Phase 1 Area = 1.507 haEX Capacity of Downstream 525mm @ 0.24% = 219.0 L/sPre Development Flow = 8.6 L/sPost Development Flow = 21.0 L/s
Phase 2 Area = 0.584 haEX Capacity of Downstream 200mm @ 0.77% = 28.8 L/sPre Development Flow = 9.6 L/sPost Development Flow = 15.1 L/s
Phase 3 Area = 1.426 haEX Capacity of Downstream 250mm @ 0.28% = 31.5 L/s
Pre Development Flow = 9.7 L/sPost Development Flow = 20.8 L/s
Phase 4 Area = 0.774 haEX Capacity of Downstream 525mm @ 0.25% = 224.0 L/s
Pre Development Flow = 11.0 L/sPost Development = 2.6 L/s
SANITARY CALCULATIONS
Estimate of Expected Sanitary Flow
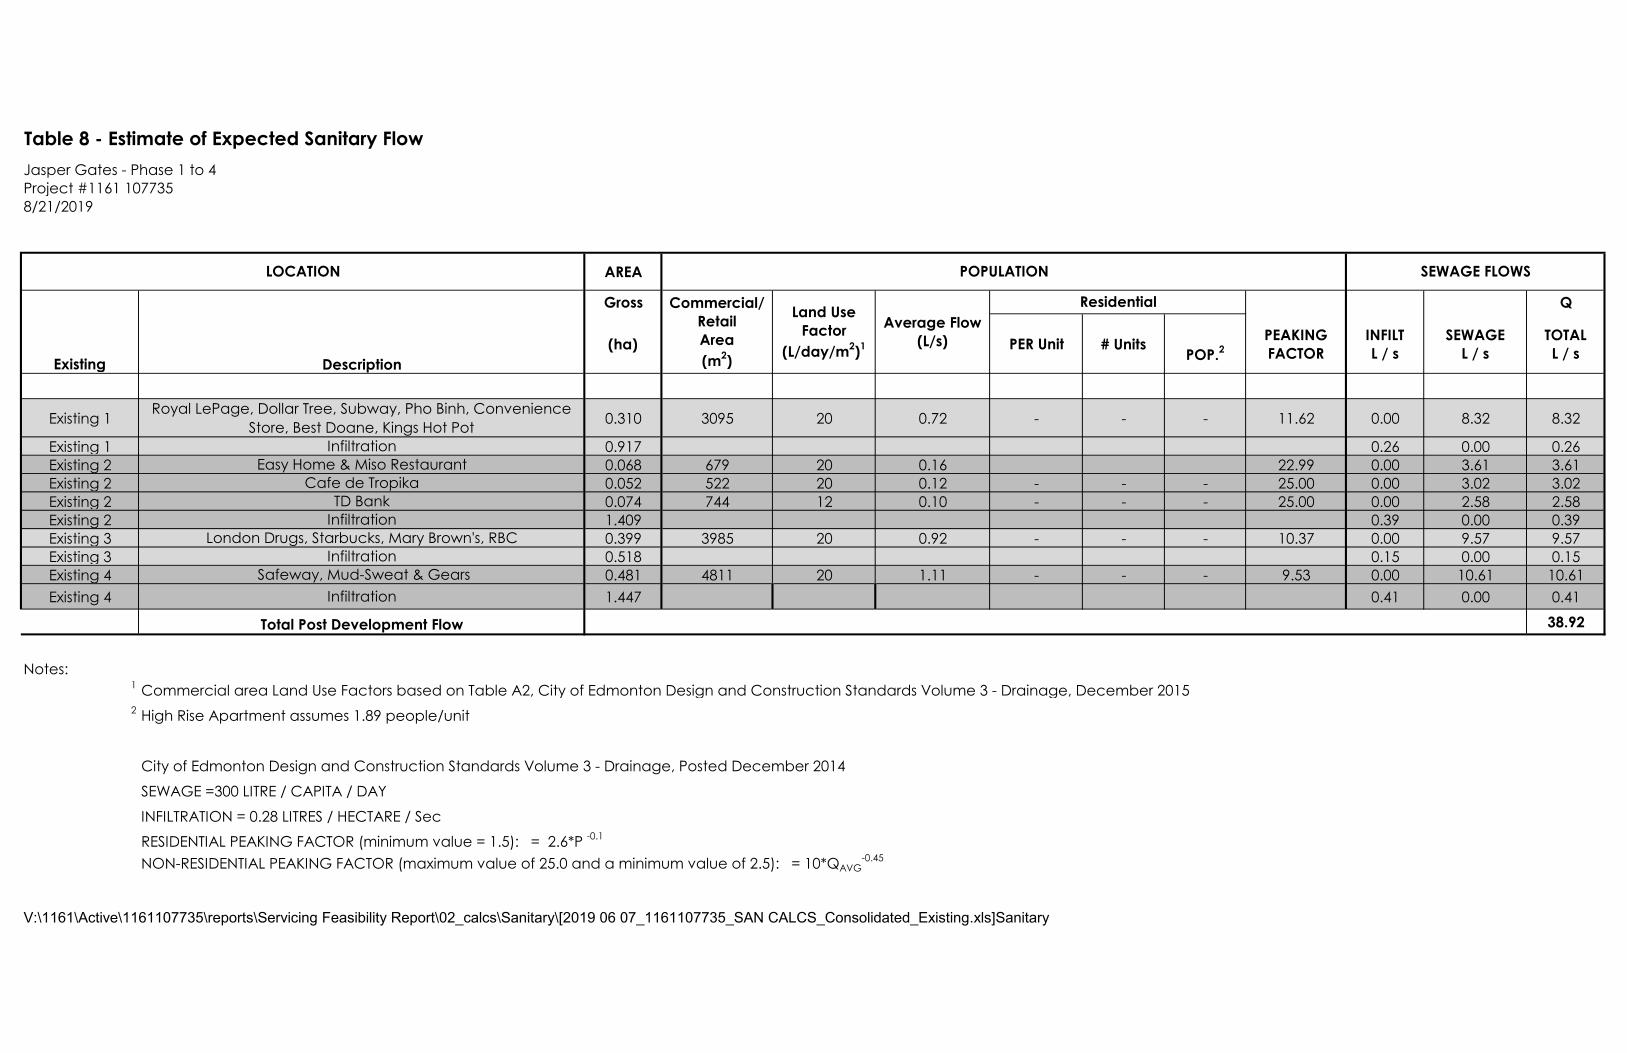
Table 8 - Estimate of Expected Sanitary FlowJasper Gates - Phase 1 to 4Project #1161 1077358/21/2019
AREA
Gross Q
Existing(ha) PER Unit # Units
POP.2PEAKINGFACTOR
INFILTL / s
SEWAGEL / s
TOTALL / s
Existing 1 0.310 3095 20 0.72 - - - 11.62 0.00 8.32 8.32
Existing 1 0.917 0.26 0.00 0.26Existing 2 0.068 679 20 0.16 22.99 0.00 3.61 3.61Existing 2 0.052 522 20 0.12 - - - 25.00 0.00 3.02 3.02Existing 2 0.074 744 12 0.10 - - - 25.00 0.00 2.58 2.58Existing 2 1.409 0.39 0.00 0.39Existing 3 0.399 3985 20 0.92 - - - 10.37 0.00 9.57 9.57Existing 3 0.518 0.15 0.00 0.15Existing 4 0.481 4811 20 1.11 - - - 9.53 0.00 10.61 10.61Existing 4 1.447 0.41 0.00 0.41
38.92
Notes:1 Commercial area Land Use Factors based on Table A2, City of Edmonton Design and Construction Standards Volume 3 - Drainage, December 20152 High Rise Apartment assumes 1.89 people/unit
City of Edmonton Design and Construction Standards Volume 3 - Drainage, Posted December 2014
SEWAGE =300 LITRE / CAPITA / DAY
INFILTRATION = 0.28 LITRES / HECTARE / SecRESIDENTIAL PEAKING FACTOR (minimum value = 1.5): = 2.6*P -0.1
NON-RESIDENTIAL PEAKING FACTOR (maximum value of 25.0 and a minimum value of 2.5): = 10*QAVG-0.45
V:\1161\Active\1161107735\reports\Servicing Feasibility Report\02_calcs\Sanitary\[2019 06 07_1161107735_SAN CALCS_Consolidated_Existing.xls]Sanitary
Commercial/ RetailArea (m2)
Land Use Factor
(L/day/m2)1
Residential
SEWAGE FLOWS
Total Post Development Flow
Royal LePage, Dollar Tree, Subway, Pho Binh, Convenience Store, Best Doane, Kings Hot Pot
Infiltration
Average Flow (L/s)
Description
Safeway, Mud-Sweat & Gears
Cafe de TropikaTD Bank
London Drugs, Starbucks, Mary Brown's, RBCInfiltration
LOCATION POPULATION
Easy Home & Miso RestaurantInfiltration
Infiltration
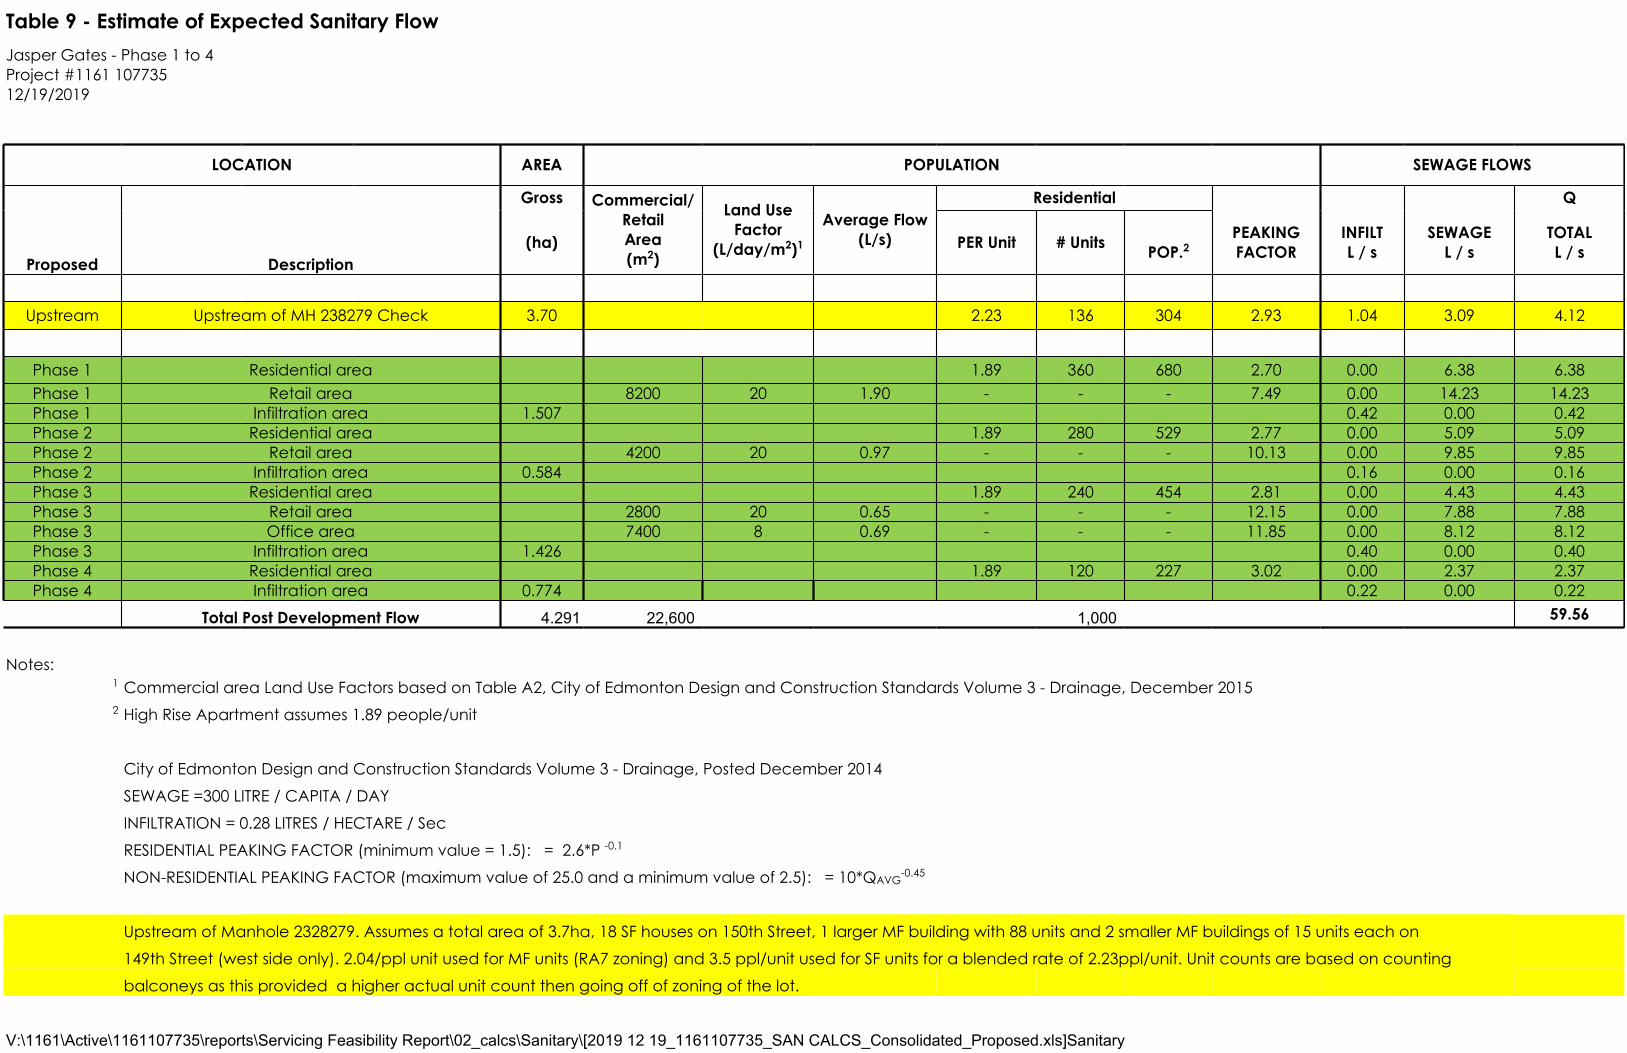
Table 9 - Estimate of Expected Sanitary FlowJasper Gates - Phase 1 to 4Project #1161 10773512/19/2019
LOCATION AREA POPULATION SEWAGE FLOWS
Gross Commercial/RetailArea(m2)
Land UseFactor
(L/day/m2)1
Average Flow(L/s)
Residential Q
Proposed Description(ha) PER Unit # Units POP.2
PEAKINGFACTOR
INFILTL / s
SEWAGEL / s
TOTALL / s
Upstream Upstream of MH 238279 Check 3.70 2.23 136 304 2.93 1.04 3.09 4.12
Phase 1 Residential area 1.89 360 680 2.70 0.00 6.38 6.38Phase 1 Retail area 8200 20 1.90 - - - 7.49 0.00 14.23 14.23Phase 1 Infiltration area 1.507 0.42 0.00 0.42Phase 2 Residential area 1.89 280 529 2.77 0.00 5.09 5.09Phase 2 Retail area 4200 20 0.97 - - - 10.13 0.00 9.85 9.85Phase 2 Infiltration area 0.584 0.16 0.00 0.16Phase 3 Residential area 1.89 240 454 2.81 0.00 4.43 4.43Phase 3 Retail area 2800 20 0.65 - - - 12.15 0.00 7.88 7.88Phase 3 Office area 7400 8 0.69 - - - 11.85 0.00 8.12 8.12Phase 3 Infiltration area 1.426 0.40 0.00 0.40Phase 4 Residential area 1.89 120 227 3.02 0.00 2.37 2.37Phase 4 Infiltration area 0.774 0.22 0.00 0.22
Total Post Development Flow 4.291 22,600 1,000 59.56
Notes:1 Commercial area Land Use Factors based on Table A2, City of Edmonton Design and Construction Standards Volume 3 - Drainage, December 20152 High Rise Apartment assumes 1.89 people/unit
City of Edmonton Design and Construction Standards Volume 3 - Drainage, Posted December 2014
SEWAGE =300 LITRE / CAPITA / DAY
INFILTRATION = 0.28 LITRES / HECTARE / Sec
RESIDENTIAL PEAKING FACTOR (minimum value = 1.5): = 2.6*P -0.1
NON-RESIDENTIAL PEAKING FACTOR (maximum value of 25.0 and a minimum value of 2.5): = 10*QAVG-0.45
Upstream of Manhole 2328279. Assumes a total area of 3.7ha, 18 SF houses on 150th Street, 1 larger MF building with 88 units and 2 smaller MF buildings of 15 units each on
149th Street (west side only). 2.04/ppl unit used for MF units (RA7 zoning) and 3.5 ppl/unit used for SF units for a blended rate of 2.23ppl/unit. Unit counts are based on counting
balconeys as this provided a higher actual unit count then going off of zoning of the lot.
V:\1161\Active\1161107735\reports\Servicing Feasibility Report\02_calcs\Sanitary\[2019 12 19_1161107735_SAN CALCS_Consolidated_Proposed.xls]Sanitary

APPENDIX D
Overall Drainage Network Plan
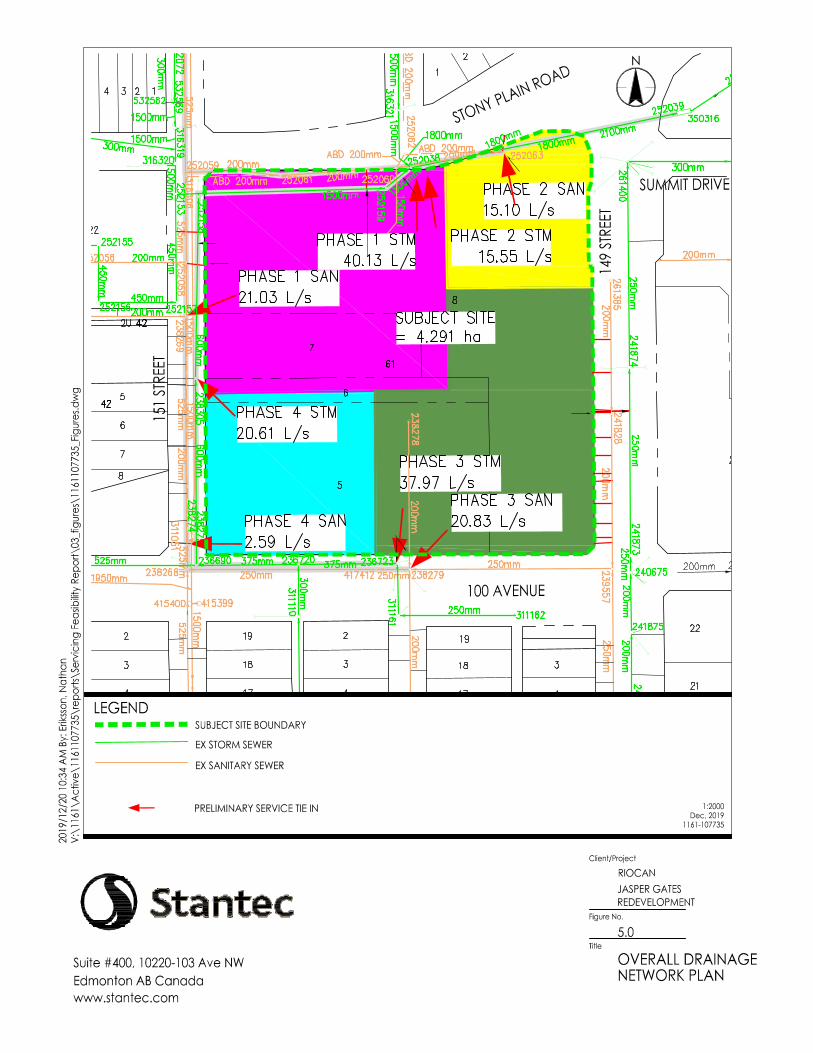
149
STRE
ET
151
STRE
ET
100 AVENUE
STONY PLAIN ROAD
SUMMIT DRIVE
V:\1
161\
Activ
e\11
6110
7735
\rep
orts\
Serv
icin
g Fe
asib
ility
Repo
rt\03
_fig
ures
\116
1107
735_
Figur
es.d
wg
2019
/12/
20 1
0:34
AM By:
Eriks
son,
Nat
han
N
www.stantec.com
Suite #400, 10220-103 Ave NWEdmonton AB Canada
Figure No.
Client/Project
Title
RIOCANJASPER GATESREDEVELOPMENT
5.0
OVERALL DRAINAGENETWORK PLAN
Dec, 20191161-107735
1:2000
EX STORM SEWERSUBJECT SITE BOUNDARY
EX SANITARY SEWER
PRELIMINARY SERVICE TIE IN
LEGEND