Introduction - kepcorp.com Meetings-Apr 20… · n Introduction n Operations ... CBRE. 18 n...
41
1 Investor Meetings April 2006
Transcript of Introduction - kepcorp.com Meetings-Apr 20… · n Introduction n Operations ... CBRE. 18 n...

1
Investor Meetings April 2006

2
Highlights
n Introduction
n Operations Review
n Market Outlook
n Going Forward

3
Introduction

4
Introduction
n Among largest Singapore property companies by total assets ($5.5 bil @ end 2005)
n Established developer of quality housing and investmentgrade commercial properties
n Diversified in Singapore, China, India, Vietnam, Indonesia and Thailand
n Focus on property development for sale and fund management

5
Strategic Focus
n Capitalise on recovering market in Singapore
n Grow sustainable earnings from overseas
n Grow feebased income

6
n Gain foothold in new countries, cities and segments
Ø Residential site in Bangalore, India
Ø Villa and township sites in Tianjin and Wuxi, China
n Strengthen township development initiatives
Ø Over 20,000 units in pipeline : ¬ Chengdu, China ¬ Ho Chi Minh City, Vietnam ¬ Jakarta, Indonesia ¬ Wuxi, China
Expansion Drive

7
Operations Review

8
Singapore
Residential
n Good sales
Ø Caribbean at Keppel Bay : 694 (87%) of 801 * units sold
Ø Park Infinia at Wee Nam : 234 (96%) of 243 launched units sold
Ø The Belvedere : 122 (94%) of 130 launched units sold
Operations Review
Sales status up to 31 March 2006 * Excludes 168 units set aside as corporate residences

9
Singapore
Office
n One Raffles Quay : About 80% precommitted
Ø Blue chip tenants : ABN AMRO, Deutsche Bank, UBS, Ernst & Young, Soc Gen Private Banking and Barclays Capital
n Business & Financial Centre : Total GFA 438,000 sm
Ø Phase One (GFA : 244,000 sm) ¬ > 180,000 sm for office ¬ Rest of 64,000 sm mainly for residential ¬ Launch residential block in end2006 ¬ Ready by 2010
Ø 8 years option for rest
Operations Review

10
Singapore n Submitted bid for Marina Bay Integrated Resort (IR)
Ø Strategic alliances : ¬ MICE specialists SMG, CEMS and Suntec Singapore ¬ AEG Live, Teamwork and Unusual Entertainments ¬ Gordon Group and Taubman Asia ¬ Centre Pompidou ¬ Star TV
Ø Distinctive designs and attractions : ¬ Daniel Libeskind to design Marina Bay IR ¬ Peter Marino to design retail component ¬ James Cameron to create urban theme park, iPort
Operations Review
11
Singapore
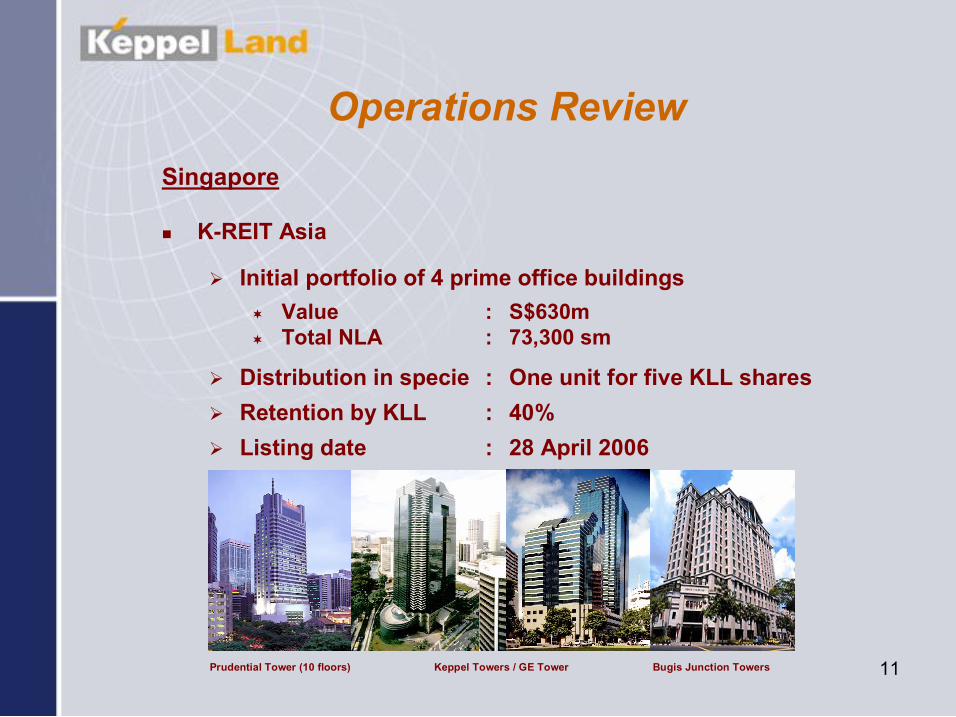
n KREIT Asia
Ø Initial portfolio of 4 prime office buildings ¬ Value : S$630m ¬ Total NLA : 73,300 sm
Ø Distribution in specie : One unit for five KLL shares Ø Retention by KLL : 40% Ø Listing date : 28 April 2006
Prudential Tower (10 floors) Keppel Towers / GE Tower Bugis Junction Towers
Operations Review
12
Operations Review
Singapore
n KREIT Asia’s impact on Keppel Land *
Ø ROE improves from 9.5% to 10.3%
Ø NTA per share decreases from $2.35 to $1.98
Ø Net gearing increases from 1.14 to 1.21
Ø EPS remains stable at 21.8 cents
* Based on FY05 results
13
Overseas
n Strong sales
Ø 8 Park Avenue : 449 (98%) of 456 launched units sold
Ø The Seasons : 1,240 (99%) of 1,250 launched units sold
Ø The Waterfront : 898 (88%) of 1,023 launched units sold
Ø Elita Promenade : 405 (99%) of 410 launched units sold
n Gained control of Dragon Land
Ø Additional platform for middleincome housing in China
Operations Review
Sales status up to 31 March 2006

14
Operations Review
Fund Management
n Final closing of Alpha Core Plus Real Estate Fund : US$437 million
n Secured first Islamic mandate
Ø Target to double portfolio to US$300 million by end2007
n Asia No. 1 Property Fund over 85% invested
n Assets Under Management
Ø US$2.7 ($4.4) billion when all three funds fully invested
Ø US$3.1 ($5) billion including KREIT

15
Market Outlook
16
n Sales and prices continue to improve
Ø URA price index up 1.5% in 1Q06
Ø Good demand for highend homes
à3 projects above $2,000 psf
Ø New heights achieved with en bloc sales
àPaterson Tower : $266 mil or $3.7 mil per unit
Singapore Residential Market

17
n Occupancy and rentals rise further in 2006
Ø Avg Grade A rentals
¬ $6 psf at end1Q06 *
¬ $7.20 psf by end2006 *
Ø Continued demand for prime office space
Singapore Office Market
Ø New supply < 1 mil sf p.a.
Ø Conversion of older buildings in CBD
Future Supply of Office Space
2.00
0.59
1.65
0
0.7
1.4
2.1
2006 2007 2008 2009 2010
mil sf
1015 yr average annual takeup
Precommitted space at ORQ
* Source : CBRE

18
n Sustainable genuine demand for quality housing and townships in Asia, due to :
Ø Economic growth
Ø Urbanisation
Ø Young population
Ø Positive government policies
Market Outlook Overseas

19
Going Forward

20
Going Forward Singapore
n Launch residential projects
Ø Keppel Bay Phase 2
Ø BFC Phase 1 residential
n Develop BFC
n Grow KREIT Asia

21
Units to Project Location Launch
Ritz Residences (60% stake) Devonshire Rd 100 BFC (Ph1) Residential (33.3% stake) Marina Blvd/Central Blvd 200 Keppel Bay Phase 2 (30% stake) Keppel Bay Drive 200 Avenue Park (52% stake) Sixth Avenue 100 Caribbean at Keppel Bay * Keppel Bay Drive 107 #
Park Infinia at Wee Nam * Wee Nam Rd 252 Urbana * River Valley Rd 35 The Belvedere * Meyer Rd 45
Numbers as of 31 March 2006
* Existing launches # Excluding 168 units set aside for corporate residences
Possible Residential Launches Singapore 2006

22
n Launch residential projects
Ø Villas in Shanghai and Tianjin
Ø Townships in Chengdu and Jakarta
n Keep up expansion drive in Asia
Ø Pursue residential and township developments in growth cities
Going Forward Overseas

23
Units to Launch Project 2006 2007 2008
China 8 Park Avenue, Shanghai * 497 Villa Riviera, Shanghai ^ 168 Park Avenue Central, Shanghai ^ 708 The Seasons, Beijing * 619 The Waterfront, Chengdu * 245 The Botanica (Phase 2), Chengdu ^ 1,479 The Botanica (Phase 3), Chengdu ^ 950 The Botanica (Phase 4), Chengdu ^ 1,000 Tianjin Villas, Tianjin ^ 40 120 Wuxi Township, Wuxi (Phase 1) ^ 800 800 Numbers as of 31 March 2006
* Balance units ^ New launches
Overseas Residential Projects

24
Units to Launch Project 2006 2007 2008 Vietnam
Villa Riviera, Ho Chi Minh City * 83 Saigon Sports City (Phase 1), HCMC ^ 214 284
Thailand Villa Arcadia at Srinakarin, Bangkok * 97 215 Villa Arcadia at Watcharapol, Bangkok ^ 100 170
IndiaElita Promenade in JP Nagar , Bangalore * 448 550 170 Condominium in Kanakapura, Bangalore ^ 200 500 364
Indonesia Cakung Township (Phase 1), Jakarta ^ 300 856
Numbers as of 31 March 2006 * Balance units ^ New launches
Overseas Residential Projects

25
Thank You
26
This release may contain statements which are subject to risks and uncertainties that could cause actual
results to differ materially from such statements. You are cautioned not to place undue reliance on such statements, which are based in the current views of Management on future developments and events.

27
Additional Info

28
$m FY2005 FY2004 % Chg Turnover 586.4 476.2 23.1 EBITDA 163.9 124.5 31.6 Operating Profit 146.6 111.1 32.0 Pretax Profit 183.4 139.9 31.1 PATMI before EI 154.5 132.7 16.4 EI 1.2 * nm PATMI after EI 155.7 132.7 17.3 Overseas Earnings (% of PATMI) 59.0 43.3 58.6 EPS (¢) 21.8 18.7 16.6 NTA/Share ($) 2.35 2.26 4.0 Debt/Equity Ratio 1.14 0.96 18.8 Annualised ROE (%) 9.5 8.6 10.5 * Being the Group’s share of $37.8m gain from Bugis Junction transactions less $36.6m provision for diminution in value of the Group’s investment in associated companies ($14.9m) and hotels in Myanmar ($21.7m)
Financial Performance

29
2003 2004 2005
PATMI before EI ($m) 126.4 132.7 154.5
PATMI after EI ($m) 100.6 132.7 155.7
% of Overseas PATMI b/f EI 31.6 43.3 59.0
NTA/Share ($) 2.09 2.26 2.35
Debt/Equity Ratio 0.95 0.96 1.14
ROE (%) 6.8 8.6 9.5
Dividend per Share (cts) * 3.1 4.0 5.0
* After tax
Key Financial Indicators

30
Geographical FY2005 FY2004 % Location $m % $m % Chg Comments
Singapore 63.3 41.0 75.2 56.7 (15.8) • Lower profit from sale of two Cluny Hill bungalow plots in 2005 compared with four in 2004
Other Countries 91.2 59.0 57.5 43.3 58.6 • Higher overseas contributions due mainly to profit from trading projects in China
PATMI before EI 154.5 100.0 132.7 100.0 16.4 • Better contributions from trading projects and investment properties
EI 1.2 nm • Gain of $37.8m from Bugis Junction transactions less $36.6m provision for diminution in value of investment in associated companies and hotels in Myanmar
PATMI after EI 155.7 132.7 17.3
Net Profit by Geographical Location

31
Business Segment
FY2005 $m
FY2004 $m
% Chg Comments
Property
Trading 111.9 97.2 15.1 • Maiden contributions from Park Infinia at Wee Nam in Singapore and higher contributions from China’s residential projects
Investment 39.7 32.4 22.5 • Higher interest income and writeback of deferred tax provision for properties in Singapore
Hotels / Resorts 0.2 (6.2) nm • Improvement mainly from recovery of loan provided to Bintan Lagoon Resort
Others 2.7 9.3 (71.0) • Lower group tax relief compared with 2004
PATMI before EI 154.5 132.7 16.4 • Better contributions from trading projects and investment properties
EI 1.2 nm • Gain of $37.8m from Bugis Junction transactions less $36.6m provision for diminution in value of investment in associated companies and hotels in Myanmar
PATMI after EI 155.7 132.7 17.3
Net Profit by Business Segment

32
à Land price : $1.2 bil à Site area : 20.6 ha à GFA : 270,000 570,000 sm
Source : URA
BFC
Marina Bay IR ORQ
The Esplanade
“Necklace of attractions" in the Marina Bay the IR, the Business and Financial Centre and The Esplanade.
Marina Bay IR
Marina Bay

33
Residential Demand and Prices on the Uptrend
181.4
* Data includes completed new units sold from Year 2000 onwards
URA Private Residential Demand and Price Index
5,785
8,955 9,565
5,520 6,096
8,171
5,406
7,189
9,485
5,156
173.1
151.6
100
134.2 132.8
117.2 115.1 112.8 113.8 118.2
0
2,000
4,000
6,000
8,000
10,000
12,000
1996
1997
1998
1999
2000*
2001
2002
2003
2004
2005
Units
80
100
120
140
160
180
Index
Total Primary Demand Price Index
Source : URA

34
Further Upside for Office Rentals and Occupancy
78
80
82
84
86
88
90
92
1Q01
2Q01
3Q01
4Q01
1Q02
2Q02
3Q02
4Q02
1Q03
2Q03
3Q03
4Q03
1Q04
2Q04
3Q04
4Q04
1Q05
2Q05
3Q05
4Q05 0
1
2
3
4
5
6
7
8 Islandwide Occupancy
Prime Rentals
% S$psf/mth
87.2%
Source : URA, CBRE

35
Singapore Office Supply (20052010)
Source : URA, CBRE and KLL
Expected Completion Proposed Office Projects NFA (sf)
2005 No new supply 2006 3 Church Street 372,865
Parakou Building 63,723 One Raffles Quay 1,310,000 VisionCrest 144,295 Sinsov Building (A&A) 29,126 SIF Redevelopment 84,390 Sub total 2,004,399
2007 No new supply 2008 Central 411,167
Selegie Rd (Hotel/Office/Shopping Ctr) 182,988 Sub total 594,155
2009 No new supply Total (20052009) 2,598,554 2010 BFC (Phase 1) 1,646,876
36
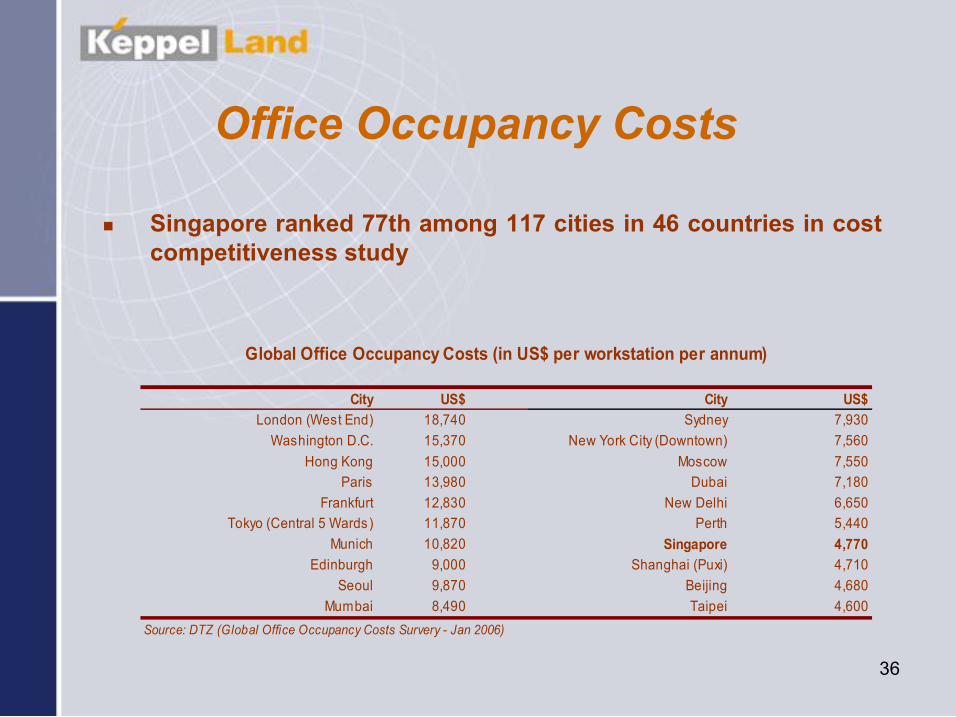
Office Occupancy Costs
n Singapore ranked 77th among 117 cities in 46 countries in cost competitiveness study
City US$ City US$ London (West End) 18,740 Sydney 7,930 Washington D.C. 15,370 New York City (Downtown) 7,560
Hong Kong 15,000 Moscow 7,550 Paris 13,980 Dubai 7,180
Frankfurt 12,830 New Delhi 6,650 Tokyo (Central 5 Wards) 11,870 Perth 5,440
Munich 10,820 Singapore 4,770 Edinburgh 9,000 Shanghai (Puxi) 4,710
Seoul 9,870 Beijing 4,680 Mumbai 8,490 Taipei 4,600
Source: DTZ (Global Office Occupancy Costs Survery Jan 2006)
Global Office Occupancy Costs (in US$ per workstation per annum)

37
n Singapore ranked 63rd worldwide, attractive compared to other Asian cities
Office Occupancy Costs
Ranking City US$/sf/annum Ranking City US$/sf/annum 1 London (West End), England 178.67 27 New York Midtown Manhattan 53.69 2 Tokyo (Inner Central), Japan 131.10 31 Taipei, Taiwan 48.16 3 Tokyo (Outer Central), Japan 123.39 35 New Delhi, India 43.06 4 London (City), England 119.11 37 Washington DC (CBD) 41.84 5 Paris, France 89.58 39 Ho Chi Minh City, Vietnam 41.69 7 Dublin, Ireland 81.18 41 Amsterdam, Netherlands 40.72 8 Hong Kong 75.85 43 Shanghai (Pudong), China 40.49 9 Edinburgh, Scotland 75.80 44 Sydney, Australia 40.45 15 Frankfurt, Germany 63.57 45 Boston (CBD) 39.65 19 Seoul, South Korea 61.74 47 Shanghai (Puxi), China 38.83 20 Milan, Italy 60.99 50 Ottawa, Canada 37.62 23 Mumbai (Bombay), India 56.43 63 Singapore 33.71(S$4.70psf/mth) Source: CBRE (Aug 2005) USD:SGD=1.67
Global 50 Index (by occupation cost in US$ psf per annum)

38
n About 1.6 mil sf of attributable GFA Site Location Tenure Attributable Attributable Total
Land Area GFA Units (sf) (sf)
The Tresor ^ Duchess Road 999yr 80,504 112,689 62 Ritz Residences (60%) ^^ * Devonshire Road Freehold 47,793 133,820 157 Avenue Park (52%)* Sixth Avenue Freehold 89,866 125,813 193 The Crest @ Cairnhill Cairnhill Road Freehold 11,183 31,310 15 Naga Court Bukit Timah Road Freehold 49,168 110,628 74 Keppel Bay Plots 1 (30%)* Keppel Bay Drive 99yr 269,938 624,521 1,000 Keppel Bay Plot 3 & 6 (30%)* Keppel Bay Drive 99yr 201,413 220,811 408 Keppel Bay Plot 4 (11.7%)* Keppel Bay Drive 99yr 36,207 40,300 234 BFC (Phase 1) Residential (33.3%)* Marina Blvd/Central Blvd 99yr n.a. 197,338 421 Total 786,072 1,597,230 2,564
* KLL’s stake ^ Includes 28 units sold ^^ Based on amalgamated site
Singapore Residential Landbank

39
Rentals in Asia n Rising rentals in both residential and office markets
Source : JLL

40
n About 2.1 mil sm of total GFA Site KLL's Stake Total Land Area Total GFA Total
(%) (sm) (sm) Units 8 Park Avenue * 99% 33,432 133,393 946 Park Avenue Central 99% 28,488 99,708 708 Villa Riviera 99% 153,726 53,796 168 Tianjin Villas 100% 133,400 56,000 160 Wuxi Township 50% 352,534 671,053 # 5,000 The Botanica ^ 44% 419,775 1,049,438 # 8,166 Total 1,121,355 2,063,388 15,148
* Includes 5 blocks launched ^ Includes Ph 1 launched # Includes commercial space
China Residential Landbank

41
n About 1.7 mil sm of total GFA
* Include units sold (405 units in Elita Promenade, 55 units in Villa Arcadia at Srinakarin and 18 units in Villa Riviera as of 31 March 2006)
# Includes commercial space
Country Site KLL's Stake Total Land Area Total GFA Total (%) (sm) (sm) Units
India Elita Promenade * 51% 96,800 193,308 1,573 Condominium in Kanakapura 51% 68,800 148,245 1,064 Subtotal 165,600 341,553 2,637
Indonesia Cakung Township 51% 2,700,000 700,000 7,000 Subtotal 2,700,000 700,000 7,000
Thailand Villa Arcadia at Srinakarin * 45.45% 159,746 84,440 367 Villa Arcadia at Watcharapol 66.72% 124,912 68,314 270 Subtotal 284,658 152,754 637
Vietnam Villa Riviera * 90% 59,934 32,450 101 Saigon Sports City 90% 740,000 441,000 # 3,000 Subtotal 799,934 473,450 3,101
Total 3,950,192 1,667,757 13,375
Other Overseas Residential Landbank