Interpretation and analysis of the Blackfoot 3C-3D · Interpretation and analysis of the Blackfoot...
41
Interpretation and analysis of the Blackfoot 3C-3D seismic survey CREWES Research Report — Volume 8 (1996) 46-1 Interpretation and analysis of the Blackfoot 3C-3D seismic survey Grace Y.C. Yang, Don C. Lawton, Robert R. Stewart, Susan L. M. Miller, Collin C. Potter, and Vladan Simin ABSTRACT This paper describes the interpretation of the 3C-3D seismic survey acquired in Blackfoot field, near Strathmore, Alberta (Township 23, Range 23 W4). Structural interpretation shows a horst block in the south-central part of the area, evident from basal Cambrian time through Viking time. A fault running in a north-south direction bounds the eastern part of the block at basal Cambrian time. The fault is clearly mappable on both P-P and P-S data. More detailed structural variations are noticed on the P-S time structure map than from P-P data in the west-central part of the survey area. Time slice analysis indicates that P-P amplitude anomalies occur not only along the Glauconitic channel trend (target of survey), but also where regional wells were drilled. P-S time slices and isochron maps indicate clearly the valley fairway trend, and Vp/Vs values very accurately predict the locations of producing wells. The Blackfoot 3C-3D survey has shown that converted-wave (P-S) analysis has provided significant added value to conventional, single-component P-wave surveys for the exploration of valley-fill sandstone reservoirs. INTRODUCTION The Blackfoot field is located in the southern Alberta, 45 km south-east from Calgary. The 3C-3D seismic survey was conducted by Boyd Exploration Consultants Ltd and the CREWES project in 1995. The objective was to evaluate the effectiveness of integrated P-P and P-S surveys for improved hydrocarbon exploration, primarily to demonstrate that 3C-3D seismic data can build on and improve conventional 3D P - wave data and provide additional stratigraphic and structural images of the subsurface, discriminate lithology, and test for anisotropy which may be caused by fracturing and regional stress directions (Lawton et al., 1995). The focus is to discriminate channel and regional seismic signatures, and to distinguish between sand-fill and shale-fill within the channel, e.g. to distinguish between porous sandstone and shale plug lithologies. The interpretation of the Blackfoot 3C-3D seismic surveys presented in three parts: Firstly, examination of the geometric framework of the reservoir and the structure of the area; Secondly, Vp/Vs analysis; and thirdly, stratigraphic amplitude analysis of both P-P data and P-S wave data volumes. GEOLOGICAL BACKGROUND The reservoir in the Blackfoot field is producing from Glauconitic sand of the Lower Cretaceous Glauconitic Formation: It is a valley-fill depositional environment which has been well documented (Hopkins, 1987, & 1991; Strobl, 1988; Wood, 1989, 1992). In southern Alberta, the Glauconitic member is an unconformity bounded sequence that
Transcript of Interpretation and analysis of the Blackfoot 3C-3D · Interpretation and analysis of the Blackfoot...
Interpretation and analysis of the Blackfoot 3C-3D seismic survey
CREWES Research Report — Volume 8 (1996) 46-1
Interpretation and analysis of the Blackfoot 3C-3Dseismic survey
Grace Y.C. Yang, Don C. Lawton, Robert R. Stewart, Susan L. M. Miller,
Collin C. Potter, and Vladan Simin
ABSTRACT
This paper describes the interpretation of the 3C-3D seismic survey acquired inBlackfoot field, near Strathmore, Alberta (Township 23, Range 23 W4).
Structural interpretation shows a horst block in the south-central part of the area,evident from basal Cambrian time through Viking time. A fault running in a north-southdirection bounds the eastern part of the block at basal Cambrian time. The fault isclearly mappable on both P-P and P-S data. More detailed structural variations arenoticed on the P-S time structure map than from P-P data in the west-central part of thesurvey area.
Time slice analysis indicates that P-P amplitude anomalies occur not only along theGlauconitic channel trend (target of survey), but also where regional wells were drilled.P-S time slices and isochron maps indicate clearly the valley fairway trend, and Vp/Vsvalues very accurately predict the locations of producing wells.
The Blackfoot 3C-3D survey has shown that converted-wave (P-S) analysis hasprovided significant added value to conventional, single-component P-wave surveysfor the exploration of valley-fill sandstone reservoirs.
INTRODUCTION
The Blackfoot field is located in the southern Alberta, 45 km south-east fromCalgary. The 3C-3D seismic survey was conducted by Boyd Exploration ConsultantsLtd and the CREWES project in 1995. The objective was to evaluate the effectivenessof integrated P-P and P-S surveys for improved hydrocarbon exploration, primarily todemonstrate that 3C-3D seismic data can build on and improve conventional 3D P -wave data and provide additional stratigraphic and structural images of the subsurface,discriminate lithology, and test for anisotropy which may be caused by fracturing andregional stress directions (Lawton et al., 1995). The focus is to discriminate channeland regional seismic signatures, and to distinguish between sand-fill and shale-fillwithin the channel, e.g. to distinguish between porous sandstone and shale pluglithologies.
The interpretation of the Blackfoot 3C-3D seismic surveys presented in three parts:Firstly, examination of the geometric framework of the reservoir and the structure ofthe area; Secondly, Vp/Vs analysis; and thirdly, stratigraphic amplitude analysis ofboth P-P data and P-S wave data volumes.
GEOLOGICAL BACKGROUND
The reservoir in the Blackfoot field is producing from Glauconitic sand of the LowerCretaceous Glauconitic Formation: It is a valley-fill depositional environment which hasbeen well documented (Hopkins, 1987, & 1991; Strobl, 1988; Wood, 1989, 1992). Insouthern Alberta, the Glauconitic member is an unconformity bounded sequence that

Yang et. al
46-2 CREWES Research Report — Volume 8 (1996)
formed on an ancient coastal plain in response to relative sea level fluctuations (Wood,1992). From well data in the Blackfoot area, it is interpreted that incised valley fill (orchannel fill) sediments formed in an estuarine environment (Miller, et al., 1995). Figure1 shows the stratigraphic sequence near the zone of interest (modified from Wood,1992). The incised valley cuts to varying depths through the underlying strata and thusthe base may be found directly overlying one of several formations.
Oil and gas are trapped stratigraphically within quartzose sandstones in incisedvalley or channels of the Glauconitic member in the Blackfoot area. Updip seals forthese Glauconitic reservoirs are commonly pinch out of porous channel sands againstimpermeable sands or shales.
DATA SET
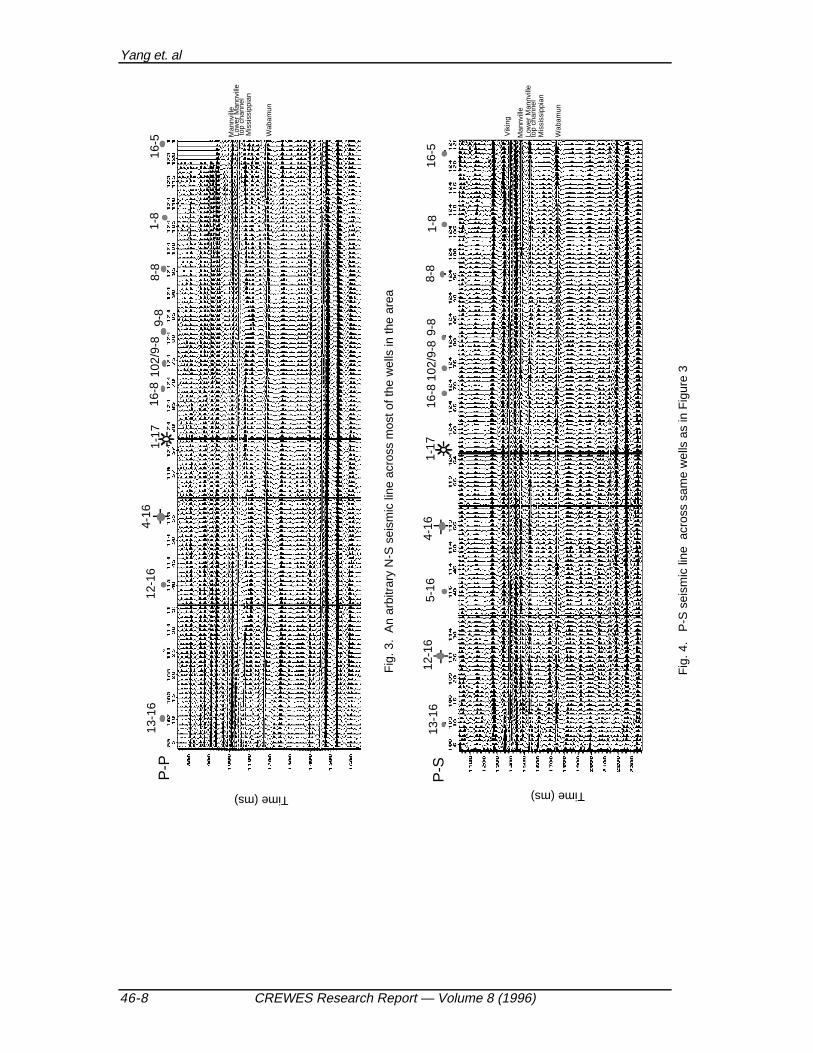
The 3C-3D seismic survey grid is shown in Figure 2. The vertical and radialcomponent data were processed by two independent processing companies: PulsonicGeophysical Ltd. and Sensor Geophysical Ltd. Since the data processed by Sensorcovers only a portion of whole area, we will show the results of interpretation basedprimarily on data processed by Pulsonic. The quality of the data set is very good asshown in Figure 3 (P-P data) and 4 (P-S data). The zone of interest is at about 1050 mson the P-P section and 1550 ms on the P-S section.
Low
er C
reta
ceou
s
Man
nvill
e G
roup
Glauconitic Member
Ostracod
Mississippian
Sunburst Member
Mannville (top)
Detrital Member
Lower Mannville
Bantry shale
Fig. 1. Stratigraphic nomenclature of Cretaceous rocks in the Blackfoot area (modified fromHopkins, 1991)

Interpretation and analysis of the Blackfoot 3C-3D seismic survey
CREWES Research Report — Volume 8 (1996) 46-3
Fig. 2 Blackfoot 3C-3D seismic survey grid
ANALYSIS AND INTERPRETATION
A total of 18 wells were drilled in the area and sonic and density logs were availablefrom 16 of these wells. Four wells have dipole logs with P- and S- sonic curves: 08-08, 09-17, 12-16, and 4-16. The 08-08 well has 38m of clean sand, 09-17 is a regionalwell which encountered Ostracod, and the 12-16 and 4-16 wells are shale plugged.VSP (Vertical Seismic Profiles) were recorded in two wells: 14-3 and 4-16; data qualitywas excellent, showing high-frequency content and correlation with the surface seismicdata was straightforward. Well data were evaluated and tied the geological horizonswith both P-P and P-S seismic data (details see chapter 37, this volume). Seven keyseismic horizons (Viking, Mannville, Lower Mannville, Top Channel, Mississippian,Wabamun and basal Cambrian) were selected, interpreted and mapped because of theirseismic continuity and adequate seismic-to-well correlation. They are identified andpicked on both P-P and P-S sections. Examples of interpreted sections of both datacomponents are shown in Figures 3 and 4. These seven key horizons form theframework for structural interpretation and isochron mapping.
For each horizon, a control grid of east-west inlines and north-south crosslines wasdefined using every 10th line, (every 300 m), for interpretation. Arbitrarily orientedlines were used to check and improve the consistency of the interpretation. Theinteractively interpreted control grid was then used as input to an automatic horizonpicker using SeisX software (Photon Systems).
The interpretation proceeded by mapping Viking, Mannville, Lower Mannville, topchannel, Mississippian, Wabamun and basal Cambrian events. Seismic amplitudevariations across the zone of interest, i.e. near the top channel were evaluated,isochrons between these events were computed, and time slices were used to assist theinterpretation.

Yang et. al
46-4 CREWES Research Report — Volume 8 (1996)
Geometric framework and structure
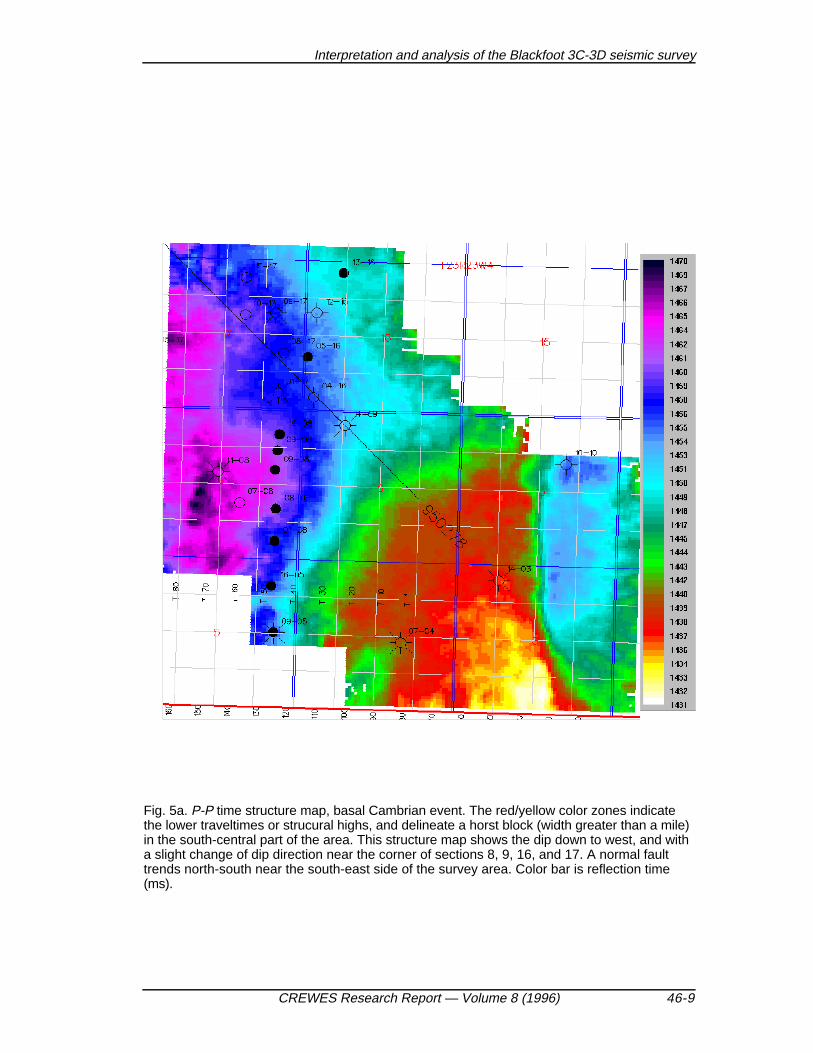
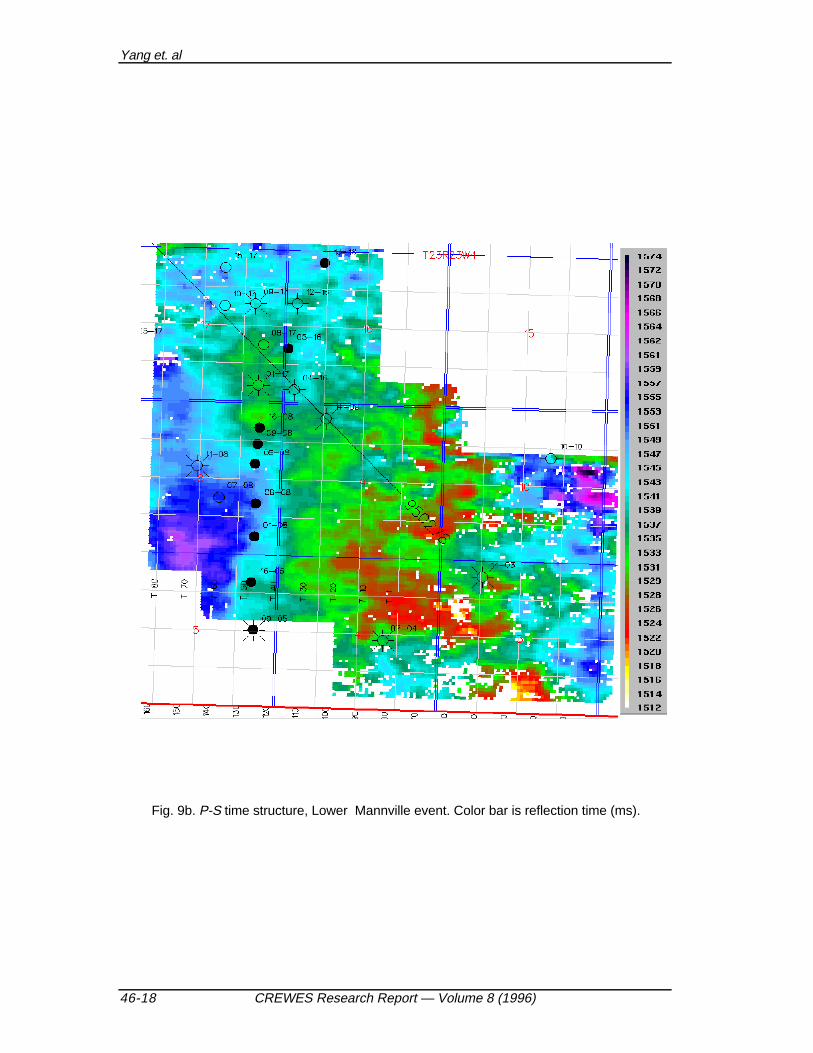
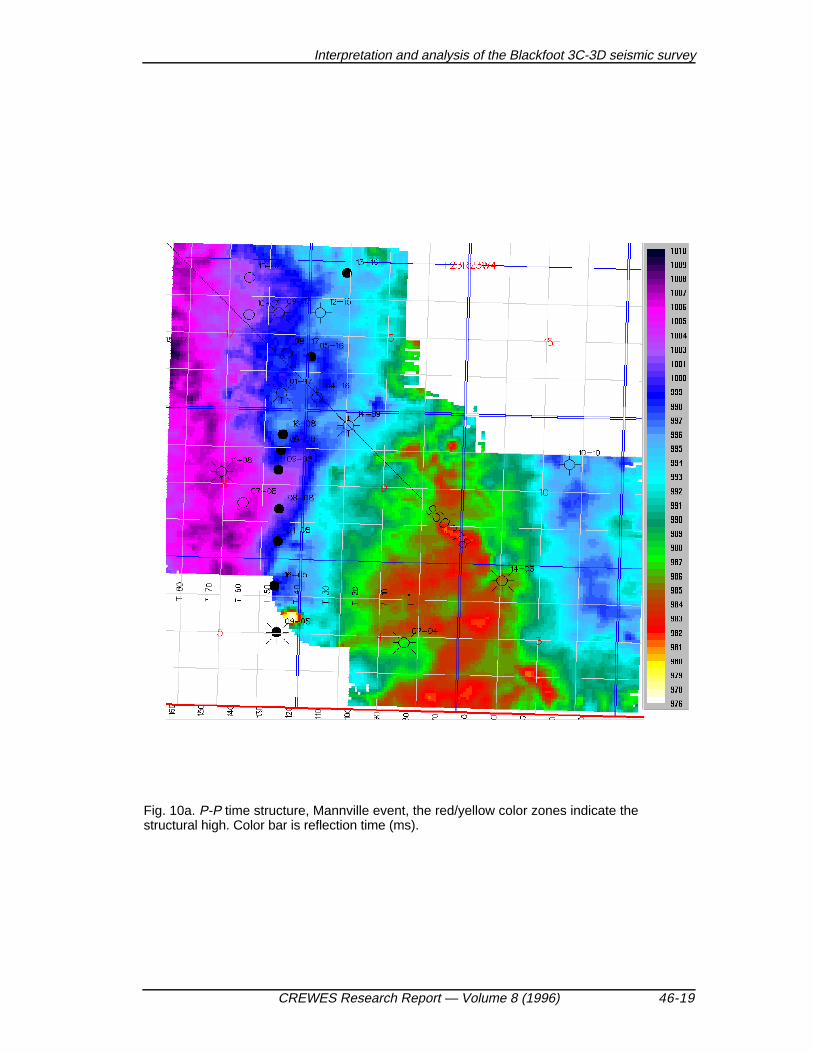
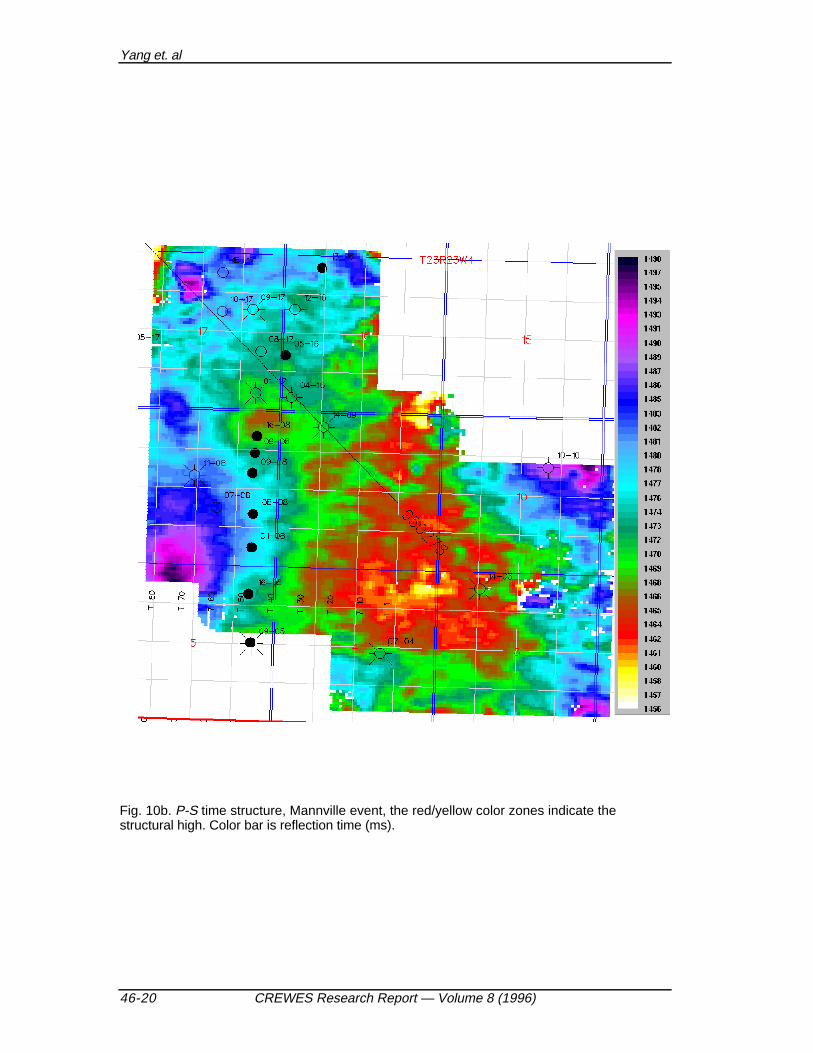
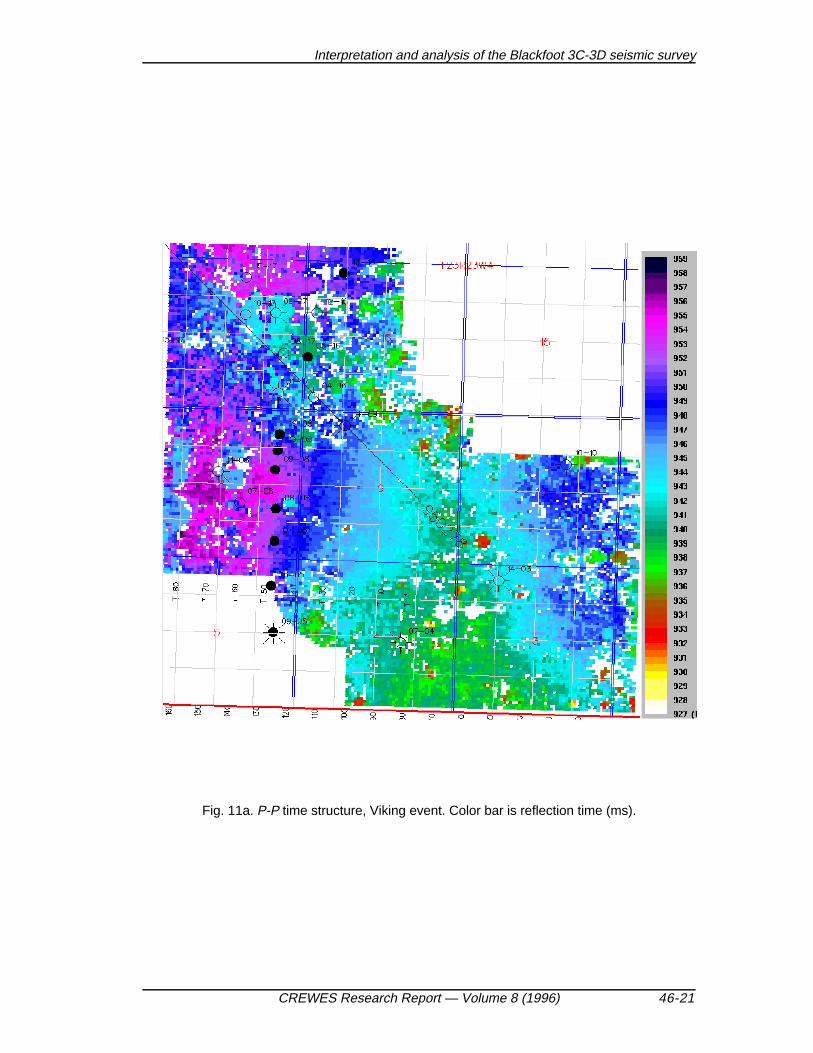
The P-P time structure maps for each horizon are displayed in Figure 5a (basalCambrian level), 6a (Wabamun event), 7a (Mississippian event), 8a (Top Channelevent), 9a (Lower Mannville event), 10a (Mannville event), and 11a (Viking time). TheP-S time structure maps of the same events are shown in Figures 5b, 6b, 7b, 8b, 9b,10b, and 11b, respectively. The red/yellow color zones indicate lower traveltimes orstructural highs, and delineate a horst block in the south-central part of the survey area.The horst block developed in pre-Wabamun times, but its influence on the timestructure maps extends at least to Viking times (Lower Cretaceous). A fault running in anorth-south direction bounds the eastern part of the block at basal Cambrian time(Figure 5a). It is clear on both P-P and P-S data. Note that more detailed structurevariations are visible in the west-central area on P-S time structure maps (Figure 5b,6b, etc.).
Time slice analysis
Time slice display and interpretation was undertaken by first flattening the datavolume on a horizon above the Glauconitic channel level which could be pickedconfidently on both P-P and P-S data sets. The purpose was to remove long-wavelength structure from the data caused by drape and mid-Cretaceous uplift of thehorst block in the center of the survey area. The Mannville event was chosen to flattenthe volume on in this data set. In the absence of structure, time slices displaystratigraphic or paleo-geomorphic features directly. The flattened volume permitstratigraphic and other depositional features to be recognized and studied in detailwithout confusion of structure.
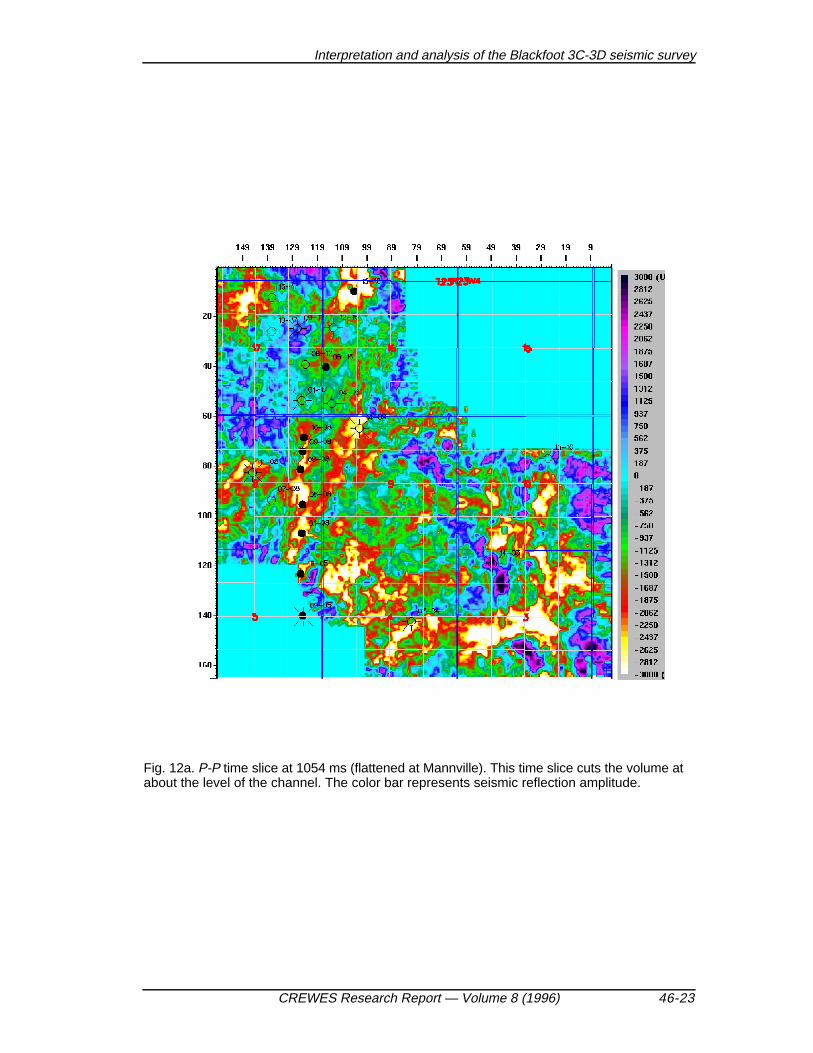
Figure 12a is the time slice at 1054 ms from 3-D P-P volume. The time slice cuts thevolume at about the level of the channel. The time slice in figure 12a shows anamplitude anomaly along the trend of oil wells (01-08 through 16-08) in the southernpart of the Glauconitic patch. However, the channel signature is non-unique, withbright amplitudes also occurring at the locations of regional wells (14-09, 11-08).Figure 12b is the time slice section of P-S data volume at 1560 ms, which is equivalentto the level of the channel. The color bar represents the seismic reflection amplitude.The structure removal in flattening the Mannville showed a high-amplitude valley-likefeature (the yellow/reds extend in the north-south direction across left central part of theimage) across the survey area on the P-S data. Regional wells lie outside thisinterpreted channel trend. Figure 13a is a P-P time slice at 1080 ms, which is just abovethe Mississippian surface and possibly shows a Detrital channel. Figure 13b is the timeslice of the P-S wave at same level. The reds/yellows and greens are seismic peaks(positive amplitude) and troughs (negative amplitude). The areas of color yellow have aweak seismic amplitude and the progressively darker reds indicate strengthening of theseismic amplitude. The greenish color running north-northeast to south on the left partof the image is also evident. It is significant that the P-S data appears to show thechannel trend more vividly than does the P-P data.
The comparison of figure 12a with figure 13a (or figure 12b with figure 13b)suggests that the development of the Glauconitic channel locally in this area mayassociated with the paleo-topography at Mississippian time. It is also important to notethat the elongate amplitude highs on the P-S time slice sections correlate to the welldata better than the P-P time slices.
Interpretation and analysis of the Blackfoot 3C-3D seismic survey
CREWES Research Report — Volume 8 (1996) 46-5
Isochron maps
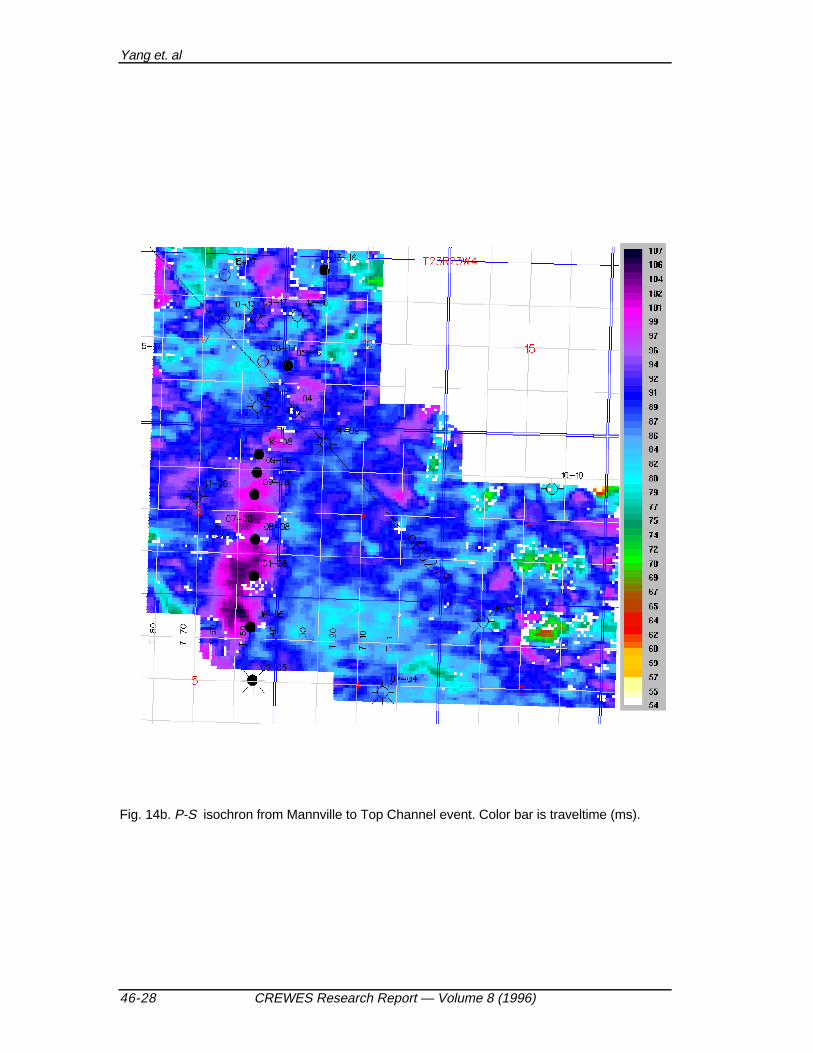
Figure 14a is a P-P isochron map from the Mannville to Top Channel event, andFigure 14b is the equivalent map for P-S data. The P-P data (Fig. 14a) shows drapeover the channel whereas the P-S data (Fig. 14b) shows an isochron thickening and noevidence of drape. It is interpreted that the Top Channel event on the P-S data hasdifferent tuning/interference effects than the P-P data has.
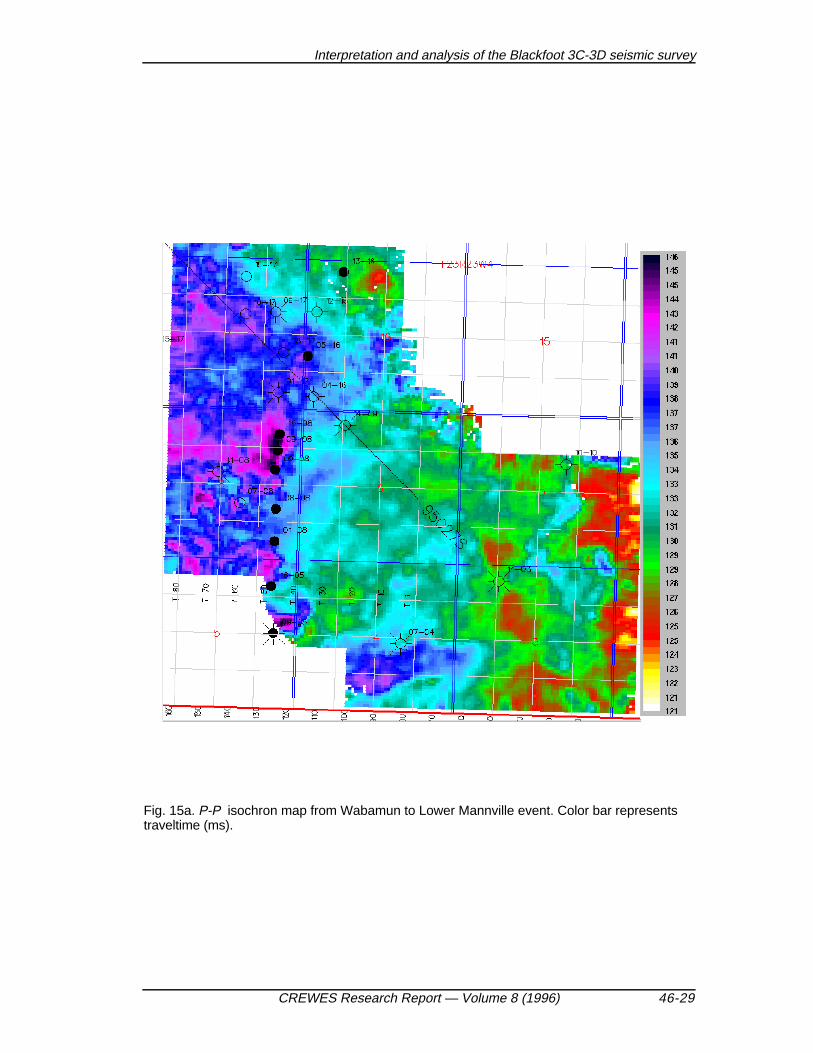
Figure 15a is the P-P isochron map of Wabamun to Lower Mannville and Figure15b is the equivalent P-S isochron map. Note that there is a distinct thickness trendrunning north-south on the P-P isochron and also a thinning on the P-S isochron in thesouth-central part of the area, along the production wells. Both thickness on P-Pisochron and thinning on P-S isochron are factors contributing to the lower Vp/Vsvalues along this trend, discussed in the next section.
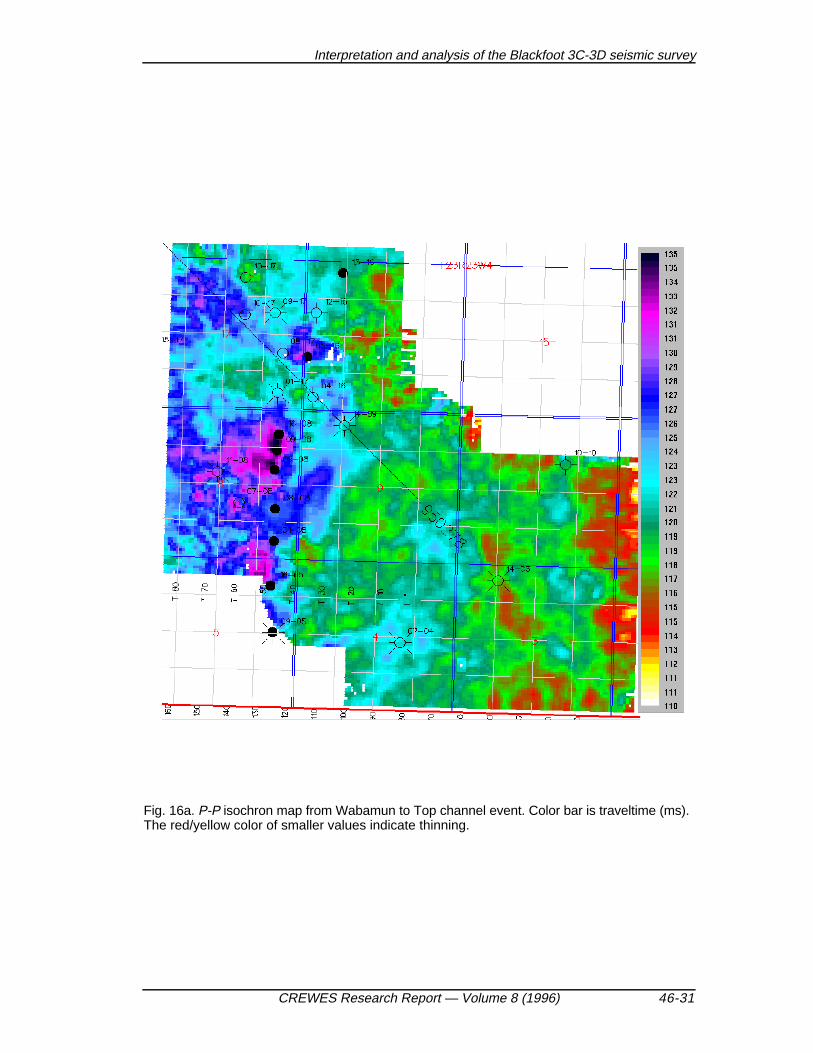
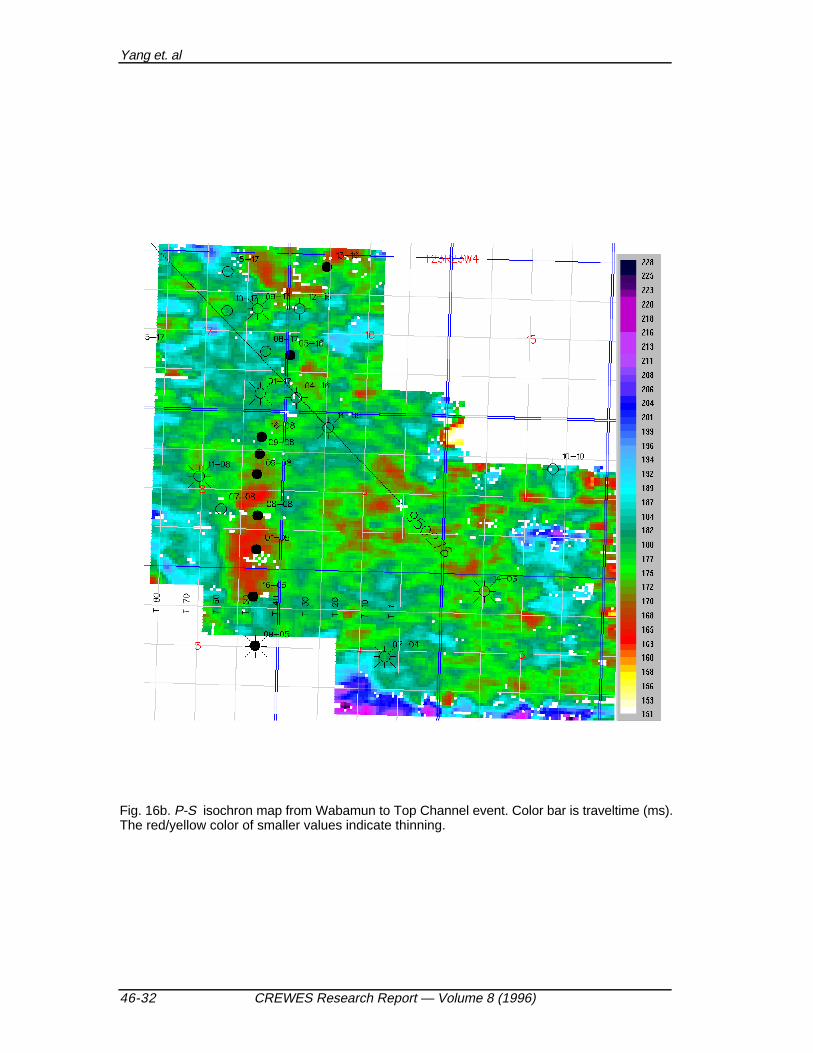
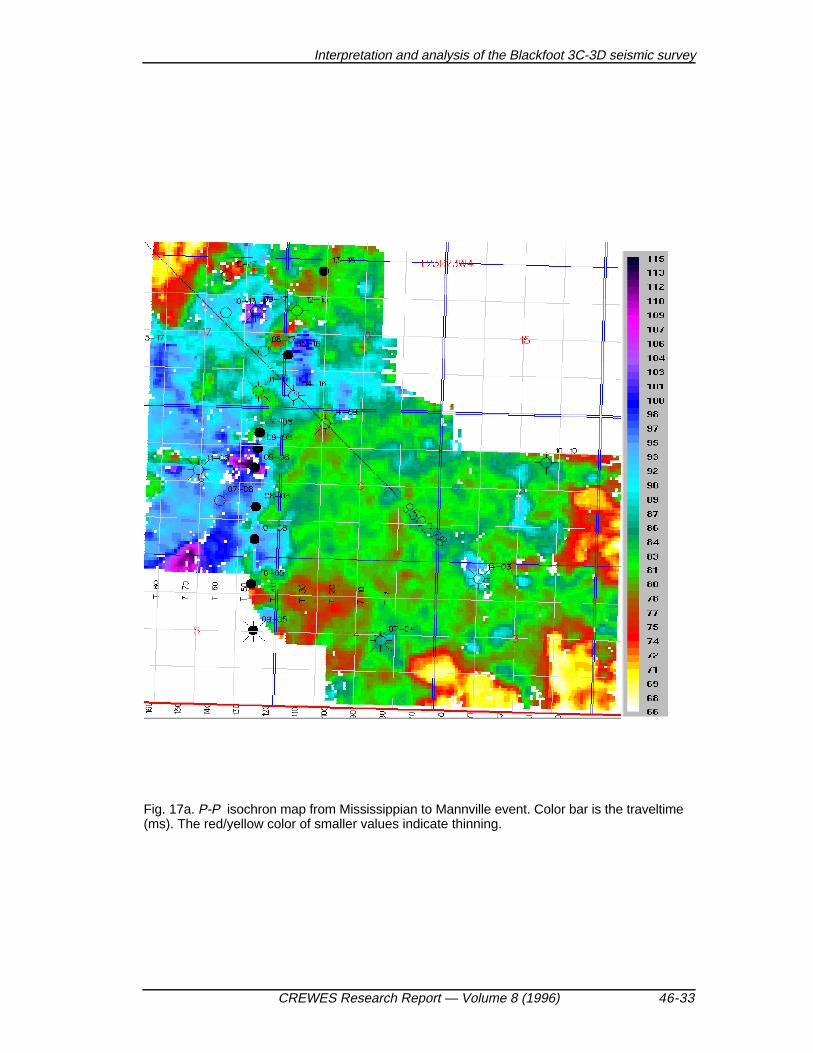
Figures 16a and 16b are the isochron maps of Wabamun to Top Channel event fromP-P and P-S respectively. Figures 17a and 17b are the isochron maps of Mississippianto Mannville event from P-P and P-S respectively. It is interesting to notice that thethickness on Figure 17b coincides with all the producing wells
Vp/Vs analysis
The Vp/Vs values across several horizon intervals were calculated using therelationship (Garotta, 1987):
V p / V s = 2 tps / tp p -1
where tps is the P-S isochron and tpp is the P-P isochron
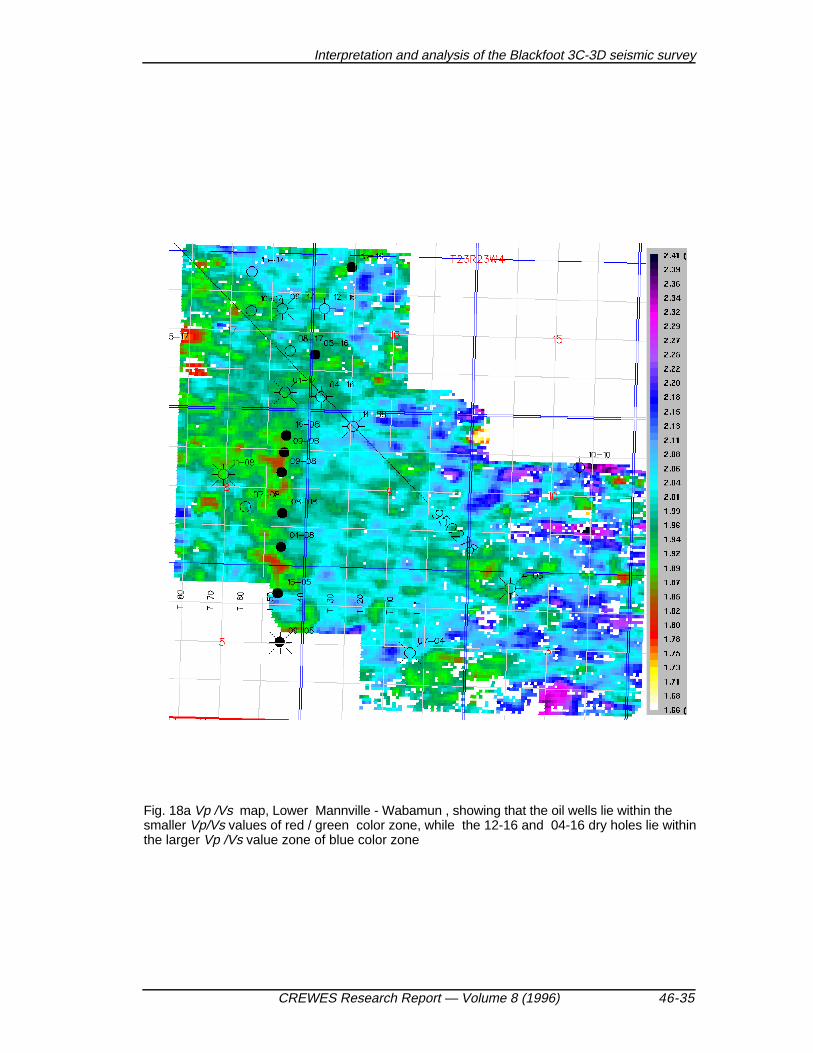
Some results of the Vp/Vs analysis are shown in Figure 18a (Wabamun to LowerMannville) and Figure 18b (Wabamun to Top Channel event). The red/yellow colorindicates the value smaller than 1.87 on Figure 18a and lower than 1.84 in Figure 18b.The Vp/Vs values are expected to have a wider range of values for a thinner intervalthan the thicker interval; this is what we see from figures 18a and 18b. If Vp/Vs isbeyond the expected range due to geological variations, it is an indication of mispicks,whereas reasonable values increase the confidence in the interpretation.
In Figures 18a and 18b, that 4-16 and 12-16 well positions lie within the zones ofhigher Vp/Vs (green/blue color zone), whereas the producing wells such as: 13-16, 5-16, 16-8, 102 / 9-8, 9-8, 8-8, 1-8 all lie in the zone of low Vp/Vs values (red / yellowcolor).
As to the lower target of Beaverhill Lake formation, the Vp/Vs distribution map frombasal Cambrian to Wabamun event is shown in figure 18c. Generally there is a decreasein Vp/Vs along the margins of the horst block.
Stratigraphic Amplitude Analysis
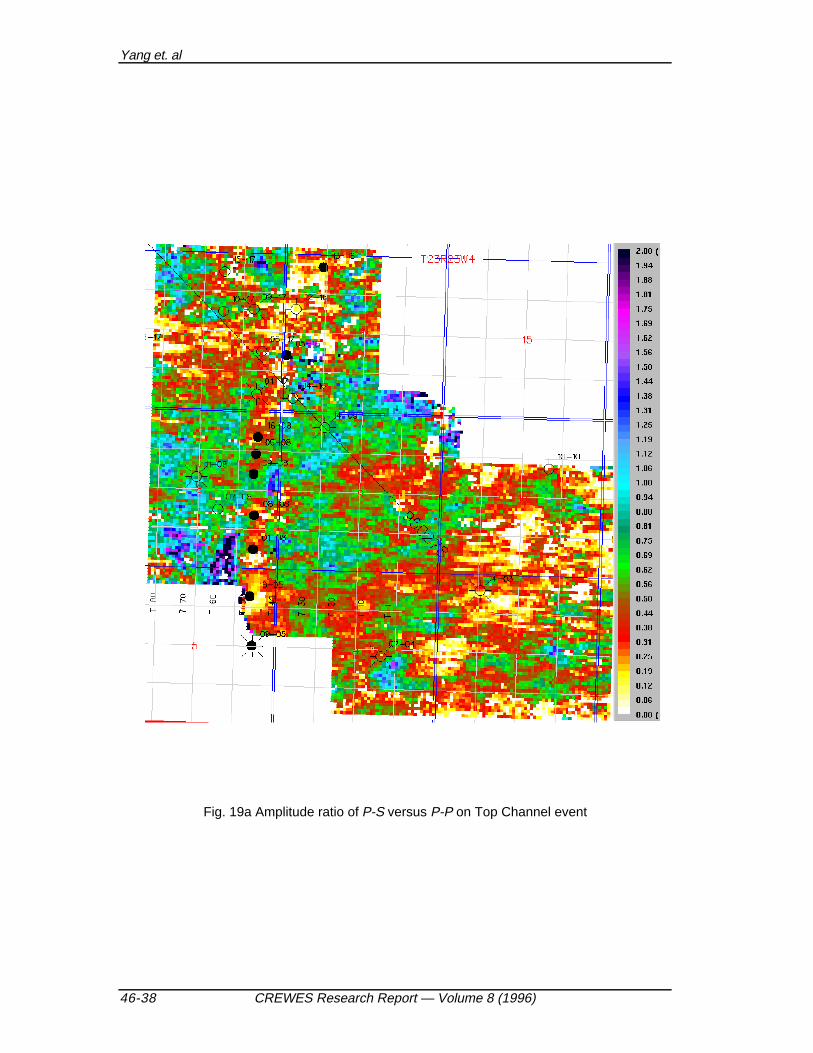
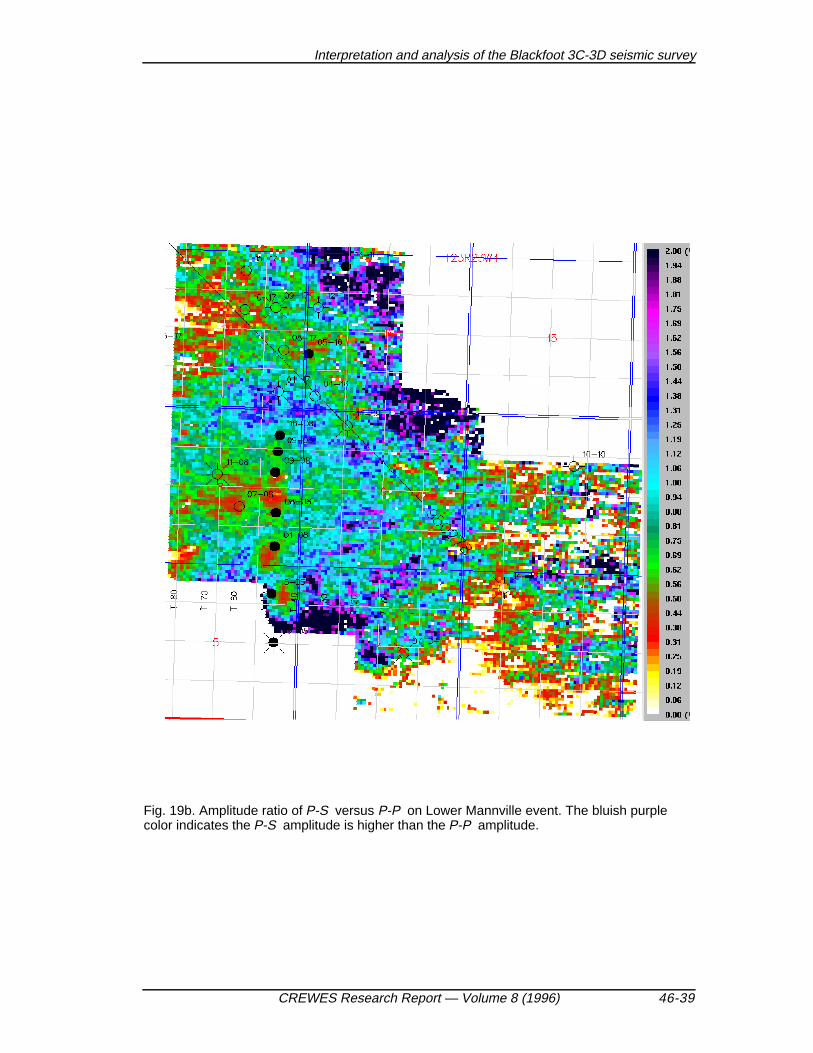
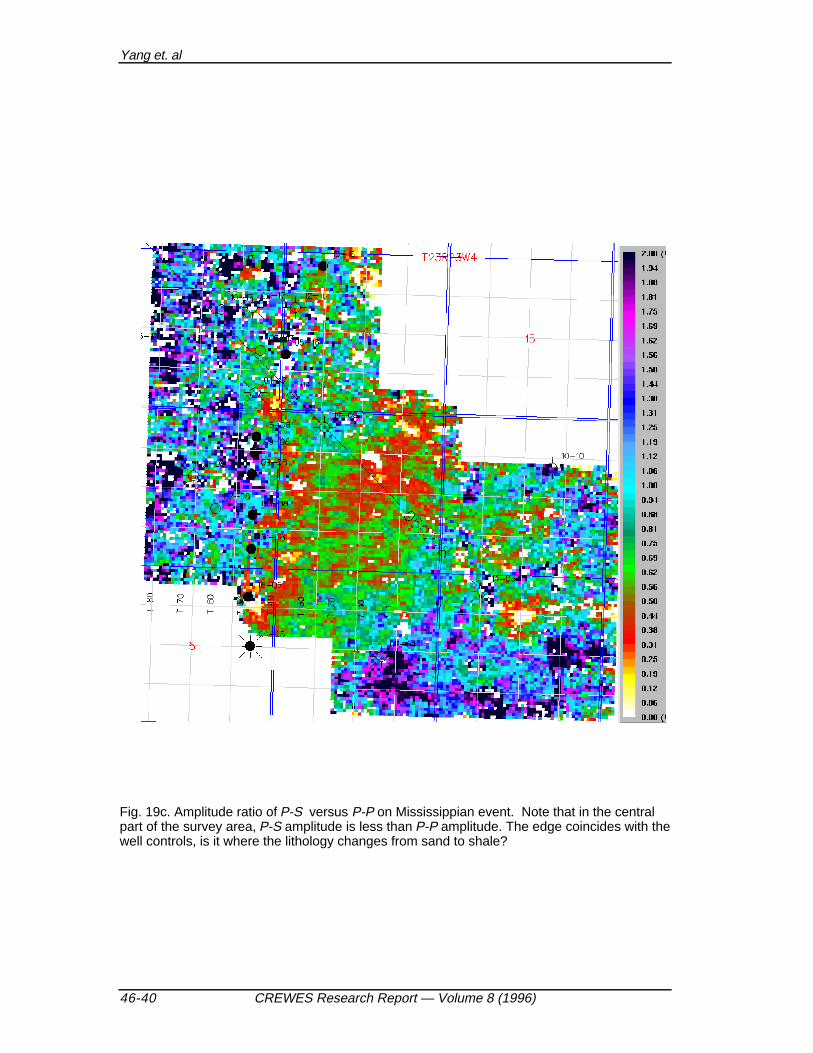
Fig. 19a. 19b. 19c show the amplitude ratio of P-S data to P-P data on Top Channelevent, Lower Mannville event, and Mississippian event respectively.
The amplitude of the seismic reflection can be altered by changes in caprockproperties (density, velocity, and lithology); changes in reservoir properties (caused bychange in porosity mineralogy, or fluid content); or changes in the geometry of the
Yang et. al
46-6 CREWES Research Report — Volume 8 (1996)
interface such as steep dips, faulting and fracturing. The lateral variations of theseamplitude ratio of P-S and P-P data maps show that there may have some anisotropypresence in the survey area. The clear edge on Figure 19c (amplitude ratio of P-S andP-P data at Mississippian time) may be an indication of transition zone of sand to shale.
DISCUSSION AND CONCLUSION
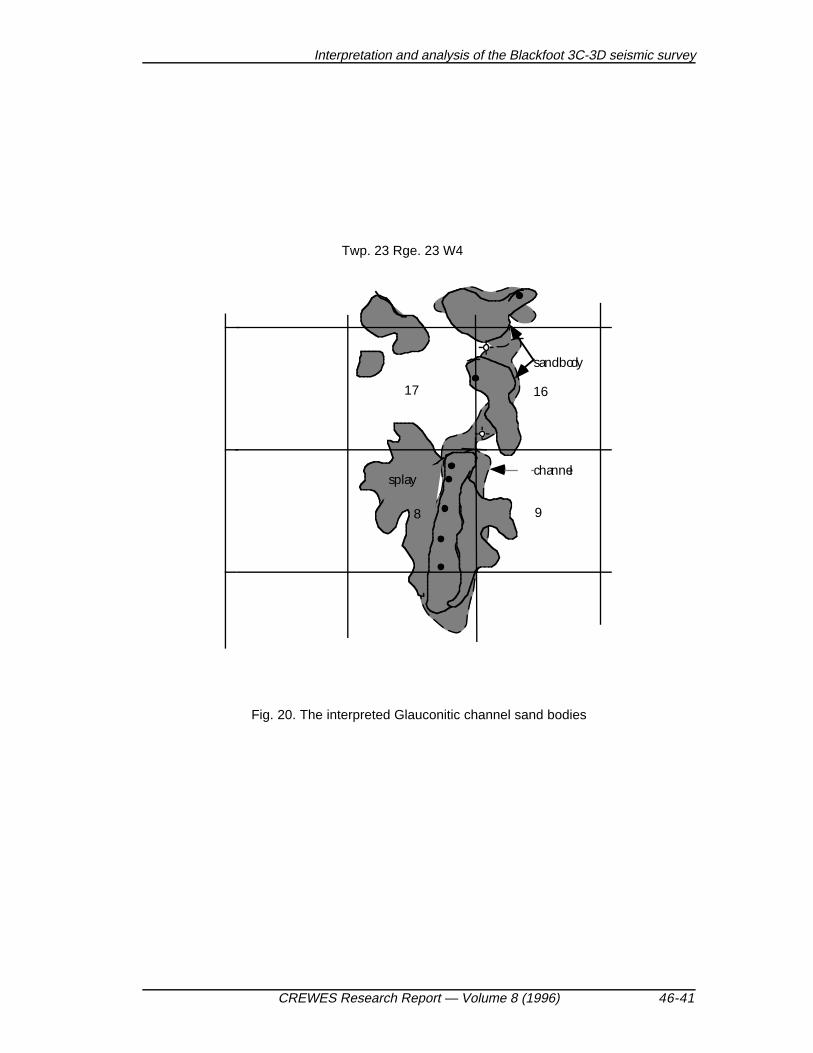
Figure 20 is the interpreted distribution of Glauconitic channel sand bodies inferredfrom the time slices, the amplitude maps (Figures 19a, 19b, and 19c) and Vp/Vs.analysis (Figures 18a and 18b). In general, the Glauconitic channel sand bodies areconcentrated in discrete bodies, and that only those sandstone bodies with favorablelocal structural disposition form reservoirs. The P-S data interpretation, particularlyisochron analysis, shows the channel trend clearly, and Vp/Vs analysis show areasinterpreted to be reservoir sands, which correlate spatially very well with the wellcontrol.
The interpretation of 3D-3D seismic data with well controls allows a structural andtime stratigraphic reconstruction of lithofacies in the Blackfoot field. The techniques ofmapping Vp/Vs, flattened time slices, and stratigraphic amplitude analysis has broughta new perspective to geophysical interpretation. The integration of both P- and S- wavedata increases our ability to view the valley fairway and delineate spatial distribution ofsand and shale in the area. We have also demonstrated that flattening to be a powerfulmethod of separating structure from stratigraphy so that a depositional surface may bereconstituted, permitting depositional features, such as bars and channels to befollowed in detail. We propose to further investigate the amplitude relationship betweenthe P-P and P-S data.
REFERENCES
Brown, Alistair.R., 1979, 3-D seismic survey gives better data, Oil and Gas Journal , 77, no. 45,. 57-71.
Brown, Alistair.R. and R.G. McBeath, 1980, 3-D seismic surveying for field development comes ofage, Oil & Gas Journal, 78, no. 46, 63-65.
Brown, Alistair R., Interpretation of three-dimensional seismic data, third edition, AAPG memoir 42 ,American Association of Petroleum Geologists.
Brown, Alistair R., C.G. Dahm and R.J. Graebner, 1982, A stratigraphic case history using three-dimensional seismic data in the Gulf of Thailand, Geophys. Prosp. , 29, 327-349.
Domenico, S. N. , 1984, Rock lithology an porosity determination from shear and compressionalwave velocity: Geophysics, 49, 1188 - 1195.
Garotta, R. , P. Marechal and M. Magesan, 1985, Two component acquisition as a routine procedurefor recording P-waves and converted waves. J. of the Canadian Society of ExplorationGeophysicists, 21, no. 1, 40 - 53.
Hardage, Bob A. , R.A. Levey, V. Pendleton, J. Simmons, and R. Edwon, 1994, A 3-D seismic casehistory evaluating fluvially deposited thin-bed reservoirs in a gas-producing property,Geophysics, 59, 11, 1650-1665.
Hautefeluille, A., and W.R. Cotton, 1979, Oil and Gas Journal, 77,. no. 45,. 72-79.Hopkins James M. et. at., 1991, Waterflood response of reservoirs in an estuarine valley fill: upper
Mannville G, U, and W pools, Little Bow Field, Alberta, Canada: AAPG 75 , no. 6, 1064-1088.
Hopkins, John C., Lawton, Don C., and Gunn, Jack D., 1987, Geological and seismic evaluation of aLower Mannville valley system: Alderson Prospect, Rolling Hills, southeastern Alberta:Bulletin of Canadian Petroleum Geology, 35, 296-315.
Ikwuakor, K. C. , 1988, Vp / Vs revisited: pitfalls and new interpretation techniques, World Oil,
September, 1988, 41 - 46.

Interpretation and analysis of the Blackfoot 3C-3D seismic survey
CREWES Research Report — Volume 8 (1996) 46-7
Lawton, Don C, Robert R. Stewart, Andreas Cordsen, and Stacey Hrycak, 1995, Advances in 3C-3Ddesign for converted waves: CREWES project Research Report, v. 7, 43. 1 - 43.41.
Miller, Susan L. M. Aydemir, M. E. and G.F. Margrave, 1995, Preliminary interpretation of P-P andP-S seismic data from the Blackfoot broad-band survey: CREWES project Research Report, v.7, 42. 1 - 42.18.
Rosenthal, Lorne, 1988, Wave dominated shorelines and incised channel trends: Lower CretaceousGlauconite formation, West-Central Alberta, , Sequences, Stratigraphy, sedimentology:surface and subsurface. Canadian Society of Petroleum Geologists, Memoir 15, 207-220.
Strobl R. S., 1988, The effects of sea-level fluctuations on prograding shorelines and estuarine valley-fill sequences in the Glauconitic Member, Medicine River Field and adjacent areas, CanadianSoc. of Petroleum Geol. Memoir 15 , Sequences, Stratigraphy, Sedimentology: Surface andSubsurface. 221-236.
Tatham, R. H. , 1982, Vp / Vs and lithology: Geophysics, 47, 336 - 344.
Tatham, R. H. , and P.L. Stoffa, 1976, Vp / Vs - A potential hydrocarbon indicator: Geophysics, 41 ,
895 - 921.Tatham, R. H. and M. D. McCormack, 1991, Multicomponent Seismology in Petroleum Exploration.
Investigations in Geophysics Series Vol. 6. Society of Exploration Geophysics.Tegland, E.R., 1977, 3-D seismic techniques boost field development, Oil and Gas Journal , 75 , no.
37, 79-82.Wood, James M. and John C. Hopkins, 1989, Reservoir sandstone bodies in estuarine valley fill:
Lower Cretaceous Glauconitic Member, Little Bow Field, Alberta, Canada, AAPG Bulletin, .73, no. 11, 1361-1382.
Wood, James M. and John C. Hopkins, 1992, Traps associated with paleovalleys and interfluves in anunconformity bounded sequence: Lower Cretaceous Glauconitic Member, southern Alberta,Canada: AAPG Bulletin 76, 904-926.
Yang et. al
46-8 CREWES Research Report — Volume 8 (1996)
P-P
P-S
16-5
1-8
8-8
102/
9-8
9-8
16-8
1-17
16-8
102/
9-8
9-8
8-8
1-8
16-5
1-17
13-1
612
-16
4-16
5-16
13-1
612
-16
4-16
Vik
ing
Man
nvill
eLo
wer
Man
nvill
eto
p ch
anne
lM
issi
ssip
pian
Wab
amun
Man
nvill
eLo
wer
Man
nvill
eto
p ch
anne
lM
issi
ssip
pian
Wab
amun
Fig
. 3.
An
arbi
trar
y N
-S s
eism
ic li
ne a
cros
s m
ost o
f the
wel
ls in
the
area
Fig
. 4.
P-S
sei
smic
line
acr
oss
sam
e w
ells
as
in F
igur
e 3
Time (ms) Time (ms)
Interpretation and analysis of the Blackfoot 3C-3D seismic survey
CREWES Research Report — Volume 8 (1996) 46-9
Fig. 5a. P-P time structure map, basal Cambrian event. The red/yellow color zones indicatethe lower traveltimes or strucural highs, and delineate a horst block (width greater than a mile)in the south-central part of the area. This structure map shows the dip down to west, and witha slight change of dip direction near the corner of sections 8, 9, 16, and 17. A normal faulttrends north-south near the south-east side of the survey area. Color bar is reflection time(ms).

Yang et. al
46-10 CREWES Research Report — Volume 8 (1996)
Fig. 5b. P-S time structure map, basal Cambrian time. The red/yellow area shows a horst blockin the south-central part of the area. More local variations are visible than shown in figure 5a.Color bar is reflection time (ms).

Interpretation and analysis of the Blackfoot 3C-3D seismic survey
CREWES Research Report — Volume 8 (1996) 46-11
Fig. 6a. P-P time structure map, Wabamun event. Color bar is reflection time (ms).

Yang et. al
46-12 CREWES Research Report — Volume 8 (1996)
Fig. 6b. P-S time structure map, Wabamun event. Color bar is reflection time (ms).

Interpretation and analysis of the Blackfoot 3C-3D seismic survey
CREWES Research Report — Volume 8 (1996) 46-13
Fig. 7a. P-P time structure, Mississippian event. Color bar is reflection time (ms).
Yang et. al
46-14 CREWES Research Report — Volume 8 (1996)
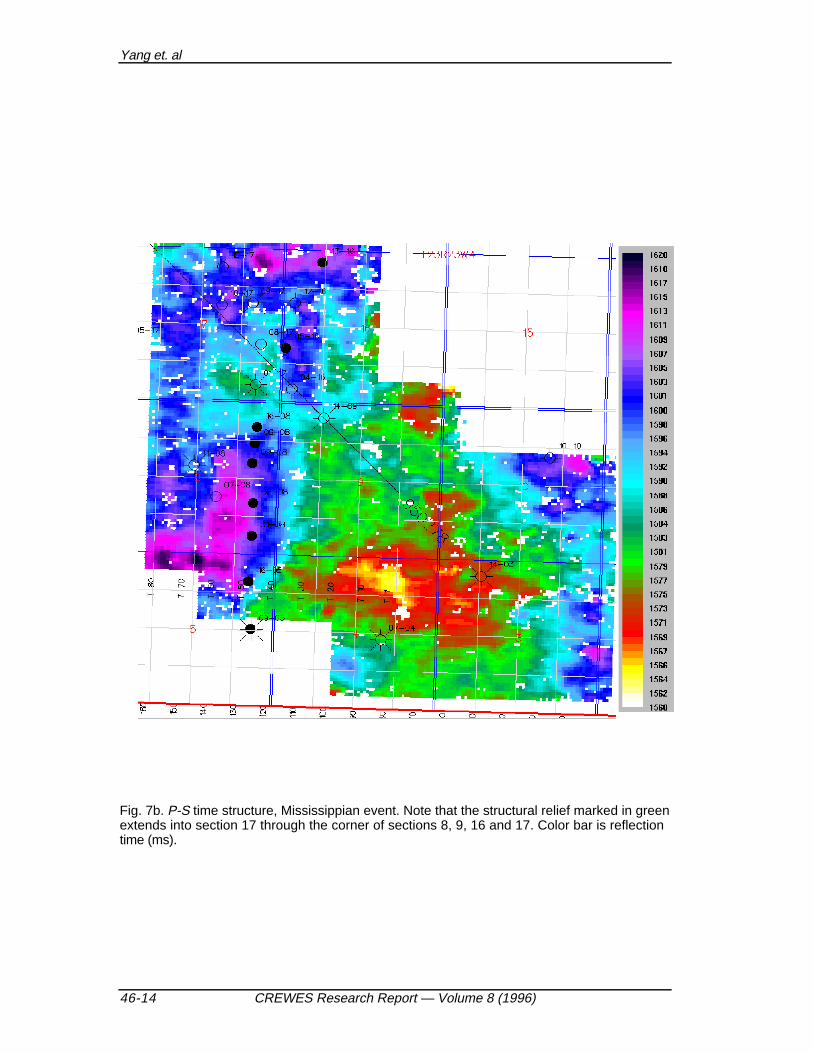
Fig. 7b. P-S time structure, Mississippian event. Note that the structural relief marked in greenextends into section 17 through the corner of sections 8, 9, 16 and 17. Color bar is reflectiontime (ms).

Interpretation and analysis of the Blackfoot 3C-3D seismic survey
CREWES Research Report — Volume 8 (1996) 46-15
Fig. 8a. P-P time structure, top channel event. The red/yellow color zones indicate shortertraveltime or a structural high. Color bar is reflection time (ms).
Yang et. al
46-16 CREWES Research Report — Volume 8 (1996)
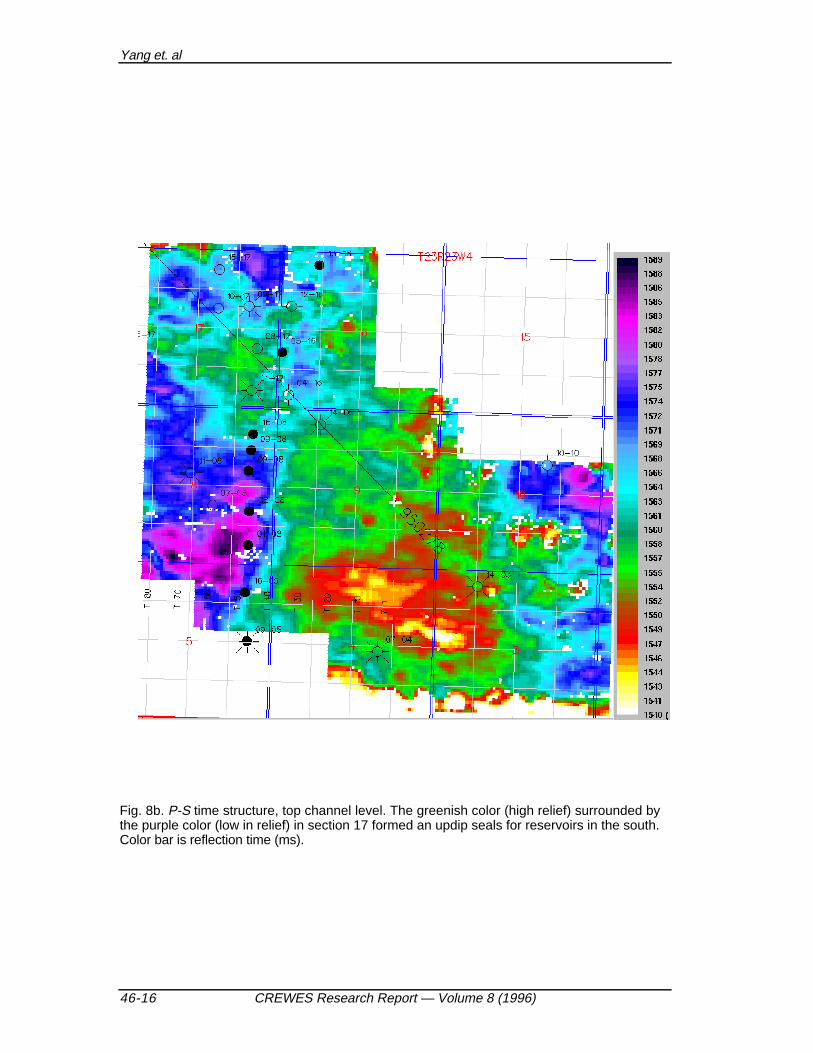
Fig. 8b. P-S time structure, top channel level. The greenish color (high relief) surrounded bythe purple color (low in relief) in section 17 formed an updip seals for reservoirs in the south.Color bar is reflection time (ms).
Interpretation and analysis of the Blackfoot 3C-3D seismic survey
CREWES Research Report — Volume 8 (1996) 46-17
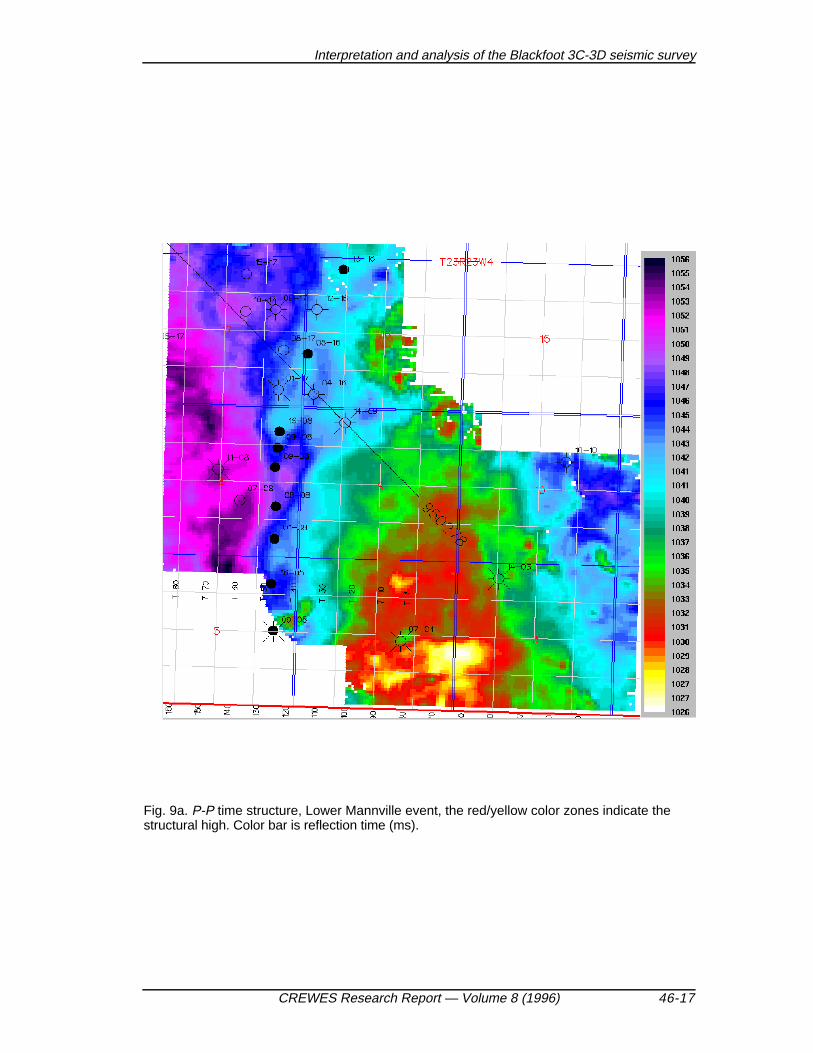
Fig. 9a. P-P time structure, Lower Mannville event, the red/yellow color zones indicate thestructural high. Color bar is reflection time (ms).
Yang et. al
46-18 CREWES Research Report — Volume 8 (1996)
Fig. 9b. P-S time structure, Lower Mannville event. Color bar is reflection time (ms).
Interpretation and analysis of the Blackfoot 3C-3D seismic survey
CREWES Research Report — Volume 8 (1996) 46-19
Fig. 10a. P-P time structure, Mannville event, the red/yellow color zones indicate thestructural high. Color bar is reflection time (ms).
Yang et. al
46-20 CREWES Research Report — Volume 8 (1996)
Fig. 10b. P-S time structure, Mannville event, the red/yellow color zones indicate thestructural high. Color bar is reflection time (ms).
Interpretation and analysis of the Blackfoot 3C-3D seismic survey
CREWES Research Report — Volume 8 (1996) 46-21
Fig. 11a. P-P time structure, Viking event. Color bar is reflection time (ms).

Yang et. al
46-22 CREWES Research Report — Volume 8 (1996)
Fig. 11b. P-S time structure, Viking event. Color bar is the reflection time (ms).
Interpretation and analysis of the Blackfoot 3C-3D seismic survey
CREWES Research Report — Volume 8 (1996) 46-23
Fig. 12a. P-P time slice at 1054 ms (flattened at Mannville). This time slice cuts the volume atabout the level of the channel. The color bar represents seismic reflection amplitude.

Yang et. al
46-24 CREWES Research Report — Volume 8 (1996)
Fig. 12b. P-S time slice section at 1560 ms (flattened at Mannville), equivalent to the level ofthe channel. One can clearly see the yellow/reds extend in the north-south direction acrossthe left central half of the image. The progressively darker reds indicate strengthening of theseismic amplitude and the areas of color yellow have the strongest seismic amplitude.Reds/yellows and greens are seismic peaks and troughs. The Glauconitic channel (or valley)has low sinuosity with an estimation of width near 400 m. Regional wells lie outside thisinterpreted channel trend.

Interpretation and analysis of the Blackfoot 3C-3D seismic survey
CREWES Research Report — Volume 8 (1996) 46-25
Fig. 13a. P-P time slice section at 1080 ms (flattened at Mannville). This time slice cuts thevolume at about the level of a possible Detrital channel just above the Mississippian surface.

Yang et. al
46-26 CREWES Research Report — Volume 8 (1996)
Fig. 13b. P-S time slice section at 1590 ms (flattened at Mannville), equivalent to the level of achannel just above the Mississippian surface. The greenish color running north-northeast tosouth on the left part of the image is evident. Color bar is amplitude.

Interpretation and analysis of the Blackfoot 3C-3D seismic survey
CREWES Research Report — Volume 8 (1996) 46-27
Fig. 14a. P-P isochron from Mannville to top channel events. Color bar is traveltime (ms).
Yang et. al
46-28 CREWES Research Report — Volume 8 (1996)
Fig. 14b. P-S isochron from Mannville to Top Channel event. Color bar is traveltime (ms).
Interpretation and analysis of the Blackfoot 3C-3D seismic survey
CREWES Research Report — Volume 8 (1996) 46-29
Fig. 15a. P-P isochron map from Wabamun to Lower Mannville event. Color bar representstraveltime (ms).

Yang et. al
46-30 CREWES Research Report — Volume 8 (1996)
Fig. 15b. P-S isochron map from Wabamun to Lower Mannville. Note the thickness trendrunning north-south direction. Color bar represents traveltime (ms).
Interpretation and analysis of the Blackfoot 3C-3D seismic survey
CREWES Research Report — Volume 8 (1996) 46-31
Fig. 16a. P-P isochron map from Wabamun to Top channel event. Color bar is traveltime (ms).The red/yellow color of smaller values indicate thinning.
Yang et. al
46-32 CREWES Research Report — Volume 8 (1996)
Fig. 16b. P-S isochron map from Wabamun to Top Channel event. Color bar is traveltime (ms).The red/yellow color of smaller values indicate thinning.
Interpretation and analysis of the Blackfoot 3C-3D seismic survey
CREWES Research Report — Volume 8 (1996) 46-33
Fig. 17a. P-P isochron map from Mississippian to Mannville event. Color bar is the traveltime(ms). The red/yellow color of smaller values indicate thinning.

Yang et. al
46-34 CREWES Research Report — Volume 8 (1996)
Fig. 17b. P-S isochron map from Mississippian to Mannville event. Color bar is traveltime (ms).The red/yellow color of smaller values indicate thinning.
Interpretation and analysis of the Blackfoot 3C-3D seismic survey
CREWES Research Report — Volume 8 (1996) 46-35
Fig. 18a Vp /Vs map, Lower Mannville - Wabamun , showing that the oil wells lie within thesmaller Vp/Vs values of red / green color zone, while the 12-16 and 04-16 dry holes lie withinthe larger Vp /Vs value zone of blue color zone

Yang et. al
46-36 CREWES Research Report — Volume 8 (1996)
Fig. 18b. Vp /Vs map, top channel event - Wabamun , showing that the oil wells lie within thesmaller Vp /Vs values of red / green color zone, while the 12-16 and 04-16 dry holes liewithin the larger Vp /Vs value zone of blue color zone

Interpretation and analysis of the Blackfoot 3C-3D seismic survey
CREWES Research Report — Volume 8 (1996) 46-37
Fig. 18c. Vp /Vs map, basal Cambrian time - Wabamun , showing lower Vp/Vs values alongthe margins of the horst block.
Yang et. al
46-38 CREWES Research Report — Volume 8 (1996)
Fig. 19a Amplitude ratio of P-S versus P-P on Top Channel event
Interpretation and analysis of the Blackfoot 3C-3D seismic survey
CREWES Research Report — Volume 8 (1996) 46-39
Fig. 19b. Amplitude ratio of P-S versus P-P on Lower Mannville event. The bluish purplecolor indicates the P-S amplitude is higher than the P-P amplitude.
Yang et. al
46-40 CREWES Research Report — Volume 8 (1996)
Fig. 19c. Amplitude ratio of P-S versus P-P on Mississippian event. Note that in the centralpart of the survey area, P-S amplitude is less than P-P amplitude. The edge coincides with thewell controls, is it where the lithology changes from sand to shale?
Interpretation and analysis of the Blackfoot 3C-3D seismic survey
CREWES Research Report — Volume 8 (1996) 46-41
splay
sand body
channel
8 9
17 16
Twp. 23 Rge. 23 W4
Fig. 20. The interpreted Glauconitic channel sand bodies