Internet Traffic Trends - ausnog.net
31
Internet Traffic Trends A View from 67 ISPs AUSNOG Sydney, Australia August 21, 2008 Danny McPherson [email protected] Craig Labovitz [email protected] Scott Iekel-Johnson [email protected] Haakon Ringberg ([email protected] )
Transcript of Internet Traffic Trends - ausnog.net
Internet Traffic TrendsA View from 67 ISPs
AUSNOGSydney, AustraliaAugust 21, 2008
Danny McPherson [email protected]
Craig Labovitz [email protected] Iekel-Johnson [email protected]
Haakon Ringberg ([email protected])
State of Internet Statistics
• Lack of global, quantitative Internet traffic studies– Some single ISP traffic research and commercial
datasets (e.g. Akamai, Google, etc.)– Lots of BGP data and many analyst reports– But last global traffic data from 1995 ARTS report
• Significant open engineering / research questions– How is the Internet traffic evolving?– Am I the only ISP seeing this attack?– Is growth of application X local or Internet wide?

Internet Traffic Project
• Goal: Provide first global view of Internet trafficand attack trends
• Leverage commercial probe deployments– Pool of 2,500+ Flow / DPI collectors– Across 250 ISPs / Content Provider / Higher Ed
• Internet scale data collection– Traffic, DPI, Mitigation and Security datasets– Geographically and topologically diverse
Internet Traffic Project
• Service operational and research interests• Outgrowth Fingerprint Sharing Initiative (45
publicly disclosed participants) and SecuritySurvey
• Data from explicit voluntary anonymous datasharing agreement with ISPs
• Research Partners– Arbor, University of Michigan, Princeton (Intern)– And 78 customers (and growing)
• Initial / preliminary presentation of data
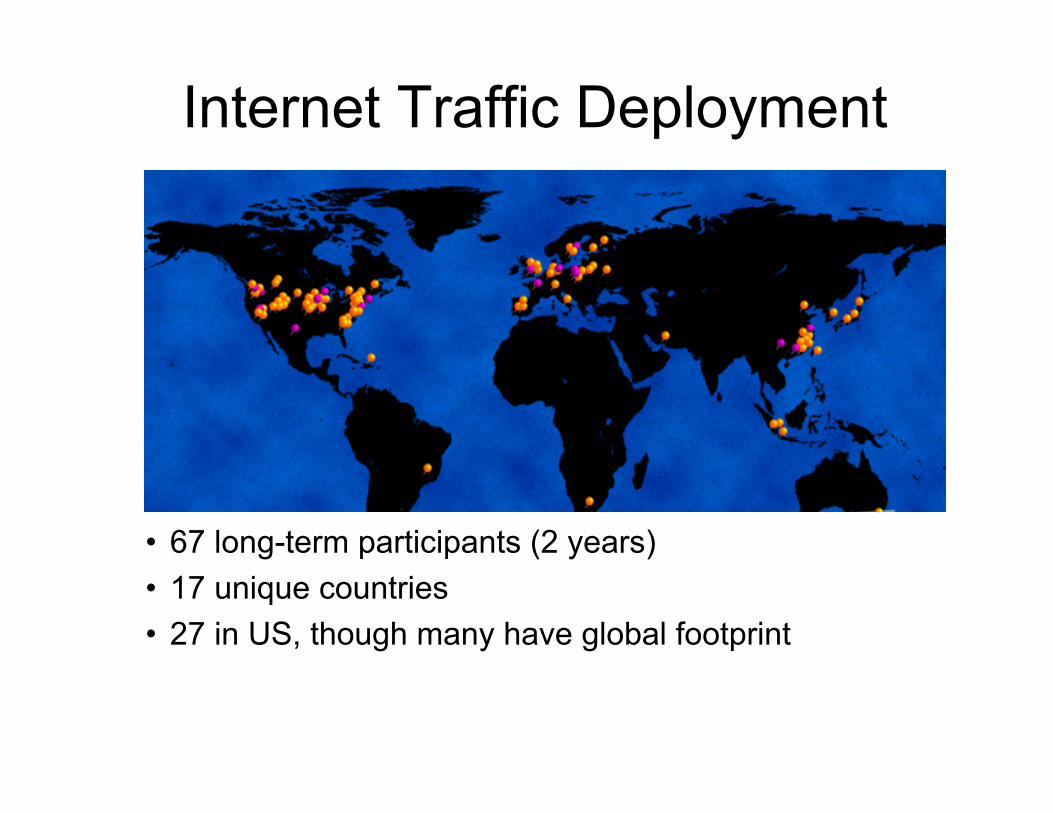
Internet Traffic Deployment
• 67 long-term participants (2 years)• 17 unique countries• 27 in US, though many have global footprint
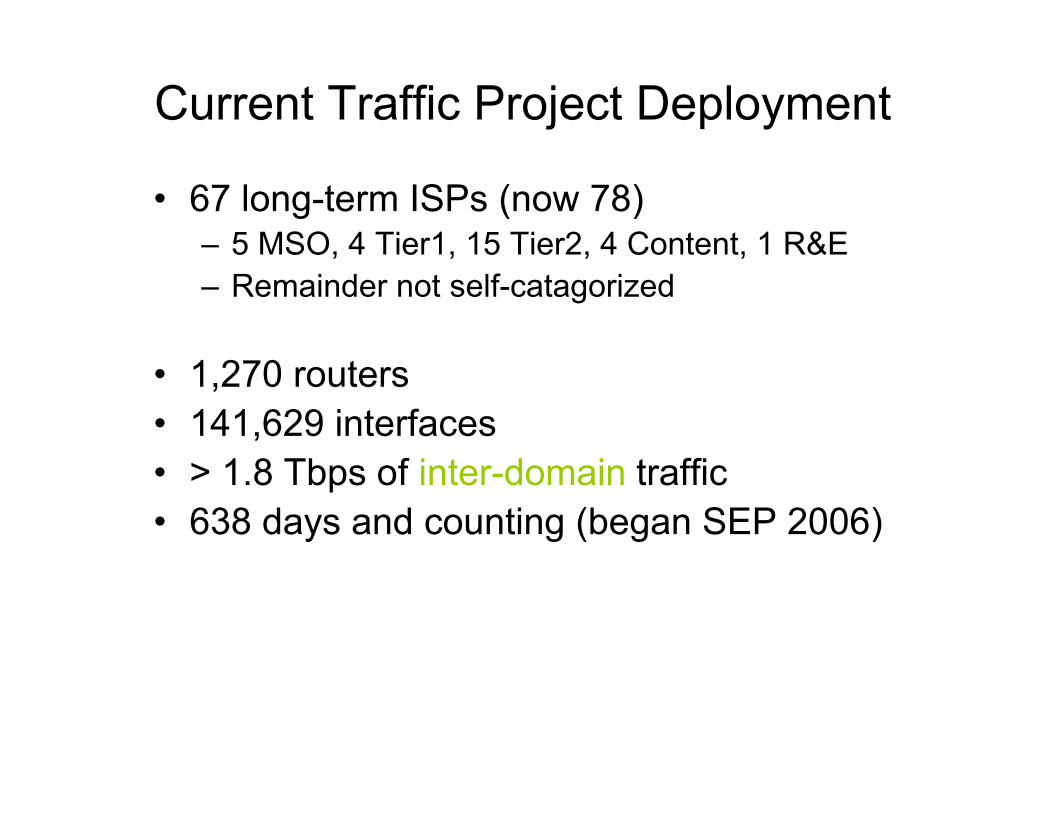
Current Traffic Project Deployment
• 67 long-term ISPs (now 78)– 5 MSO, 4 Tier1, 15 Tier2, 4 Content, 1 R&E– Remainder not self-catagorized
• 1,270 routers• 141,629 interfaces• > 1.8 Tbps of inter-domain traffic• 638 days and counting (began SEP 2006)
Typical ISP Deployment
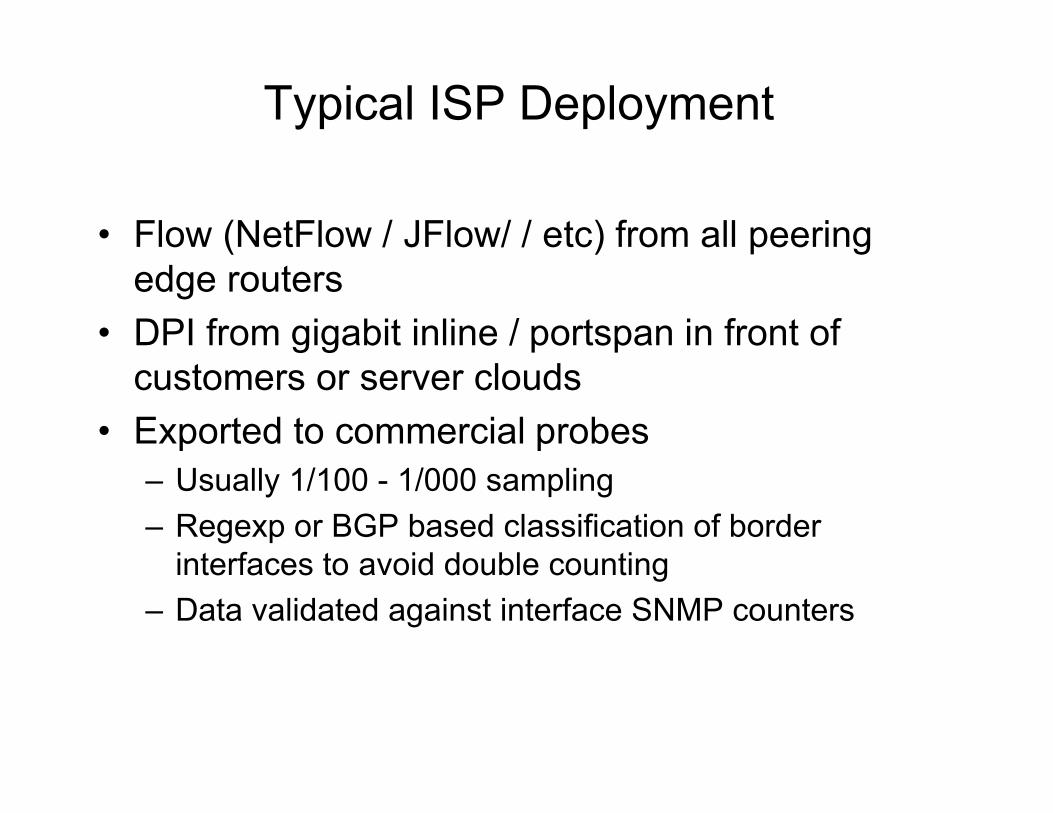
• Flow (NetFlow / JFlow/ / etc) from all peeringedge routers
• DPI from gigabit inline / portspan in front ofcustomers or server clouds
• Exported to commercial probes– Usually 1/100 - 1/000 sampling– Regexp or BGP based classification of border
interfaces to avoid double counting– Data validated against interface SNMP counters

Probe Data Sources
• Five minute traffic samples– Traffic In/out of network (subset of backbone traffic)– Cross-products based on top N protocols, ASNs, ports,
applications, etc.• Traffic anomaly data
– Combination protocol signatures, behavior and statistical variance from baselines
– Distinguish Attack versus Flash Crowd• Annotations and mitigation status
• Self-Categorization– Tier1/2/3, Content, High Ed, etc– Predominant geographic coverage area
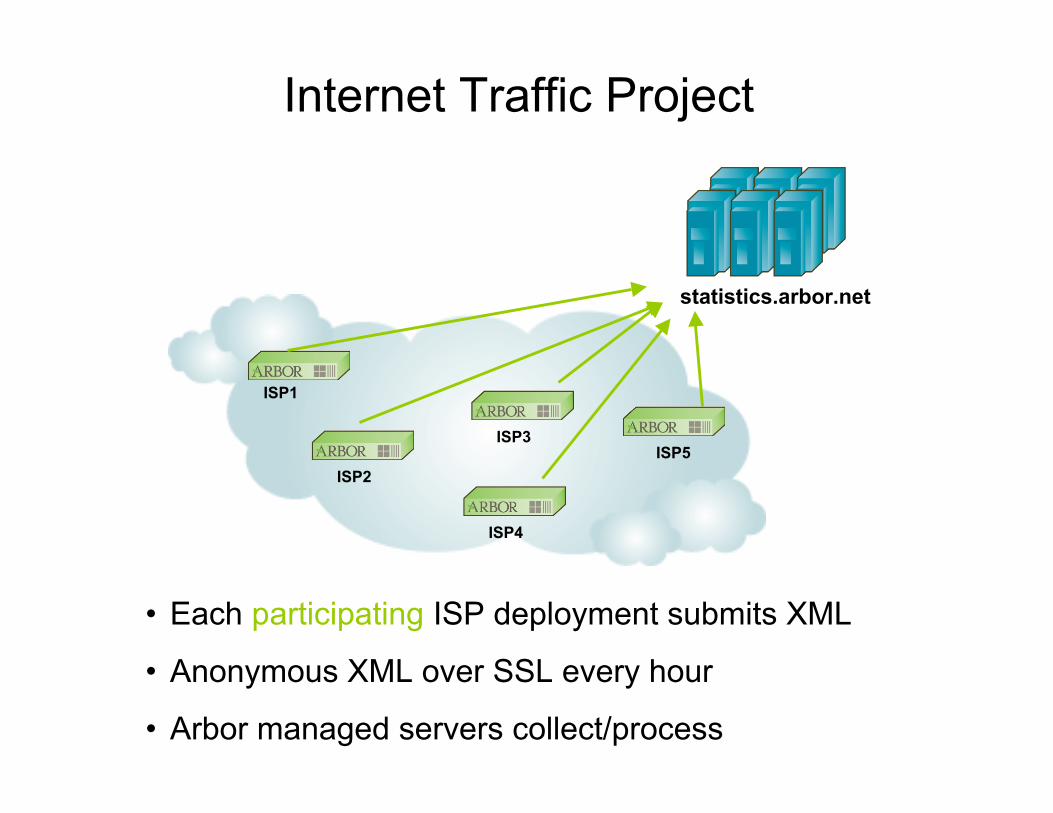
Internet Traffic Project
statistics.arbor.net
ISP1
ISP2
ISP3
ISP4
ISP5
• Each participating ISP deployment submits XML
• Anonymous XML over SSL every hour
• Arbor managed servers collect/process
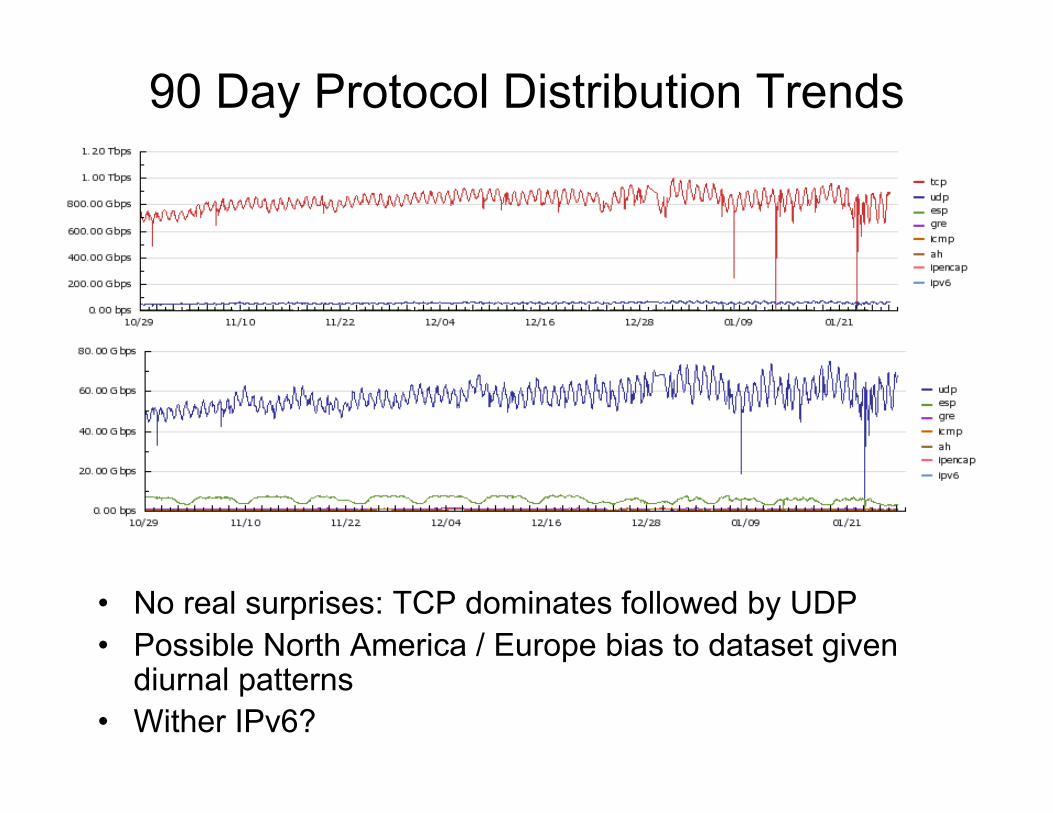
90 Day Protocol Distribution Trends
• No real surprises: TCP dominates followed by UDP• Possible North America / Europe bias to dataset given
diurnal patterns• Wither IPv6?
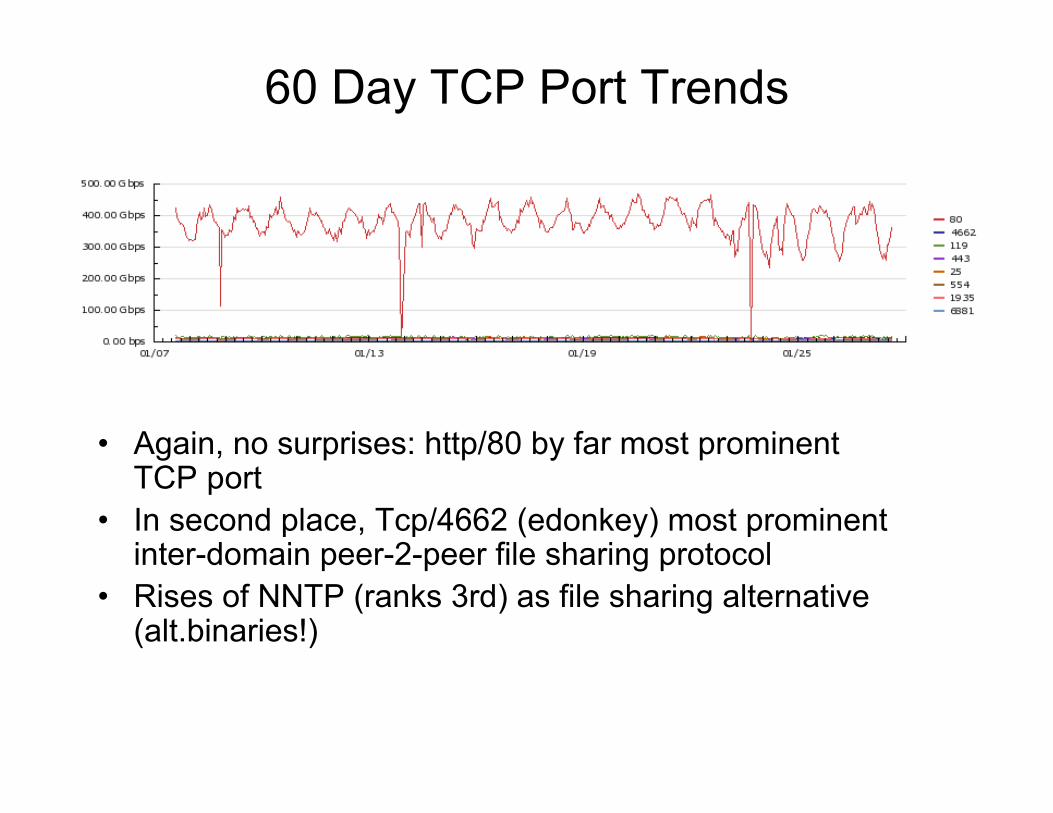
60 Day TCP Port Trends
• Again, no surprises: http/80 by far most prominentTCP port
• In second place, Tcp/4662 (edonkey) most prominentinter-domain peer-2-peer file sharing protocol
• Rises of NNTP ( ranks 3rd) as file sharing alternative(alt.binaries!)
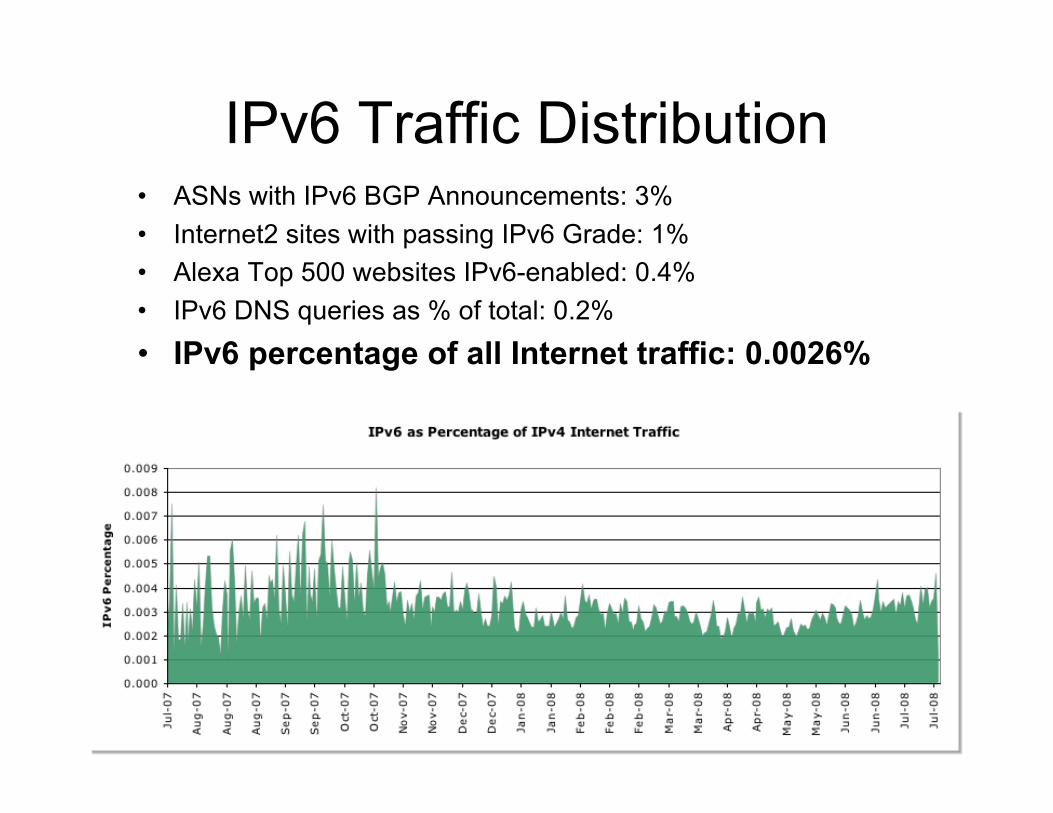
IPv6 Traffic Distribution• ASNs with IPv6 BGP Announcements: 3%• Internet2 sites with passing IPv6 Grade: 1%• Alexa Top 500 websites IPv6-enabled: 0.4%• IPv6 DNS queries as % of total: 0.2%
• IPv6 percentage of all Internet traffic: 0.0026%

Aggregate IPv6 Traffic• Since July 2007, IPv6 traffic has grown by
nearly a factor of 5 to an average of 100 Mbpsper day.
• BGP tables show an even larger proportionalgrowth. Though not a landslide of adoption, itis still something.
Teredo, Port Obfuscation, etc..• If port obfuscation or related techniques are
employed we’re held captive to that, as ourobservations *here* are based solely on Network andTransport layer data
• Teredo traffic upticks have been observed, new chartas of yesterday below. If not using well-known ports -well, yes, we realize that’s not reported
• Only 14 deployments have observed any port 3544control traffic, and of those only two saw a significantamount. The rest saw only kbps, and had weeks ofnone subsequently
• Some observable upticks as a result of new softwarereleases, industry events, etc.. (e.g., uTorrent, IETF)
• IPv6 here still miniscule compared to aggregate
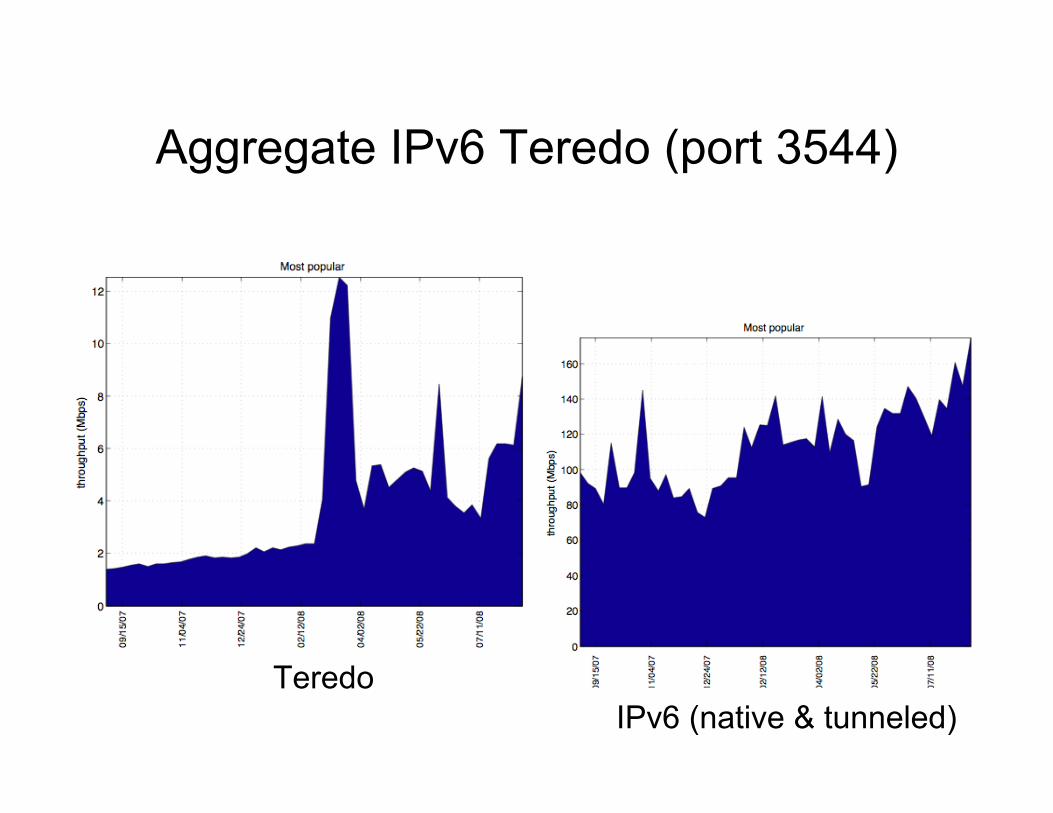
Aggregate IPv6 Teredo (port 3544)
TeredoIPv6 (native & tunneled)
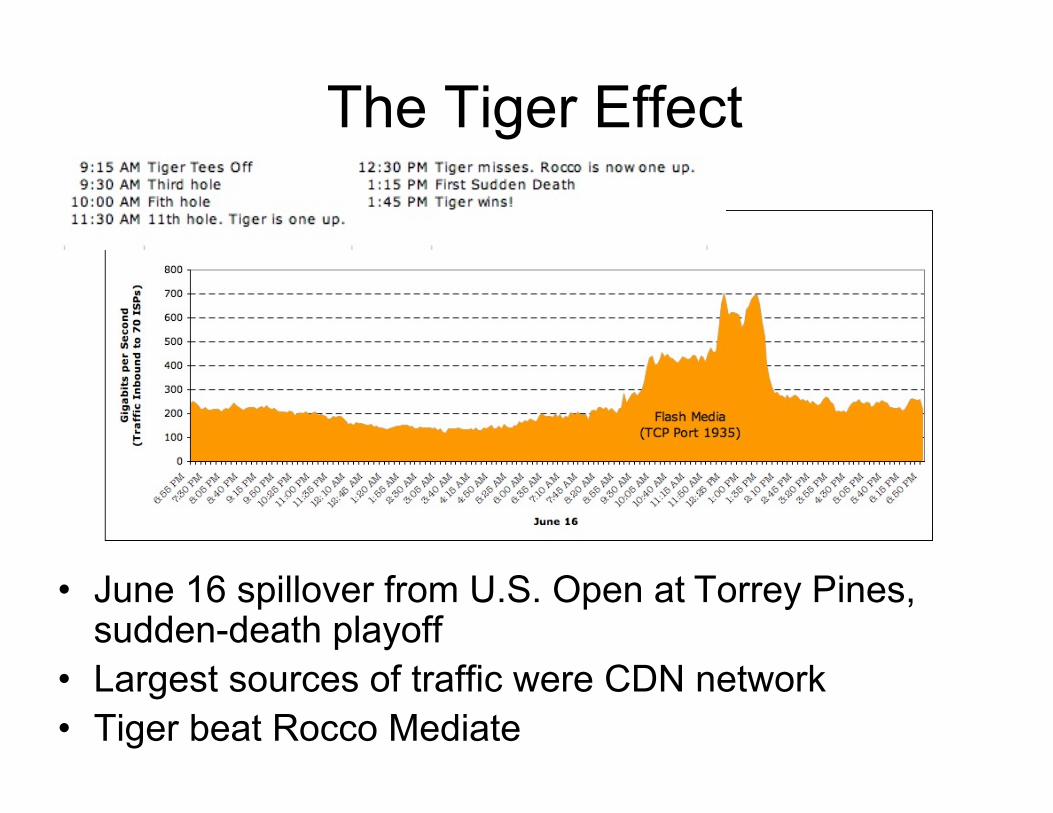
The Tiger Effect
• June 16 spillover from U.S. Open at Torrey Pines,sudden-death playoff
• Largest sources of traffic were CDN network• Tiger beat Rocco Mediate
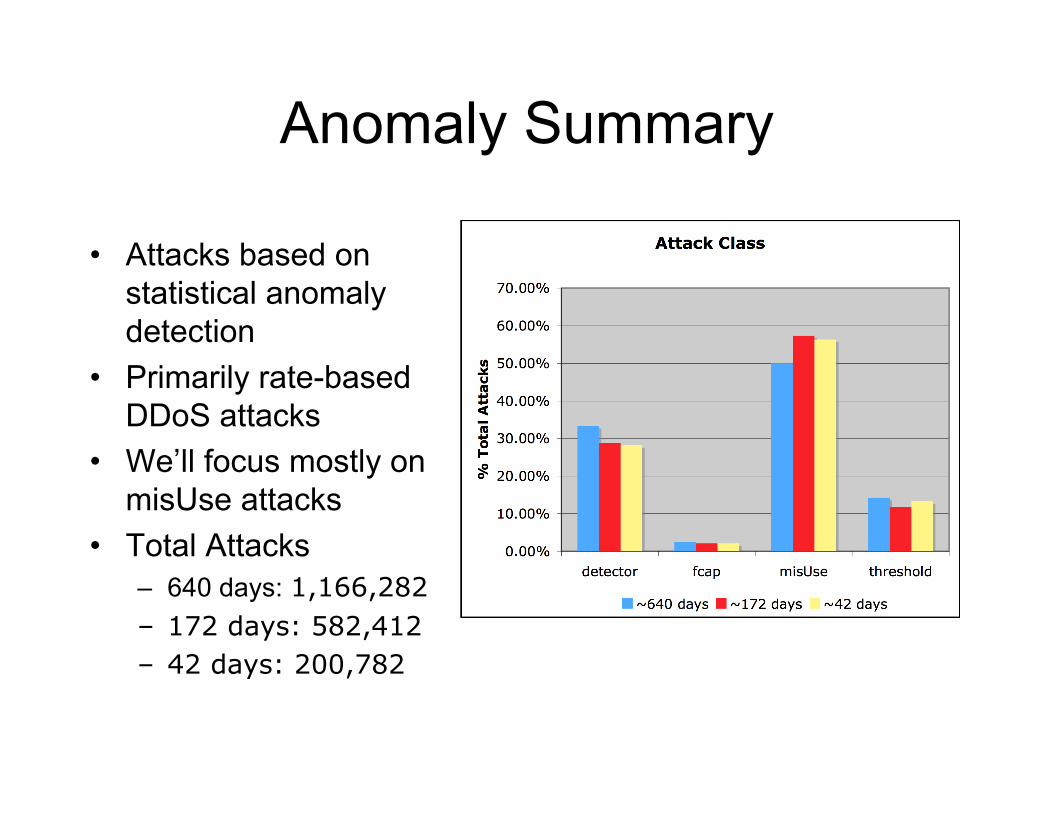
Anomaly Summary
• Attacks based onstatistical anomalydetection
• Primarily rate-basedDDoS attacks
• We’ll focus mostly onmisUse attacks
• Total Attacks– 640 days: 1,166,282– 172 days: 582,412– 42 days: 200,782
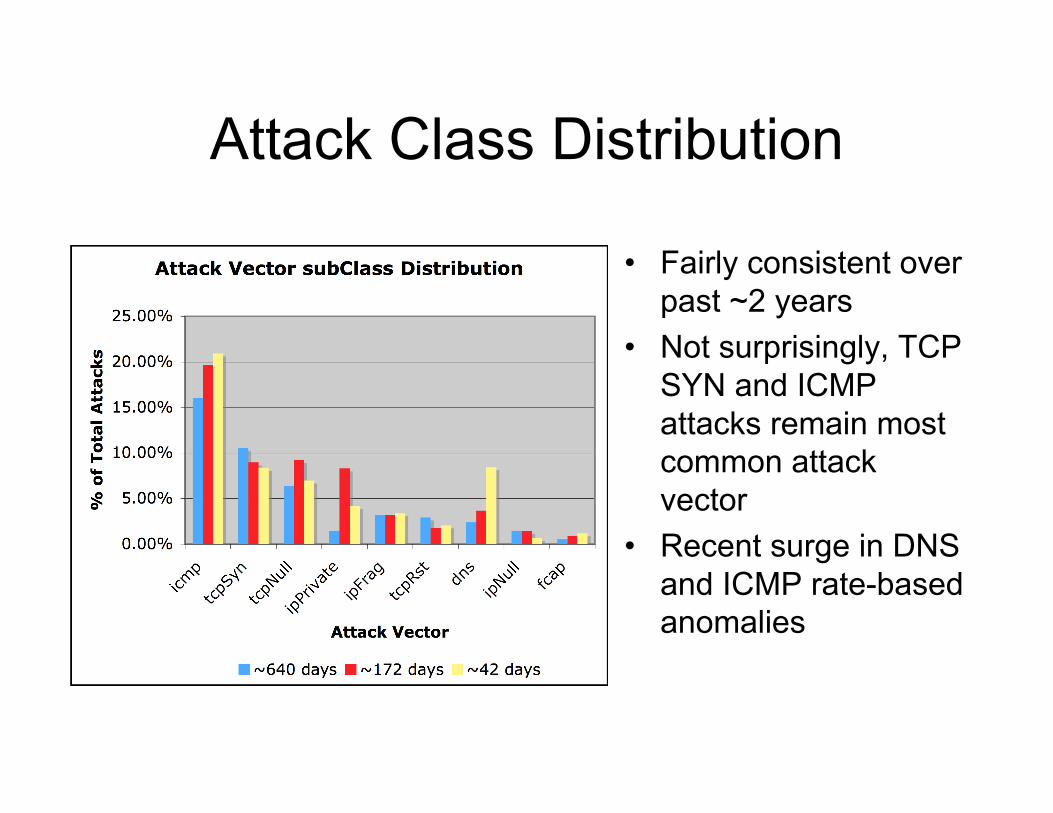
Attack Class Distribution
• Fairly consistent overpast ~2 years
• Not surprisingly, TCPSYN and ICMPattacks remain mostcommon attackvector
• Recent surge in DNSand ICMP rate-basedanomalies
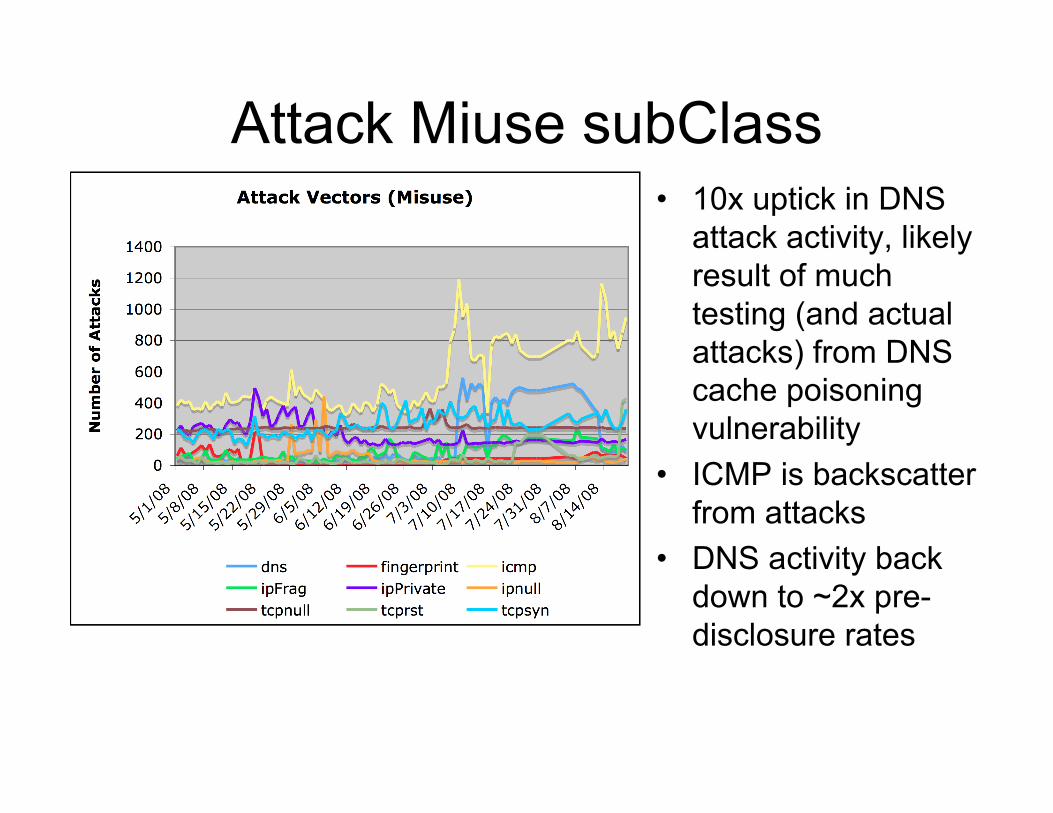
Attack Miuse subClass• 10x uptick in DNS
attack activity, likelyresult of muchtesting (and actualattacks) from DNScache poisoningvulnerability
• ICMP is backscatterfrom attacks
• DNS activity backdown to ~2x pre-disclosure rates
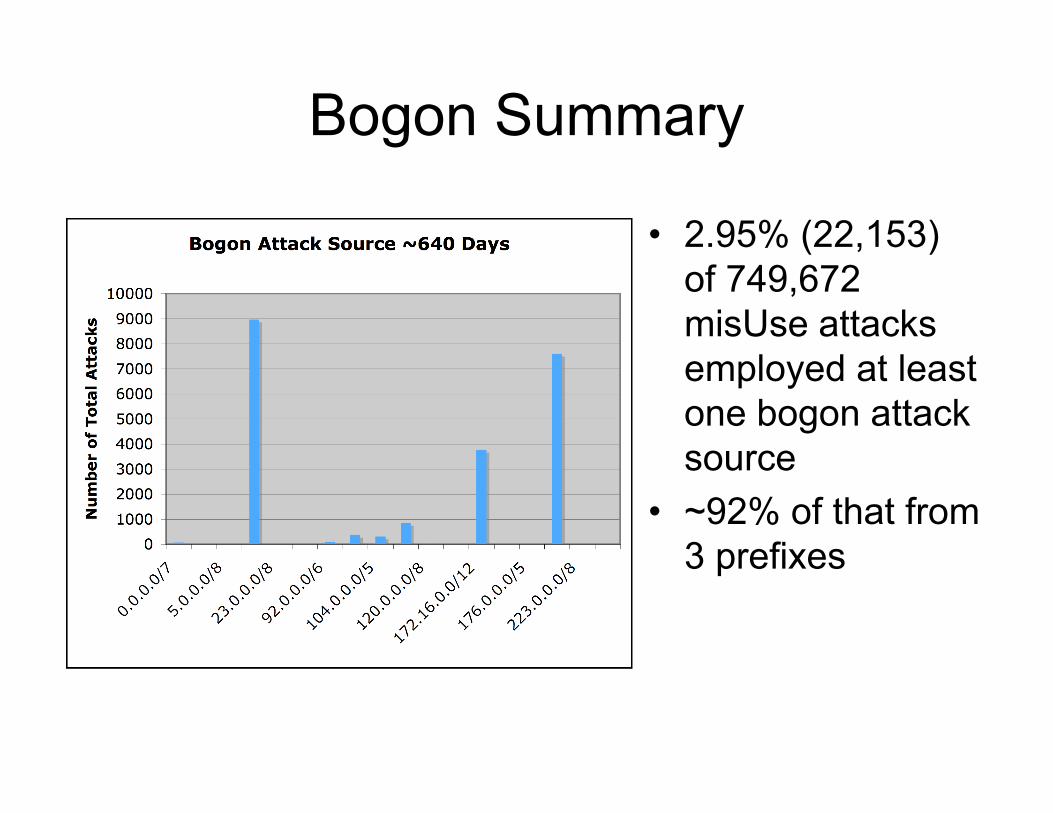
Bogon Summary
• 2.95% (22,153)of 749,672misUse attacksemployed at leastone bogon attacksource
• ~92% of that from3 prefixes
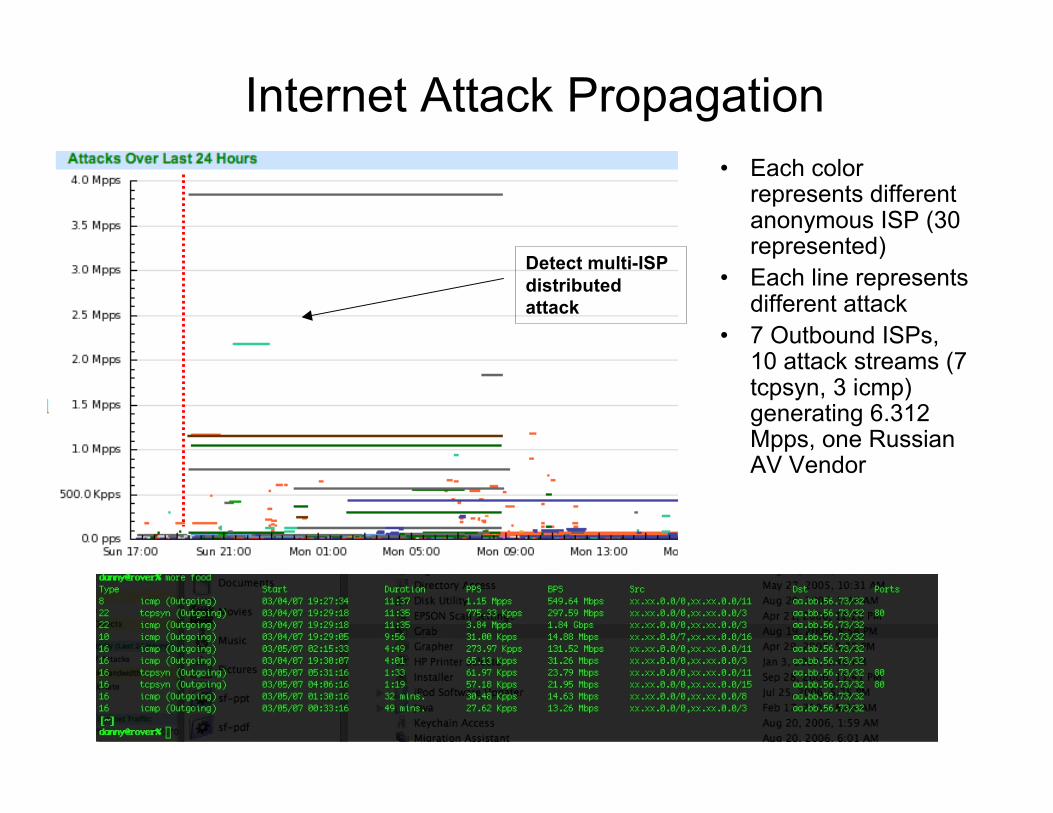
Internet Attack Propagation• Each color
represents differentanonymous ISP (30represented)
• Each line representsdifferent attack
• 7 Outbound ISPs,10 attack streams (7tcpsyn, 3 icmp)generating 6.312Mpps, one RussianAV Vendor
Detect multi-ISPdistributedattack
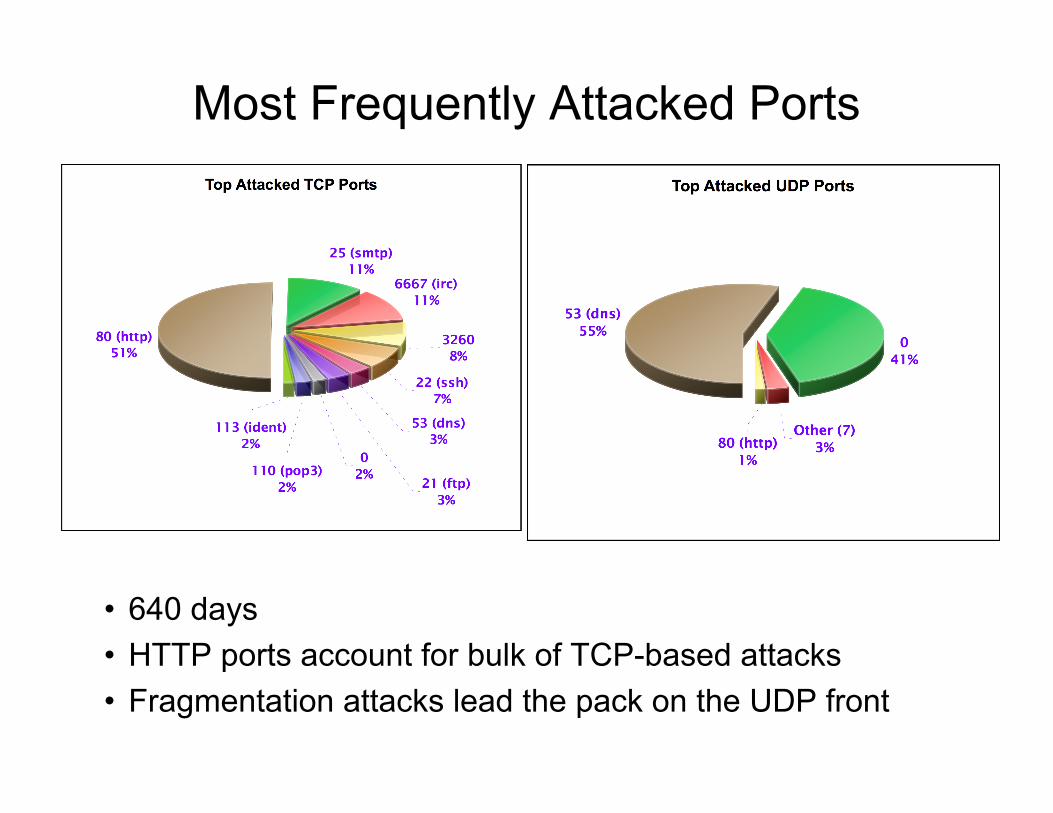
Most Frequently Attacked Ports
• 640 days• HTTP ports account for bulk of TCP-based attacks• Fragmentation attacks lead the pack on the UDP front
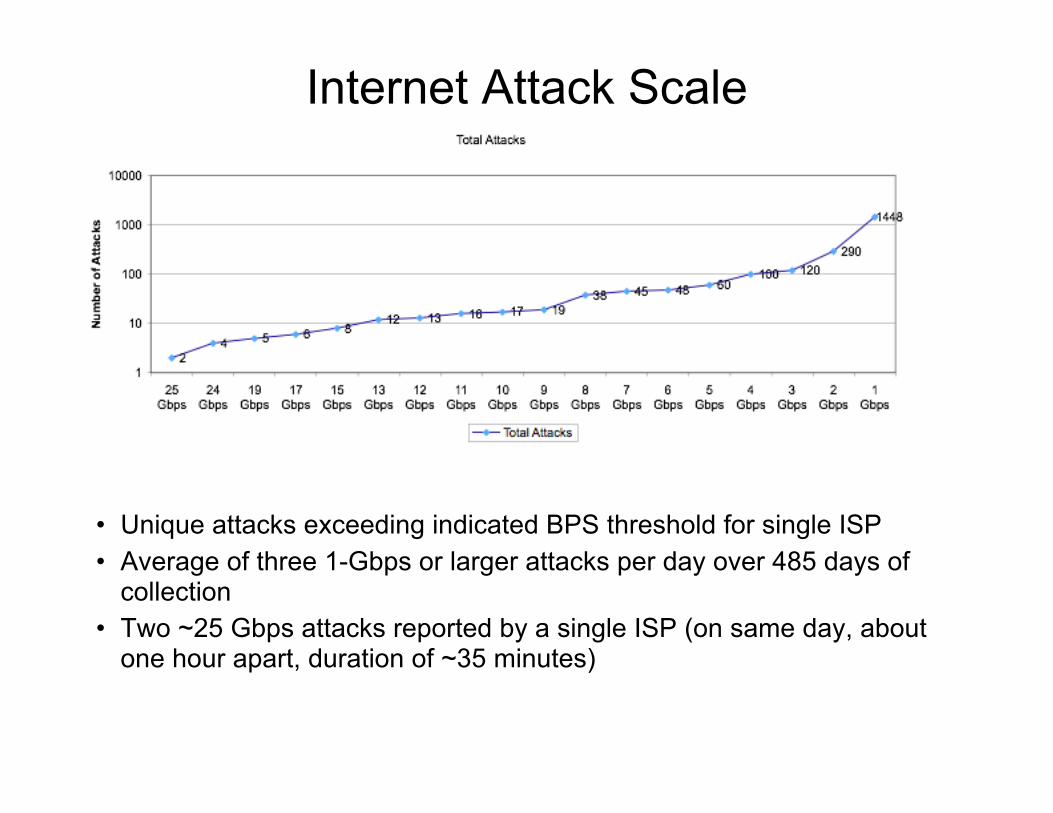
Internet Attack Scale
• Unique attacks exceeding indicated BPS threshold for single ISP• Average of three 1-Gbps or larger attacks per day over 485 days of
collection• Two ~25 Gbps attacks reported by a single ISP (on same day, about
one hour apart, duration of ~35 minutes)
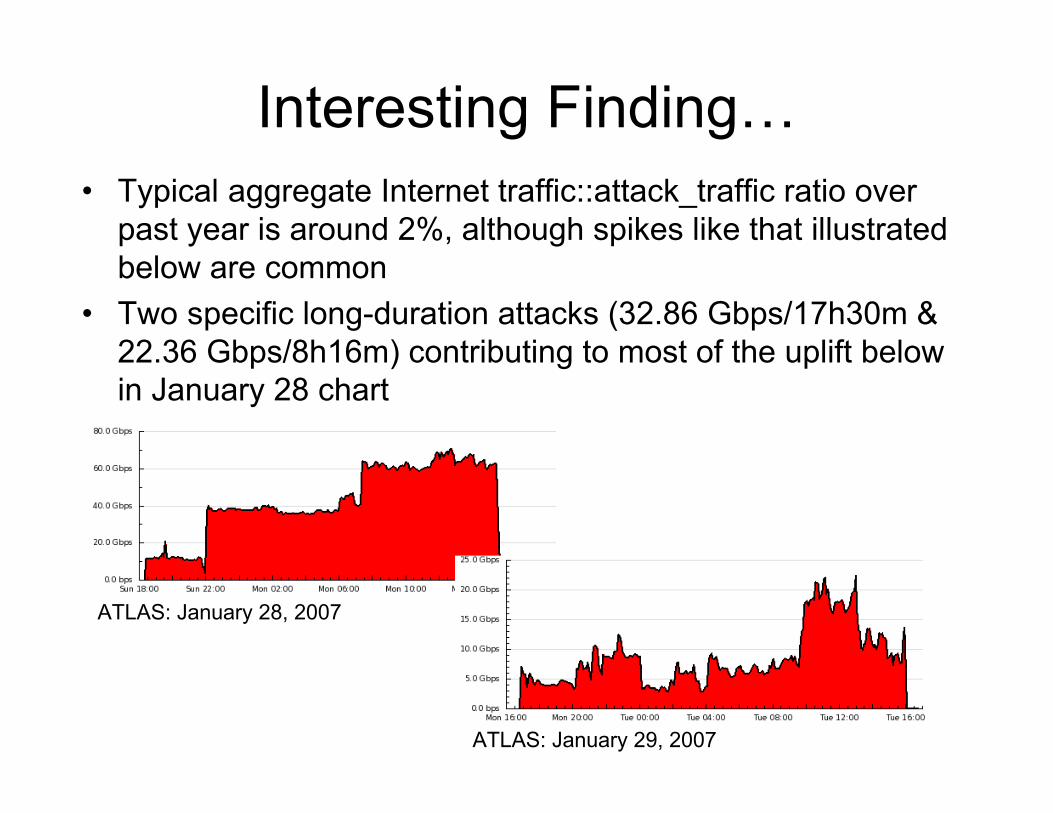
ATLAS: January 28, 2007
Interesting Finding…• Typical aggregate Internet traffic::attack_traffic ratio over
past year is around 2%, although spikes like that illustratedbelow are common
• Two specific long-duration attacks (32.86 Gbps/17h30m &22.36 Gbps/8h16m) contributing to most of the uplift belowin January 28 chart
ATLAS: January 29, 2007
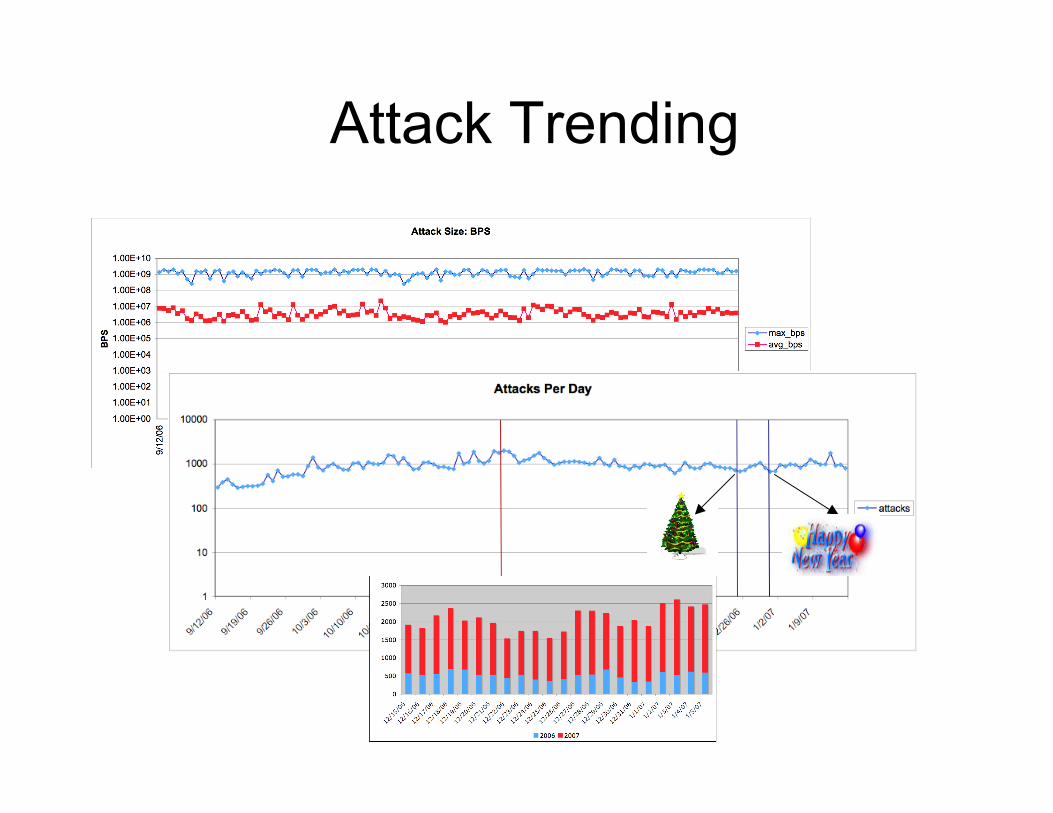
Attack Trending
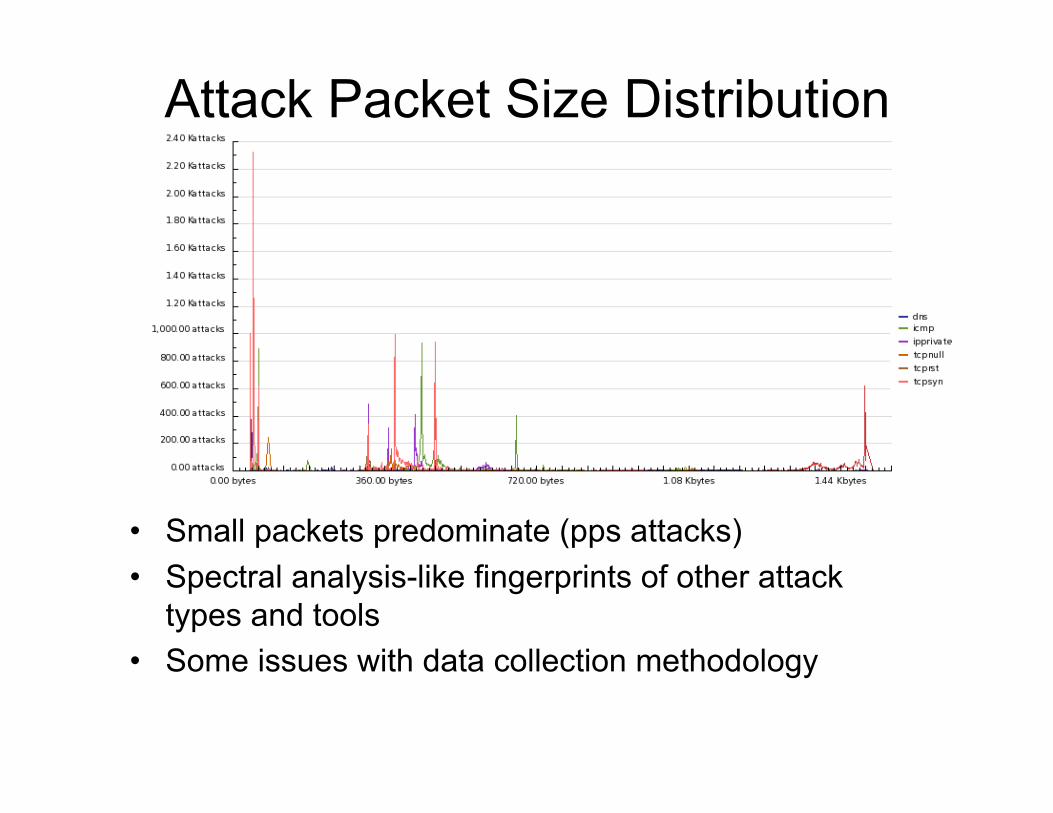
Attack Packet Size Distribution
• Small packets predominate (pps attacks)• Spectral analysis-like fingerprints of other attack
types and tools• Some issues with data collection methodology
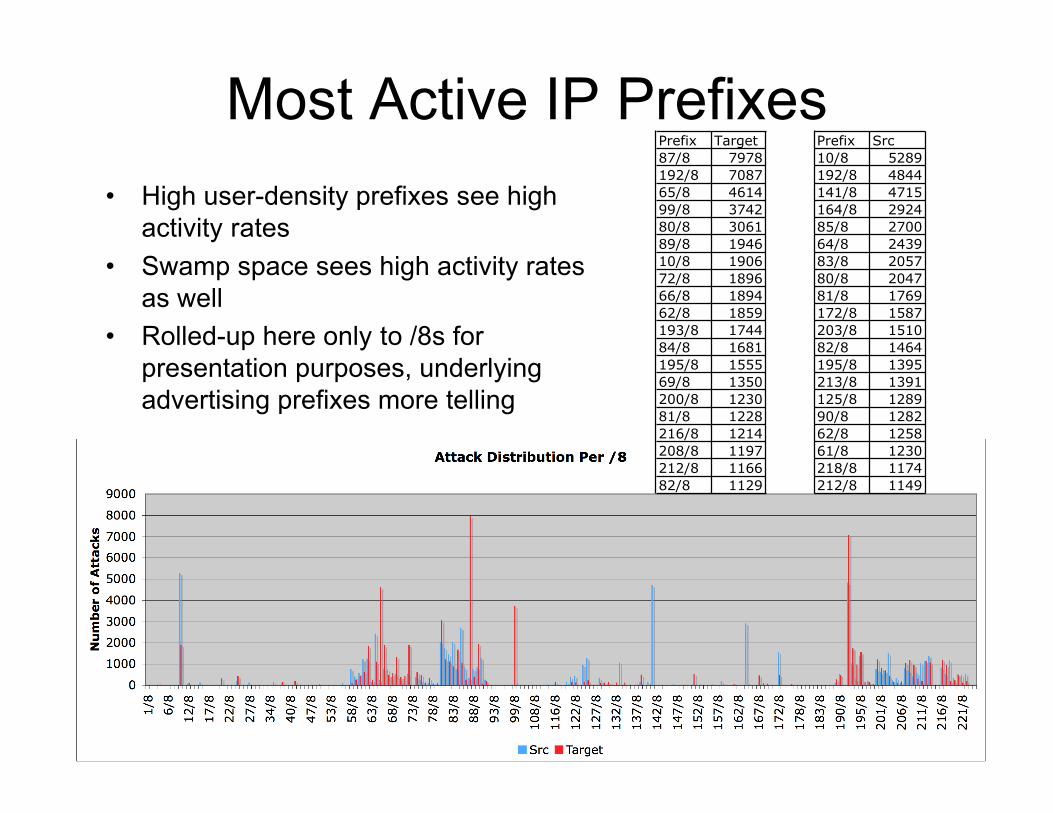
Most Active IP Prefixes• High user-density prefixes see high
activity rates• Swamp space sees high activity rates
as well• Rolled-up here only to /8s for
presentation purposes, underlyingadvertising prefixes more telling
Prefix Target
87/8 7978
192/8 7087
65/8 4614
99/8 3742
80/8 3061
89/8 1946
10/8 1906
72/8 1896
66/8 1894
62/8 1859
193/8 1744
84/8 1681
195/8 1555
69/8 1350
200/8 1230
81/8 1228
216/8 1214
208/8 1197
212/8 1166
82/8 1129
Prefix Src
10/8 5289
192/8 4844
141/8 4715
164/8 2924
85/8 2700
64/8 2439
83/8 2057
80/8 2047
81/8 1769
172/8 1587
203/8 1510
82/8 1464
195/8 1395
213/8 1391
125/8 1289
90/8 1282
62/8 1258
61/8 1230
218/8 1174
212/8 1149
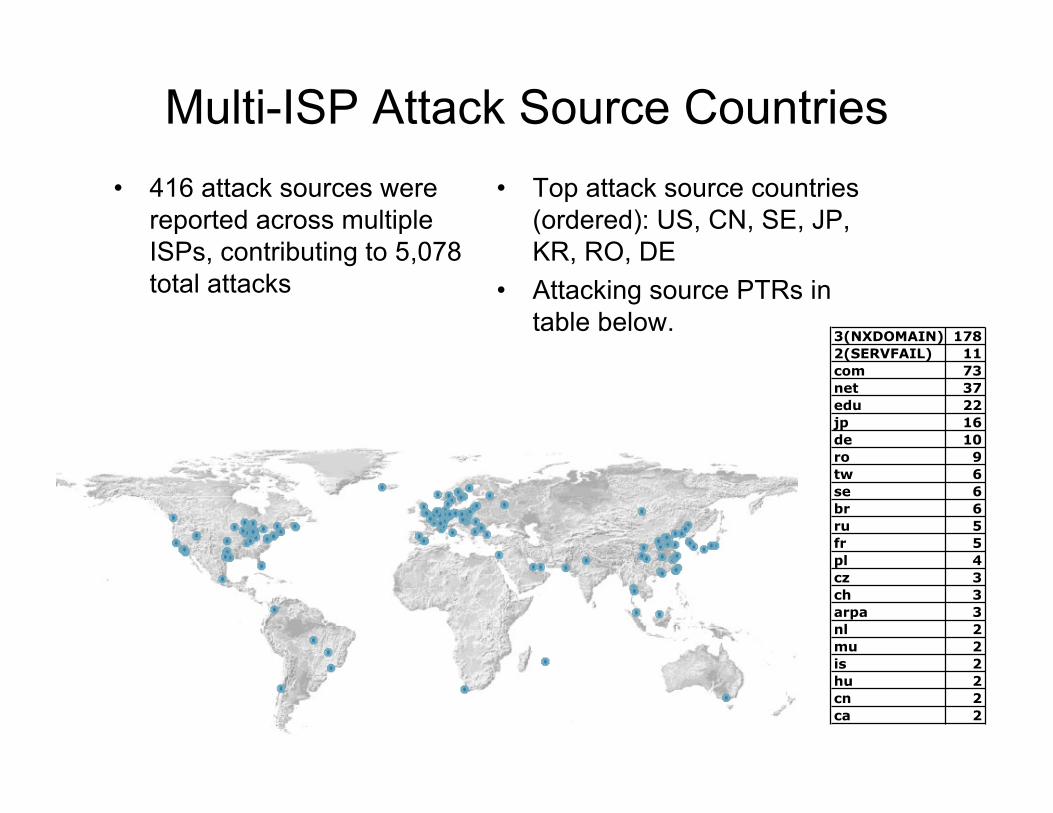
Multi-ISP Attack Source Countries• 416 attack sources were
reported across multipleISPs, contributing to 5,078total attacks
• Top attack source countries(ordered): US, CN, SE, JP,KR, RO, DE
• Attacking source PTRs intable below.
3(NXDOMAIN) 178
2(SERVFAIL) 11
com 73
net 37
edu 22
jp 16
de 10
ro 9
tw 6
se 6
br 6
ru 5
fr 5
pl 4
cz 3
ch 3
arpa 3
nl 2
mu 2
is 2
hu 2
cn 2
ca 2
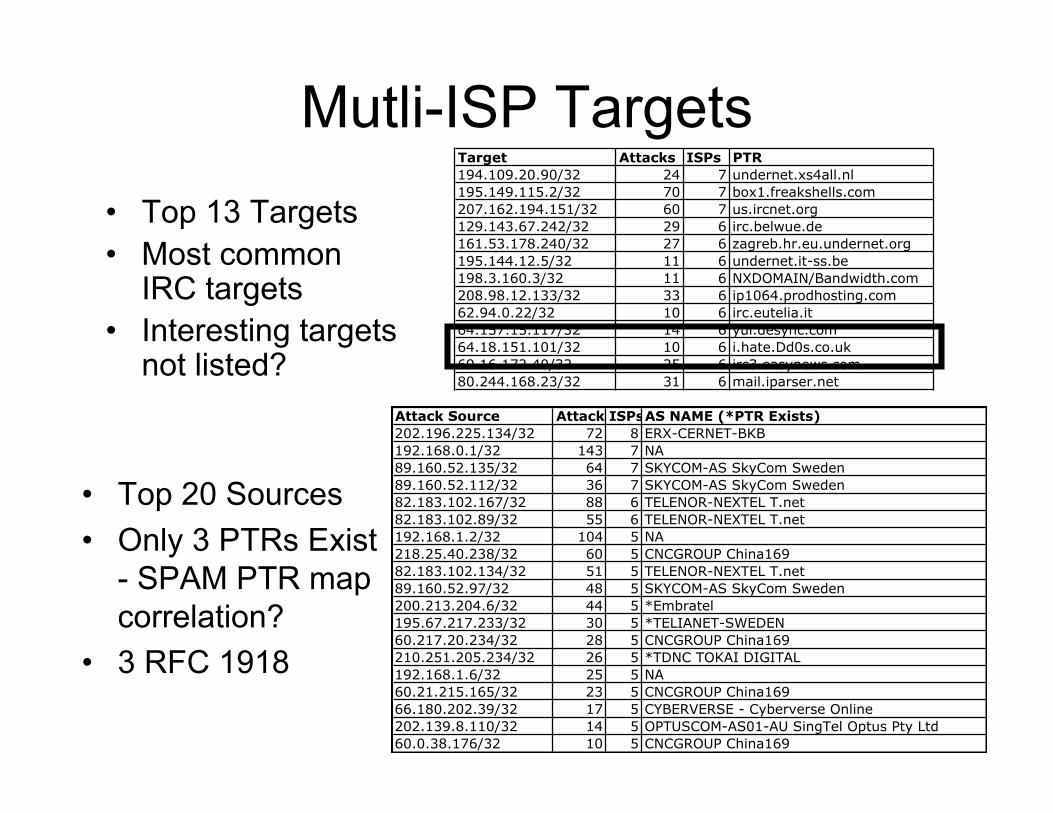
Mutli-ISP Targets• Top 13 Targets• Most common
IRC targets• Interesting targets
not listed?
Target Attacks ISPs PTR
194.109.20.90/32 24 7 undernet.xs4all.nl
195.149.115.2/32 70 7 box1.freakshells.com
207.162.194.151/32 60 7 us.ircnet.org
129.143.67.242/32 29 6 irc.belwue.de
161.53.178.240/32 27 6 zagreb.hr.eu.undernet.org
195.144.12.5/32 11 6 undernet.it-ss.be
198.3.160.3/32 11 6 NXDOMAIN/Bandwidth.com
208.98.12.133/32 33 6 ip1064.prodhosting.com
62.94.0.22/32 10 6 irc.eutelia.it
64.157.15.117/32 14 6 yui.desync.com
64.18.151.101/32 10 6 i.hate.Dd0s.co.uk
69.16.172.40/32 25 6 irc3.easynews.com
80.244.168.23/32 31 6 mail.iparser.net
• Top 20 Sources• Only 3 PTRs Exist
- SPAM PTR mapcorrelation?
• 3 RFC 1918
Attack Source AttacksISPsAS NAME (*PTR Exists)
202.196.225.134/32 72 8 ERX-CERNET-BKB
192.168.0.1/32 143 7 NA
89.160.52.135/32 64 7 SKYCOM-AS SkyCom Sweden
89.160.52.112/32 36 7 SKYCOM-AS SkyCom Sweden
82.183.102.167/32 88 6 TELENOR-NEXTEL T.net
82.183.102.89/32 55 6 TELENOR-NEXTEL T.net
192.168.1.2/32 104 5 NA
218.25.40.238/32 60 5 CNCGROUP China169
82.183.102.134/32 51 5 TELENOR-NEXTEL T.net
89.160.52.97/32 48 5 SKYCOM-AS SkyCom Sweden
200.213.204.6/32 44 5 *Embratel
195.67.217.233/32 30 5 *TELIANET-SWEDEN
60.217.20.234/32 28 5 CNCGROUP China169
210.251.205.234/32 26 5 *TDNC TOKAI DIGITAL
192.168.1.6/32 25 5 NA
60.21.215.165/32 23 5 CNCGROUP China169
66.180.202.39/32 17 5 CYBERVERSE - Cyberverse Online
202.139.8.110/32 14 5 OPTUSCOM-AS01-AU SingTel Optus Pty Ltd
60.0.38.176/32 10 5 CNCGROUP China169
Internet Traffic Challenges
• Balance commercial privacy withresearch and greater Internet interests
• Data normalization / extrapolation– Differing notions tier1– Many business units within an ISP
• Data availability to other researchers

Questions?
Danny McPherson ([email protected])
Craig Labovitz ([email protected])Scott Iekel-Johnson ([email protected])Haakon Ringberg ([email protected])