International Student Barometer University of Delaware ... · International Student Barometer...
92
© i-graduate confidential 2017 1 International Student Barometer University of Delaware Fall 2017
Transcript of International Student Barometer University of Delaware ... · International Student Barometer...

© i-graduate confidential 2017 1
International Student Barometer
University of Delaware
Fall 2017

Summary
© i-graduate confidential 2017 2
Pre-Arrival Experience Appendix
Survey Overview
National Trends
Headline Results
Survey Response
Decision Factors
Key Influences
Agents
Application
Arrival
Learning
Engagement
Living
Support
Deliverables
About i-graduate
Questionnaire
Additional Information

Process summary & scale
© i-graduate confidential 2017 3
Core questionnaire covering arrival, learning, living, support, recommendation, application and choice of university
Semi-standardized online questionnaire format, adapted and customized for each partner university
Students invited to feedback from September to December 2017
110,386 international students responded from 129 universities in 17 countries
University-specific results compared against comparator groups, national and international benchmarks
Reporting: in person, confidential and customised to each university

© i-graduate confidential 2017 4
All participating universitiesISB (110,386), SB (85,220), ISBSB (114,926)
Aalto University Estonian Academy of Arts Leeds Beckett University
Åbo Akademi University Estonian Academy of Music and Theatre Lincoln University
Algonquin College Estonian Business School Liverpool John Moores University
Anglia Ruskin University Estonian Entrepreneurship University of Applied Sciences London South Bank University
Arcada University of Applied Sciences Estonian University of Life Sciences Macquarie University
Asia Pacific University of Technology & Innovation (APU) Euroacademy Mahidol University
Auckland University George Brown College Massey University
Bath Spa University Glasgow Caledonian University Memorial University
BINUS University Goldsmiths, University of London Monash University Malaysia
Bishop Grosseteste University Griffith University Murdoch University
Camosun College Hamk University of Applied Sciences Newcastle University
Cape Breton University HAN University of Applied Sciences Northumbria University
Central Queensland University Hanken School of Economics Nova Scotia College of Art & Design
Charles Darwin UniversityHong Kong Community College (HKCC)/School of Professional
Education and Executive Development (SPEED)Nova Scotia Community College
Coventry University HU University of Applied Sciences Utrecht Peking University
Curtin University, Malaysia International Medical University Penang Medical College
Dalhousie University Jönköping University Queen's University Belfast
Danmarks Tekniske Universitet Kent State University RMIT University
DePaul University La Trobe University Royal Holloway, University of London
Durham University Lancaster University Southern Alberta Institute of Technology
Edith Cowan University Lane Community College St. Francis Xavier University
Erasmus University Rotterdam Lappeenranta University of Technology Sunway University and Sunway College
© i-graduate confidential 2017 5
All participating universitiesISB (110,386), SB (85,220), ISBSB (114,926)
Swinburne University of Technology University of British Columbia University of Oxford
Tallinn University University of California, Davis University of South Australia
Tallinn University of Technology University of Cambridge University of South Wales
Tampere University of Technology University of Central Lancashire University of Southern Queensland
Taylor's University, Lakeside Campus University of Delaware University of St Andrews
Teesside University University of Dundee University of Strathclyde
The Hague University of Applied Sciences (THUAS) University of Eastern Finland University of Sussex
The Hong Kong Polytechnic University University of Gloucestershire University of Tampere
The Royal Veterinary College University of Greenwich University of Tartu
The University of New England University of Groningen University of Technology Sydney
The University of Nottingham - China University of Helsinki University of Texas at San Antonio
The University of Nottingham - Malaysia University of Huddersfield University of the West of Scotland
The University of Western Australia University of Jyväskylä University of Turku
Umeå University University of Lapland University of Vaasa
Universidad Pompeu Fabra University of Malaya University of Waikato
Universita Cattolica del Sacro Cuore University of Michigan-Flint University of Warwick
Universiti Teknologi Malaysia University of Minnesota Victoria University of Wellington
Universiti Teknologi Petronas University of Nebraska–Lincoln Vrije Universiteit Amsterdam
Universiti Tenaga Nasional University of New South Wales Wageningen University
University of Adelaide University of Nottingham Wilfrid Laurier University
University of Amsterdam University of Otago
University of Bradford University of Oulu

© i-graduate confidential 2017 6
Benchmark groups
North American Universities ISB (13,809)
Cape Breton University
Dalhousie University
Memorial University
Nova Scotia College of Art & Design
St. Francis Xavier University
University of British Columbia
Wilfrid Laurier University
DePaul University
Kent State University
University of California, Davis
University of Delaware
University of Michigan-Flint
University of Minnesota
University of Nebraska–Lincoln
University of Texas at San Antonio
USA Universities ISB (7,484)
DePaul University
Kent State University
University of California, Davis
University of Delaware
University of Michigan-Flint
University of Minnesota
University of Nebraska–Lincoln
University of Texas at San Antonio

© i-graduate confidential 2017 7
Headline results

© i-graduate confidential 2017 9
Presidential Elections 2016
15%
5%
14%
3%
8%
18%
5%
18%
9%
15%
13%
4%
24%
28%
55%
41%
38%
36%
36%
36%
33%
28%
27%
26%
20%
18%
0% 10% 20% 30% 40% 50% 60% 70% 80% 90% 100%
Average
Iran (Islamic Republic of)
Mexico
Canada
India
Malaysia
Brazil
Taiwan
Vietnam
Saudi Arabia
South Korea
Japan
China
USA Universities ISB 2017 (2,414)
More likely to study in the US It would make no difference Less likely to study in the US
After the change of political climate following the 2016 United States presidential elections, would you be more likely or less likely to choose the US as a study destination, if you made the decision again:

© i-graduate confidential 2017 9
Propensity to recommend
Delaware(824)
USA Universities
ISB(6279)
N. American Universities
ISB(10869)
Global ISB(89199)
Postgraduate(332)
Graduate(271)
Undergraduate (221)
39% I would actively encourage people to apply 37% 36% 38% 36% 47% 34%
42% If asked, I would encourage people to apply 46% 45% 44% 44% 42% 41%
15%I would neither encourage nor discourage people to apply
13% 14% 13% 15% 9% 21%
2% If asked, I would discourage people from applying 2% 3% 3% 2% 3% 2%
1% I would actively discourage people from applying 1% 1% 1% 2% 0% 2%

Propensity to recommend (all universities)
© i-graduate confidential 2017 10
Would you recommend the university to others thinking of applying here?
0%
10%
20%
30%
40%
50%
60%
70%
80%
90%
100%
If asked, encourage (ISB)Actively encourage (ISB) Actively encourage (University)
If asked, encourage (USA Universities ISB)
Actively encourage (USA Universities ISB)
If asked, encourage (University)
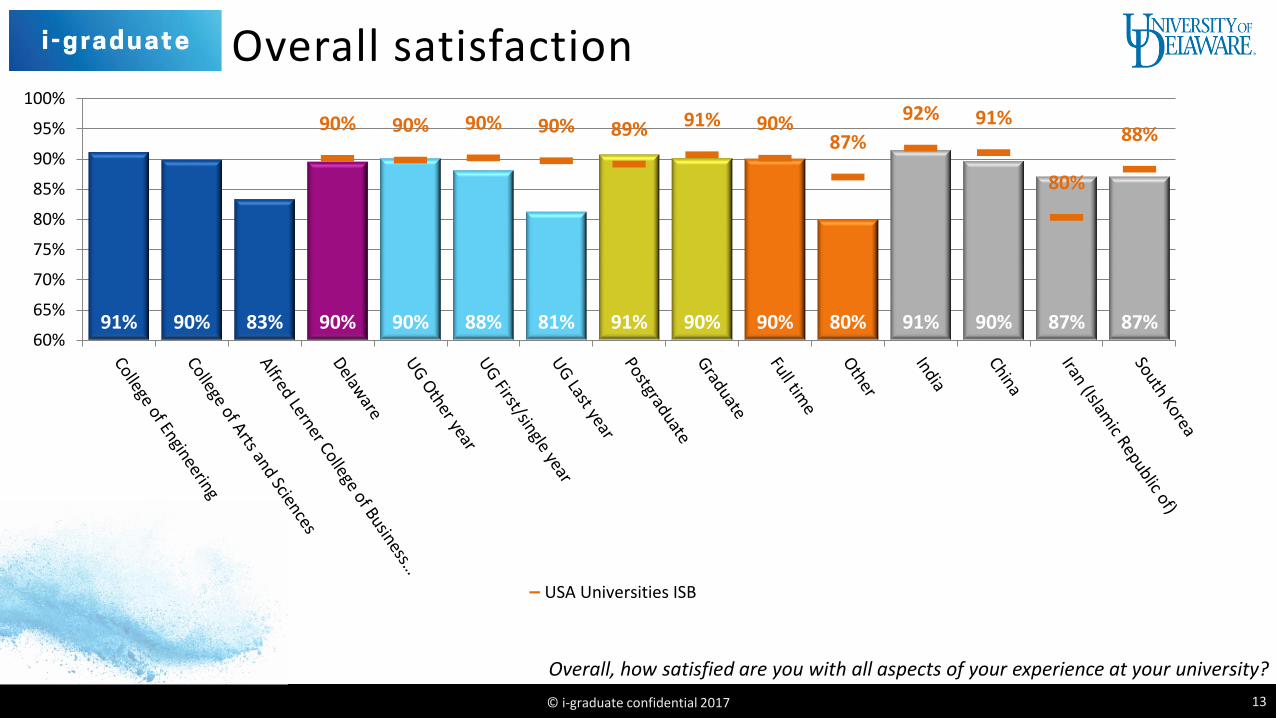
Overall satisfaction
© i-graduate confidential 2017 13
Overall, how satisfied are you with all aspects of your experience at your university?
91% 90% 83% 90% 90% 88% 81% 91% 90% 90% 80% 91% 90% 87% 87%
90% 90% 90% 90% 89% 91% 90%87%
92% 91%
80%
88%
60%
65%
70%
75%
80%
85%
90%
95%
100%
USA Universities ISB
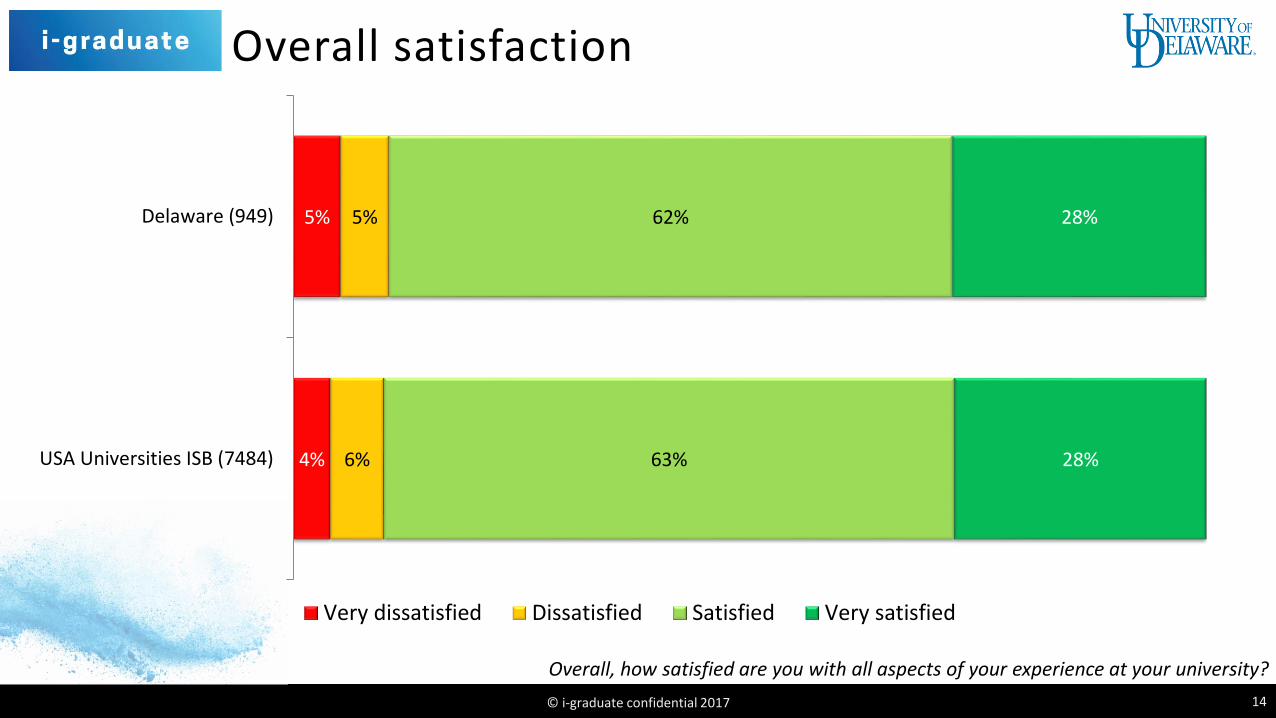
Overall satisfaction
© i-graduate confidential 2017 14
Overall, how satisfied are you with all aspects of your experience at your university?
4%
5%
6%
5%
63%
62%
28%
28%
USA Universities ISB (7484)
Delaware (949)
Very dissatisfied Dissatisfied Satisfied Very satisfied

© i-graduate confidential 2017 15
Survey response

Response rate breakdown
© i-graduate confidential 2017 16
Each dot represents an university in the global benchmark. This university’s response rate is highlighted in red.
36%
0%
10%
20%
30%
40%
50%
60%
70%
80%
90%
100% Response Population Response Rate
Delaware ISB 2017 949 2,670 36%
USA Universities ISB
20177,484 23,018 33%
N. American
Universities ISB 201713,089 48,396 27%
Global ISB 2017 110,386 388,051 28%

Study stage breakdown
© i-graduate confidential 2017 17
25%
43%
38%
53%
20%
38%
21%
37%
24%
0% 10% 20% 30% 40% 50% 60% 70% 80% 90% 100%
Postgraduate(368)
Graduate (314)
Undergraduate(267)
First year (e.g. Freshman) Other year (e.g. Junior or Sophomore) Last year (e.g. Senior) Short program
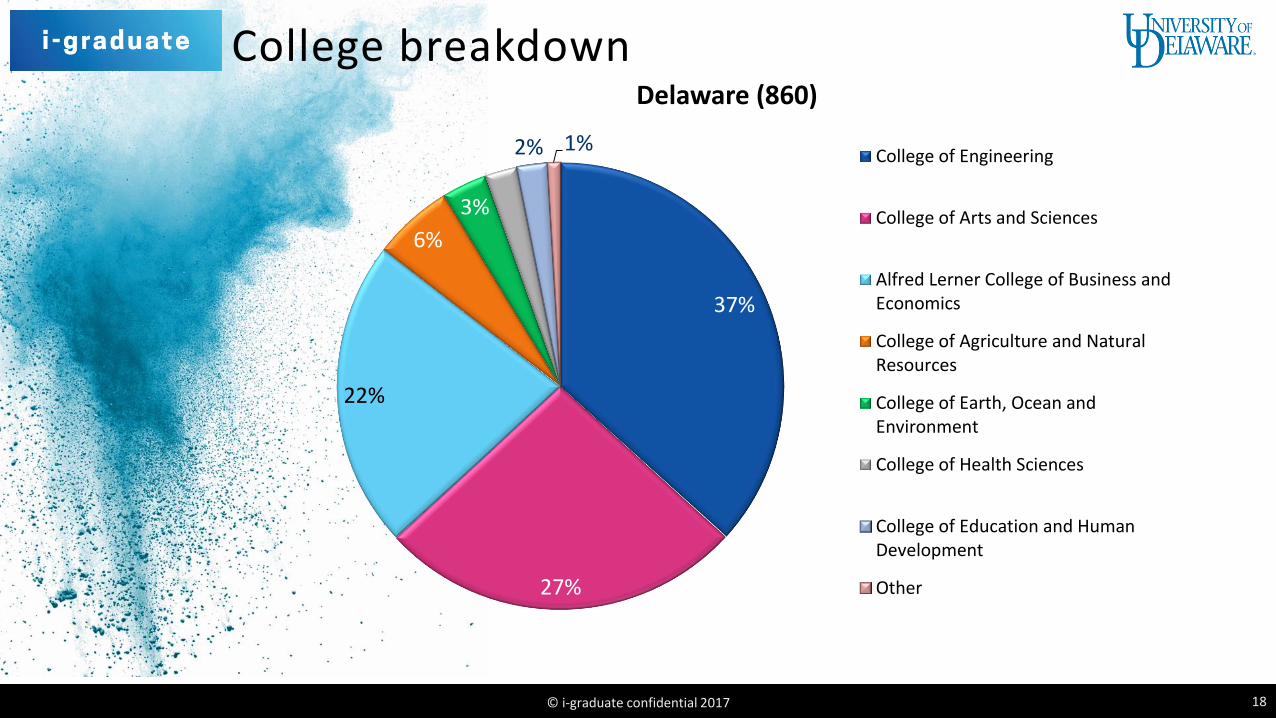
© i-graduate confidential 2017 18
College breakdown
37%
27%
22%
6%
3%
2% 2% 1%
Delaware (860)
College of Engineering
College of Arts and Sciences
Alfred Lerner College of Business andEconomics
College of Agriculture and NaturalResources
College of Earth, Ocean andEnvironment
College of Health Sciences
College of Education and HumanDevelopment
Other
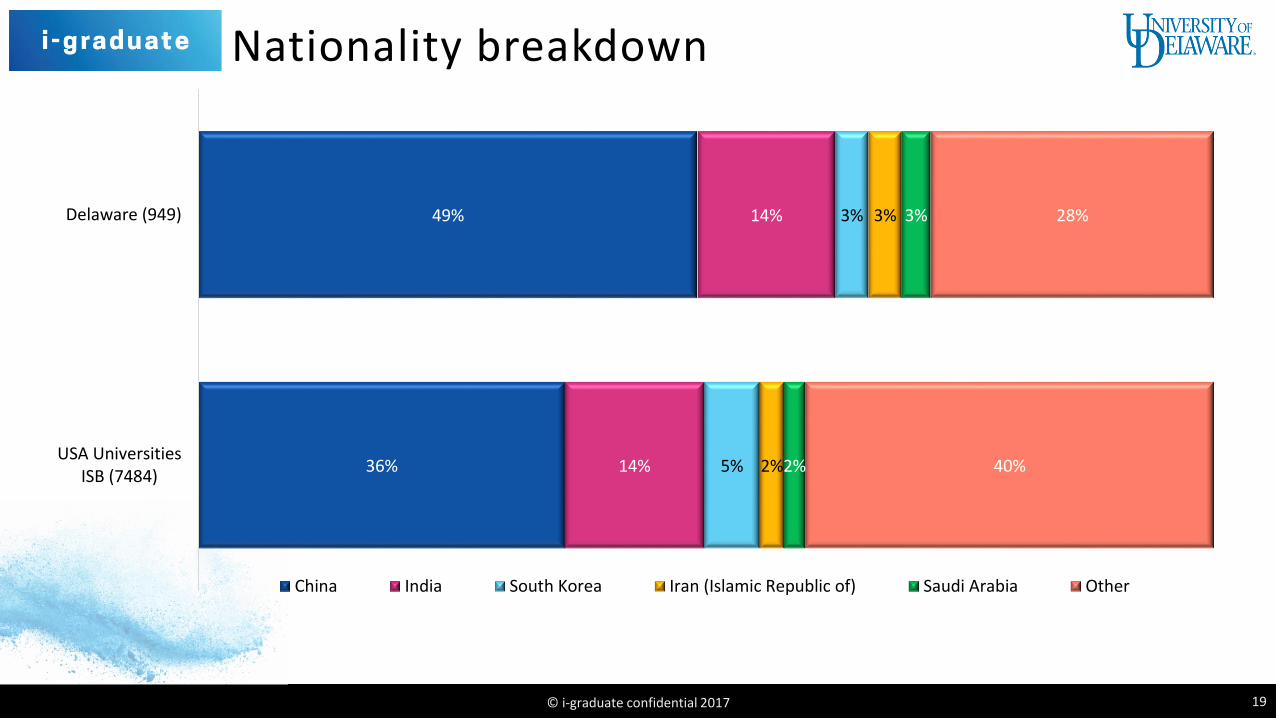
Nationality breakdown
© i-graduate confidential 2017 19
36%
49%
14%
14%
5%
3%
2%
3%
2%
3%
40%
28%
USA UniversitiesISB (7484)
Delaware (949)
China India South Korea Iran (Islamic Republic of) Saudi Arabia Other
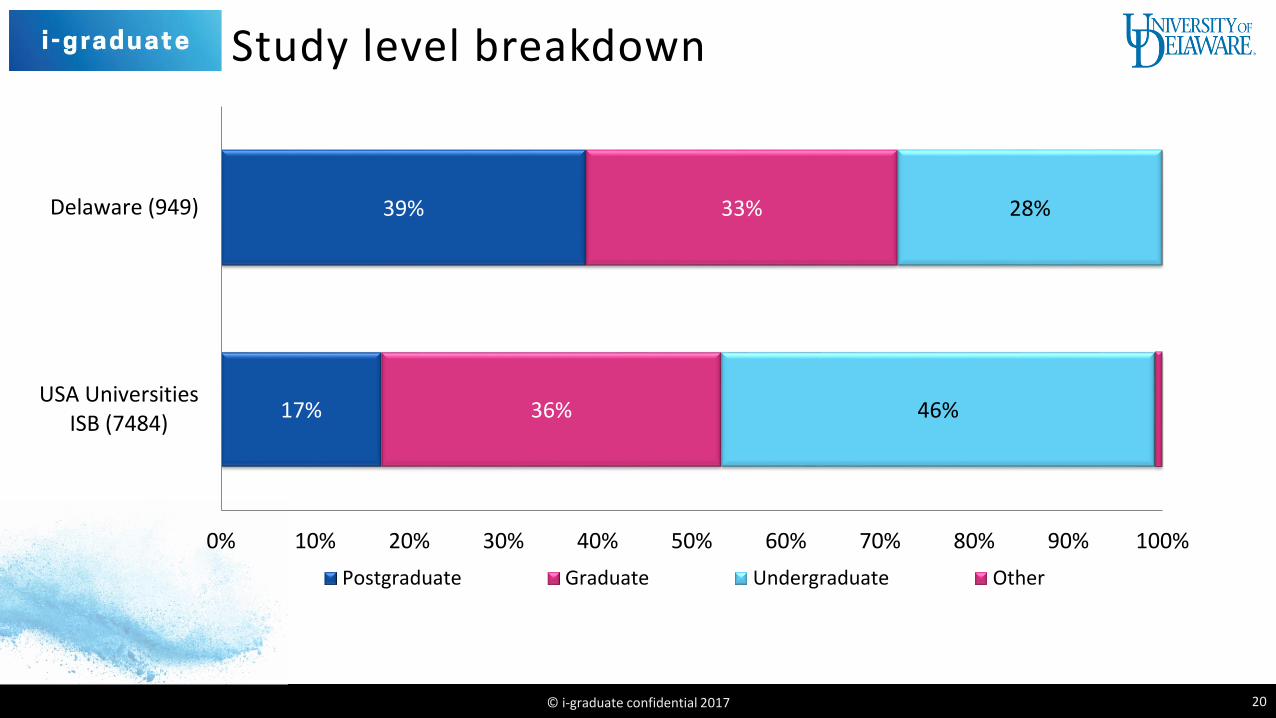
Study level breakdown
© i-graduate confidential 2017 20
17%
39%
36%
33%
46%
28%
0% 10% 20% 30% 40% 50% 60% 70% 80% 90% 100%
USA UniversitiesISB (7484)
Delaware (949)
Postgraduate Graduate Undergraduate Other

© i-graduate confidential 2017 21
Choice of destination

Top 10 factors in study decision (% important)
© i-graduate confidential 2017 22
How important were the following factors when deciding where to study?
**Graduate students only
85%86%86%89%89%90%91%92%92%92%
84%
87%
84%
88%
91%
88%
91%
94%
92%92%
80%
82%
84%
86%
88%
90%
92%
94%
96%
98%
100%
Delaware (319) USA Universities ISB (2493)
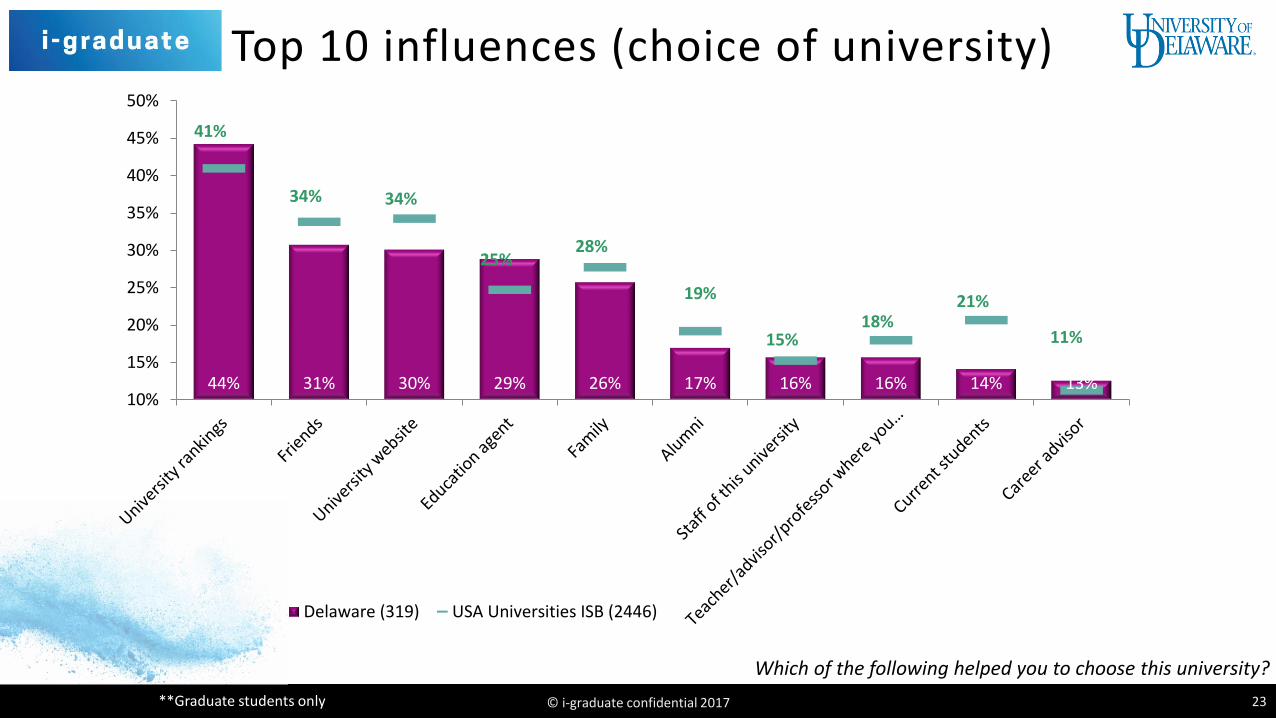
Top 10 influences (choice of university)
© i-graduate confidential 2017 23**Graduate students only
Which of the following helped you to choose this university?
13%14%16%16%17%26%29%30%31%44%
11%
21%18%
15%
19%
28%25%
34%34%
41%
10%
15%
20%
25%
30%
35%
40%
45%
50%
Delaware (319) USA Universities ISB (2446)

Brand strength
© i-graduate confidential 2017 24
Which was most important in your decision of where to study?
Was this country your first choice for international education?
14%
86%
Delaware (273)
No Yes
67% 67%
27% 27%
6% 6%
Delaware(272)
USAUniversitiesISB (2027)
The university The country Don't know

© i-graduate confidential 2017 28
Agents and Application

Agent rating
© i-graduate confidential 2017 29
Please rate the service you received from the agent/representative office:
1%
2%
7%
8%
65%
70%
27%
20%
USA Universities ISB (627)
Delaware (101)
Very dissatisfied Dissatisfied Satisfied Very satisfied

Agents
© i-graduate confidential 2017 30
To what extent do you agree or disagree with the following statements:
70%
86%
92%
87%
93%
95%
90%
93%
76%
81%
88%
90%
91%
93%
93%
94%
The agent reduced my overall costs (application fee waivers, moneyexchange discounts, etc.)
The agent described the university accurately
The agent was well informed about higher education in the UnitedStates
The agent provided helpful pre-departure orientation services
The agent was not pushy or forceful with me during theapplication/enrollment process
The agent was knowledgeable about the university's applicationprocesses
The agent reduced time and effort needed to complete my application
The agent provided helpful services for my visa application
Delaware (82) USA Universities ISB (479)
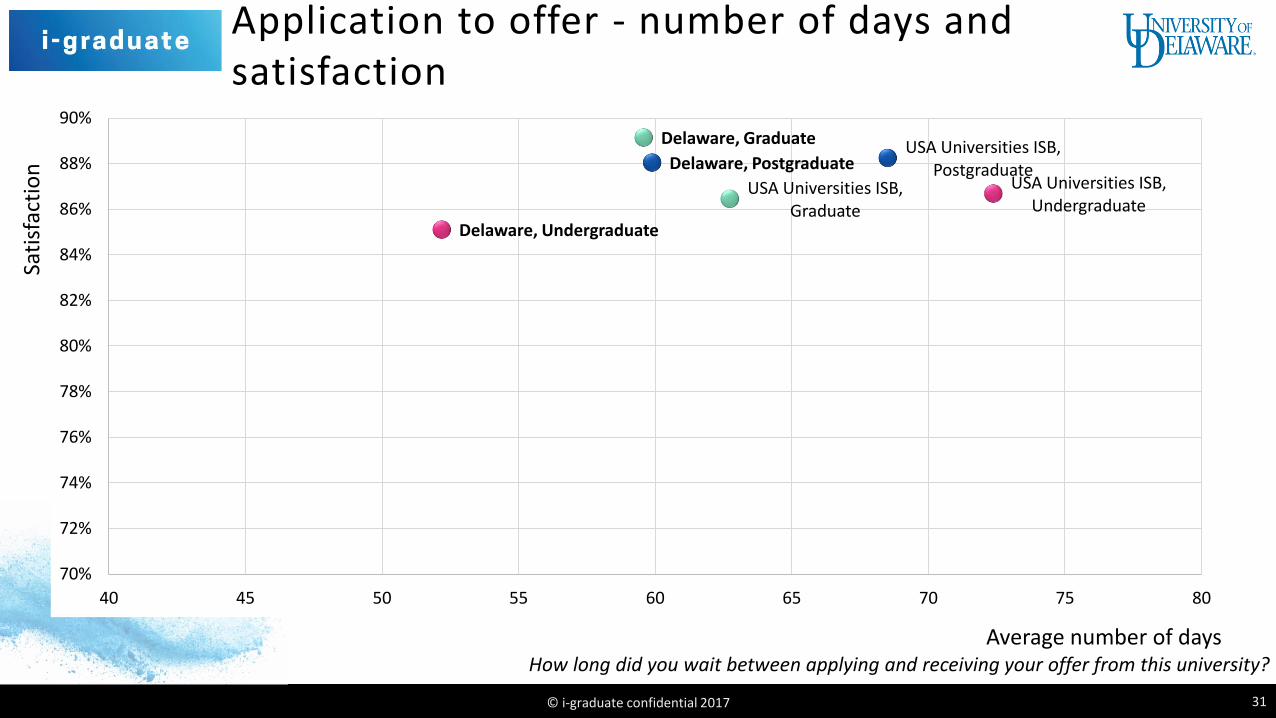
Application to offer - number of days and satisfaction
© i-graduate confidential 2017 31
Average number of days
Sati
sfac
tio
n
How long did you wait between applying and receiving your offer from this university?
Delaware, Graduate
Delaware, Undergraduate
Delaware, Postgraduate
USA Universities ISB, Graduate
USA Universities ISB, Undergraduate
USA Universities ISB, Postgraduate
70%
72%
74%
76%
78%
80%
82%
84%
86%
88%
90%
40 45 50 55 60 65 70 75 80

© i-graduate confidential 2017 33
Arrival experience
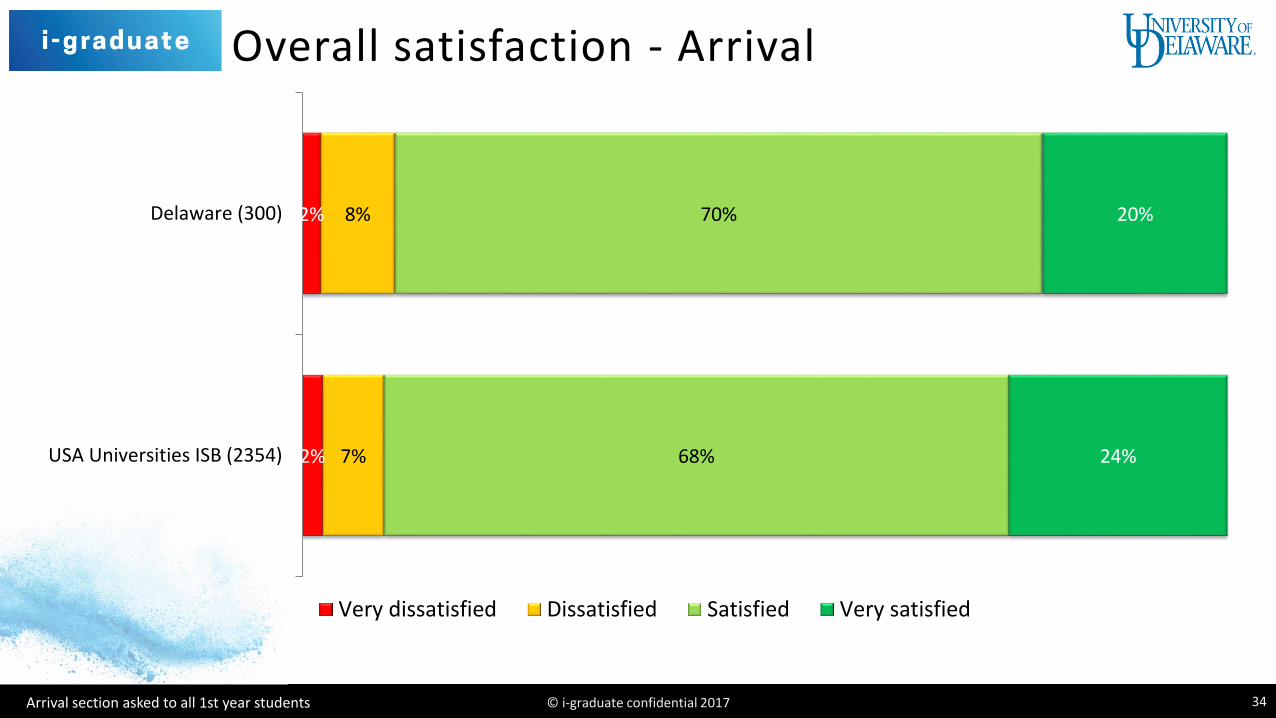
Overall satisfaction - Arrival
© i-graduate confidential 2017 34Arrival section asked to all 1st year students
2%
2%
7%
8%
68%
70%
24%
20%
USA Universities ISB (2354)
Delaware (300)
Very dissatisfied Dissatisfied Satisfied Very satisfied

Derived importance - Arrival
© i-graduate confidential 2017 35
92% 90% 93% 90% 75% 90% 95% 90% 89% 83% 84% 91% 82% 77% 91% 92% 96% 87%
42%
32%
29%
26%24%
21% 21%19% 19% 19% 18% 18% 18% 17% 17%
15% 14%12%
0%
5%
10%
15%
20%
25%
30%
35%
40%
45%
0%
10%
20%
30%
40%
50%
60%
70%
80%
90%
100%
Delaware Correlation

Arrival matrix
© i-graduate confidential 2017 36
% difference to primary benchmark
Un
ive
rsit
y sa
tisf
acti
on
(so
rte
d b
y %
sc
ore
)
Arrival section asked to all 1st year students
Residence Life & HousingMeeting staff
Formal welcome
Bank account
Financial Services
Local orientation
Home friendsStudy sense University orientation program
ARRIVAL OVERALL
Registration for classes
Social activities
Internet access
First night
Housing condition
Other friends
Host friends
-8% -6% -4% -2% 0% 2% 4% 6% 8%

© i-graduate confidential 2017 37
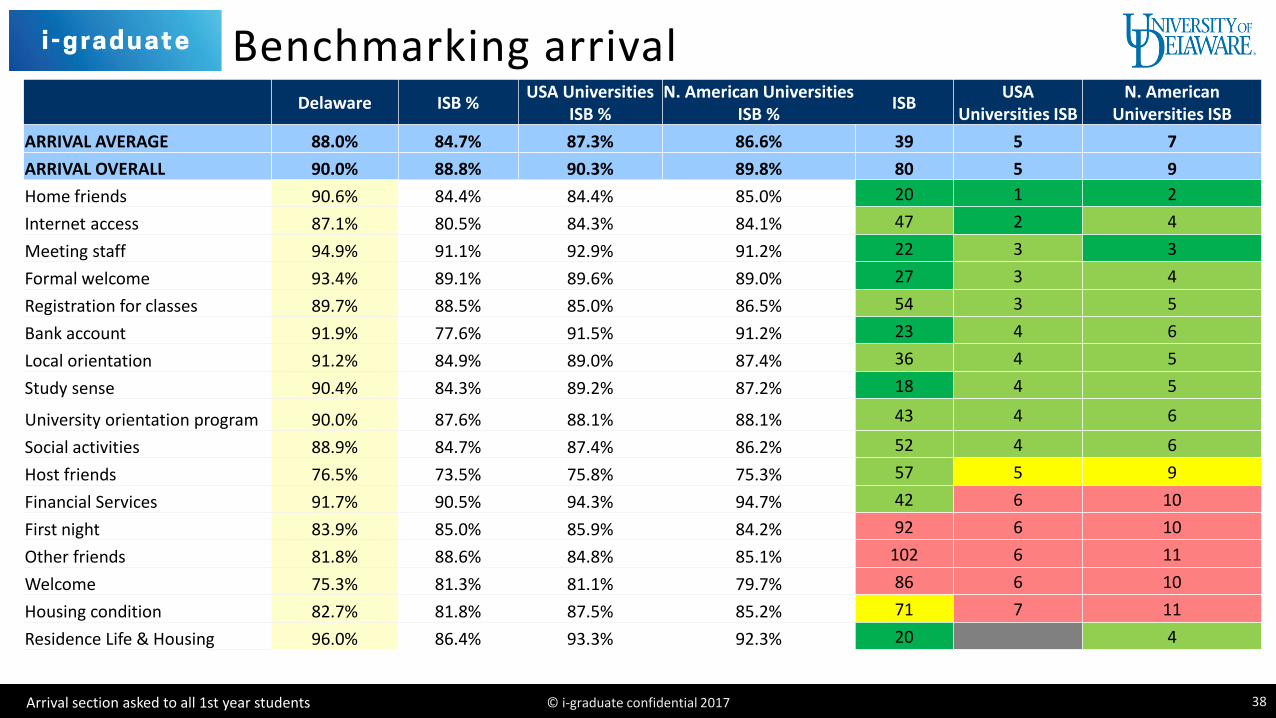
Benchmarking arrival
Arrival section asked to all 1st year students
Delaware ISB %USA Universities
ISB %N. American
Universities ISB %ISB +/-
USA Universities ISB +/-
N. American Universities ISB +/-
ARRIVAL AVERAGE 88.0% 84.7% 87.3% 86.6% 3.3% 0.7% 1.4%
ARRIVAL OVERALL 90.0% 88.8% 90.3% 89.8% 1.2% -0.3% 0.2%
Residence Life & Housing 96.0% 86.4% 93.3% 92.3% 9.6% 2.7% 3.7%
Meeting staff 94.9% 91.1% 92.9% 91.2% 3.8% 2.0% 3.7%
Formal welcome 93.4% 89.1% 89.6% 89.0% 4.3% 3.8% 4.4%
Bank account 91.9% 77.6% 91.5% 91.2% 14.4% 0.5% 0.7%
Financial Services 91.7% 90.5% 94.3% 94.7% 1.2% -2.6% -3.0%
Local orientation 91.2% 84.9% 89.0% 87.4% 6.3% 2.2% 3.8%
Home friends 90.6% 84.4% 84.4% 85.0% 6.2% 6.2% 5.6%
Study sense 90.4% 84.3% 89.2% 87.2% 6.2% 1.3% 3.2%
University orientation program 90.0% 87.6% 88.1% 88.1% 2.5% 1.9% 1.9%
Registration for classes 89.7% 88.5% 85.0% 86.5% 1.2% 4.7% 3.2%
Social activities 88.9% 84.7% 87.4% 86.2% 4.3% 1.5% 2.8%
Internet access 87.1% 80.5% 84.3% 84.1% 6.5% 2.7% 3.0%
First night 83.9% 85.0% 85.9% 84.2% -1.1% -2.0% -0.3%
Housing condition 82.7% 81.8% 87.5% 85.2% 0.9% -4.9% -2.6%
Other friends 81.8% 88.6% 84.8% 85.1% -6.9% -3.0% -3.3%
Host friends 76.5% 73.5% 75.8% 75.3% 3.0% 0.7% 1.3%
Welcome 75.3% 81.3% 81.1% 79.7% -6.0% -5.8% -4.5%
© i-graduate confidential 2017 38
Benchmarking arrival
Arrival section asked to all 1st year students
Delaware ISB %USA Universities
ISB %N. American Universities
ISB %ISB
USA Universities ISB
N. American Universities ISB
ARRIVAL AVERAGE 88.0% 84.7% 87.3% 86.6% 39 5 7
ARRIVAL OVERALL 90.0% 88.8% 90.3% 89.8% 80 5 9
Home friends 90.6% 84.4% 84.4% 85.0% 20 1 2
Internet access 87.1% 80.5% 84.3% 84.1% 47 2 4
Meeting staff 94.9% 91.1% 92.9% 91.2% 22 3 3
Formal welcome 93.4% 89.1% 89.6% 89.0% 27 3 4
Registration for classes 89.7% 88.5% 85.0% 86.5% 54 3 5
Bank account 91.9% 77.6% 91.5% 91.2% 23 4 6
Local orientation 91.2% 84.9% 89.0% 87.4% 36 4 5
Study sense 90.4% 84.3% 89.2% 87.2% 18 4 5
University orientation program 90.0% 87.6% 88.1% 88.1% 43 4 6
Social activities 88.9% 84.7% 87.4% 86.2% 52 4 6
Host friends 76.5% 73.5% 75.8% 75.3% 57 5 9
Financial Services 91.7% 90.5% 94.3% 94.7% 42 6 10
First night 83.9% 85.0% 85.9% 84.2% 92 6 10
Other friends 81.8% 88.6% 84.8% 85.1% 102 6 11
Welcome 75.3% 81.3% 81.1% 79.7% 86 6 10
Housing condition 82.7% 81.8% 87.5% 85.2% 71 7 11
Residence Life & Housing 96.0% 86.4% 93.3% 92.3% 20 4

© i-graduate confidential 2017 45
Learning experience
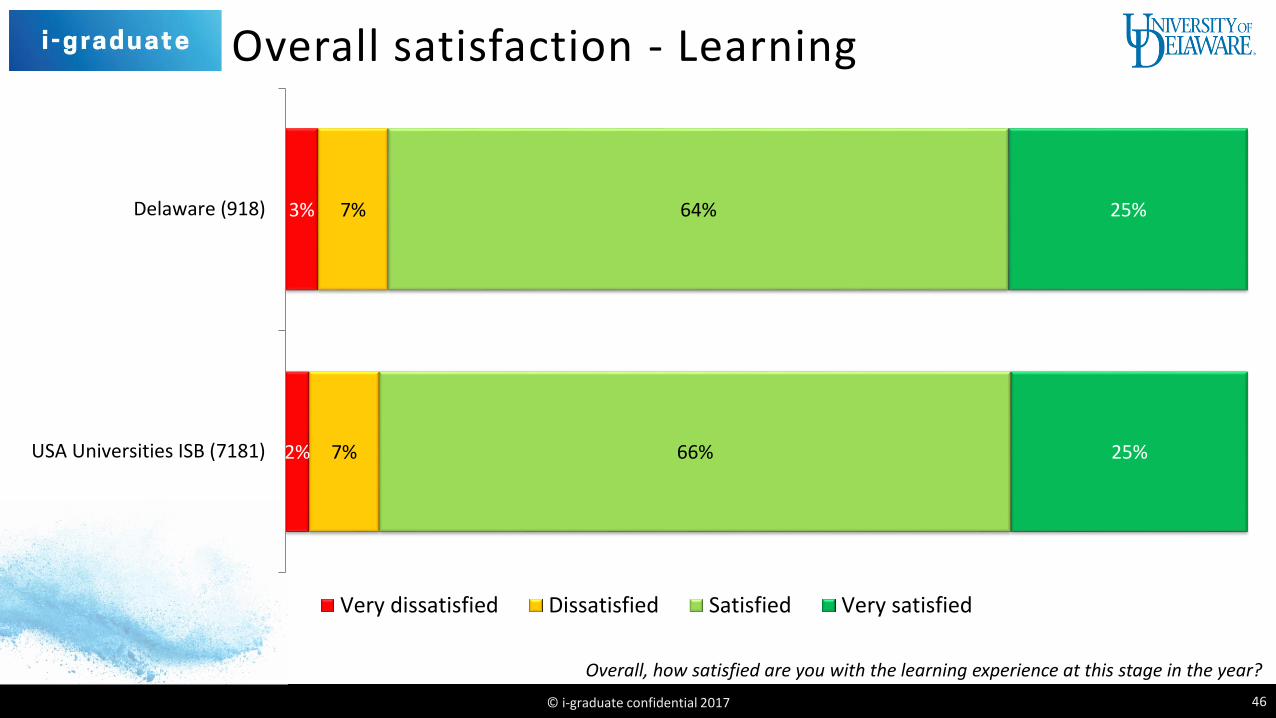
Overall satisfaction - Learning
© i-graduate confidential 2017 46
Overall, how satisfied are you with the learning experience at this stage in the year?
2%
3%
7%
7%
66%
64%
25%
25%
USA Universities ISB (7181)
Delaware (918)
Very dissatisfied Dissatisfied Satisfied Very satisfied
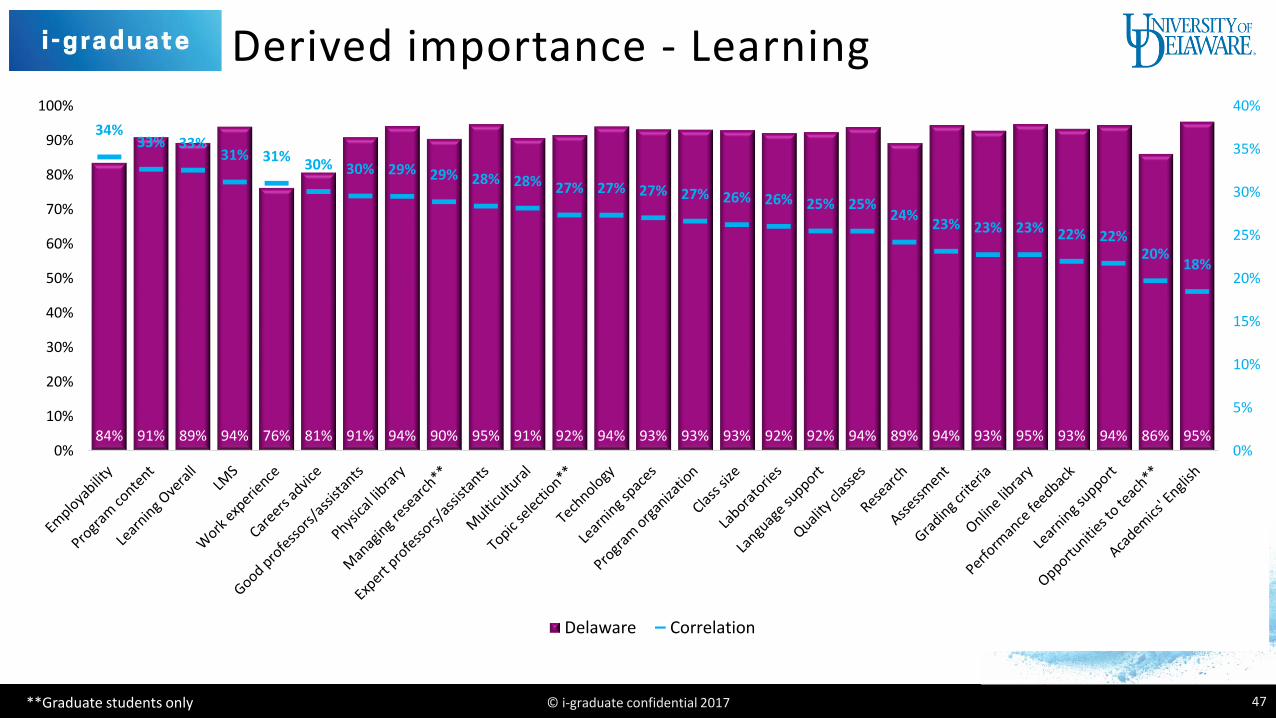
Derived importance - Learning
© i-graduate confidential 2017 47**Graduate students only
84% 91% 89% 94% 76% 81% 91% 94% 90% 95% 91% 92% 94% 93% 93% 93% 92% 92% 94% 89% 94% 93% 95% 93% 94% 86% 95%
34%33% 33%
31% 31%30% 30% 29% 29% 28% 28% 27% 27% 27% 27% 26% 26% 25% 25%
24%23% 23% 23% 22% 22%
20%18%
0%
5%
10%
15%
20%
25%
30%
35%
40%
0%
10%
20%
30%
40%
50%
60%
70%
80%
90%
100%
Delaware Correlation
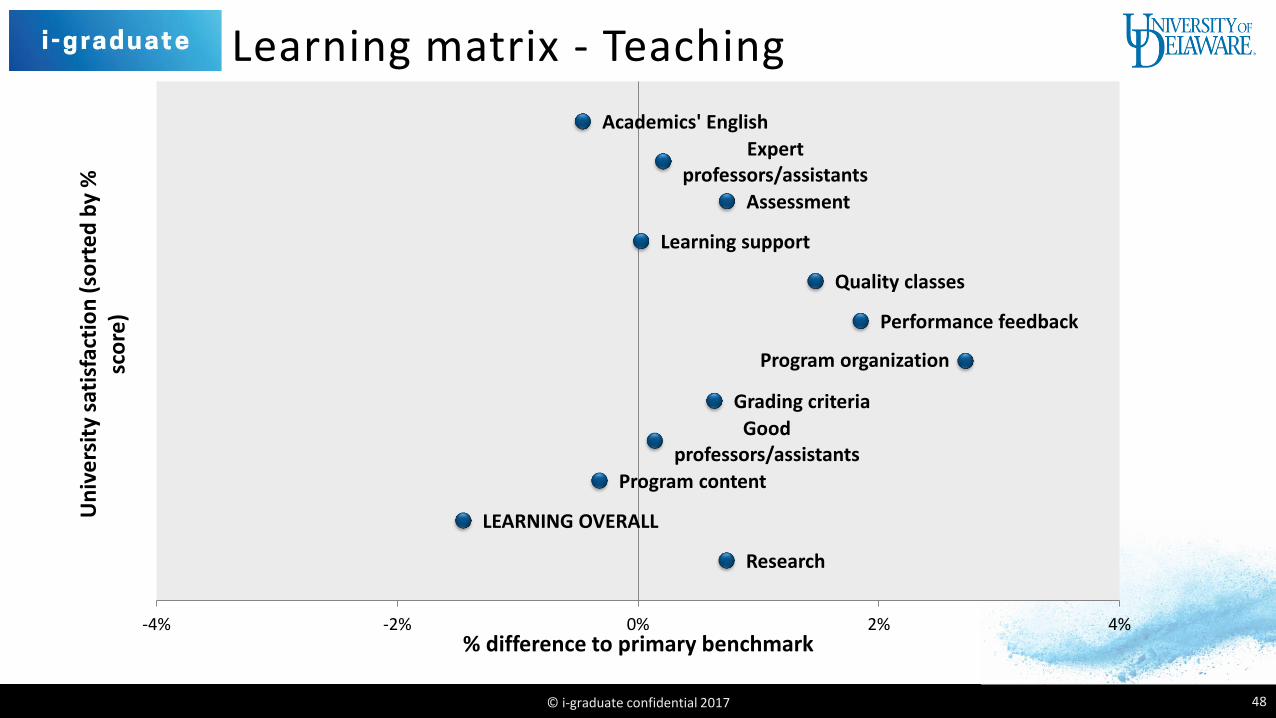
Learning matrix - Teaching
© i-graduate confidential 2017 48
% difference to primary benchmark
Un
ive
rsit
y sa
tisf
acti
on
(so
rte
d b
y %
sc
ore
) Academics' English
Expert professors/assistants
Assessment
Learning support
Quality classes
Performance feedback
Program organization
Grading criteria
Good professors/assistants
Program content
LEARNING OVERALL
Research
-4% -2% 0% 2% 4%

© i-graduate confidential 2017 49
Benchmarking learning - Teaching
Delaware ISB %USA Universities
ISB %N. American
Universities ISB %ISB +/-
USA Universities ISB +/-
N. American Universities ISB +/-
LEARNING AVERAGE 91.2% 86.6% 90.5% 88.9% 4.6% 0.7% 2.3%
LEARNING OVERALL 89.3% 86.6% 90.8% 89.6% 2.7% -1.5% -0.3%
TEACHING
Academics' English 95.4% 91.3% 95.9% 94.6% 4.2% -0.5% 0.8%Expert professors/assistants 94.7% 92.8% 94.5% 94.1% 1.9% 0.2% 0.6%
Assessment 94.5% 89.1% 93.7% 92.0% 5.4% 0.7% 2.5%
Learning support 94.4% 90.0% 94.4% 92.8% 4.4% 0.0% 1.6%
Quality classes 93.9% 87.7% 92.4% 91.0% 6.2% 1.5% 2.8%
Performance feedback 93.4% 85.0% 91.5% 90.2% 8.4% 1.8% 3.2%
Program organization 93.2% 84.4% 90.4% 89.1% 8.8% 2.7% 4.0%
Grading criteria 92.8% 84.7% 92.2% 89.6% 8.2% 0.6% 3.2%Good professors/assistants 91.0% 86.7% 90.8% 89.5% 4.3% 0.1% 1.5%
Program content 91.0% 88.5% 91.3% 90.5% 2.5% -0.3% 0.5%
Research 89.3% 87.5% 88.6% 87.4% 1.8% 0.7% 1.9%
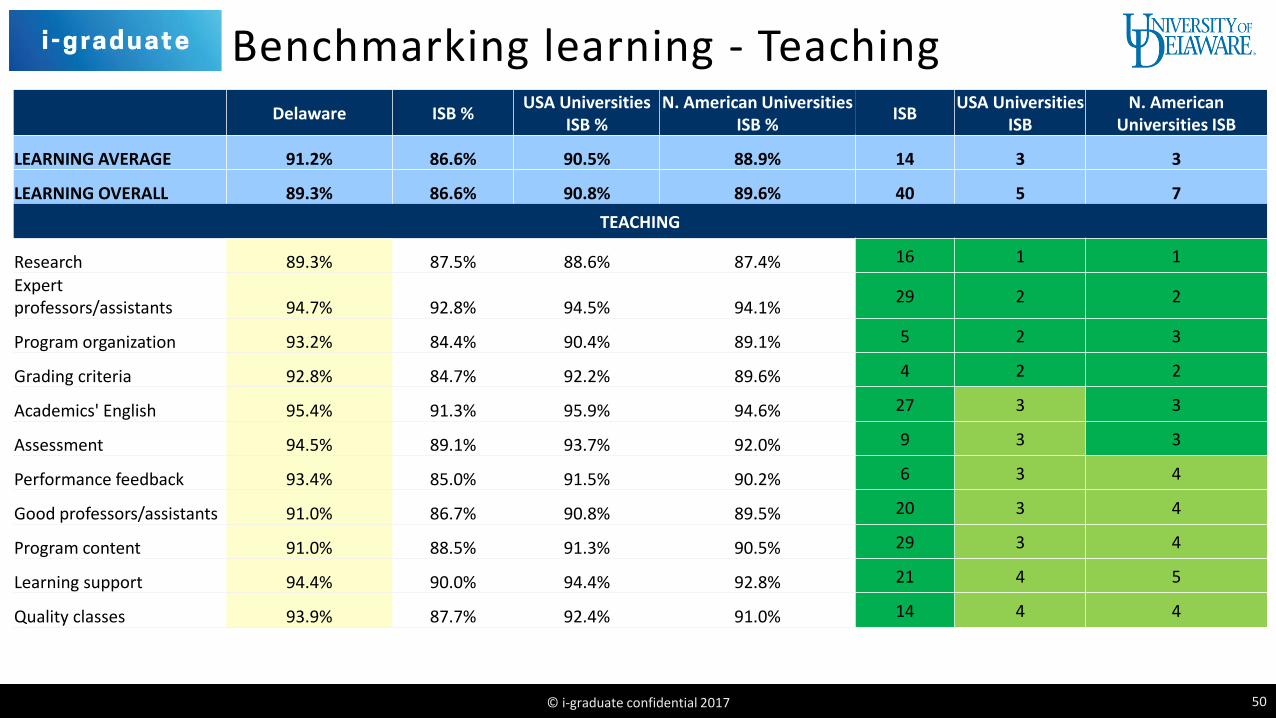
© i-graduate confidential 2017 50
Benchmarking learning - TeachingDelaware ISB %
USA Universities ISB %
N. American Universities ISB %
ISBUSA Universities
ISBN. American
Universities ISB
LEARNING AVERAGE 91.2% 86.6% 90.5% 88.9% 14 3 3
LEARNING OVERALL 89.3% 86.6% 90.8% 89.6% 40 5 7
TEACHING
Research 89.3% 87.5% 88.6% 87.4% 16 1 1
Expert professors/assistants 94.7% 92.8% 94.5% 94.1%
29 2 2
Program organization 93.2% 84.4% 90.4% 89.1% 5 2 3
Grading criteria 92.8% 84.7% 92.2% 89.6% 4 2 2
Academics' English 95.4% 91.3% 95.9% 94.6% 27 3 3
Assessment 94.5% 89.1% 93.7% 92.0% 9 3 3
Performance feedback 93.4% 85.0% 91.5% 90.2% 6 3 4
Good professors/assistants 91.0% 86.7% 90.8% 89.5% 20 3 4
Program content 91.0% 88.5% 91.3% 90.5% 29 3 4
Learning support 94.4% 90.0% 94.4% 92.8% 21 4 5
Quality classes 93.9% 87.7% 92.4% 91.0% 14 4 4

Learning matrix - Studies
© i-graduate confidential 2017 51
% difference to primary benchmark
Un
ive
rsit
y sa
tisf
acti
on
(so
rte
d b
y %
sc
ore
)
**Graduate students only
Class size
Language support
Topic selection**
Multicultural
Managing research**
LEARNING OVERALL
Opportunities to teach**
Employability
Careers advice
Work experience
-4% -2% 0% 2% 4%

© i-graduate confidential 2017 52
Benchmarking learning - Studies
**Graduate students only
Delaware ISB %USA Universities
ISB %N. American
Universities ISB %ISB +/-
USA Universities ISB +/-
N. American Universities ISB +/-
LEARNING AVERAGE 91.2% 86.6% 90.5% 88.9% 4.6% 0.7% 2.3%
LEARNING OVERALL 89.3% 86.6% 90.8% 89.6% 2.7% -1.5% -0.3%
STUDIES
Class size 93.0% 90.2% 91.0% 90.8% 2.8% 2.0% 2.2%
Language support 92.5% 89.7% 92.0% 91.7% 2.8% 0.5% 0.8%
Topic selection** 91.6% 88.1% 90.8% 90.7% 3.5% 0.9% 0.9%
Multicultural 90.7% 91.4% 91.3% 91.0% -0.7% -0.6% -0.3%
Managing research** 90.5% 90.3% 87.9% 87.5% 0.2% 2.5% 3.0%
Opportunities to teach** 86.1% 72.1% 87.9% 81.7% 14.0% -1.8% 4.4%
Employability 83.5% 79.0% 83.7% 81.0% 4.5% -0.1% 2.5%
Careers advice 80.8% 71.0% 79.8% 76.7% 9.8% 0.9% 4.0%
Work experience 76.3% 69.1% 74.7% 72.4% 7.2% 1.6% 4.0%

© i-graduate confidential 2017 53
Benchmarking learning - Studies
**Graduate students only
Delaware ISB %USA
Universities ISB %
N. American Universities ISB %
ISBUSA
Universities ISB
N. American Universities ISB
LEARNING AVERAGE 91.2% 86.6% 90.5% 88.9% 14 3 3
LEARNING OVERALL 89.3% 86.6% 90.8% 89.6% 40 5 7
STUDIES
Managing research** 90.5% 90.3% 87.9% 87.5% 22 1 1
Careers advice 80.8% 71.0% 79.8% 76.7% 15 2 3
Topic selection** 91.6% 88.1% 90.8% 90.7% 16 3 4
Opportunities to teach** 86.1% 72.1% 87.9% 81.7%
5 3 3
Work experience 76.3% 69.1% 74.7% 72.4% 25 3 4
Class size 93.0% 90.2% 91.0% 90.8% 53 4 8
Language support 92.5% 89.7% 92.0% 91.7% 67 4 8
Employability 83.5% 79.0% 83.7% 81.0% 31 5 6
Multicultural 90.7% 91.4% 91.3% 91.0% 88 6 10

Learning matrix - Facilities
© i-graduate confidential 2017 54
% difference to primary benchmark
Un
ive
rsit
y sa
tisf
acti
on
(so
rte
d b
y %
sc
ore
)
Online library
Physical library
Technology
LMS
Learning spaces
Laboratories
LEARNING OVERALL
-3% -1% 1% 3%

© i-graduate confidential 2017 55
Benchmarking learning - FacilitiesDelaware ISB %
USA Universities ISB %
N. American Universities ISB %
ISB +/-USA Universities
ISB +/-N. American
Universities ISB +/-
LEARNING AVERAGE 91.2% 86.6% 90.5% 88.9% 4.6% 0.7% 2.3%
LEARNING OVERALL 89.3% 86.6% 90.8% 89.6% 2.7% -1.5% -0.3%
FACILITIES
Online library 94.9% 90.6% 94.8% 93.4% 4.3% 0.1% 1.5%
Physical library 94.2% 89.6% 93.6% 91.1% 4.6% 0.6% 3.1%
Technology 94.1% 90.1% 93.0% 90.6% 4.0% 1.1% 3.5%
LMS 94.1% 91.1% 94.3% 92.8% 3.0% -0.2% 1.2%
Learning spaces 93.2% 90.3% 91.4% 90.2% 3.0% 1.8% 3.0%
Laboratories 92.2% 91.1% 91.0% 90.0% 1.1% 1.3% 2.2%

© i-graduate confidential 2017 56
Benchmarking learning - Facilities
Delaware ISB %USA
Universities ISB %
N. American Universities ISB %
ISBUSA
Universities ISB
N. American Universities ISB
LEARNING AVERAGE 91.2% 86.6% 90.5% 88.9% 14 3 3
LEARNING OVERALL 89.3% 86.6% 90.8% 89.6% 40 5 7
FACILITIES
Laboratories 92.2% 91.1% 91.0% 90.0% 63 4 5
Online library 94.9% 90.6% 94.8% 93.4% 36 5 5
Physical library 94.2% 89.6% 93.6% 91.1% 46 5 5
Technology 94.1% 90.1% 93.0% 90.6% 44 5 5
LMS 94.1% 91.1% 94.3% 92.8% 40 5 6
Learning spaces 93.2% 90.3% 91.4% 90.2% 53 5 7
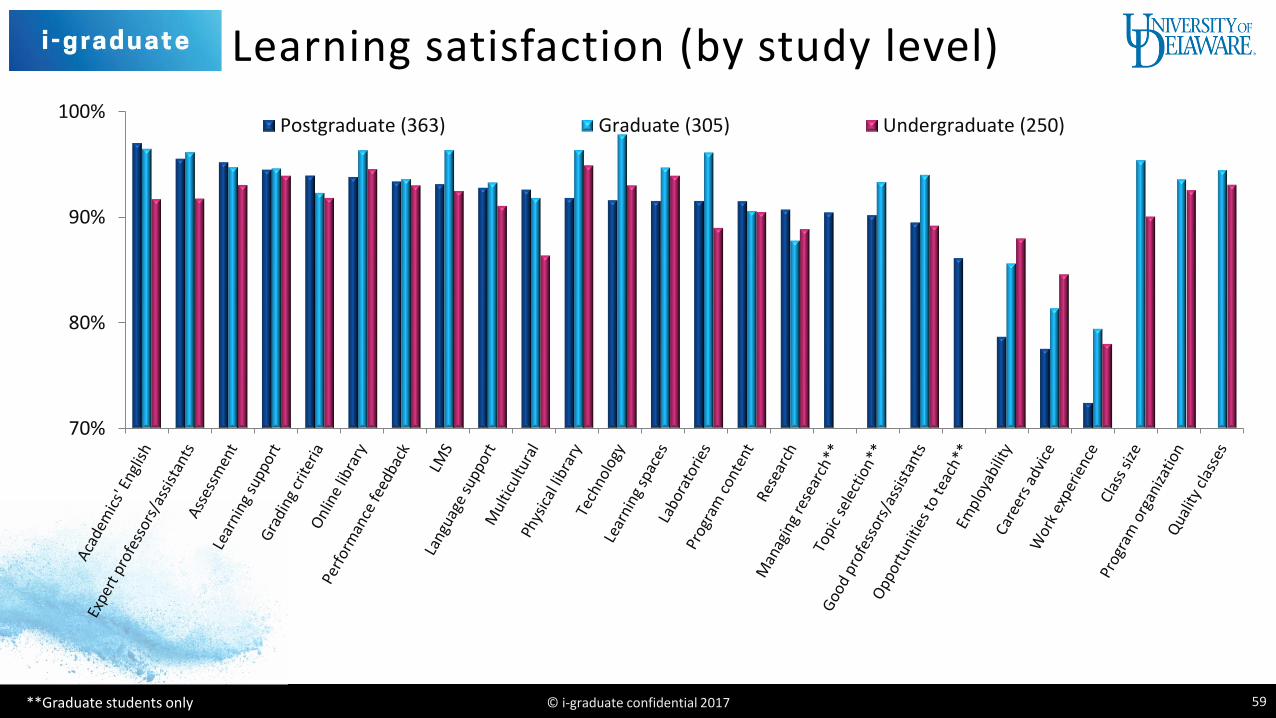
Learning satisfaction (by study level)
© i-graduate confidential 2017 59**Graduate students only
70%
80%
90%
100%Postgraduate (363) Graduate (305) Undergraduate (250)

© i-graduate confidential 2017 65
Engagement
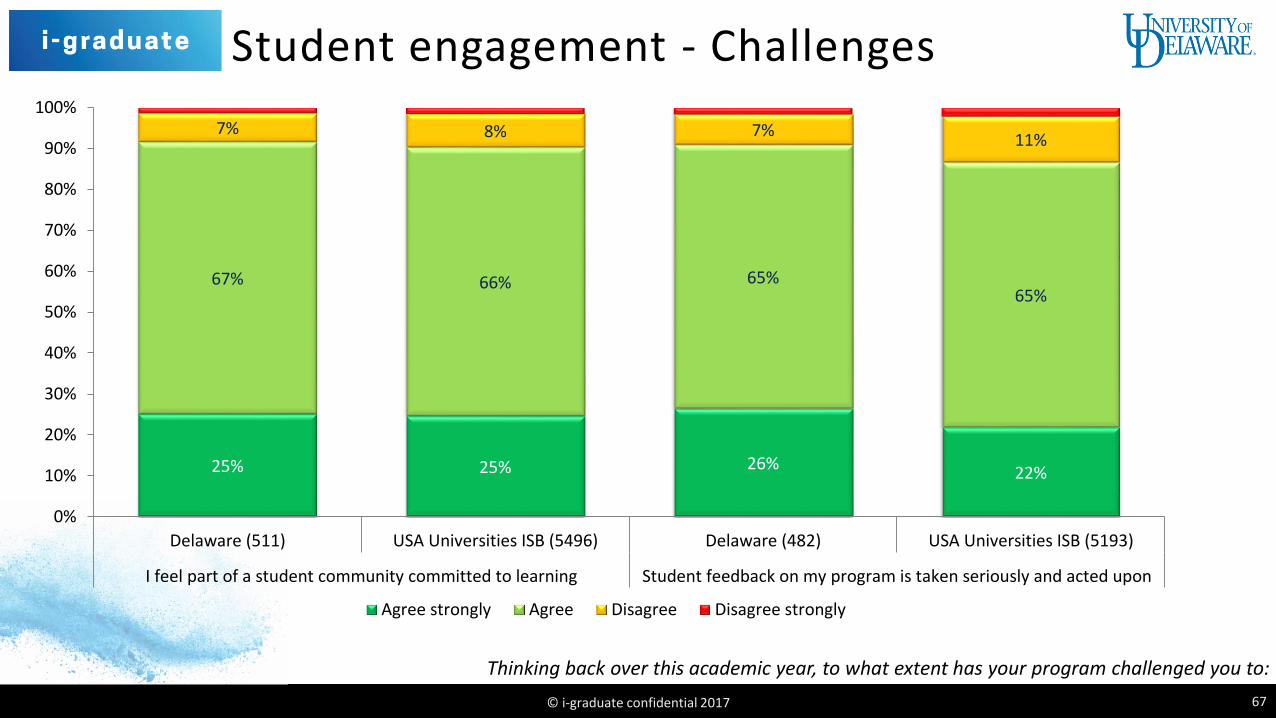
Student engagement - Challenges
© i-graduate confidential 2017 67
Thinking back over this academic year, to what extent has your program challenged you to:
25% 25% 26%22%
67% 66% 65%65%
7% 8% 7%11%
0%
10%
20%
30%
40%
50%
60%
70%
80%
90%
100%
Delaware (511) USA Universities ISB (5496) Delaware (482) USA Universities ISB (5193)
I feel part of a student community committed to learning Student feedback on my program is taken seriously and acted upon
Agree strongly Agree Disagree Disagree strongly

Student engagement
© i-graduate confidential 2017 68
To what extent do you agree or disagree with the following statements:
35% 36%44% 45%
34% 36%
39% 40%
37% 37%
40% 41%
23% 23% 17% 16%24% 22%
0%
10%
20%
30%
40%
50%
60%
70%
80%
90%
100%
Delaware (511) USA Universities ISB(5521)
Delaware (515) USA Universities ISB(5524)
Delaware (514) USA Universities ISB(5522)
Analyze ideas or concepts in greater depth Do your best work Use information, ideas or concepts fromdifferent topics to solve problems
Very often Often Sometimes Never
© i-graduate confidential 2017 69
Living experience

Overall satisfaction - Living
© i-graduate confidential 2017 70
Overall, how satisfied are you with the living experience at this stage in the year?
3%
3%
8%
8%
69%
68%
20%
20%
USA Universities ISB (6756)
Delaware (873)
Very dissatisfied Dissatisfied Satisfied Very satisfied
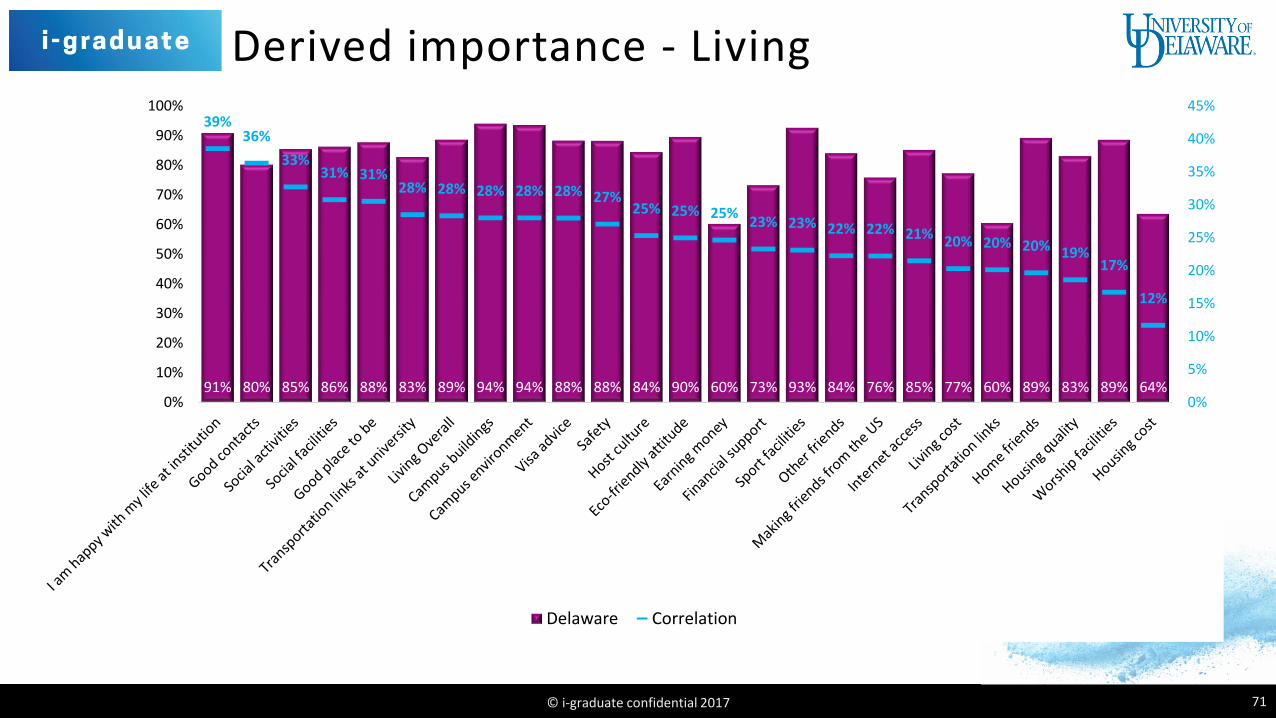
Derived importance - Living
© i-graduate confidential 2017 71
91% 80% 85% 86% 88% 83% 89% 94% 94% 88% 88% 84% 90% 60% 73% 93% 84% 76% 85% 77% 60% 89% 83% 89% 64%
39%36%
33%31% 31%
28% 28% 28% 28% 28% 27%25% 25% 25%
23% 23% 22% 22% 21% 20% 20% 20% 19%17%
12%
0%
5%
10%
15%
20%
25%
30%
35%
40%
45%
0%
10%
20%
30%
40%
50%
60%
70%
80%
90%
100%
Delaware Correlation

Student wellbeing
© i-graduate confidential 2017 72
50%
60%
70%
80%
90%
100%
Home friends
Safety
Other friendsMaking friends from the US
I am happy with my life atinstitution
Delaware ISB (846) USA Universities ISB (6548)

Student wellbeing
© i-graduate confidential 2017 72
Compared to most of your peers, how happy have you being during your time at UD?
24%
65%
8%2%
Very happy Happy Unhappy Very unhappy
Delaware (847)

Living matrix - Housing & living costs
© i-graduate confidential 2017 73
Un
ive
rsit
y sa
tisf
acti
on
(so
rte
d b
y %
sc
ore
)
% difference to primary benchmark
LIVING OVERALL
Internet access
Housing quality
Living cost
Financial support
Housing cost
Earning money
-12% -10% -8% -6% -4% -2% 0% 2% 4% 6% 8% 10% 12%
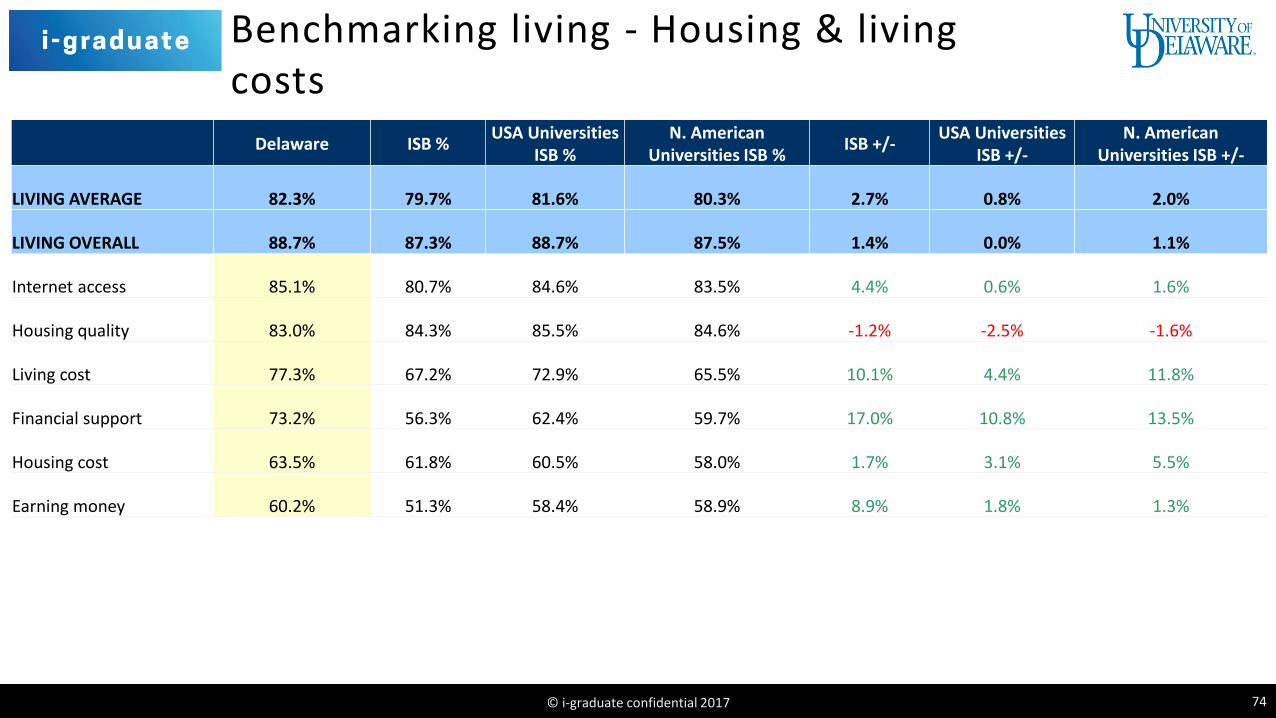
© i-graduate confidential 2017 74
Benchmarking living - Housing & living costs
Delaware ISB %USA Universities
ISB %N. American
Universities ISB %ISB +/-
USA Universities ISB +/-
N. American Universities ISB +/-
LIVING AVERAGE 82.3% 79.7% 81.6% 80.3% 2.7% 0.8% 2.0%
LIVING OVERALL 88.7% 87.3% 88.7% 87.5% 1.4% 0.0% 1.1%
Internet access 85.1% 80.7% 84.6% 83.5% 4.4% 0.6% 1.6%
Housing quality 83.0% 84.3% 85.5% 84.6% -1.2% -2.5% -1.6%
Living cost 77.3% 67.2% 72.9% 65.5% 10.1% 4.4% 11.8%
Financial support 73.2% 56.3% 62.4% 59.7% 17.0% 10.8% 13.5%
Housing cost 63.5% 61.8% 60.5% 58.0% 1.7% 3.1% 5.5%
Earning money 60.2% 51.3% 58.4% 58.9% 8.9% 1.8% 1.3%
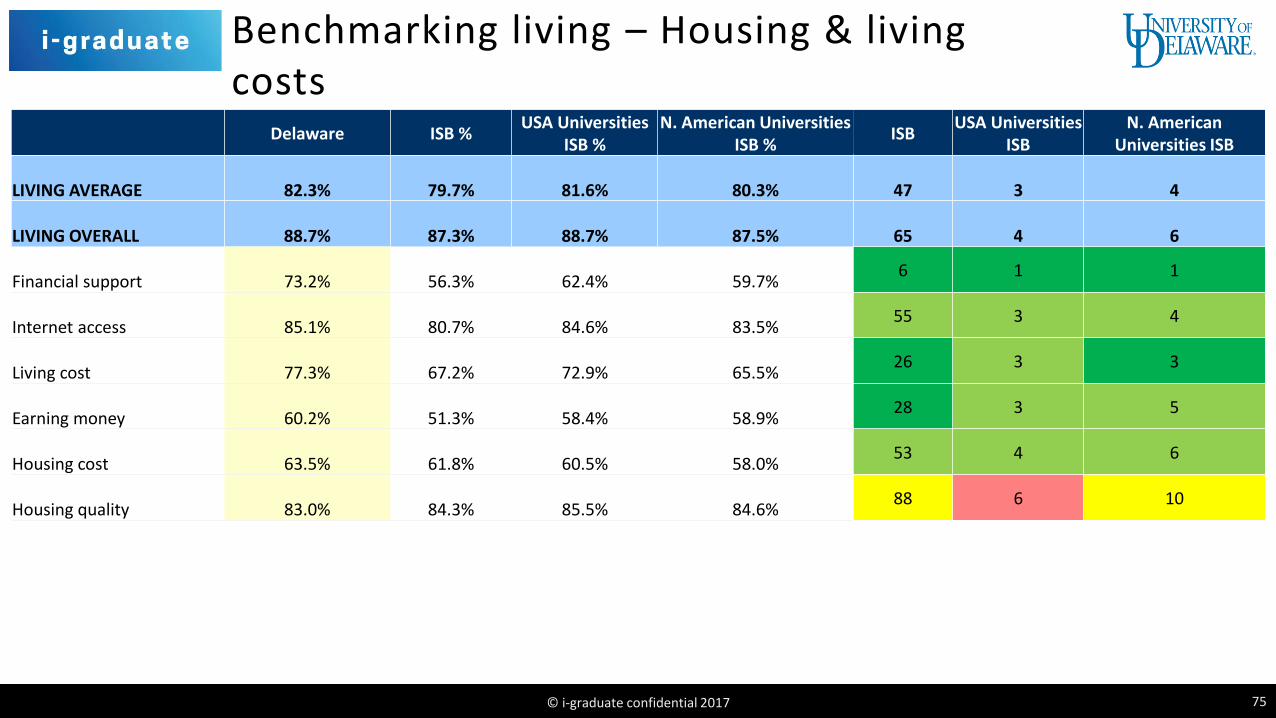
© i-graduate confidential 2017 75
Benchmarking living – Housing & living costs
Delaware ISB %USA Universities
ISB %N. American Universities
ISB %ISB
USA Universities ISB
N. American Universities ISB
LIVING AVERAGE 82.3% 79.7% 81.6% 80.3% 47 3 4
LIVING OVERALL 88.7% 87.3% 88.7% 87.5% 65 4 6
Financial support 73.2% 56.3% 62.4% 59.7%6 1 1
Internet access 85.1% 80.7% 84.6% 83.5%55 3 4
Living cost 77.3% 67.2% 72.9% 65.5%26 3 3
Earning money 60.2% 51.3% 58.4% 58.9%28 3 5
Housing cost 63.5% 61.8% 60.5% 58.0%53 4 6
Housing quality 83.0% 84.3% 85.5% 84.6%88 6 10

Living matrix - Social
© i-graduate confidential 2017 76
Un
ive
rsit
y sa
tisf
acti
on
(so
rte
d b
y %
sc
ore
)
% difference to primary benchmark
Sport facilities
Home friends
LIVING OVERALL
Social facilities
Social activities
Host culture
Other friends
Good contacts
Making friends from the US
-8% -6% -4% -2% 0% 2% 4% 6% 8%

© i-graduate confidential 2017 77
Benchmarking living - Social
Delaware ISB %USA
Universities ISB %
N. American Universities ISB %
ISB +/-USA
Universities ISB +/-
N. American Universities ISB +/-
LIVING AVERAGE 82.3% 79.7% 81.6% 80.3% 2.7% 0.8% 2.0%
LIVING OVERALL 88.7% 87.3% 88.7% 87.5% 1.4% 0.0% 1.1%
SOCIAL
Sport facilities 92.7% 80.7% 90.0% 87.9% 12.0% 2.7% 4.8%
Home friends 89.2% 84.6% 83.2% 83.7% 4.7% 6.0% 5.6%
Social facilities 86.3% 81.7% 85.6% 85.4% 4.5% 0.6% 0.8%
Social activities 85.4% 82.6% 84.4% 83.7% 2.8% 1.0% 1.7%
Host culture 84.5% 85.5% 84.3% 84.9% -1.0% 0.1% -0.4%
Other friends 84.0% 88.6% 83.2% 84.5% -4.5% 0.8% -0.4%
Good contacts 80.2% 78.0% 80.2% 78.7% 2.2% 0.0% 1.5%Making friends from the US 75.8% 72.3% 75.1% 74.8% 3.5% 0.7% 1.0%

© i-graduate confidential 2017 78
Benchmarking living - Social
Delaware ISB %USA
Universities ISB %
N. American Universities ISB %
ISBUSA
Universities ISB
N. American Universities ISB
LIVING AVERAGE 82.3% 79.7% 81.6% 80.3% 47 3 4
LIVING OVERALL 88.7% 87.3% 88.7% 87.5% 65 4 6
SOCIAL
Home friends 89.2% 84.6% 83.2% 83.7% 31 1 3
Social facilities 86.3% 81.7% 85.6% 85.4% 27 2 4
Social activities 85.4% 82.6% 84.4% 83.7% 40 2 4
Other friends 84.0% 88.6% 83.2% 84.5% 99 2 7
Good contacts 80.2% 78.0% 80.2% 78.7% 39 3 4
Making friends from the US 75.8% 72.3% 75.1% 74.8%
39 3 4
Sport facilities 92.7% 80.7% 90.0% 87.9% 12 4 4
Host culture 84.5% 85.5% 84.3% 84.9% 75 4 8

Living matrix - Day to day life
© i-graduate confidential 2017 79
Un
ive
rsit
y sa
tisf
acti
on
(so
rte
d b
y %
sc
ore
)
% difference to primary benchmark
Campus buildings
Campus environment
Eco-friendly attitude
LIVING OVERALL
Worship facilities
Visa advice
Safety
Good place to be
Transportation links at university
Transportation links
-14% -12% -10% -8% -6% -4% -2% 0% 2% 4% 6% 8% 10% 12% 14%

© i-graduate confidential 2017 80
Benchmarking living - Day to day life
Delaware ISB %USA
Universities ISB %
N. American Universities ISB %
ISB +/-USA
Universities ISB +/-
N. American Universities ISB +/-
LIVING AVERAGE 82.3% 79.7% 81.6% 80.3% 2.7% 0.8% 2.0%
LIVING OVERALL 88.7% 87.3% 88.7% 87.5% 1.4% 0.0% 1.1%
DAY TO DAY LIFE
Campus buildings 94.0% 89.3% 90.4% 88.3% 4.7% 3.6% 5.7%
Campus environment 93.5% 91.2% 92.9% 91.4% 2.4% 0.6% 2.1%
Eco-friendly attitude 89.6% 89.2% 91.8% 91.2% 0.4% -2.2% -1.6%
Worship facilities 88.6% 85.6% 87.6% 86.2% 3.0% 1.0% 2.4%
Visa advice 88.3% 82.5% 86.9% 84.7% 5.8% 1.4% 3.7%
Safety 88.2% 92.9% 88.2% 90.7% -4.7% 0.0% -2.5%
Good place to be 87.7% 91.2% 89.2% 89.5% -3.5% -1.5% -1.7%Transportation links at university 82.8% 83.8% 85.6% 80.3% -1.0% -2.7% 2.5%
Transportation links 60.4% 81.6% 72.8% 70.6% -21.2% -12.4% -10.1%

© i-graduate confidential 2017 81
Benchmarking living - Day to day life
Delaware ISB %USA Universities
ISB %N. American Universities
ISB %ISB
USA Universities ISB
N. American Universities ISB
LIVING AVERAGE 82.3% 79.7% 81.6% 80.3% 47 3 4
LIVING OVERALL 88.7% 87.3% 88.7% 87.5% 65 4 6
DAY TO DAY LIFE
Visa advice 88.3% 82.5% 86.9% 84.7% 22 2 3
Campus buildings 94.0% 89.3% 90.4% 88.3% 50 3 3
Campus environment 93.5% 91.2% 92.9% 91.4% 58 3 4
Worship facilities 88.6% 85.6% 87.6% 86.2% 55 4 5
Safety 88.2% 92.9% 88.2% 90.7% 108 5 11
Good place to be 87.7% 91.2% 89.2% 89.5% 99 5 10
Eco-friendly attitude 89.6% 89.2% 91.8% 91.2% 74 6 10
Transportation links at university 82.8% 83.8% 85.6% 80.3%
82 6 8
Transportation links 60.4% 81.6% 72.8% 70.6% 113 7 11
© i-graduate confidential 2017 87
Support experience

Overall satisfaction - Support
© i-graduate confidential 2017 88
Overall, how satisfied are you with the support services at this stage in the year?
2% 6%
6%
77%
77%
15%
17%
USA Universities ISB (6223)
Delaware (807)
Very dissatisfied Dissatisfied Satisfied Very satisfied
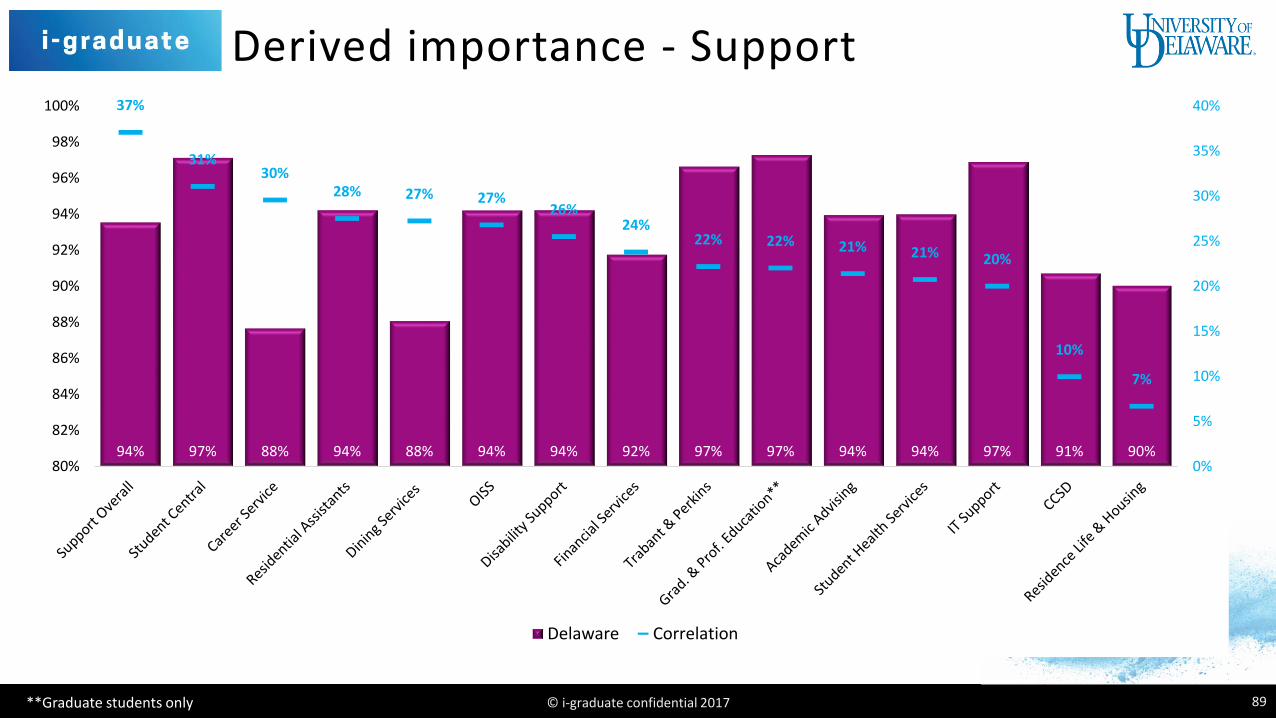
Derived importance - Support
© i-graduate confidential 2017 89**Graduate students only
94% 97% 88% 94% 88% 94% 94% 92% 97% 97% 94% 94% 97% 91% 90%
37%
31%30%
28% 27% 27%26%
24%22% 22% 21% 21% 20%
10%
7%
0%
5%
10%
15%
20%
25%
30%
35%
40%
80%
82%
84%
86%
88%
90%
92%
94%
96%
98%
100%
Delaware Correlation

Support usage
© i-graduate confidential 2017 90**Graduate students only
7%
20%
20%
24%
30%
31%
35%
41%
48%
50%
53%
71%
71%
75%
40%
37%
55%
41%
41%
53%
37%
35%
29%
34%
33%
22%
23%
17%
8%
20%
19%
17%
17%
13%
19%
9%
14%
13%
10%
5%
4%
6%
46%
24%
6%
18%
12%
3%
8%
15%
9%
2%
4%
3%
2%
2%
0% 10% 20% 30% 40% 50% 60% 70% 80% 90% 100%
Disability Support
Residential Assistants
CCSD
Residence Life & Housing
Student Central
Career Service
Academic Advising
Dining Services
Financial Services
Grad. & Prof. Education**
IT Support
Trabant & Perkins
Student Health Services
OISS
Use Aware, Not Used May Be Relevant, Unsure How To Access Not Relevant

Support matrix
© i-graduate confidential 2017 91
Un
ive
rsit
y sa
tisf
acti
on
(so
rte
d b
y %
sc
ore
)
% difference to primary benchmark
**Graduate students only
Grad. & Prof. Education**
Student Central
IT Support
Trabant & Perkins
Disability Support
Residential Assistants
OISS
Student Health Services
Academic Advising
SUPPORT OVERALL
Financial Services
CCSD
Residence Life & Housing
Dining Services
Career Service
-8% -6% -4% -2% 0% 2% 4% 6% 8%

© i-graduate confidential 2017 92
Benchmarking support
**Graduate students only
Delaware ISB %USA Universities
ISB %N. American
Universities ISB %ISB +/-
USA Universities ISB +/-
N. American Universities ISB +/-
SUPPORT AVERAGE 93.4% 91.1% 92.5% 91.1% 2.3% 0.8% 2.2%
SUPPORT OVERALL 93.6% 88.8% 91.2% 90.1% 4.8% 2.4% 3.4%
Grad. & Prof. Education** 97.3% 93.6% 95.8% 94.7% 3.7% 1.5% 2.5%
Student Central 97.1% 92.7% 94.5% 93.4% 4.4% 2.6% 3.7%
IT Support 96.9% 93.7% 95.0% 94.2% 3.2% 1.9% 2.7%
Trabant & Perkins 96.6% 93.6% 97.3% 94.9% 3.1% -0.6% 1.8%
Disability Support 94.2% 93.5% 94.4% 92.1% 0.7% -0.2% 2.1%
Residential Assistants 94.2% 91.0% 93.7% 93.3% 3.2% 0.5% 0.9%
OISS 94.2% 92.1% 90.6% 91.2% 2.1% 3.6% 3.0%
Student Health Services 94.0% 89.2% 90.9% 90.0% 4.8% 3.1% 4.0%
Academic Advising 94.0% 93.0% 93.2% 92.0% 0.9% 0.8% 2.0%
Financial Services 91.8% 89.7% 93.1% 91.4% 2.0% -1.3% 0.4%
CCSD 90.7% 89.8% 91.0% 89.4% 1.0% -0.2% 1.3%
Residence Life & Housing 90.1% 85.4% 89.7% 87.0% 4.6% 0.3% 3.1%
Dining Services 88.1% 82.5% 82.0% 78.5% 5.6% 6.1% 9.6%
Career Service 87.7% 87.3% 90.4% 90.0% 0.4% -2.7% -2.3%

© i-graduate confidential 2017 93
Benchmarking support
**Graduate students only
Delaware ISB %USA Universities
ISB %N. American Universities
ISB %ISB
USA Universities ISB
N. American Universities ISB
SUPPORT AVERAGE 93.4% 91.1% 92.5% 91.1% 37 3 5
SUPPORT OVERALL 93.6% 88.8% 91.2% 90.1% 21 1 2
OISS 94.2% 92.1% 90.6% 91.2% 19 1 3
Dining Services 88.1% 82.5% 82.0% 78.5% 24 1 1
Student Central 97.1% 92.7% 94.5% 93.4% 24 3 3
IT Support 96.9% 93.7% 95.0% 94.2% 42 3 3
Trabant & Perkins 96.6% 93.6% 97.3% 94.9% 24 3 3
Student Health Services 94.0% 89.2% 90.9% 90.0% 22 3 5
Grad. & Prof. Education** 97.3% 93.6% 95.8% 94.7% 14 4 4
Academic Advising 94.0% 93.0% 93.2% 92.0% 58 4 5
CCSD 90.7% 89.8% 91.0% 89.4% 34 4 6
Residence Life & Housing 90.1% 85.4% 89.7% 87.0% 49 4 5
Residential Assistants 94.2% 91.0% 93.7% 93.3% 28 5 7
Financial Services 91.8% 89.7% 93.1% 91.4% 42 6 8
Career Service 87.7% 87.3% 90.4% 90.0% 53 6 9
Disability Support 94.2% 93.5% 94.4% 92.1% 12 2
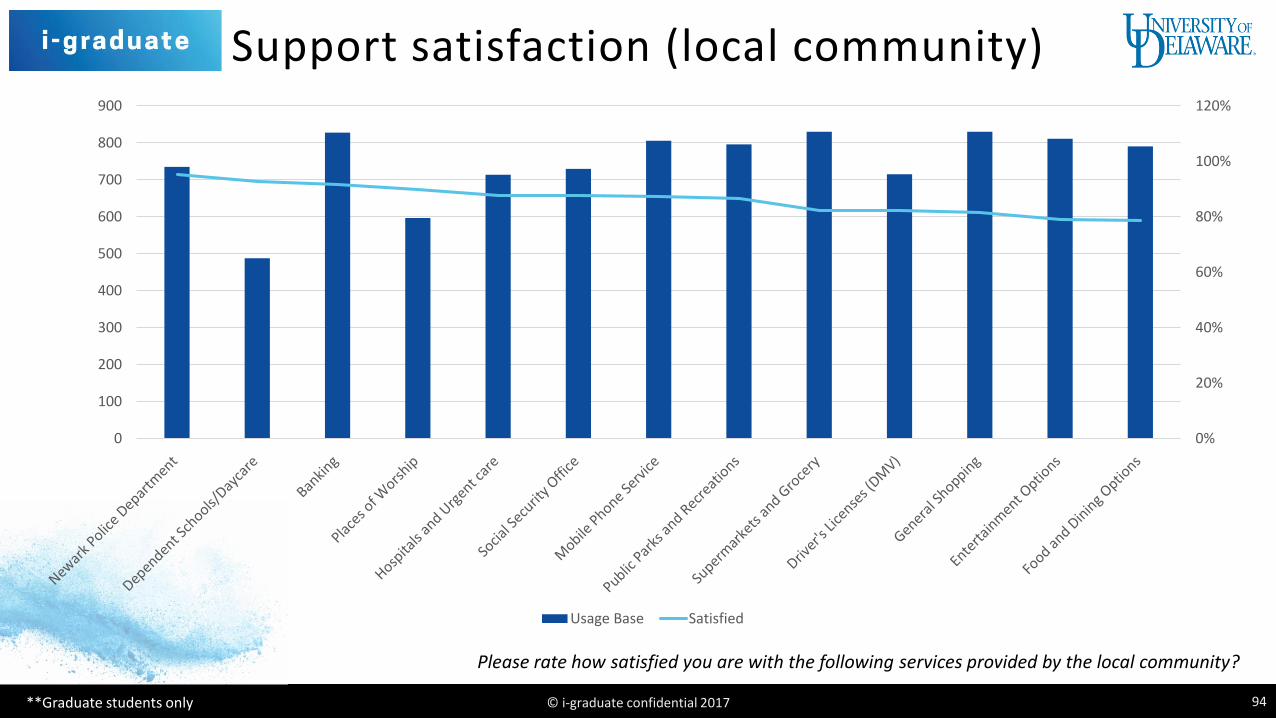
Support satisfaction (local community)
© i-graduate confidential 2017 94**Graduate students only
0%
20%
40%
60%
80%
100%
120%
0
100
200
300
400
500
600
700
800
900
Usage Base Satisfied
Please rate how satisfied you are with the following services provided by the local community?

OISS communication
© i-graduate confidential 2017 94**Graduate students only
Please rate how satisfied you are with the following methods of communication that OISS uses to provide information to you:
87%
88%
89%
90%
91%
92%
93%
94%
95%
96%
97%
98%
0
100
200
300
400
500
600
700
800
900
Email (personal ormass)
Front-DeskAssistance
In-Person Advising Social Media Presentations andSeminars
Paper (letters,posters, etc.)
Base Satisfied %

© i-graduate confidential 2017 99
Future plans

Future plans and career prospects
© i-graduate confidential 2017 100
43% of your students are
planning on entering employment
28% of your students are
planning on doing further study
75% (76%) are satisfied with the career
advice from academic staff
83% (83%) are satisfied that their program will help
them to get a good job
73% (79%) are satisfied with making good contacts for
the future
29% of your students are
planning on going travelling, or are undecided
Delaware ISB
USA Universities ISB

© i-graduate confidential 2017 101
Conclusions

Thank-you
© i-graduate confidential 2017 103
▪ A member of the i-graduate Research Team will be in
contact with details of your university’s online password-
protected Filestore (www.i-graduate.org/filestore)
▪ Filestore contains: full PDF presentation, open comments
spreadsheet, university breakdown sheet, pivot table and
ranking sheets

© i-graduate confidential 2017 104
Appendix
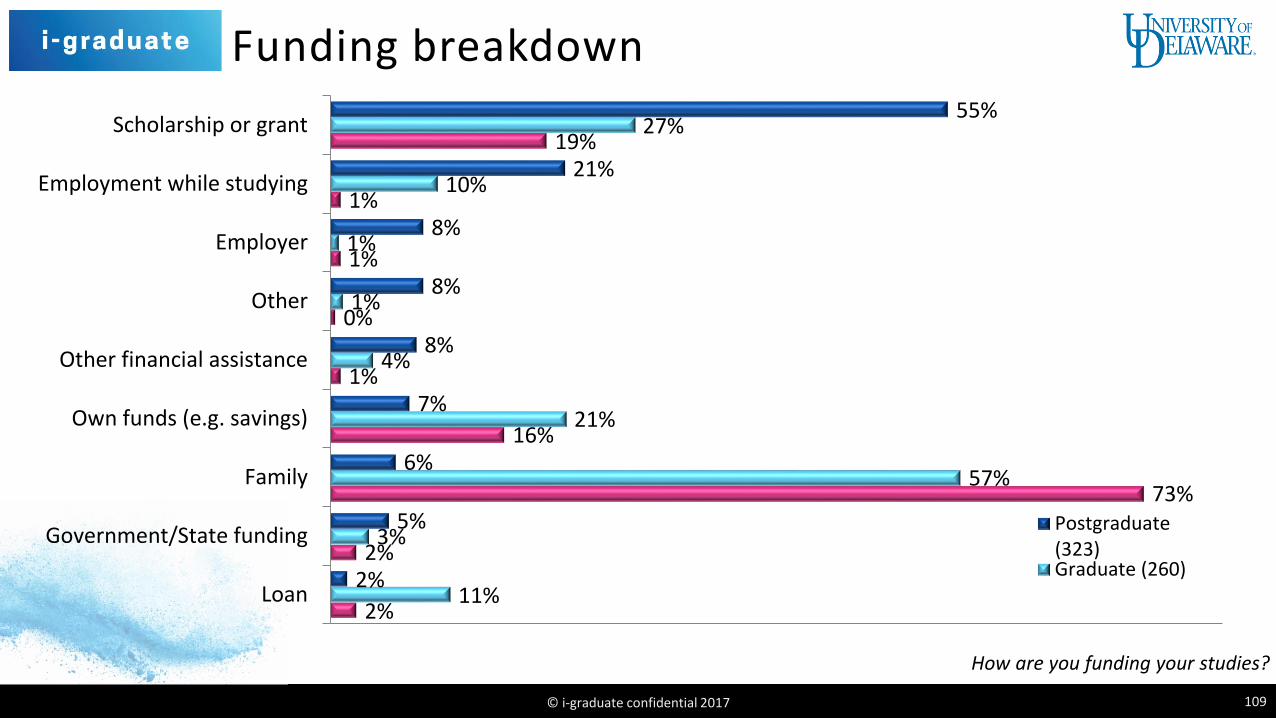
Funding breakdown
© i-graduate confidential 2017 109
How are you funding your studies?
55%
21%
8%
8%
8%
7%
6%
5%
2%
27%
10%
1%
1%
4%
21%
57%
3%
11%
19%
1%
1%
0%
1%
16%
73%
2%
2%
Scholarship or grant
Employment while studying
Employer
Other
Other financial assistance
Own funds (e.g. savings)
Family
Government/State funding
Loan
Postgraduate(323)Graduate (260)

University support base numbers
© i-graduate confidential 2017 110**Graduate students only
ElementOISS 605
Trabant & Perkins 566
Student Health Services 566
IT Support 420
Financial Services 389
Dining Services 328
Grad. & Prof. Education** 294
Academic Advising 281
Career Service 252
Student Central 243
Residence Life & Housing 191
CCSD 162
Residential Assistants 156
Disability Support 52

Deliverables
© i-graduate confidential 2017 111
Verbatim comments
University-specific data Detailed presentations Summary findings
“Great university, great teachers, great housing, so many way to make American and foreign friends, a very beautiful place, ecologic.
It's the best year of my life, i think I'm very lucky to study here and i will advice this university at everyone without any doubt!”
© i-graduate confidential 2017 112
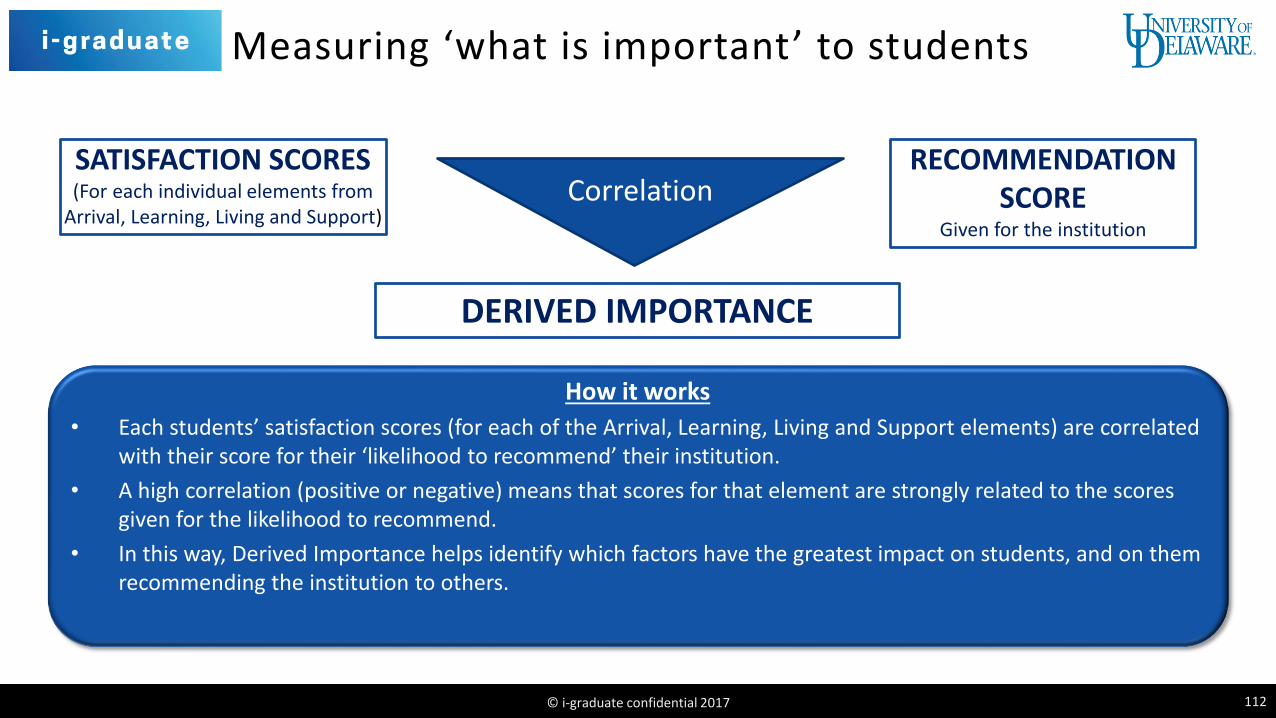
Measuring ‘what is important’ to students
SATISFACTION SCORES(For each individual elements from
Arrival, Learning, Living and Support)
DERIVED IMPORTANCE
RECOMMENDATION SCORE
Given for the institution
CORRELATION ANALYSISCorrelation
How it works
• Each students’ satisfaction scores (for each of the Arrival, Learning, Living and Support elements) are correlated with their score for their ‘likelihood to recommend’ their institution.
• A high correlation (positive or negative) means that scores for that element are strongly related to the scores given for the likelihood to recommend.
• In this way, Derived Importance helps identify which factors have the greatest impact on students, and on them recommending the institution to others.
Introducing the i-mark
© i-graduate confidential 2017 113
“We are using the i-mark on our admission webpages to show potential students that we use the ISB for program quality management and service development.”
ISB University Partner
▪ Available to HE universities worldwide taking part in the ISB or SB
▪ Instant and easy recognition of an university’s dedication to the student experience
▪ Use on website and promotional literature

© i-graduate confidential 2017 115
Appendix - Questionnaire
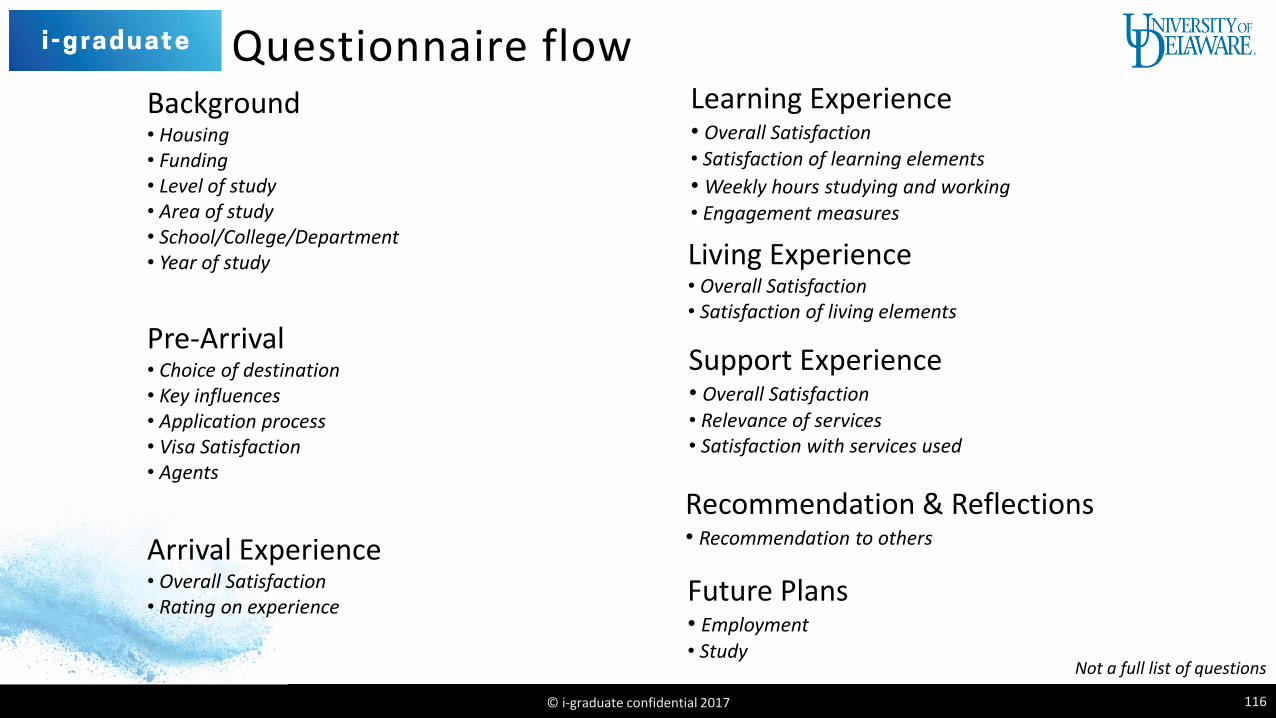
Questionnaire flow
© i-graduate confidential 2017 116
Background• Housing• Funding• Level of study• Area of study• School/College/Department• Year of study
Arrival Experience• Overall Satisfaction• Rating on experience
Learning Experience• Overall Satisfaction• Satisfaction of learning elements
• Weekly hours studying and working• Engagement measures
Pre-Arrival• Choice of destination• Key influences• Application process• Visa Satisfaction• Agents
Living Experience• Overall Satisfaction• Satisfaction of living elements
Support Experience• Overall Satisfaction• Relevance of services• Satisfaction with services used
Recommendation & Reflections• Recommendation to others
Future Plans• Employment• Study
Not a full list of questions

© i-graduate confidential 2017 117
Arrival terminology
Terminology in University Questionnaire Terminology in Report
Meeting academic staff Meeting staff
Understanding how my program of study would work Study sense
University orientation University orientation programRegistration for classes Registration for classes
Formal welcome at the institution Formal welcome
Orientation (finding my way around the local area) Local orientation
Making friends from this country Host friendsInternet access at my program Internet access
Making friends from other countries Other friendsSetting up a bank account Bank account
The social activities (organized events) Social activitiesMaking friends from my home country Home friends
Condition of housing on arrival Housing conditionFirst night - getting to where I would stay First night
Welcome/pickup at airport, railway, bus station WelcomeStudent Financial Services Financial Services
Residence Life and Housing Residence Life & Housing

© i-graduate confidential 2017 118
Learning terminology - TeachingTerminology in Questionnaire Terminology in Report
The quality of lectures (undergraduate & graduate) Quality professors/assistants
The subject area expertise of professors/supervisors Expert professors/assistants
The teaching ability of professors/supervisors Good teachers
The academic content of my progress/studies Program content
The organisation and smooth running of the program (undergraduate & graduate) Program organization
The level of research activity Research
Academic staff whose English I can understand Academics' English
Getting time from academic staff when I need it/ personal support with learning Learning support
Feedback on coursework/ formal written submissions Performance feedback
Explanation of grading/ assessment criteria Grading criteria
Fair and transparent assessment of my work Assessment

© i-graduate confidential 2017 119
Learning terminology - StudiesTerminology in Questionnaire Terminology in Report
Guidance in topic selection and refinement by my supervisor (graduate & postgraduate) Topic selection**
Confidence about managing a research project as a result of my experience so far (postgraduate) Managing research**
Advice and guidance on long-term job opportunities and careers from academic staff Career advice
Learning that will help me get a good job Employability
Opportunities for work experience/ work placements as a part of my studies Work experience
Studying with people from other cultures Multicultural
Help to improve my English language skills Language support
Opportunities to teach (postgraduate) Opportunities to teach**
The size of classes (undergraduate & graduate) Class size
**Graduate students only
© i-graduate confidential 2017 120
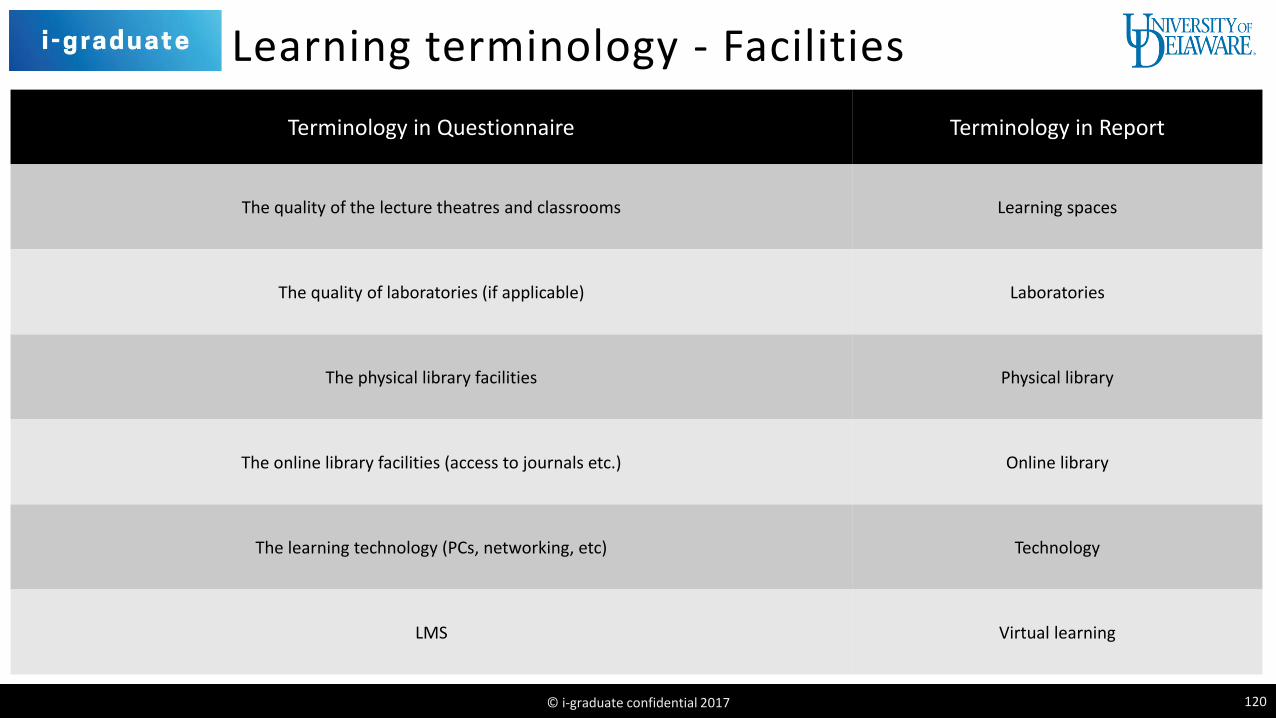
Learning terminology - Facilities
Terminology in Questionnaire Terminology in Report
The quality of the lecture theatres and classrooms Learning spaces
The quality of laboratories (if applicable) Laboratories
The physical library facilities Physical library
The online library facilities (access to journals etc.) Online library
The learning technology (PCs, networking, etc) Technology
LMS Virtual learning

© i-graduate confidential 2017 121
Living terminology - Housing & living costs
Terminology in Questionnaire Terminology in Report
Access to suitable housing Housing access
The quality of housing(excludes ‘living at home’/‘living with friends or relatives’)
Housing quality
The cost of housing(excludes ‘living at home’/‘living with friends or relatives’)
Housing cost
The cost of living (food, drink, transport and social) Living cost
The opportunity to earn money while studying Earning money
The availability of financial support/scholarships etc. Financial support
Internet access at my housing Internet access
© i-graduate confidential 2017 122
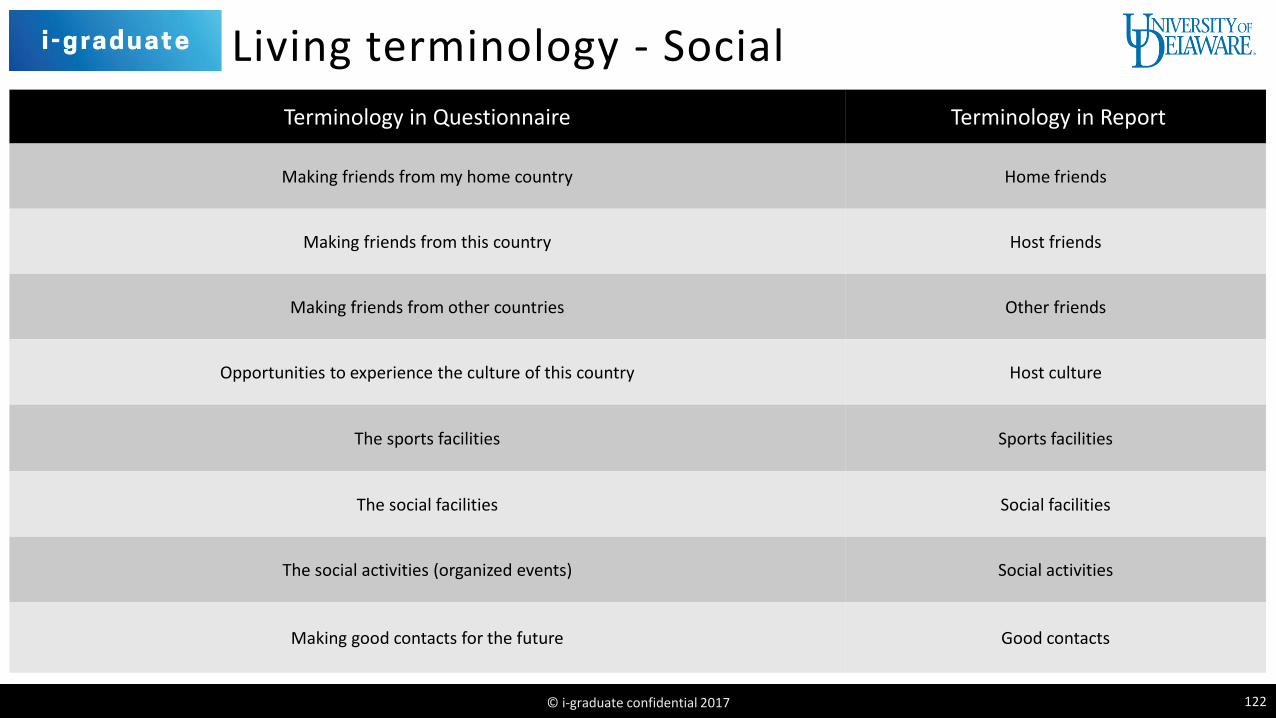
Living terminology - Social
Terminology in Questionnaire Terminology in Report
Making friends from my home country Home friends
Making friends from this country Host friends
Making friends from other countries Other friends
Opportunities to experience the culture of this country Host culture
The sports facilities Sports facilities
The social facilities Social facilities
The social activities (organized events) Social activities
Making good contacts for the future Good contacts
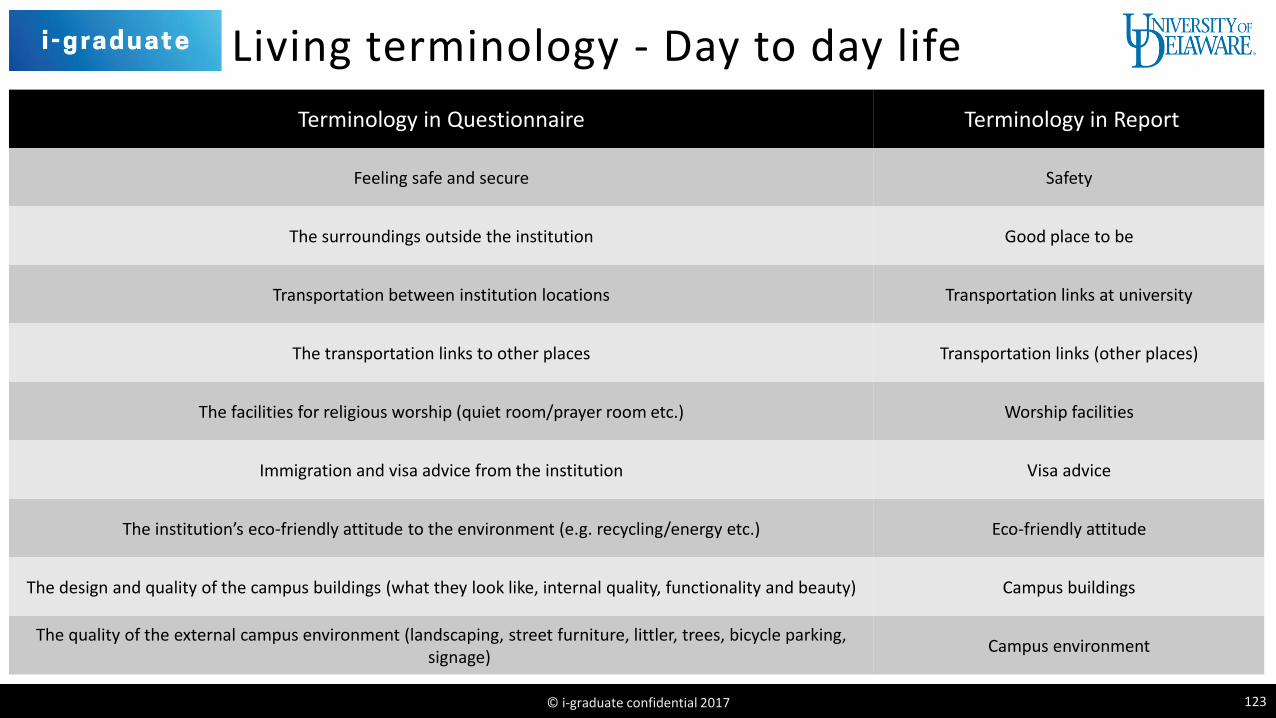
© i-graduate confidential 2017 123
Living terminology - Day to day life
Terminology in Questionnaire Terminology in Report
Feeling safe and secure Safety
The surroundings outside the institution Good place to be
Transportation between institution locations Transportation links at university
The transportation links to other places Transportation links (other places)
The facilities for religious worship (quiet room/prayer room etc.) Worship facilities
Immigration and visa advice from the institution Visa advice
The institution’s eco-friendly attitude to the environment (e.g. recycling/energy etc.) Eco-friendly attitude
The design and quality of the campus buildings (what they look like, internal quality, functionality and beauty) Campus buildings
The quality of the external campus environment (landscaping, street furniture, littler, trees, bicycle parking, signage)
Campus environment

© i-graduate confidential 2017 124
Support terminology
**Graduate students only
Terminology in University Questionnaire Terminology in Report
Office of International Students and Scholars OISS
University Student Centers (Trabant and Perkins) Trabant & Perkins
Student Health Services Student Health Services
IT and system support IT Support
Student Financial Services Financial Services
Dining Services Dining Services
Graduate and Professional Education Grad. & Prof. Education**
Academic Advising Academic Advising
Career Service Career Service
Student Central (student clubs) Student Central
Residence Life and Housing Residence Life & Housing
Center for Counseling and Student Development CCSD
Residential Assistants Residential Assistants
Disability Support Services Disability Support
Contact:
www.i-graduate.org
@igraduate
© i-graduate confidential 2017 125
![Barometer [2006]](https://static.fdocuments.in/doc/165x107/577d35011a28ab3a6b8f584c/barometer-2006.jpg)