International Journal of Hybrid Intelligent Systems 11 ... · International Journal of Hybrid...
15
International Journal of Hybrid Intelligent Systems 11 (2014) 25–39 25 DOI 10.3233/HIS-130181 IOS Press Distributed recognition system for drilling events detection and classification Arghad Arnaout a,∗ , Paul O’Leary a , Bilal Esmael b and Gerhard Thonhauser a a Institute for Automation, University of Loeben, Leoben, Austria b Chair of Drilling, University of Leoben, Leoben, Austria Abstract. Several sensor measurements collected from drilling rig during oil well drilling process. These measurements carry information not only about operational states of drilling rig but also about all high-level operations and activities performed by drilling crew. The work presented in this paper shed the light on analysis of hidden lost time in drilling process through automatic detection and classification of drilling operations. This paper develops a novel algorithm for detecting drilling events and operations in sensor data of drilling rig. Expectation Maximization EM and Piecewise Linear Approximation PLA algorithms applied for detecting drilling events. The Expectation Maximization algorithm performs high-level segmentation on hook-load sensor data. In addition, Piecewise Linear Approxima- tion algorithm slices standpipe pressure; pump flow rate; rotational speed and torque of top drive motor into labeled segments (low-level segmentation). Merging results from both Expectation Maximization and Piecewise Linear Approximation gives the suggested algorithm ability to detect all drilling events and activities performed by drilling rig and crew. Moreover, this paper shows the usage of discrete orthonormal basis functions (Gram basis) as a tool to classify drilling operations from detected seg- ments in drilling time series. The classification process performed in cooperation with the concept of Patterns Templates Base. The optimal polynomial degree to represent drilling operations has been concluded through analysis of polynomial spectrum of each drilling operation. Keywords: Drilling operations, gram polynomials, Expectation Maximization, Piecewise Linear Approximation, orthonormal basis functions 1. Introduction Improving performance of drilling process is a big challenge in nowadays drilling industry. To improve drilling performance, we need first to measure it [8]. Performance measurement means determining quan- titative values or weights that describe each drilling operation and complete drilling process as resultant. For example, duration of each drilling operation con- sidered as a useful measure. In addition, number of drilling operations and distributions of those opera- tions over different well drilling phases are important measures of drilling performance. ∗ Corresponding author: Arghad Arnaout, Institute for Automa- tion, University of Loeben, Leoben, Austria. E-mail: Arghad@stud. unileoben.ac.at. Automatic detection of drilling events and opera- tions considered as an urgent need in the drilling in- dustry. Detecting these events gives services of drilling data analysis more aptitude to examine all actions performed by the drilling crew at the rig site [8]. Furthermore, automatic detection also provides essen- tial mechanisms to judge the performance of drilling machinery. Moreover, this leads to the possibility to perform sequence mining and analysis on particular drilling process sections. Usually sensors measurements collected during the whole drilling process. Such measurements used by drilling engineers and drilling crews to monitor the drilling process by action/response models [2]. For ex- ample, any change in the hydraulic flow rate parame- ter causes a response in the pump pressure. Likewise, torque measurements observed through altering the ro- tational speed of the drill string. 1448-5869/14/$27.50 c 2014 – IOS Press. All rights reserved AUTHOR COPY
Transcript of International Journal of Hybrid Intelligent Systems 11 ... · International Journal of Hybrid...
International Journal of Hybrid Intelligent Systems 11 (2014) 25–39 25DOI 10.3233/HIS-130181IOS Press
Distributed recognition system for drillingevents detection and classification
Arghad Arnaouta,∗, Paul O’Learya, Bilal Esmaelb and Gerhard ThonhauseraaInstitute for Automation, University of Loeben, Leoben, AustriabChair of Drilling, University of Leoben, Leoben, Austria
Abstract. Several sensor measurements collected from drilling rig during oil well drilling process. These measurements carryinformation not only about operational states of drilling rig but also about all high-level operations and activities performed bydrilling crew. The work presented in this paper shed the light on analysis of hidden lost time in drilling process through automaticdetection and classification of drilling operations.This paper develops a novel algorithm for detecting drilling events and operations in sensor data of drilling rig. ExpectationMaximization EM and Piecewise Linear Approximation PLA algorithms applied for detecting drilling events. The ExpectationMaximization algorithm performs high-level segmentation on hook-load sensor data. In addition, Piecewise Linear Approxima-tion algorithm slices standpipe pressure; pump flow rate; rotational speed and torque of top drive motor into labeled segments(low-level segmentation). Merging results from both Expectation Maximization and Piecewise Linear Approximation gives thesuggested algorithm ability to detect all drilling events and activities performed by drilling rig and crew. Moreover, this papershows the usage of discrete orthonormal basis functions (Gram basis) as a tool to classify drilling operations from detected seg-ments in drilling time series. The classification process performed in cooperation with the concept of Patterns Templates Base.The optimal polynomial degree to represent drilling operations has been concluded through analysis of polynomial spectrum ofeach drilling operation.
Keywords: Drilling operations, gram polynomials, Expectation Maximization, Piecewise Linear Approximation, orthonormalbasis functions
1. Introduction
Improving performance of drilling process is a bigchallenge in nowadays drilling industry. To improvedrilling performance, we need first to measure it [8].Performance measurement means determining quan-titative values or weights that describe each drillingoperation and complete drilling process as resultant.For example, duration of each drilling operation con-sidered as a useful measure. In addition, number ofdrilling operations and distributions of those opera-tions over different well drilling phases are importantmeasures of drilling performance.
∗Corresponding author: Arghad Arnaout, Institute for Automa-tion, University of Loeben, Leoben, Austria. E-mail: [email protected].
Automatic detection of drilling events and opera-tions considered as an urgent need in the drilling in-dustry. Detecting these events gives services of drillingdata analysis more aptitude to examine all actionsperformed by the drilling crew at the rig site [8].Furthermore, automatic detection also provides essen-tial mechanisms to judge the performance of drillingmachinery. Moreover, this leads to the possibility toperform sequence mining and analysis on particulardrilling process sections.
Usually sensors measurements collected during thewhole drilling process. Such measurements used bydrilling engineers and drilling crews to monitor thedrilling process by action/response models [2]. For ex-ample, any change in the hydraulic flow rate parame-ter causes a response in the pump pressure. Likewise,torque measurements observed through altering the ro-tational speed of the drill string.
1448-5869/14/$27.50 c© 2014 – IOS Press. All rights reserved
AUTH
OR
COPY

26 A. Arnaout et al. / Distributed recognition system for drilling events detection and classification
Through drilling process, a huge amount of datain form of sensors measurements produced over time.This data contains not only readings of sensors but alsoinformation about each drilling operation i.e. start, end,and behavior of each equipment. Drilling operationssuch as formations drilling, making connection for newdrillstand, breaking connection, pulling out of hole,running in hole, and cleaning hole are carefully cho-sen as basic drilling operations performed by drillingcrew [6]. Each of those drilling operation has a specificpattern in rig sensors measurements [1].
The cyclic nature of drilling processes exposes spe-cific patterns for each drilling activity or event in sen-sor measurements. Furthermore, each time series ofsensor data has specific statistical distribution. Thesedistributions look very similar in almost all similar-type drilling rigs (offshore or land rigs). This gives thedrilling process a similarity property [1,2]. Here wecan find a big chance to generalize our findings andanalyses.
Expectation Maximization (EM) is a powerful toolto estimate the parameters of Gaussian distributions inthe data. EM has ability to discriminate data into clus-ters if this data have the nature of Gaussian mixturemodels. EM provides the possibility to find and de-scribe main clusters in the data by estimating descrip-tion parameters of each cluster. Segmenting of databased on a cluster will be a minor task if the parametersare estimated [3]. The Expectation Maximization algo-rithm considered with stable performance in data withless amount of noise [4]. Piecewise Linear Approxi-mation (PLA) is another important tool for time seriessegmentation. Usually PLA used to approximate mainsections in time series. PLA has no tolerance to datawith low value of signal to noise ratio, but it applied todata with a limited S/N ratio [5].
Patterns recognition using discrete polynomial mo-ments as features to classify the data is a nowadaystrend in patterns recognition domain. Most of the stud-ies in this area perform detection of patterns after cal-culating polynomial moments from data. The calcu-lated coefficients called features. These features con-sidered as descriptors of pre-defined templates in thedata. Those templates extracted during learning phase.Then the templates and calculated features used toclassify unknown data and assign classes to it [9].
Detecting drilling operations patterns in sensors datasupports rig operators in finding out the state of drillingrig instantly. At the end of the day, it gives detailedinformation on rig state over any span of time [8].Therefore, rig’s operator can easily observe operatingtime of drilling rig and how actual drilling performancematches with pre-defined well plan.
2. Contribution
The contribution of this paper outlined as follows:1. Automatic detection of different drilling events
and operations;2. Show how prior-knowledge on drilling process
affects all suggested algorithms;3. Hiring Expectation Maximization algorithm as
core algorithm for high-level segmentation ofhookload sensor data;
4. Piecewise Linear Approximation algorithm ap-plied as low-level segmentation of Block Positionsensor data;
5. Combine two algorithms (EM and PLA) to ac-complish multi-level drilling time series segmen-tation;
6. Using discrete polynomial moments (Gram ba-sis functions) as descriptors of drilling operationstemplates;
7. Suggest weighted similarity distance based onMahalanobis distance and sensors importancematrix;
8. Combining phases of segmentation and classi-fication for drilling operations using distributedcomponent architecture.
3. Drilling process and Rig’s sensor measuremtns
Oil well drilling is a process of making a hole in theground in order to extract oil, gas or any other naturalresources from the subsurface; usually performed by arig. One of the most important parts of such a drillingrig is the drill-string. A drill-string is a chain of con-nected pipes usually having a length of 10 meters each.The bottom end of drill-string is made of special de-vices, denoted as bottom hole assembly (BHA). Thelast part of the BHA is drill-bit [6].
Numerous sensors are mounted at the rig to recorddifferent physical measurements during drilling suchas block position, hook-load, flow rates, pump andcirculation pressures, hole and bit depth and torque,among others [2].
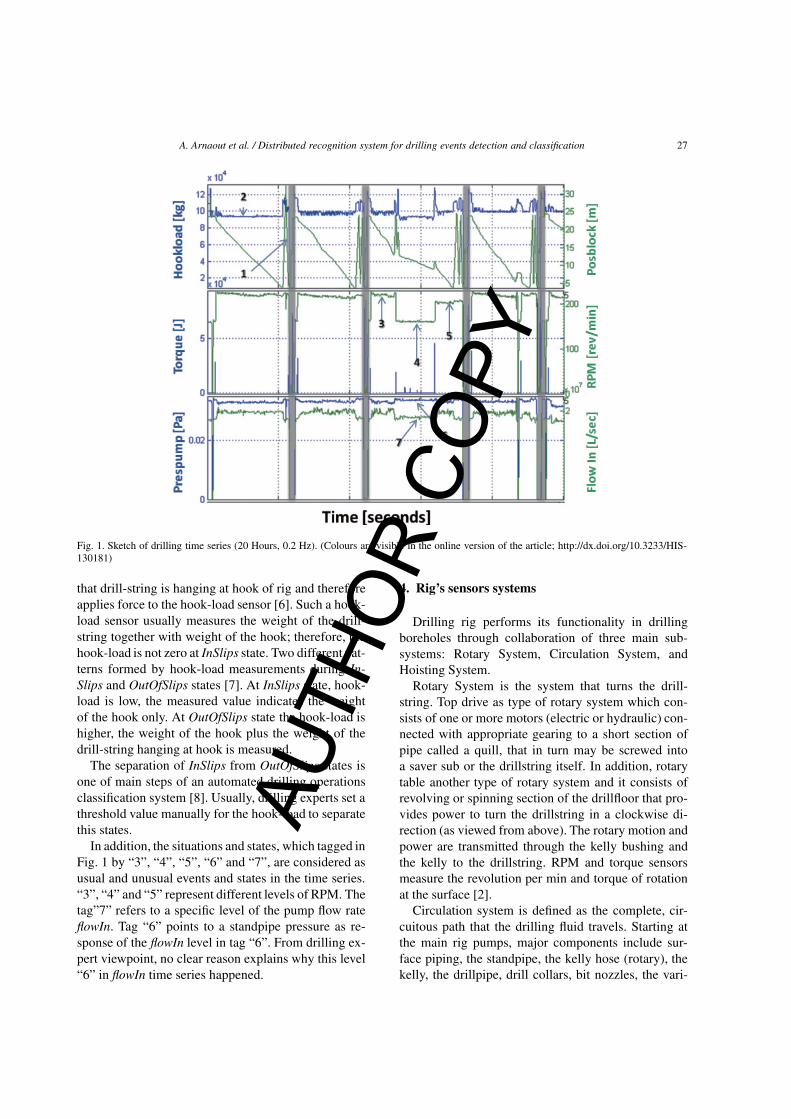
Figure 1 shows a sketch of such sensor data overa period of 20 hours, recorded with a resolution of0.2 Hz.
The gray highlighted areas “1” in Fig. 1 refer to aspecial state in drilling process; drill-string is hangingin the rig floor fixed by slips, thus such a state is de-noted as InSlips. The non-highlighted areas “2” refer toconverse situations denoted as OutOfSlips; this means
AUTH
OR
COPY
A. Arnaout et al. / Distributed recognition system for drilling events detection and classification 27
Fig. 1. Sketch of drilling time series (20 Hours, 0.2 Hz). (Colours are visible in the online version of the article; http://dx.doi.org/10.3233/HIS-130181)
that drill-string is hanging at hook of rig and thereforeapplies force to the hook-load sensor [6]. Such a hook-load sensor usually measures the weight of the drill-string together with weight of the hook; therefore, thehook-load is not zero at InSlips state. Two different pat-terns formed by hook-load measurements during In-Slips and OutOfSlips states [7]. At InSlips state, hook-load is low, the measured value indicates the weightof the hook only. At OutOfSlips state the hook-load ishigher, the weight of the hook plus the weight of thedrill-string hanging at hook is measured.
The separation of InSlips from OutOfSlips states isone of main steps of an automated drilling operationsclassification system [8]. Usually, drilling experts set athreshold value manually for the hook-load to separatethis states.
In addition, the situations and states, which tagged inFig. 1 by “3”, “4”, “5”, “6” and “7”, are considered asusual and unusual events and states in the time series.“3”, “4” and “5” represent different levels of RPM. Thetag”7” refers to a specific level of the pump flow rateflowIn. Tag “6” points to a standpipe pressure as re-sponse of the flowIn level in tag “6”. From drilling ex-pert viewpoint, no clear reason explains why this level“6” in flowIn time series happened.
4. Rig’s sensors systems
Drilling rig performs its functionality in drillingboreholes through collaboration of three main sub-systems: Rotary System, Circulation System, andHoisting System.
Rotary System is the system that turns the drill-string. Top drive as type of rotary system which con-sists of one or more motors (electric or hydraulic) con-nected with appropriate gearing to a short section ofpipe called a quill, that in turn may be screwed intoa saver sub or the drillstring itself. In addition, rotarytable another type of rotary system and it consists ofrevolving or spinning section of the drillfloor that pro-vides power to turn the drillstring in a clockwise di-rection (as viewed from above). The rotary motion andpower are transmitted through the kelly bushing andthe kelly to the drillstring. RPM and torque sensorsmeasure the revolution per min and torque of rotationat the surface [2].
Circulation system is defined as the complete, cir-cuitous path that the drilling fluid travels. Starting atthe main rig pumps, major components include sur-face piping, the standpipe, the kelly hose (rotary), thekelly, the drillpipe, drill collars, bit nozzles, the vari-
AUTH
OR
COPY
28 A. Arnaout et al. / Distributed recognition system for drilling events detection and classification
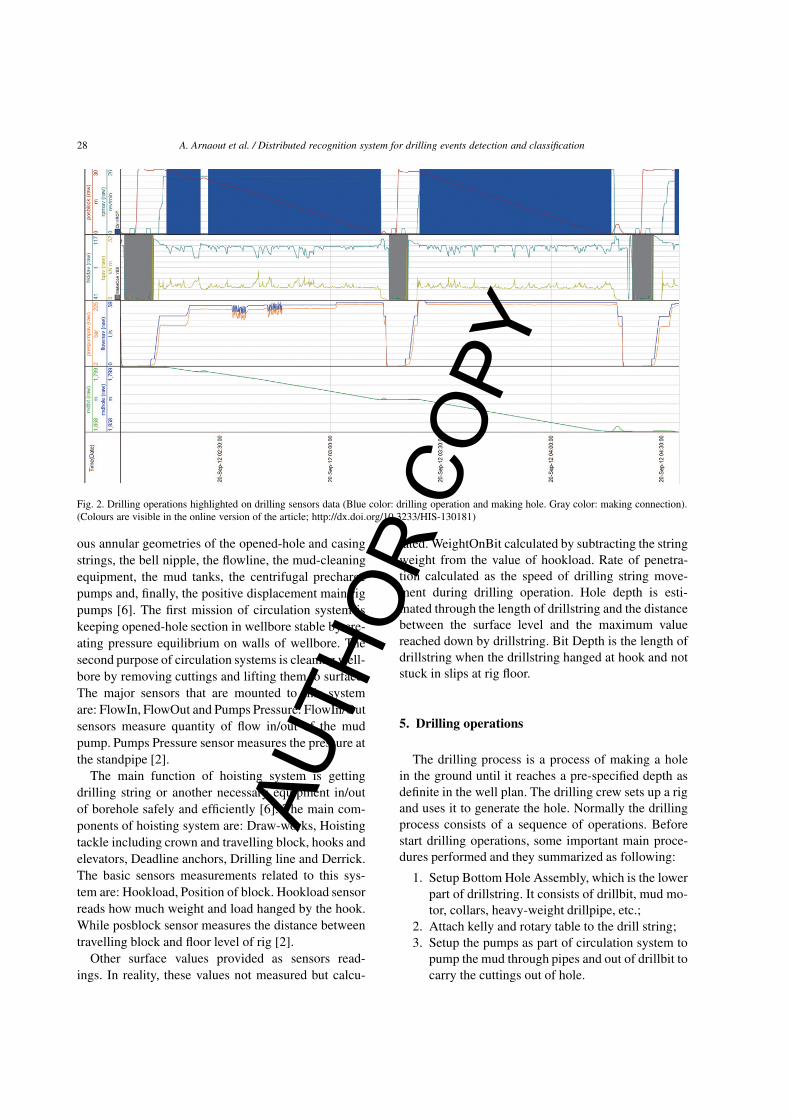
Fig. 2. Drilling operations highlighted on drilling sensors data (Blue color: drilling operation and making hole. Gray color: making connection).(Colours are visible in the online version of the article; http://dx.doi.org/10.3233/HIS-130181)
ous annular geometries of the opened-hole and casingstrings, the bell nipple, the flowline, the mud-cleaningequipment, the mud tanks, the centrifugal prechargepumps and, finally, the positive displacement main rigpumps [6]. The first mission of circulation system iskeeping opened-hole section in wellbore stable by cre-ating pressure equilibrium on walls of wellbore. Thesecond purpose of circulation systems is cleaning well-bore by removing cuttings and lifting them to surface.The major sensors that are mounted to this systemare: FlowIn, FlowOut and Pumps Pressure. FlowIn/Outsensors measure quantity of flow in/out of the mudpump. Pumps Pressure sensor measures the pressure atthe standpipe [2].
The main function of hoisting system is gettingdrilling string or another necessary equipment in/outof borehole safely and efficiently [6]. The main com-ponents of hoisting system are: Draw-works, Hoistingtackle including crown and travelling block, hooks andelevators, Deadline anchors, Drilling line and Derrick.The basic sensors measurements related to this sys-tem are: Hookload, Position of block. Hookload sensorreads how much weight and load hanged by the hook.While posblock sensor measures the distance betweentravelling block and floor level of rig [2].
Other surface values provided as sensors read-ings. In reality, these values not measured but calcu-
lated. WeightOnBit calculated by subtracting the stringweight from the value of hookload. Rate of penetra-tion calculated as the speed of drilling string move-ment during drilling operation. Hole depth is esti-mated through the length of drillstring and the distancebetween the surface level and the maximum valuereached down by drillstring. Bit Depth is the length ofdrillstring when the drillstring hanged at hook and notstuck in slips at rig floor.
5. Drilling operations
The drilling process is a process of making a holein the ground until it reaches a pre-specified depth asdefinite in the well plan. The drilling crew sets up a rigand uses it to generate the hole. Normally the drillingprocess consists of a sequence of operations. Beforestart drilling operations, some important main proce-dures performed and they summarized as following:
1. Setup Bottom Hole Assembly, which is the lowerpart of drillstring. It consists of drillbit, mud mo-tor, collars, heavy-weight drillpipe, etc.;
2. Attach kelly and rotary table to the drill string;3. Setup the pumps as part of circulation system to
pump the mud through pipes and out of drillbit tocarry the cuttings out of hole.
AUTH
OR
COPY
A. Arnaout et al. / Distributed recognition system for drilling events detection and classification 29
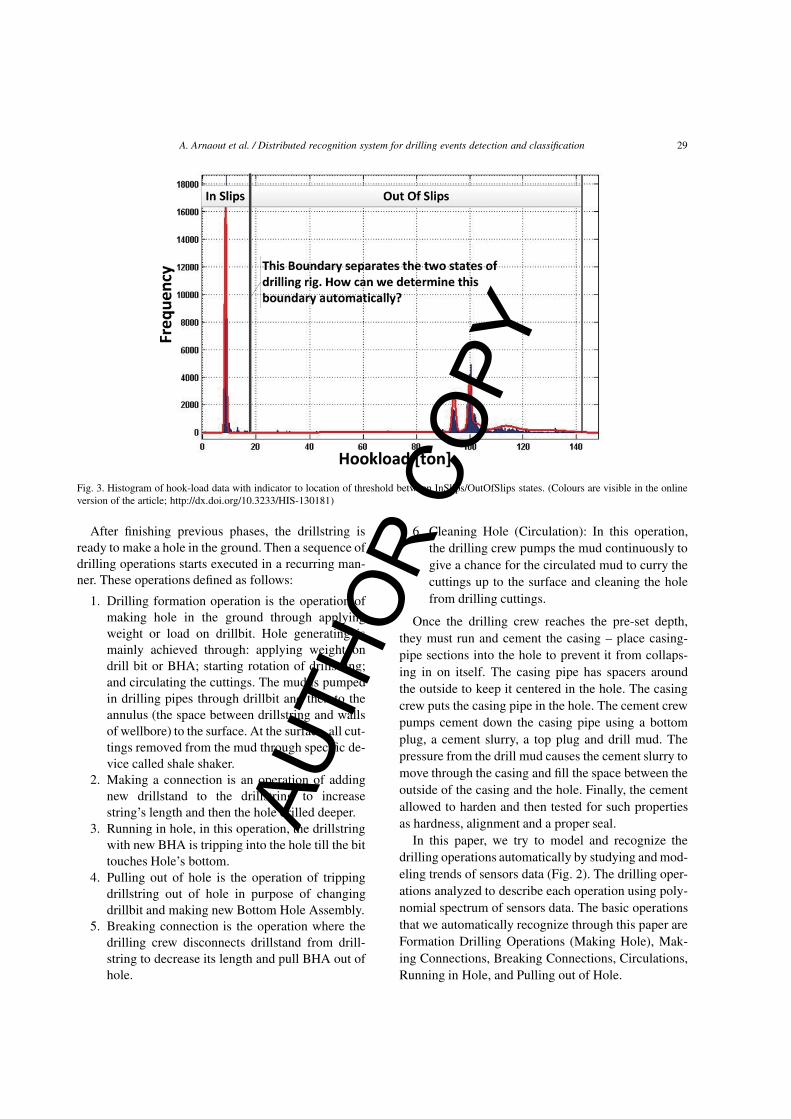
Fig. 3. Histogram of hook-load data with indicator to location of threshold between InSlips/OutOfSlips states. (Colours are visible in the onlineversion of the article; http://dx.doi.org/10.3233/HIS-130181)
After finishing previous phases, the drillstring isready to make a hole in the ground. Then a sequence ofdrilling operations starts executed in a recurring man-ner. These operations defined as follows:
1. Drilling formation operation is the operation ofmaking hole in the ground through applyingweight or load on drillbit. Hole generating ismainly achieved through: applying weight ondrill bit or BHA; starting rotation of drillstring;and circulating the cuttings. The mud is pumpedin drilling pipes through drillbit and then to theannulus (the space between drillstring and wallsof wellbore) to the surface. At the surface, all cut-tings removed from the mud through specific de-vice called shale shaker.
2. Making a connection is an operation of addingnew drillstand to the drillstring to increasestring’s length and then the hole drilled deeper.
3. Running in hole, in this operation, the drillstringwith new BHA is tripping into the hole till the bittouches Hole’s bottom.
4. Pulling out of hole is the operation of trippingdrillstring out of hole in purpose of changingdrillbit and making new Bottom Hole Assembly.
5. Breaking connection is the operation where thedrilling crew disconnects drillstand from drill-string to decrease its length and pull BHA out ofhole.
6. Cleaning Hole (Circulation): In this operation,the drilling crew pumps the mud continuously togive a chance for the circulated mud to curry thecuttings up to the surface and cleaning the holefrom drilling cuttings.
Once the drilling crew reaches the pre-set depth,they must run and cement the casing – place casing-pipe sections into the hole to prevent it from collaps-ing in on itself. The casing pipe has spacers aroundthe outside to keep it centered in the hole. The casingcrew puts the casing pipe in the hole. The cement crewpumps cement down the casing pipe using a bottomplug, a cement slurry, a top plug and drill mud. Thepressure from the drill mud causes the cement slurry tomove through the casing and fill the space between theoutside of the casing and the hole. Finally, the cementallowed to harden and then tested for such propertiesas hardness, alignment and a proper seal.
In this paper, we try to model and recognize thedrilling operations automatically by studying and mod-eling trends of sensors data (Fig. 2). The drilling oper-ations analyzed to describe each operation using poly-nomial spectrum of sensors data. The basic operationsthat we automatically recognize through this paper areFormation Drilling Operations (Making Hole), Mak-ing Connections, Breaking Connections, Circulations,Running in Hole, and Pulling out of Hole.
AUTH
OR
COPY

30 A. Arnaout et al. / Distributed recognition system for drilling events detection and classification
6. High level drilling time series segmentation
In our approach, we used the dataset shown in Fig. 1incorporating the knowledge of drilling experts. Thisapproach based on hook-load sensor measurements.
Figure 3 shows the histogram of the hook-load dataover a period of 10 days of drilling. Applying drillingexperts’ know-how, knowledge can be explained onthis histogram. It shows that hook-load data has the na-ture of Gaussian Mixture Models, i.e. the data are com-posed at least out of 4 Gaussian distributions. Each ofthese distributions reflects information about a specificstate of the rig. Obviously, two main distributions arelocated in the data i.e. InSlips and OutOfSlips. The leftmost distribution certainly defines the InSlips state.
The statistical parameters of each distribution pro-vide information about the hook-load data for eachstate. The estimation of the threshold that discriminatesInSlips states from other states is a significant step insegmentation. The segmentation, which separates In-Slips state from OutOfSlips state, is a high-level seg-mentation. The advantage of EM is that it can be ap-plied to big data set with acceptable performance.
Arnaout et al. [3] discussed in detail the use of hook-load data to determine automatically the thresholdvalue for separation of InSlips and OutOfSlips states.
After estimating the parameters of the particularcluster in the hook-load data, the second step is the cal-culation of the intersection point, which is the thresh-old, used for separation of InSlips and OutOfSlipsstates.
The algorithm below shows how to calculate the in-tersection point between two clusters based on Bayes’theorem, using the clusters’ statistical parameters,mean value and standard deviation.
7. Low level drilling time series segmentation
The low-level segmentation applied to each segmentobtained from high-level segmentation as discussedabove. In our approach, Piecewise Linear Approxi-mation applied to the hydraulic flow rate, denoted asflowIn, and the rotational speed of the drill string, de-noted as RPM.
The algorithm BottomToUp [5] forms the base forthe segmentation by Piecewise Linear Approximationbased on customized error cost function. The algorithmbegins by creating the finest possible approximation ofthe time series consisting of n samples by using ini-tially n/2 segments. In a subsequent step, the costs of
Intersection Point of two ClustersInput:
Two univariate clusters C1 and C2 assumed to be Gaussiandistributed with Θ1 ={μ1,σ1} and Θ2 ={μ2,σ2}.
Output:The separation threshold xi of the two clusters.
DoThe probability density p(x|Ck) for the kth cluster of a GaussianMixture Model is given by
p (x|Ck) =1√2πσ2
k
e− (x−μk)2
2σ2k . (1)
According to Bayes’ theorem, the separation threshold xi is locatedwhere the posterior probabilities P(Ck |x) of both clusters are iden-tical [14].Using
P (C1|x) = p(x|C1)P (C1)
p(x|C1)P (C1) + p(x|C2)P (C2), (2)
and
P (C2|x) = p(x|C2)P (C2)
p(x|C1)P (C1) + p(x|C2)P (C2). (3)
The prior probabilities P (C1) and P (C2) given by
P (Ck) =number of points belonging to clusterCk
total number of points. (4)
The separation threshold xi estimated by solving the equation
P (C1|xi) = P (C2|xi). (5)
End
merging pairs of adjacent segments are calculated. Thealgorithm iteratively merges the pairs with the lowestcosts until a stopping criterion is met. Merging pairsof adjacent segments, i and i + 1, bookkeeping aboutthe neighborhood merging costs is inevitable. The costof merging the actual segment with both, right and leftneighbors, must be calculated [5].
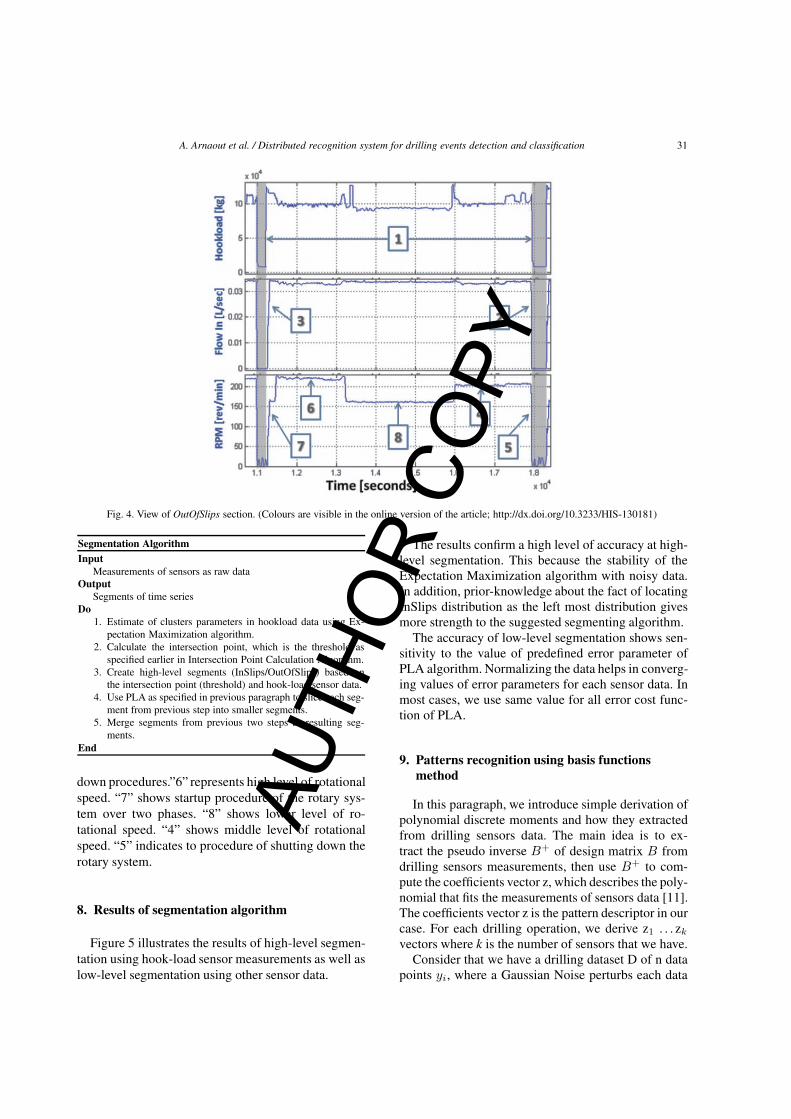
Figure 4 shows detailed segment of OutOfSlips statefor sensors: hook-load, flow rate (flowIn), and Rota-tion Speed (RPM). In assistance of drilling experts, itis required that each change or event in those sensormeasurements should be detected. Applying PiecewiseLinear Approximation on each of those time seriesgives the possibility to detect main and minor changesin these time series. The accuracy of detection dependsprimarily on customized error cost function of PLA.
7.1. Drilling timeseries segmentation algorithm
In this paragraph, the algorithm of applying EM andPLA on drilling time series presented. The data showedin Fig. 1 used as sample data.
Figure 4 illustrates detailed view of OutOfSlips sec-tion “1”. “2” and “3” point to the pump’s startup/shut-
AUTH
OR
COPY
A. Arnaout et al. / Distributed recognition system for drilling events detection and classification 31
Fig. 4. View of OutOfSlips section. (Colours are visible in the online version of the article; http://dx.doi.org/10.3233/HIS-130181)
Segmentation AlgorithmInput
Measurements of sensors as raw dataOutput
Segments of time seriesDo
1. Estimate of clusters parameters in hookload data using Ex-pectation Maximization algorithm.
2. Calculate the intersection point, which is the threshold asspecified earlier in Intersection Point Calculation Algorithm.
3. Create high-level segments (InSlips/OutOfSlips) based onthe intersection point (threshold) and hook-load sensor data.
4. Use PLA as specified in previous paragraph to slice each seg-ment from previous step into smaller segments.
5. Merge segments from previous two steps as resulting seg-ments.
End
down procedures.”6” represents high level of rotationalspeed. “7” shows startup procedure of the rotary sys-tem over two phases. “8” shows lower level of ro-tational speed. “4” shows middle level of rotationalspeed. “5” indicates to procedure of shutting down therotary system.
8. Results of segmentation algorithm
Figure 5 illustrates the results of high-level segmen-tation using hook-load sensor measurements as well aslow-level segmentation using other sensor data.
The results confirm a high level of accuracy at high-level segmentation. This because the stability of theExpectation Maximization algorithm with noisy data.In addition, prior-knowledge about the fact of locatingInSlips distribution as the left most distribution givesmore strength to the suggested segmenting algorithm.
The accuracy of low-level segmentation shows sen-sitivity to the value of predefined error parameter ofPLA algorithm. Normalizing the data helps in converg-ing values of error parameters for each sensor data. Inmost cases, we use same value for all error cost func-tion of PLA.
9. Patterns recognition using basis functionsmethod
In this paragraph, we introduce simple derivation ofpolynomial discrete moments and how they extractedfrom drilling sensors data. The main idea is to ex-tract the pseudo inverse B+ of design matrix B fromdrilling sensors measurements, then use B+ to com-pute the coefficients vector z, which describes the poly-nomial that fits the measurements of sensors data [11].The coefficients vector z is the pattern descriptor in ourcase. For each drilling operation, we derive z1 . . . zkvectors where k is the number of sensors that we have.
Consider that we have a drilling dataset D of n datapoints yi, where a Gaussian Noise perturbs each data
AUTH
OR
COPY

32 A. Arnaout et al. / Distributed recognition system for drilling events detection and classification
Fig. 5. Results of the suggested segmentation algorithm on drilling time series (Automatic-detected sections in red lines). (Colours are visible inthe online version of the article; http://dx.doi.org/10.3233/HIS-130181)
point. The objective of polynomial regression of de-gree d is to model the data points yi by a sum of mono-mials, i.e.
y = a0 + a1x+ a2x2 . . .+ adx
d =i=0
d aixi. (6)
Since the data points yi are perturbed, they in generaldo not lie exactly on the polynomial. Consequently,there is a residual ri associated with each point,
ri = yi − yi = yi −i=0
d aixi. (7)
We can rewrite the Eq. (7) in matrix form yields,⎡⎢⎣ri...rn
⎤⎥⎦ =
⎡⎢⎣y1...yn
⎤⎥⎦−
⎡⎢⎣
1 x1 x21 . . . xd
1...1 xn x2
n . . . xdn
⎤⎥⎦⎡⎢⎣a0...ad
⎤⎥⎦(8)
In general, measurements data; the design matrix B andthe coefficient vector z are defined as,
B =
⎡⎢⎣
1 x1 x21 . . . xd
1...1 xn x2
n . . . xdn
⎤⎥⎦ and z =
⎡⎢⎣a0...ad
⎤⎥⎦ .(9)
Consequently,
y = Bz. (10)
So the error rewritten as,
E =
n∑i=1
r2i = rT r. (11)
Then, the coefficient vector calculated using,
z =(BTB
)−1BT y = B+y, (12)
where B+ is the pseudo-inverse of B [11].
The column vectors forming the matrix B are the ba-sis functions. The matrix B called Vandermonde ma-trix. The fact is that the polynomials or the basis func-tions of Vandermonde matrix are not orthogonal. Thiscauses complexity in computation and calculation ofhigh degrees of polynomials. Moreover, this meansthat the Vandermode basis functions are not suitablefor solving large-scale problems. This fact leads us tochoose another set of basis functions that are orthog-onal and it is possible to calculate higher degrees ofsuch polynomials. Here are examples on orthogonalpolynomials from functional analysis domain: Legen-dre, Chebyshev, Gram, Gegenbauer, etc.
In our study on drilling sensors data, we will useGram polynomials to describe drilling time series ofdifferent drilling operations. We choose Gram polyno-mials because not only they are orthogonal but alsothey have a uniform scaling and this is important tofit some complex shapes in drilling time series withhigher performance than what Vandermonde basis cando.
The equation of generating Gram polynomials givenby [10]:
gn (x) = 2αn−1xgn−1 (x)− αn−1
αn−2gn−2 (x) . (13)
Whereby,
αn−1 =m
n
(n2 − 1/2
m2 − n2
)1/2
, (14)
and
g0 (x) = 1, g−1 (x) = 0 and α−1 = 1. (15)
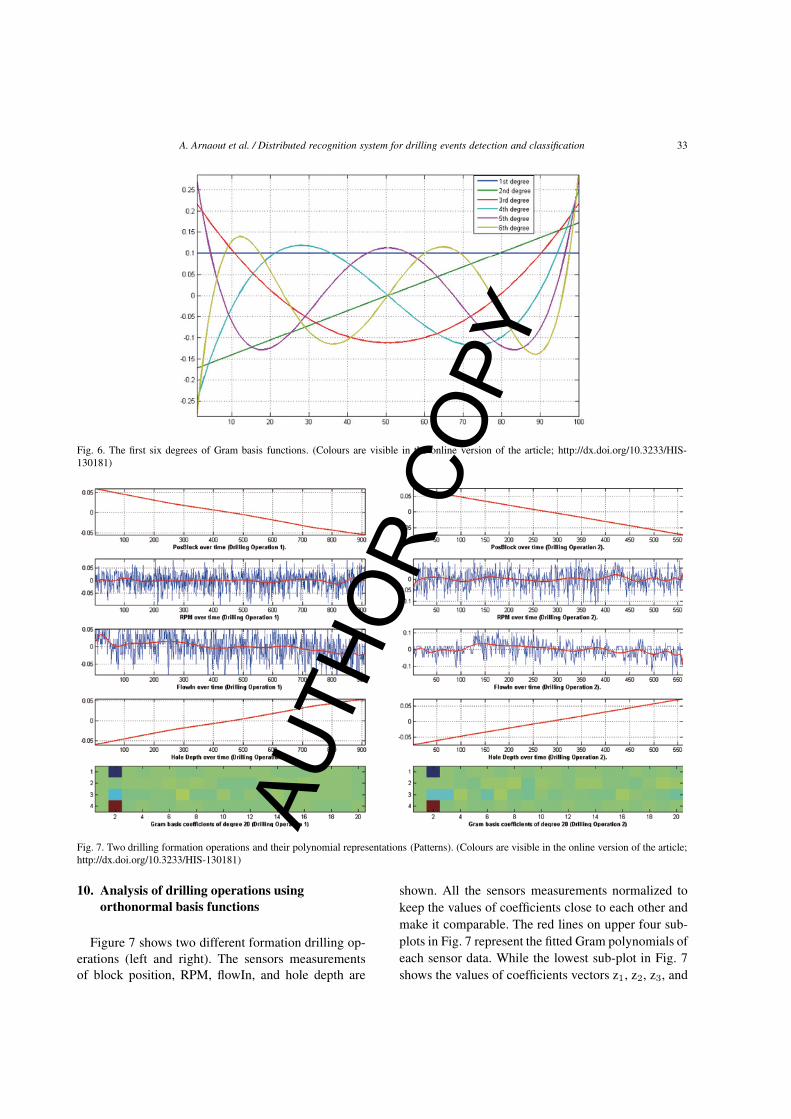
Figure 6 shows us how Gram basis functions look like.
AUTH
OR
COPY
A. Arnaout et al. / Distributed recognition system for drilling events detection and classification 33
Fig. 6. The first six degrees of Gram basis functions. (Colours are visible in the online version of the article; http://dx.doi.org/10.3233/HIS-130181)
Fig. 7. Two drilling formation operations and their polynomial representations (Patterns). (Colours are visible in the online version of the article;http://dx.doi.org/10.3233/HIS-130181)
10. Analysis of drilling operations usingorthonormal basis functions
Figure 7 shows two different formation drilling op-erations (left and right). The sensors measurementsof block position, RPM, flowIn, and hole depth are
shown. All the sensors measurements normalized tokeep the values of coefficients close to each other andmake it comparable. The red lines on upper four sub-plots in Fig. 7 represent the fitted Gram polynomials ofeach sensor data. While the lowest sub-plot in Fig. 7shows the values of coefficients vectors z1, z2, z3, and
AUTH
OR
COPY
34 A. Arnaout et al. / Distributed recognition system for drilling events detection and classification
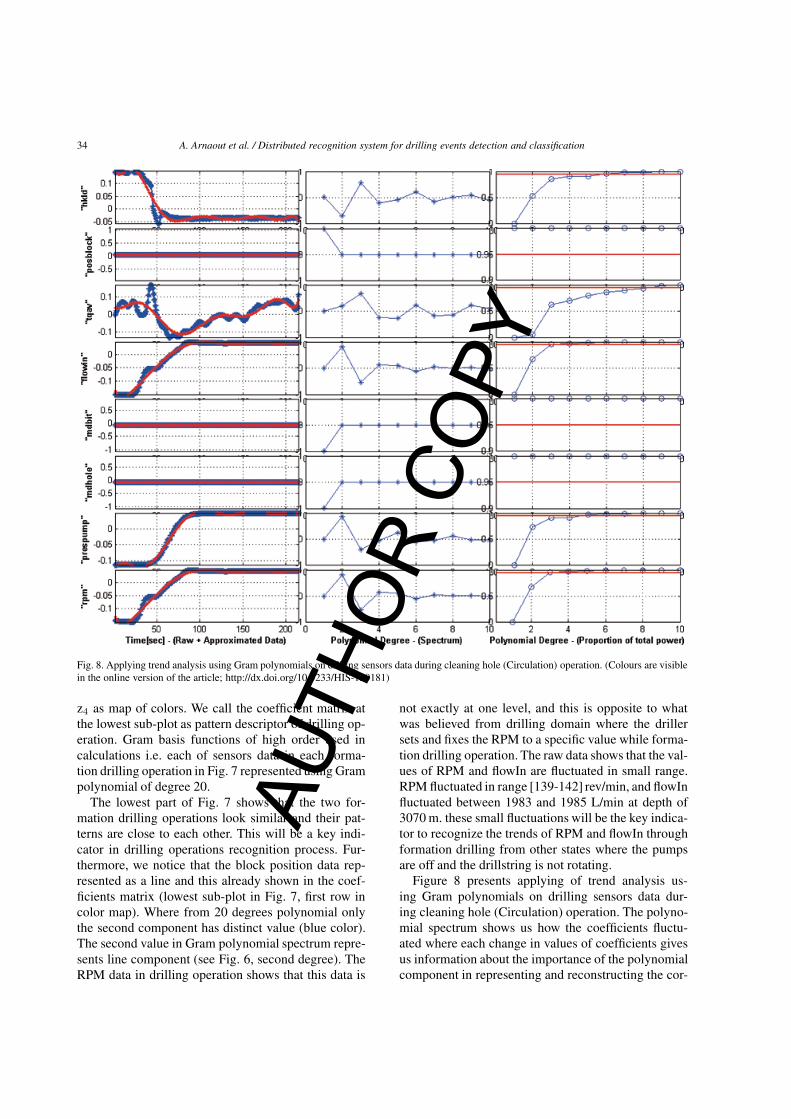
Fig. 8. Applying trend analysis using Gram polynomials on drilling sensors data during cleaning hole (Circulation) operation. (Colours are visiblein the online version of the article; http://dx.doi.org/10.3233/HIS-130181)
z4 as map of colors. We call the coefficient matrix atthe lowest sub-plot as pattern descriptor of drilling op-eration. Gram basis functions of high order used incalculations i.e. each of sensors data in each forma-tion drilling operation in Fig. 7 represented using Grampolynomial of degree 20.
The lowest part of Fig. 7 shows that the two for-mation drilling operations look similar and their pat-terns are close to each other. This will be a key indi-cator in drilling operations recognition process. Fur-thermore, we notice that the block position data rep-resented as a line and this already shown in the coef-ficients matrix (lowest sub-plot in Fig. 7, first row incolor map). Where from 20 degrees polynomial onlythe second component has distinct value (blue color).The second value in Gram polynomial spectrum repre-sents line component (see Fig. 6, second degree). TheRPM data in drilling operation shows that this data is
not exactly at one level, and this is opposite to whatwas believed from drilling domain where the drillersets and fixes the RPM to a specific value while forma-tion drilling operation. The raw data shows that the val-ues of RPM and flowIn are fluctuated in small range.RPM fluctuated in range [139-142] rev/min, and flowInfluctuated between 1983 and 1985 L/min at depth of3070 m. these small fluctuations will be the key indica-tor to recognize the trends of RPM and flowIn throughformation drilling from other states where the pumpsare off and the drillstring is not rotating.
Figure 8 presents applying of trend analysis us-ing Gram polynomials on drilling sensors data dur-ing cleaning hole (Circulation) operation. The polyno-mial spectrum shows us how the coefficients fluctu-ated where each change in values of coefficients givesus information about the importance of the polynomialcomponent in representing and reconstructing the cor-
AUTH
OR
COPY
A. Arnaout et al. / Distributed recognition system for drilling events detection and classification 35
Segmentation Component
«Communication Instrastructure»Message Oriented Middleware
Publish Interface
Publish Interface
Patterns Classifier Component Subscribe Interface
Get Patterns Templates
Patterns Base Rigs Raw Data
Get Raw Data
Analysis Component
Subscribe
Visualization Component
Subscribe
Reporting Serv ices Component
Subscribe
Segments
Classes Segments
Classes
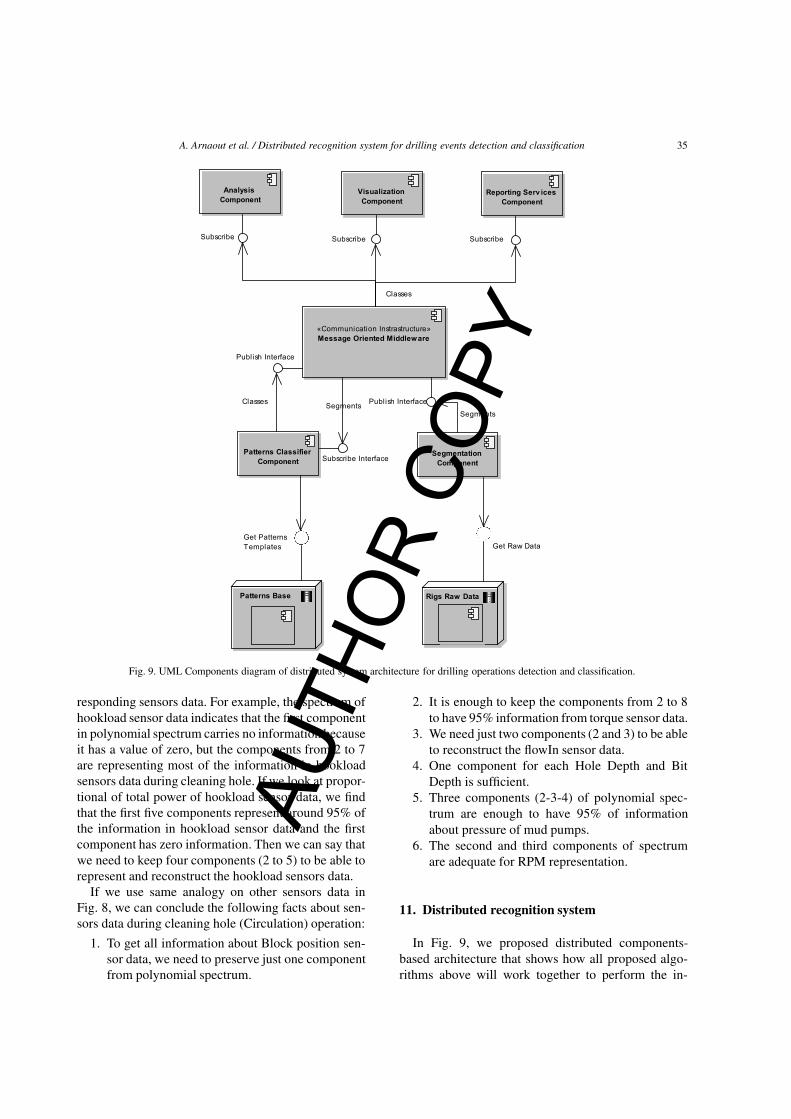
Fig. 9. UML Components diagram of distributed system architecture for drilling operations detection and classification.
responding sensors data. For example, the spectrum ofhookload sensor data indicates that the first componentin polynomial spectrum carries no information becauseit has a value of zero, but the components from 2 to 7are representing most of the information in hookloadsensors data during cleaning hole. If we look at propor-tional of total power of hookload sensor data, we findthat the first five components represent around 95% ofthe information in hookload sensor data and the firstcomponent has zero information. Then we can say thatwe need to keep four components (2 to 5) to be able torepresent and reconstruct the hookload sensors data.
If we use same analogy on other sensors data inFig. 8, we can conclude the following facts about sen-sors data during cleaning hole (Circulation) operation:
1. To get all information about Block position sen-sor data, we need to preserve just one componentfrom polynomial spectrum.
2. It is enough to keep the components from 2 to 8to have 95% information from torque sensor data.
3. We need just two components (2 and 3) to be ableto reconstruct the flowIn sensor data.
4. One component for each Hole Depth and BitDepth is sufficient.
5. Three components (2-3-4) of polynomial spec-trum are enough to have 95% of informationabout pressure of mud pumps.
6. The second and third components of spectrumare adequate for RPM representation.
11. Distributed recognition system
In Fig. 9, we proposed distributed components-based architecture that shows how all proposed algo-rithms above will work together to perform the in-
AUTH
OR
COPY

36 A. Arnaout et al. / Distributed recognition system for drilling events detection and classification
tended goal in drilling operations detection and classi-fication.
As the architecture shows, the raw data flows tosegmentation component where the segmentation al-gorithm hosted. The segments have the structure ofstart index, end index, attributes and data points. Thesesegments published to Message Oriented MiddlewareMOM in form of messages. Here we consider thephase of detection drilling operations is finished whereeach segment represents a drilling operation.
After publishing the segments, a classification stepfor each segment is required. Patterns classifier com-ponent receives the segments from MOM through asubscription component. Then the patterns classifiersearch for the matched pattern class in its patterns base.The matching process between the new received seg-ments and the patterns templates is determined throughPatterns Matching Algorithm (as shown in the nextparagraph).
Once classification of each segment is finished, theclassified segment published again with known class toMOM where all other clients (parties) which are inter-ested in getting such information can subscribe to getthese segments with their classes
11.1. Patterns matching algorithm
Patterns Matching Algorithm between data segment and pat-terns templatesInput:
Data Segment SOutput:
Drilling Operation Class of the segment SStart
– Calculate Gram polynomials coefficients of data V in segmentS.
– For each patterns template P in Drilling Patterns Base do:
∗ Calculate the similarity between V and P (see next para-graph).
∗ Record the bigger value in similarity (closest patterns tem-plate).
– End For.– The class of most similar pattern template is the class of S.
End
11.2. Drilling patterns base
In cooperation with drilling experts, a drilling pat-terns base built. This base contains all templates ofknown drilling operations such as Drilling, Running inHole, Pulling out of Hole, Making Connections, andCirculation.
Each operation can have many templates. This de-pends on the rig’s type and the drilling process andmethods used by the drilling crews.
As a preparation step, we take each possible tem-plate data; calculate its Gram polynomial coefficients;and store them in the Patterns base. At the end of theday, we have all the possible patterns templates storedin this base. One of the most useful usages of such baseis that we can use it to store the drilling expert’s knowl-edge. The extension of this base by new patterns tem-plates for new drilling operations considered as a triv-ial task.
11.3. Patterns similarity measure
Given matrix D that represents the sensor data ma-trix of a segment. We calculate the corresponding grampolynomial coefficients matrix V of matrix D. In ad-dition, we consider that all the patterns templates foreach drilling operation are stored in patterns base (seeFig. 9). Moreover, we consider that each pattern repre-sented by matrix Pi, where Pi contains the coefficientsof gram polynomials of template raw data that repre-sent drilling operation number i selected by drillingexpert.
After the discussion and the analysis of drilling op-erations in previous paragraph, we find that to increaseour accuracy we need to introduce the weighting (im-portance) matrix W into our similarity measure calcu-lation
W =
⎡⎢⎣p1 · · · 0...
. . ....
0 · · · pn
⎤⎥⎦ . (16)
where p1, . . . ,pn are the importance of sensors data.For example if we want to consider that the weights
of sensors as following: Hookload sensor is very im-portant in our detection process then we give it impor-tance or weight as 1.0. Posblock sensor is another im-portant sensors data we assign 1.0 to it. Mdbit does notaffect our detection results as much as Posblock, thenwe give it importance or weight of 0.5 and so on. Theweight matrix W is suggested after similar analysis towhat we discussed in previous paragraph.
The matrix W should affect both patterns templatesP ,
Pw = P W, (17)
and coefficient matrix of new raw data V ,
Vw = V W. (18)
AUTH
OR
COPY
A. Arnaout et al. / Distributed recognition system for drilling events detection and classification 37
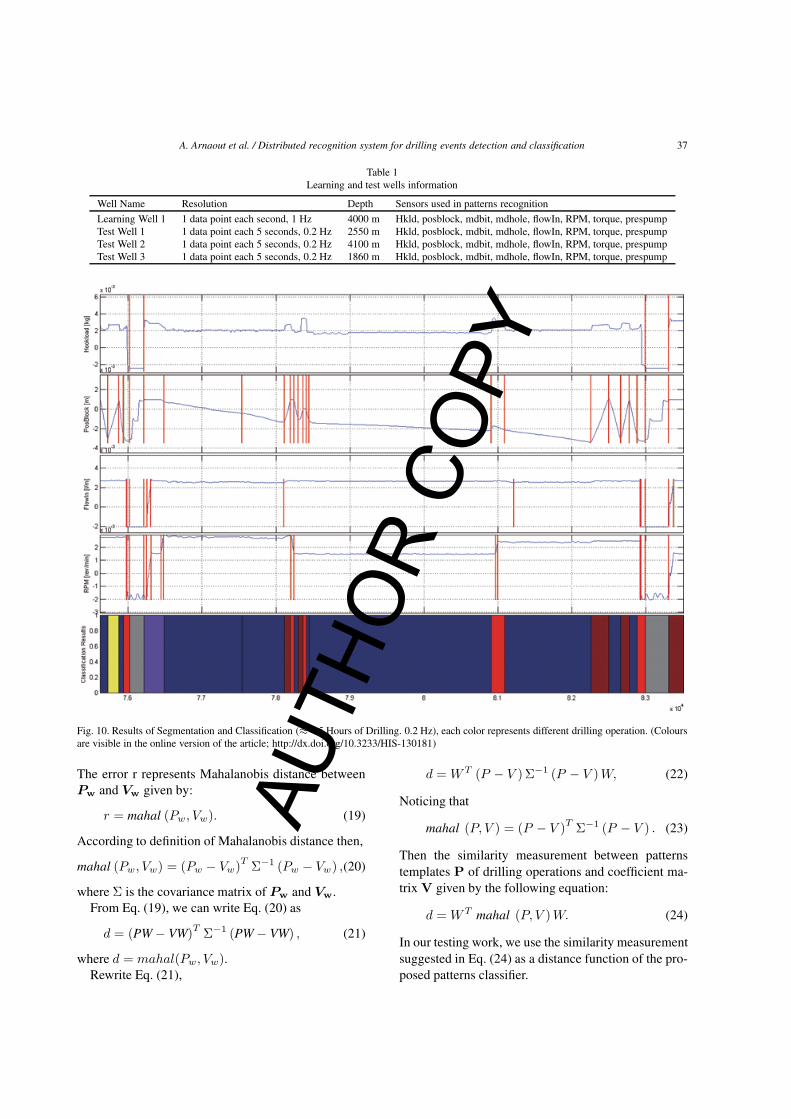
Table 1Learning and test wells information
Well Name Resolution Depth Sensors used in patterns recognitionLearning Well 1 1 data point each second, 1 Hz 4000 m Hkld, posblock, mdbit, mdhole, flowIn, RPM, torque, prespumpTest Well 1 1 data point each 5 seconds, 0.2 Hz 2550 m Hkld, posblock, mdbit, mdhole, flowIn, RPM, torque, prespumpTest Well 2 1 data point each 5 seconds, 0.2 Hz 4100 m Hkld, posblock, mdbit, mdhole, flowIn, RPM, torque, prespumpTest Well 3 1 data point each 5 seconds, 0.2 Hz 1860 m Hkld, posblock, mdbit, mdhole, flowIn, RPM, torque, prespump
Fig. 10. Results of Segmentation and Classification (≈ 4.5 Hours of Drilling. 0.2 Hz), each color represents different drilling operation. (Coloursare visible in the online version of the article; http://dx.doi.org/10.3233/HIS-130181)
The error r represents Mahalanobis distance betweenPw and Vw given by:
r = mahal (Pw, Vw). (19)
According to definition of Mahalanobis distance then,
mahal (Pw, Vw) = (Pw − Vw)TΣ−1 (Pw − Vw) ,(20)
where Σ is the covariance matrix of Pw and Vw.From Eq. (19), we can write Eq. (20) as
d = (PW − VW)TΣ−1 (PW − VW) , (21)
where d = mahal(Pw, Vw).Rewrite Eq. (21),
d = WT (P − V )Σ−1 (P − V )W, (22)
Noticing that
mahal (P, V ) = (P − V )T Σ−1 (P − V ) . (23)
Then the similarity measurement between patternstemplates P of drilling operations and coefficient ma-trix V given by the following equation:
d = WT mahal (P, V )W. (24)
In our testing work, we use the similarity measurementsuggested in Eq. (24) as a distance function of the pro-posed patterns classifier.
AUTH
OR
COPY

38 A. Arnaout et al. / Distributed recognition system for drilling events detection and classification
Drilling Run in Hole Pull out of Hole Circula�on MakeCon Accuracy (Opera�on)Drilling 1819 0 0 1 0 99.95%Run in Hole 78 789 8 9 7 88.55%Pull out of Hole 81 0 492 1 7 84.68%Circula�on 39 16 12 143 21 61.90%MakeCon 15 46 38 23 3111 96.23%
Drilling Run in Hole Pull out of Hole Circula�on MakeCon Accuracy (Opera�on)Drilling 726 5 0 1 0 99.18%Run in Hole 95 472 2 3 14 80.55%Pull out of Hole 39 0 372 3 14 86.92%Circula�on 78 36 28 209 13 57.42%MakeCon 35 20 9 15 1412 94.70%
Drilling Run in Hole Pull out of Hole Circula�on MakeCon Accuracy (Opera�on)Drilling 1095 0 0 9 0 99.18%Run in Hole 105 219 0 1 0 67.38%Pull out of Hole 55 0 340 1 3 85.21%Circula�on 62 32 12 312 30 69.64%MakeCon 27 5 12 40 1085 92.81%
Test Well 1
Test Well 2
Test Well 3
Real
Ope
ra�o
ns
Classified Opera�ons (Total Accuracy: 88.56%)
Real
Ope
ra�o
ns
Classified Opera�ons (Total Accuracy: 88.61%)
Classified Opera�ons (Total Accuracy: 94.05%)
Real
Ope
ra�o
ns
Fig. 11. Confusion matrices of test wells with classification accuracy of each one.
12. Test dataset
The test database, which we worked on, consists offour complete drilled offset wells. The drilling opera-tions highlighted manually by drilling experts on rawdata. Table 1 contains information about the testingwells.
13. Results and discussion
Figure 10 illustrates detailed view on how the seg-mentation and the classification algorithms worked to-gether to accomplish the mission of drilling events de-tection and classifications. The drilling sensors mea-surements shown and vertical redlines (segments) plot-ted over them. The color ranges represent drilling oper-ations that classified using our suggested system. Eachcolor is different class of operations.
Figure 11 demonstrates the results of applying pat-terns classifier on three offset wells as testing wells.The accuracy of classification process gives a per-centage around 90% and we consider that as a highclassification rate. It is shown that the confusion ofthis classifier happen between formation drilling oper-ations and non-drilling operations. This is due to thesimilarity of flowIn and RPM trends during forma-
tion drilling (making hole) and non-drilling situationswhere both situations show that flowIn and RPM sen-sors data should be in straight trends. For this reason,the patterns-based classifier is confused between bothsituations. As a solution for this problem, a thresh-old level can be defined to employ more informa-tion on the trend of flowIn or RPM. Another reasonfor confusion in the classification results is using allsensors data available. As we discussed in previousparagraph, some sensors data contain same informa-tion. For example hole depth, bit depth, and posblockduring drilling operation carry same information andthey considered as redundant components and this maycause confusion if the quality of those sensors data isbad.
In addition, some sensors data are more importantthan other sensors data during specific operations. Forexample during making connection, each of flowIn,pumps pressure, hole depth, and bit depth sensors dataare not important for recognizing this operation. Thetwo important sensors data here are Block Position andHookload.
We believe that the accuracy of results will be morethan what it is now, if the previous comments are re-flected on the current implementation of the patterns-base classifier. Furthermore, data with no outliers ormissing values is expected to have higher accuracy.
AUTH
OR
COPY

A. Arnaout et al. / Distributed recognition system for drilling events detection and classification 39
14. Future work
The suggested segmentation algorithm in this paperopens doors to do further analysis and recognition us-ing different classification techniques on each detectsegment in drilling time series. In addition, more workis possible to reduce/filter the noise in time series be-fore processing. The noise-filtering step will certainlyimprove the accuracy of segmentation algorithm.
It is also possible to extend the suggested method ofdrilling operations classification to recognize any otherrequired operation based on whatever drilling sensorsdata. The only condition to apply this method is thatthe trends of sensors data should be obvious.
In addition, the suggested method can be improvedby using a rejection classifier to reject specific patternsdo not belong to particular operation.
In our work, we used automatic adding for all possi-ble patterns templates in the database and here the er-ror of experts classification is included the results. Asimprovement, a continuous filtering process should runon the patterns base to remove bad and wrong patternsthat cause low classification rate.
Another important improvement is that the resultsof classification from test wells added to the patternsbase, if and only if they reviewed, corrected, and ac-cepted by experts. This supports the idea of extendingcurrent patterns base with new knowledge from expertsand it shows an example on how to extract the knowl-edge from experts and teach current running systemsto do better in future.
References
[1] P. Parigot, T. Marine, N. Als, L. Havrevold, N. Offshore andS. Als, SPE 5789 Intelligent Real-Time Status Analysis for
Rig-Site Drilling Engineering, 1988, 393–401.[2] F. Florence, N.O. Varco, F. Iversen and D.R. Systems,
IADC/SPE 128958 Real-Time Models for Drilling ProcessAutomation: Equations and Applications, 2010.
[3] A. Arnaout, B. Esmael, R.K. Fruhwirth and G. Thonhauser,Automatic threshold tracking of sensor data using Expec-tation Maximization algorithm, Hybrid Intelligent Systems(HIS), 2011 11th International Conference on, vol., no.,pp. 551,554, 5–8 Dec. 2011 doi: 10.1109/HIS.2011.6122164.
[4] A.P. Dempster, N.M. Laird and D.B. Rubin, Maximum like-lihood from incomplete data via the EM algorithm, Journalof the Royal Statistical Society Series B (Methodological)(1977), 1–38.
[5] E. Keogh, S. Chu, D. Hart and M. Pazzani, An online al-gorithm for segmenting time series. Proceedings 2001 IEEEInternational Conference on Data Mining, 289–296. doi:10.1109/ICDM.2001.989531
[6] H. Rabia, Oil Well Drilling Engineering, Principles and Prac-tices, University of Newcastle, 1985
[7] China National Logging Cooperation, Mud Logging Technol-ogy and Services, presentation, 2006
[8] G. Thonhauser, Using Real-Time Data for Automated DrillingPerformance Analysis, OIL GAS European Magazine, 2004.
[9] P. O’leary, M. Harker and M.Ã. Bernhard, Discrete poly-nomial moments and the extraction of 3-D embossed digitsfor recognition, Journal of Electronic Imaging 19(3) (2010),031205–031205.
[10] P. O’Leary and M. Harker, Surface Modelling Using Dis-crete Basis Functions for Real-Time Automatic Inspection, 3-D Surface Geometry and Reconstruction: Developing Con-cepts and Applications (2012), 216.
[11] P. O’Leary and M. Harker, An Algebraic Framework for Dis-crete Basis Functions in Computer Vision, 2008 Sixth IndianConference on Computer Vision, Graphics and Image Pro-cessing (1) (2008), 150–157.
[12] G. Thonhauser and W. Mathis, SPE 103211 Automated Re-porting Using Rig Sensor Data Enables Superior DrillingProject Management, SPE, 2006.
[13] G. Thonhauser, G. Wallnoefer and W. Mathis, SPE 99880 Useof Real-Time Rig Sensor Data to Improve Daily Drilling Re-porting, Benchmarking and Planning – A Case Study, SPE,2006.
[14] G.C. Tiao and A. Zellner, Bayes’s theorem and the use of priorknowledge in regression analysis, Biometrika (1964), 219–230.
AUTH
OR
COPY