Interim Silver Market Review 2019...Silver Institute. Interim Silver Market Review 2019. Philip...
28
Silver Institute Interim Silver Market Review 2019 Philip Newman, Metals Focus November 19 th 2019, New York
Transcript of Interim Silver Market Review 2019...Silver Institute. Interim Silver Market Review 2019. Philip...
Silver InstituteInterim Silver Market Review 2019
Philip Newman, Metals Focus
November 19th 2019, New York
About Metals Focus
2
• Independent & specialized; focused only on precious metals
• Large, highly experienced team of analysts: 25 in seven countries
• Extensive travel program to gather data & information
3
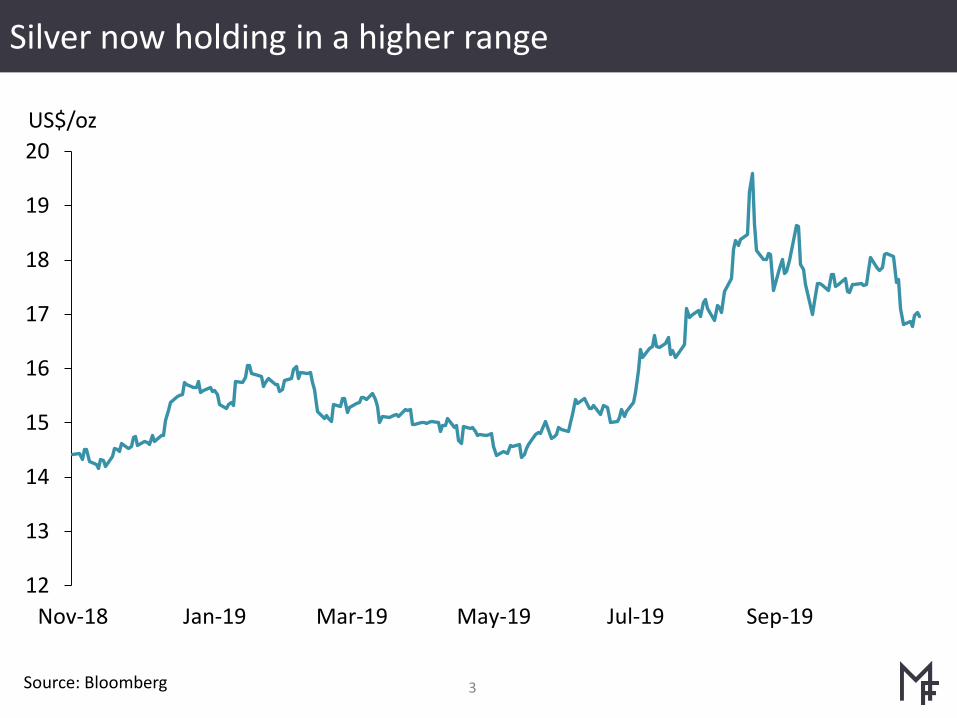
Silver now holding in a higher range
Source: Bloomberg
12
13
14
15
16
17
18
19
20
Nov-18 Jan-19 Mar-19 May-19 Jul-19 Sep-19
US$/oz
4
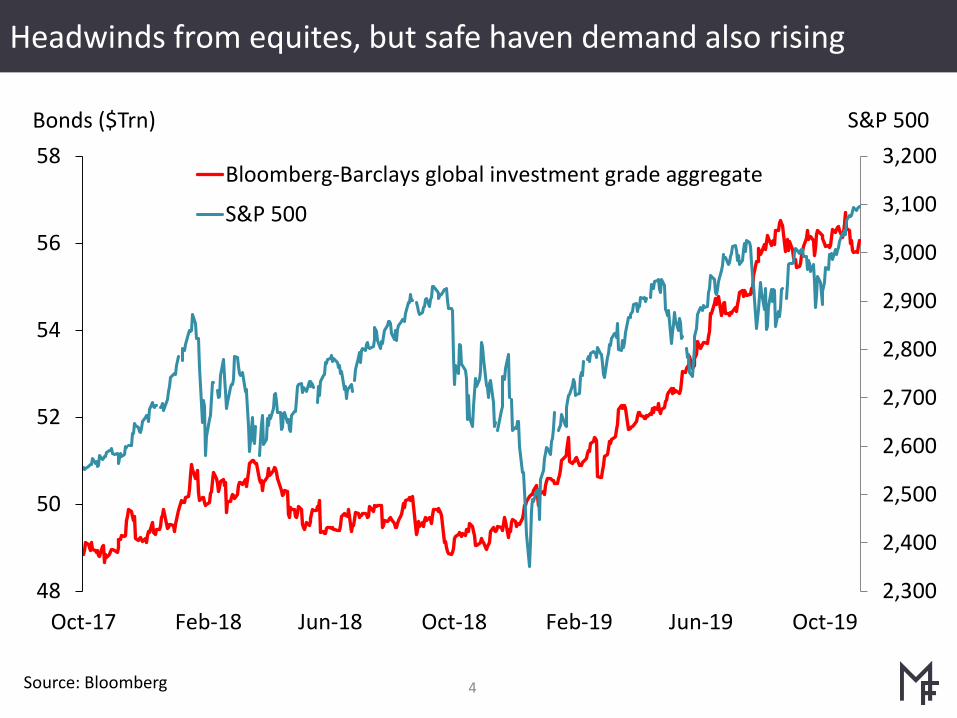
Headwinds from equites, but safe haven demand also rising
Source: Bloomberg
2,300
2,400
2,500
2,600
2,700
2,800
2,900
3,000
3,100
3,200
48
50
52
54
56
58
Oct-17 Feb-18 Jun-18 Oct-18 Feb-19 Jun-19 Oct-19
S&P 500Bonds ($Trn)
Bloomberg-Barclays global investment grade aggregate
S&P 500
5
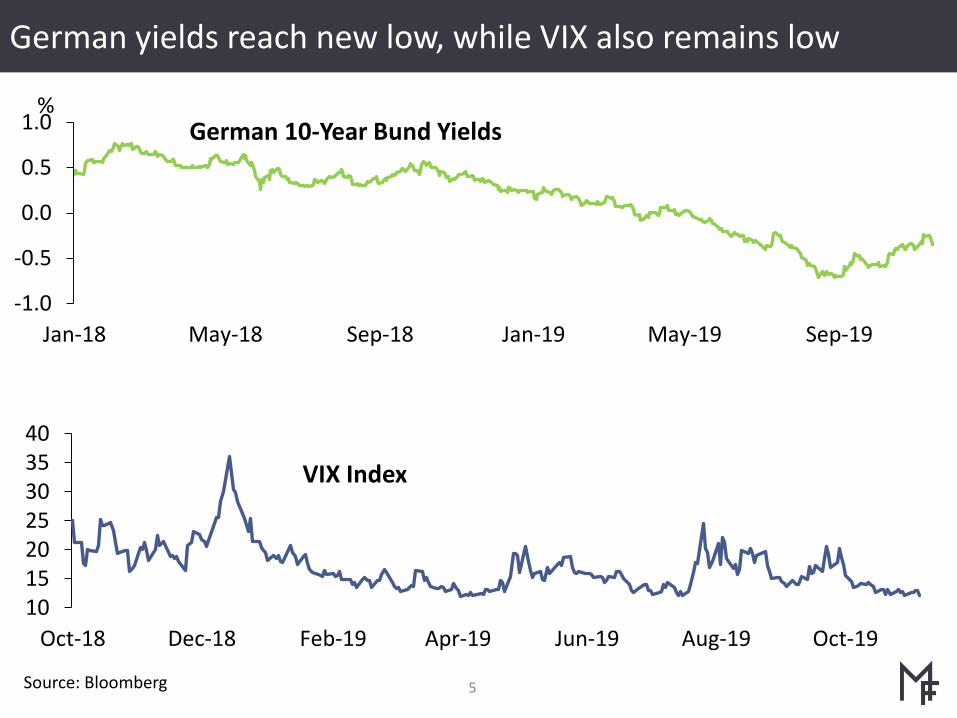
German yields reach new low, while VIX also remains low
Source: Bloomberg
-1.0
-0.5
0.0
0.5
1.0
Jan-18 May-18 Sep-18 Jan-19 May-19 Sep-19
%
10152025303540
Oct-18 Dec-18 Feb-19 Apr-19 Jun-19 Aug-19 Oct-19
German 10-Year Bund Yields
VIX Index
6
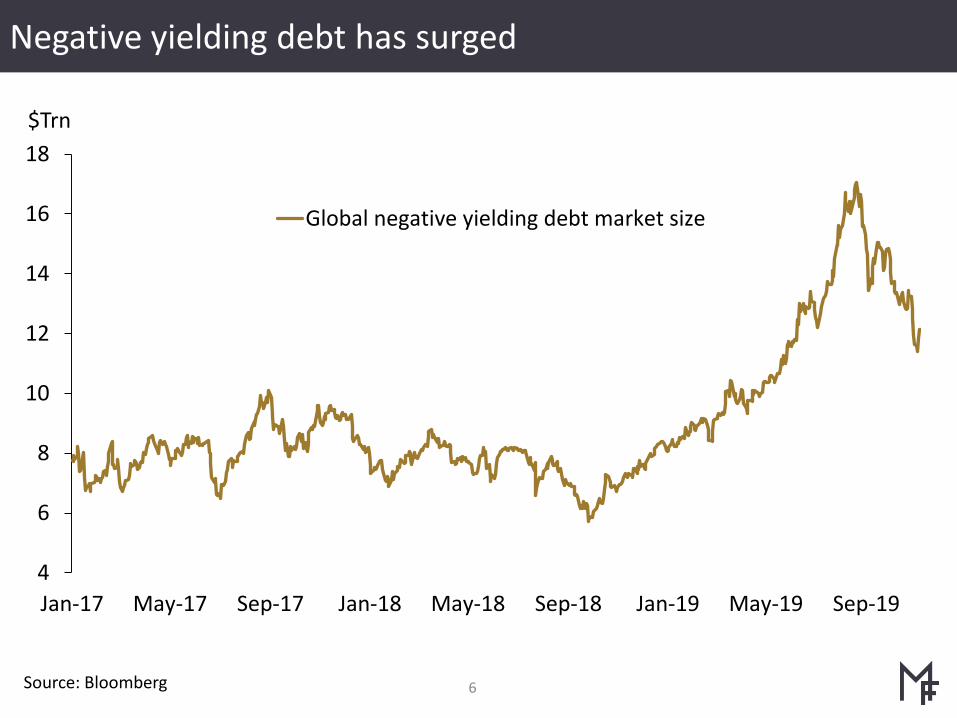
Negative yielding debt has surged
Source: Bloomberg
4
6
8
10
12
14
16
18
Jan-17 May-17 Sep-17 Jan-18 May-18 Sep-18 Jan-19 May-19 Sep-19
$Trn
Global negative yielding debt market size
7
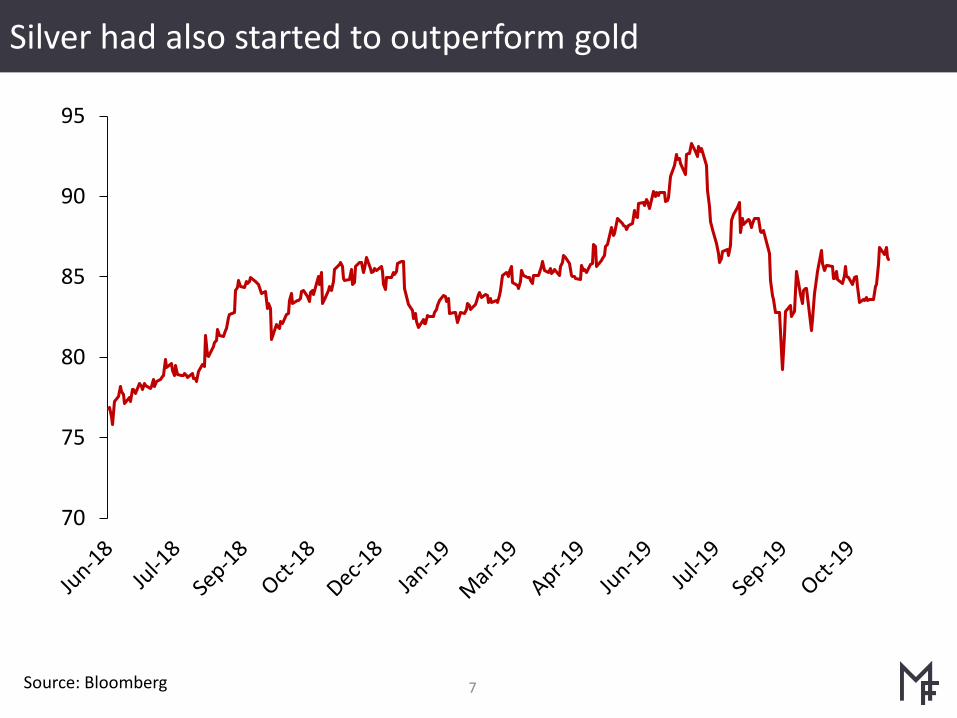
Silver had also started to outperform gold
Source: Bloomberg
70
75
80
85
90
95
8
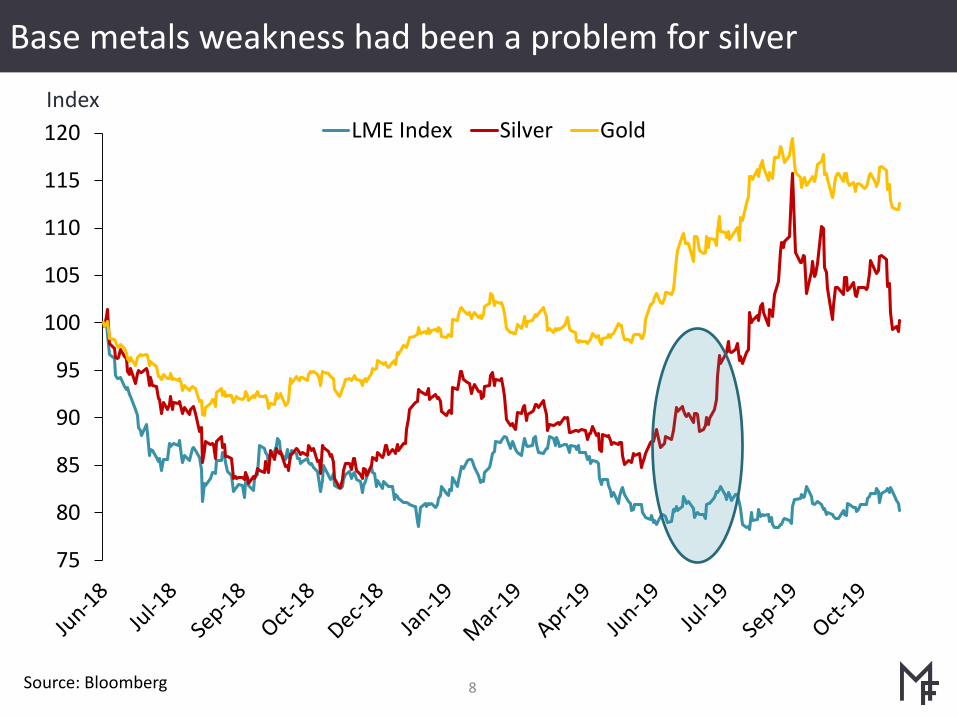
Base metals weakness had been a problem for silver
Source: Bloomberg
Index
75
80
85
90
95
100
105
110
115
120 LME Index Silver Gold
9
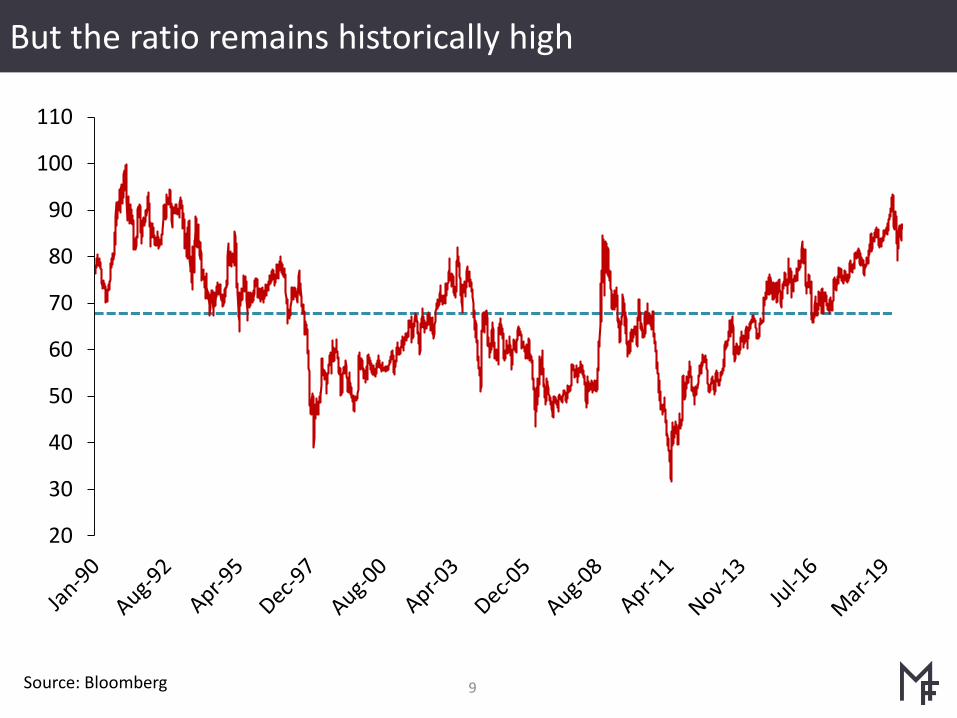
But the ratio remains historically high
Source: Bloomberg
20
30
40
50
60
70
80
90
100
110
10
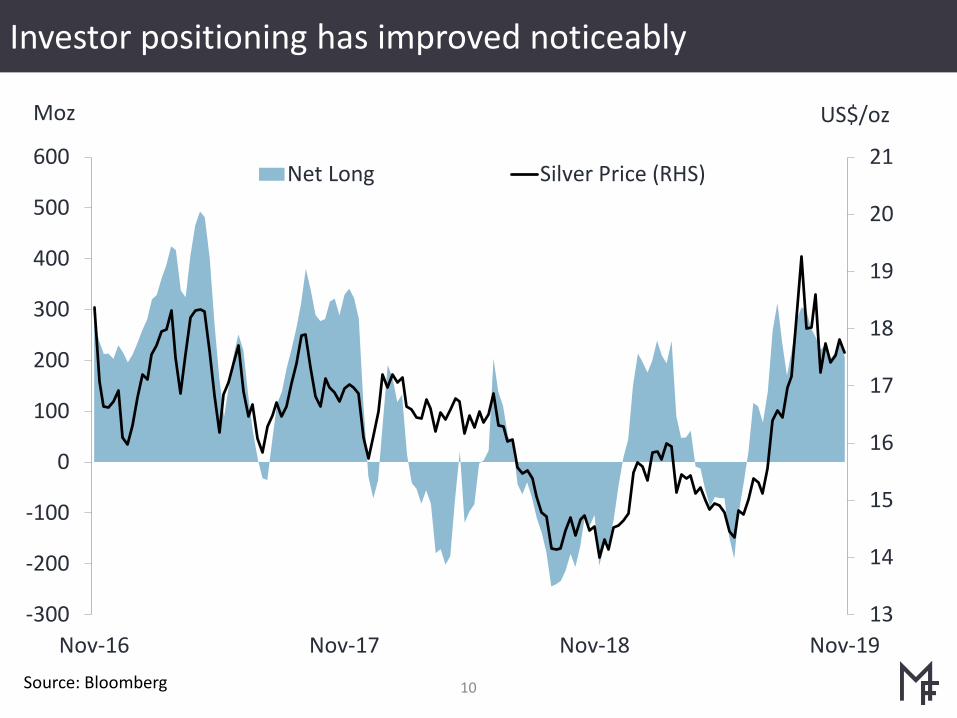
Investor positioning has improved noticeably
Source: Bloomberg
13
14
15
16
17
18
19
20
21
-300
-200
-100
0
100
200
300
400
500
600
Nov-16 Nov-17 Nov-18 Nov-19
Net Long Silver Price (RHS)
Moz US$/oz
11
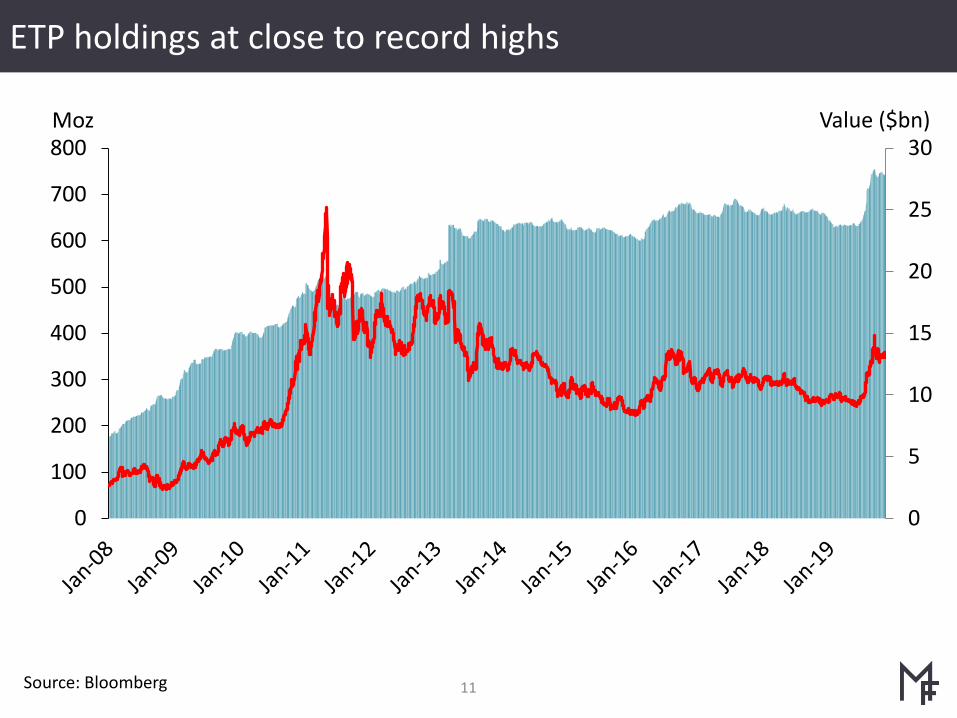
ETP holdings at close to record highs
Source: Bloomberg
0
5
10
15
20
25
30
0
100
200
300
400
500
600
700
800Value ($bn)Moz
12
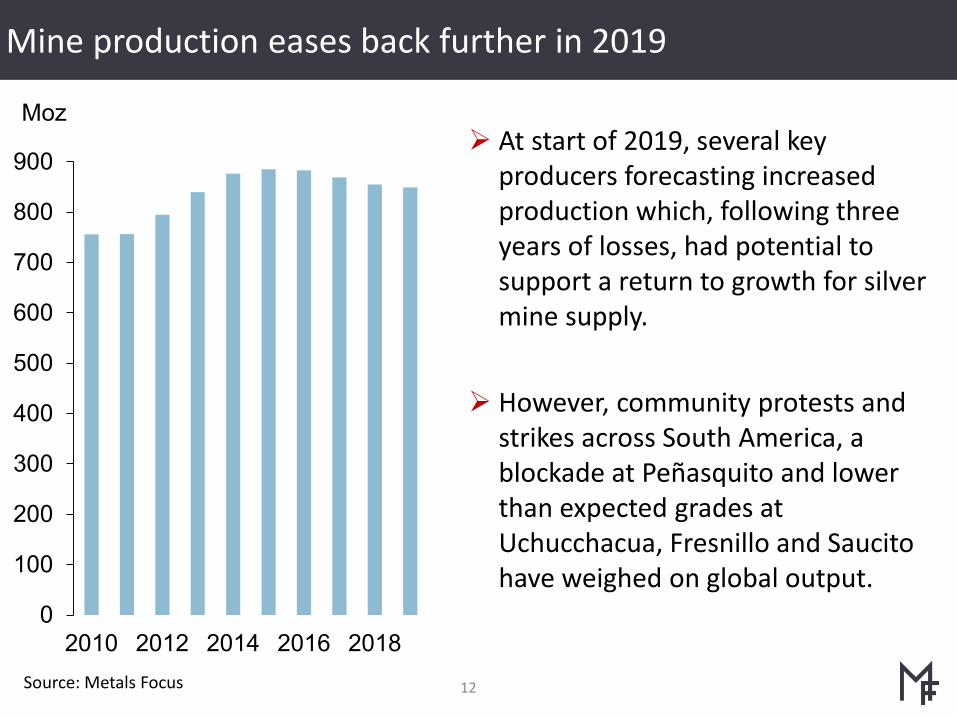
Mine production eases back further in 2019
Source: Metals Focus
0
100
200
300
400
500
600
700
800
900
2010 2012 2014 2016 2018
Moz At start of 2019, several key
producers forecasting increased production which, following three years of losses, had potential to support a return to growth for silver mine supply.
However, community protests and strikes across South America, a blockade at Peñasquito and lower than expected grades at Uchucchacua, Fresnillo and Saucitohave weighed on global output.
13
Mine production eases back further in 2019
Source: Metals Focus
0
100
200
300
400
500
600
700
800
900
2010 2012 2014 2016 2018
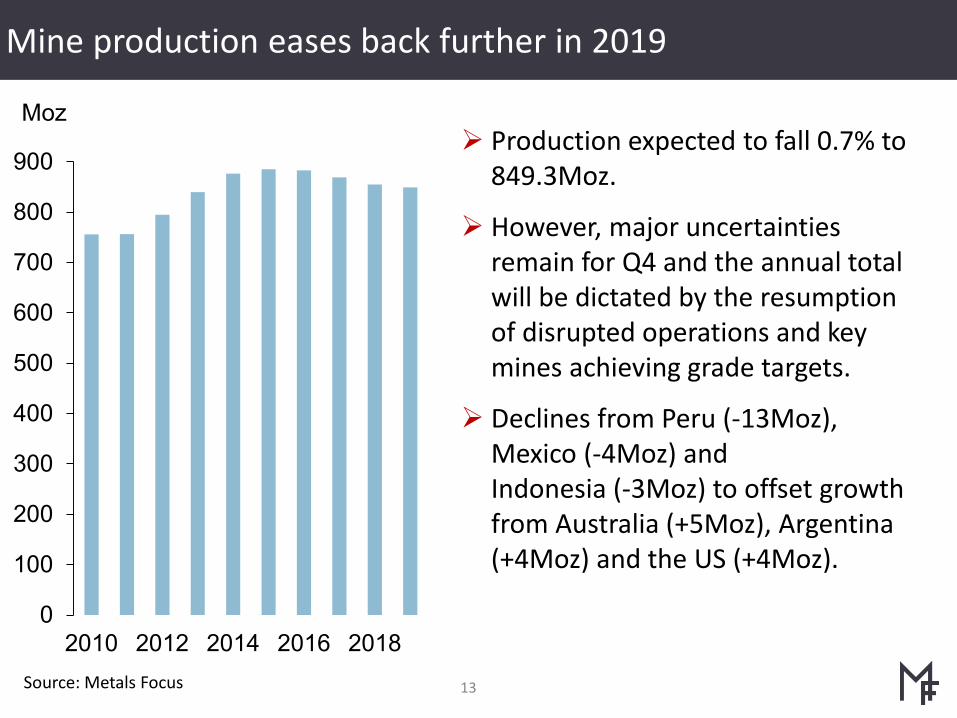
Moz Production expected to fall 0.7% to
849.3Moz.
However, major uncertainties remain for Q4 and the annual total will be dictated by the resumption of disrupted operations and key mines achieving grade targets.
Declines from Peru (-13Moz), Mexico (-4Moz) and Indonesia (-3Moz) to offset growth from Australia (+5Moz), Argentina (+4Moz) and the US (+4Moz).
All-in Sustaining Costs – Primary Silver Mines
14
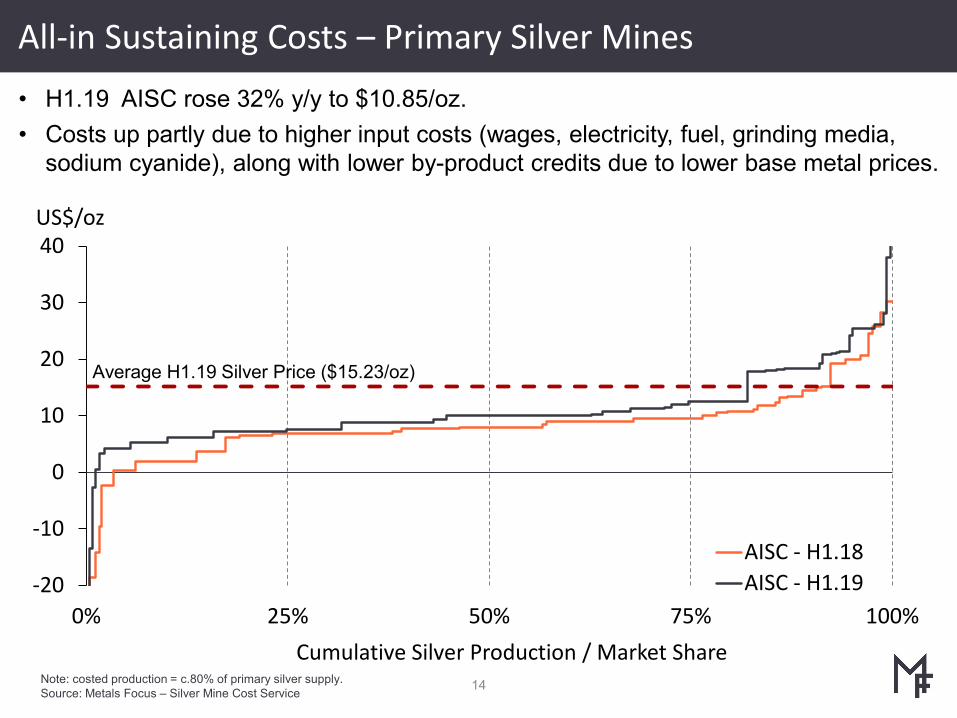
• H1.19 AISC rose 32% y/y to $10.85/oz. • Costs up partly due to higher input costs (wages, electricity, fuel, grinding media,
sodium cyanide), along with lower by-product credits due to lower base metal prices.
Note: costed production = c.80% of primary silver supply.Source: Metals Focus – Silver Mine Cost Service
-20
-10
0
10
20
30
40
0% 25% 50% 75% 100%
US$/oz
Cumulative Silver Production / Market Share
AISC - H1.18AISC - H1.19
Average H1.19 Silver Price ($15.23/oz)
Primary Silver Industry Cost Index
15Source: Metals Focus – Silver Mine Cost Service
-40%-30%-20%-10%
0%10%20%30%40%
Q1 12 Q1 13 Q1 14 Q1 15 Q1 16 Q1 17 Q1 18 Q1 19
Y/Y impact (weighted currencies & CPI)
Xrate Impact YoY CPI adjusted Xrate QoQ Chg Silver price yoySource: Skarn Associates, Bloomberg
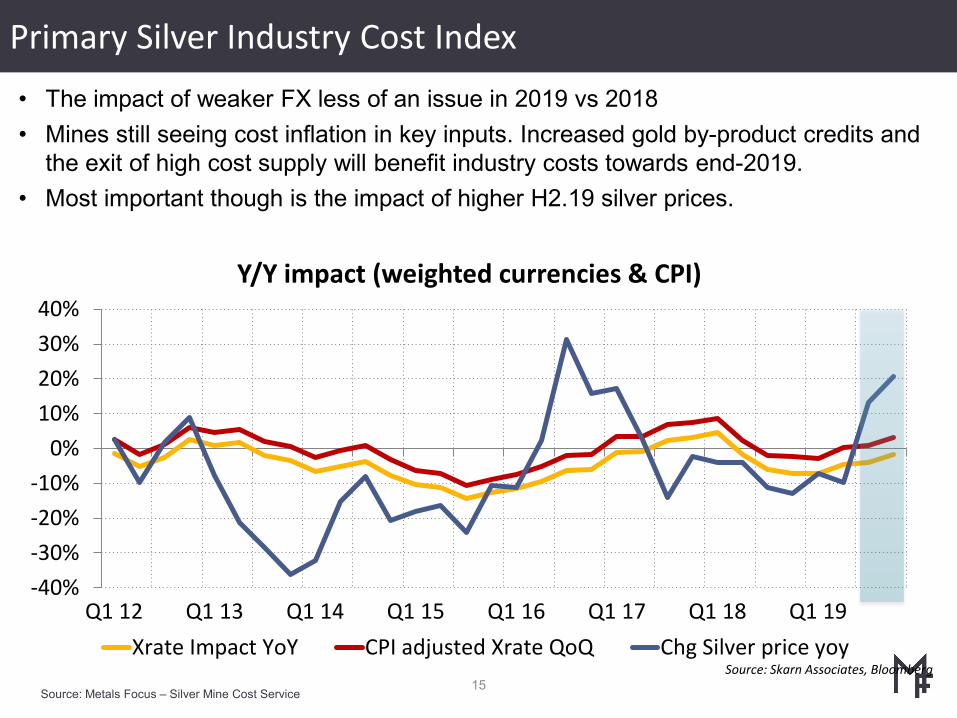
• The impact of weaker FX less of an issue in 2019 vs 2018• Mines still seeing cost inflation in key inputs. Increased gold by-product credits and
the exit of high cost supply will benefit industry costs towards end-2019.• Most important though is the impact of higher H2.19 silver prices.
16
Global supply summary
Source: Metals Focus
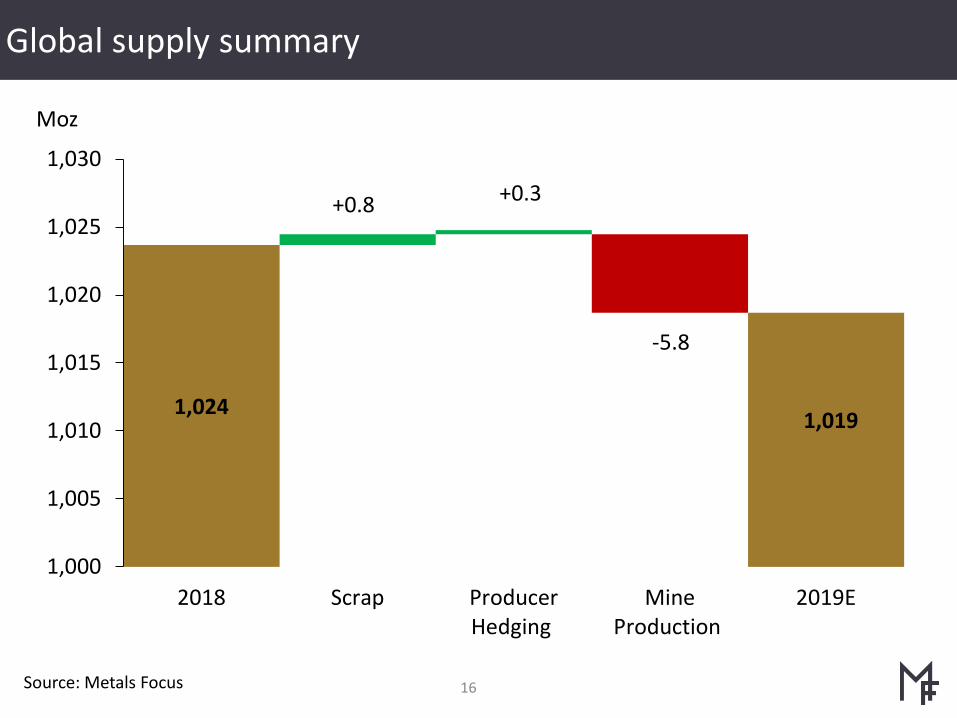
1,024
+0.8 +0.3
-5.8
1,019
1,000
1,005
1,010
1,015
1,020
1,025
1,030
2018 Scrap ProducerHedging
MineProduction
2019E
Moz
17
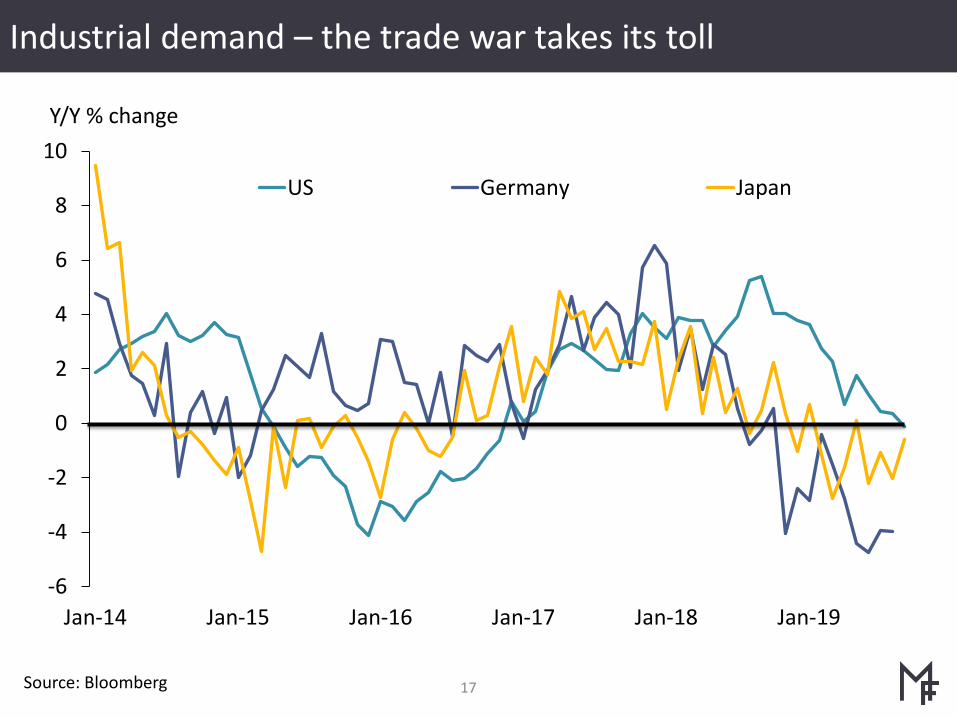
Industrial demand – the trade war takes its toll
Source: Bloomberg
-6
-4
-2
0
2
4
6
8
10
Jan-14 Jan-15 Jan-16 Jan-17 Jan-18 Jan-19
Y/Y % change
US Germany Japan
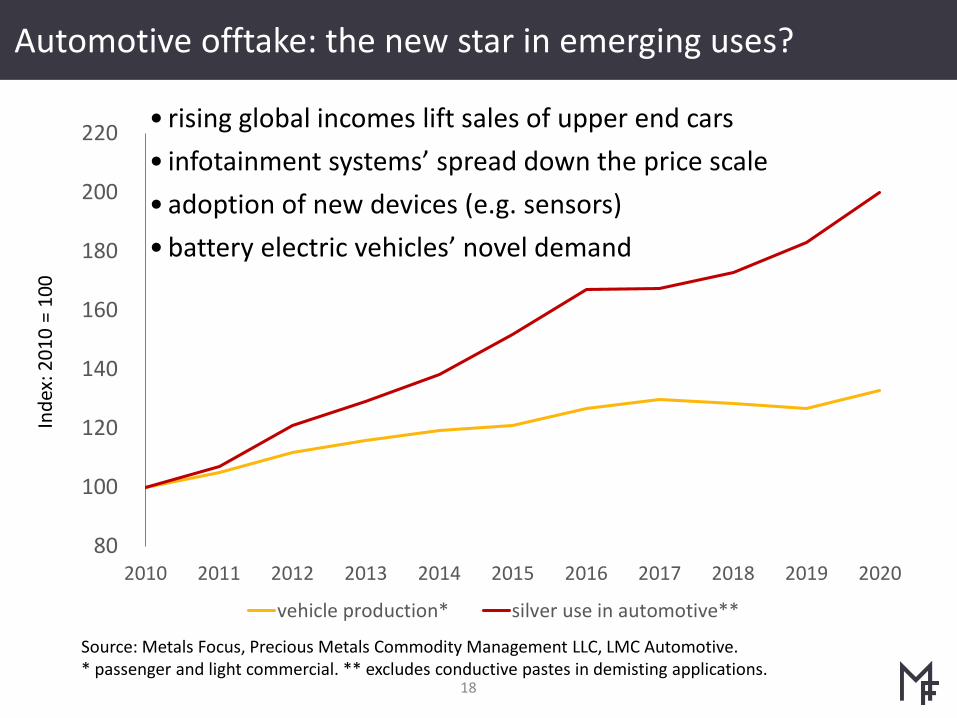
Source: Metals Focus, Precious Metals Commodity Management LLC, LMC Automotive. * passenger and light commercial. ** excludes conductive pastes in demisting applications.
18
Automotive offtake: the new star in emerging uses?In
dex:
201
0 =
100
• rising global incomes lift sales of upper end cars• infotainment systems’ spread down the price scale • adoption of new devices (e.g. sensors) • battery electric vehicles’ novel demand
80
100
120
140
160
180
200
220
2010 2011 2012 2013 2014 2015 2016 2017 2018 2019 2020
vehicle production* silver use in automotive**
Source: Metals Focus, various19
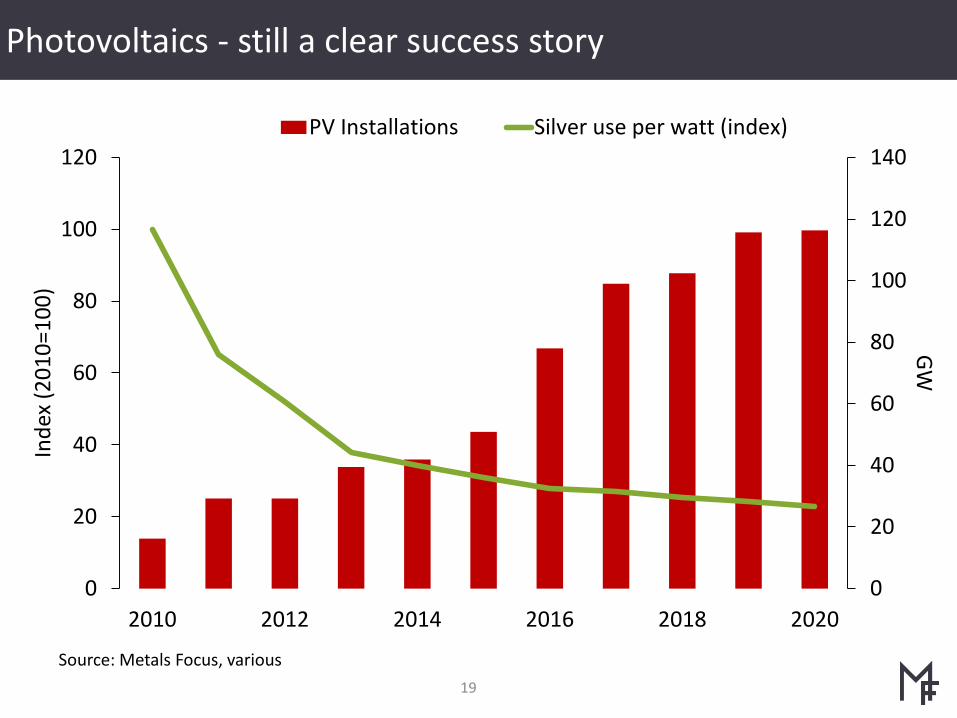
Photovoltaics - still a clear success story
0
20
40
60
80
100
120
140
0
20
40
60
80
100
120
2010 2012 2014 2016 2018 2020
GWIn
dex
(201
0=10
0)
PV Installations Silver use per watt (index)
20
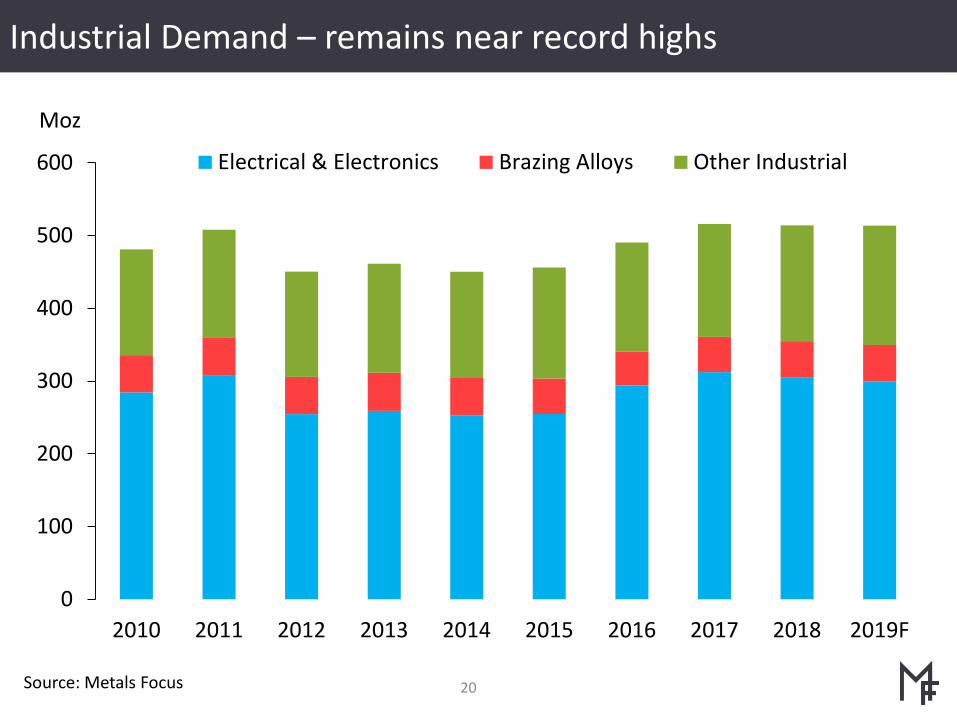
Industrial Demand – remains near record highs
Source: Metals Focus
0
100
200
300
400
500
600
2010 2011 2012 2013 2014 2015 2016 2017 2018 2019F
Moz
Electrical & Electronics Brazing Alloys Other Industrial
Source: Metals Focus21
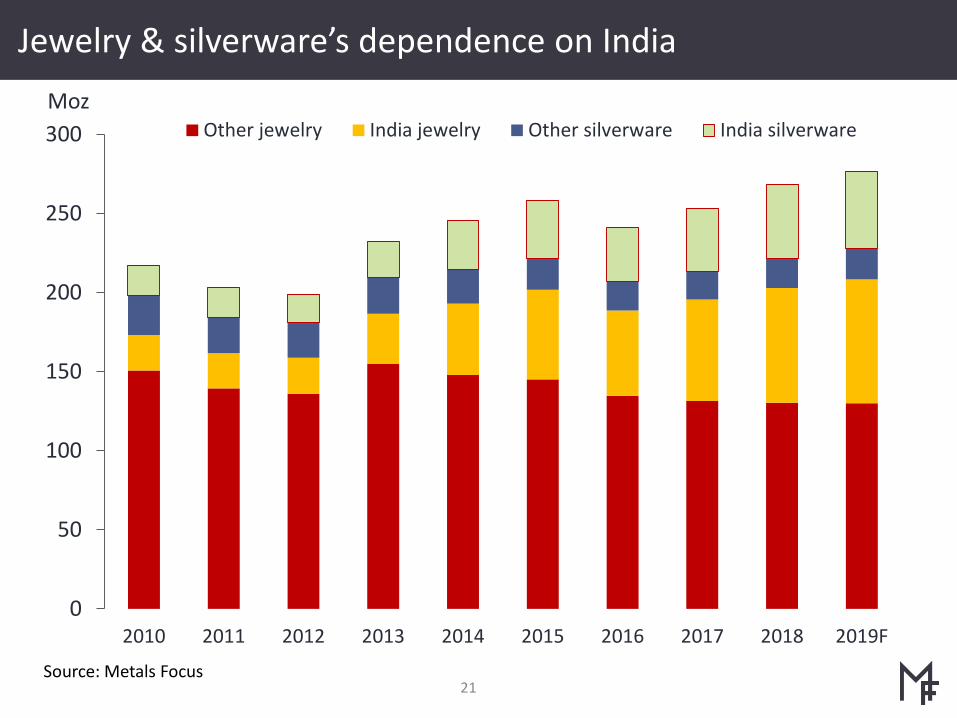
Jewelry & silverware’s dependence on India
0
50
100
150
200
250
300
2010 2011 2012 2013 2014 2015 2016 2017 2018 2019F
Other jewelry India jewelry Other silverware India silverwareMoz
22
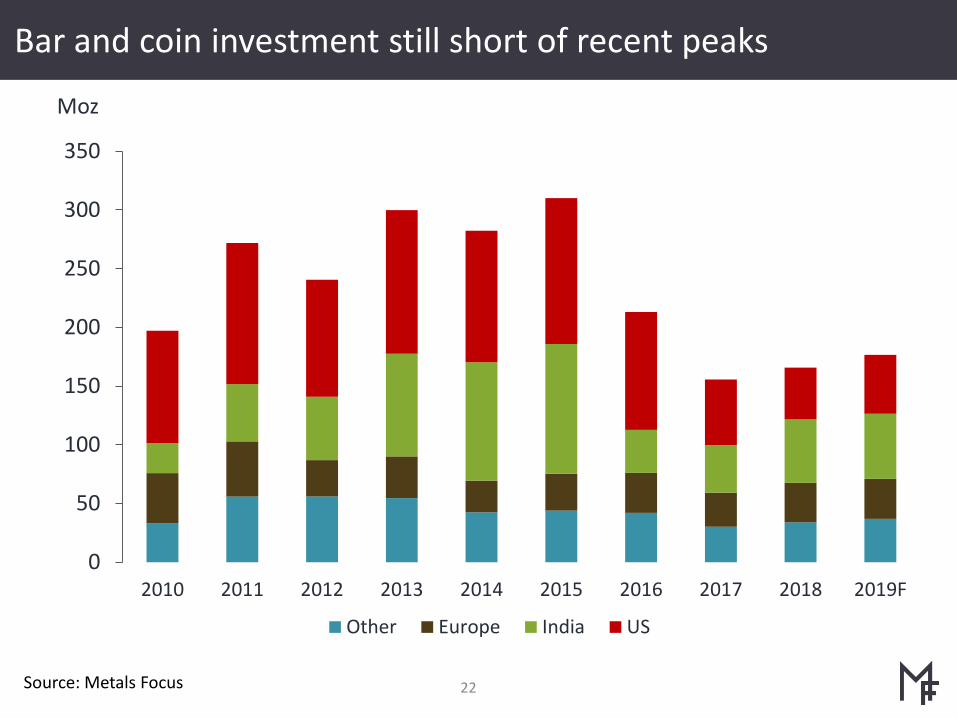
Bar and coin investment still short of recent peaks
0
50
100
150
200
250
300
350
2010 2011 2012 2013 2014 2015 2016 2017 2018 2019F
Other Europe India US
Moz
Source: Metals Focus
23
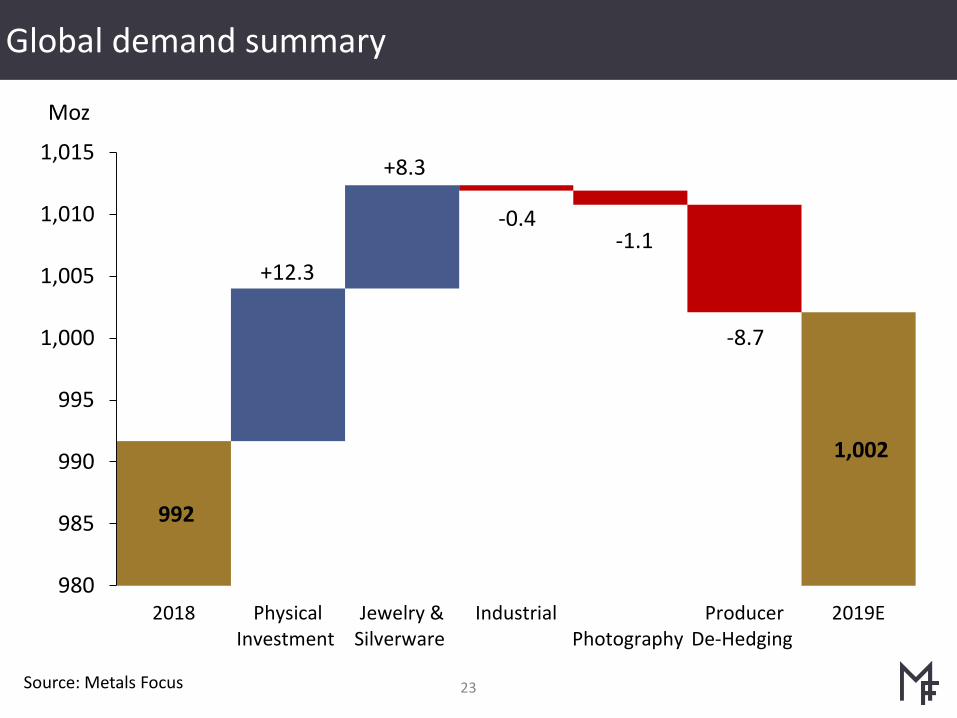
Global demand summary
Source: Metals Focus
992
1,002
-0.4 -1.1
-8.7
+12.3
+8.3
980
985
990
995
1,000
1,005
1,010
1,015
2018 PhysicalInvestment
Jewelry &Silverware
IndustrialPhotography
ProducerDe-Hedging
2019E
Moz
24
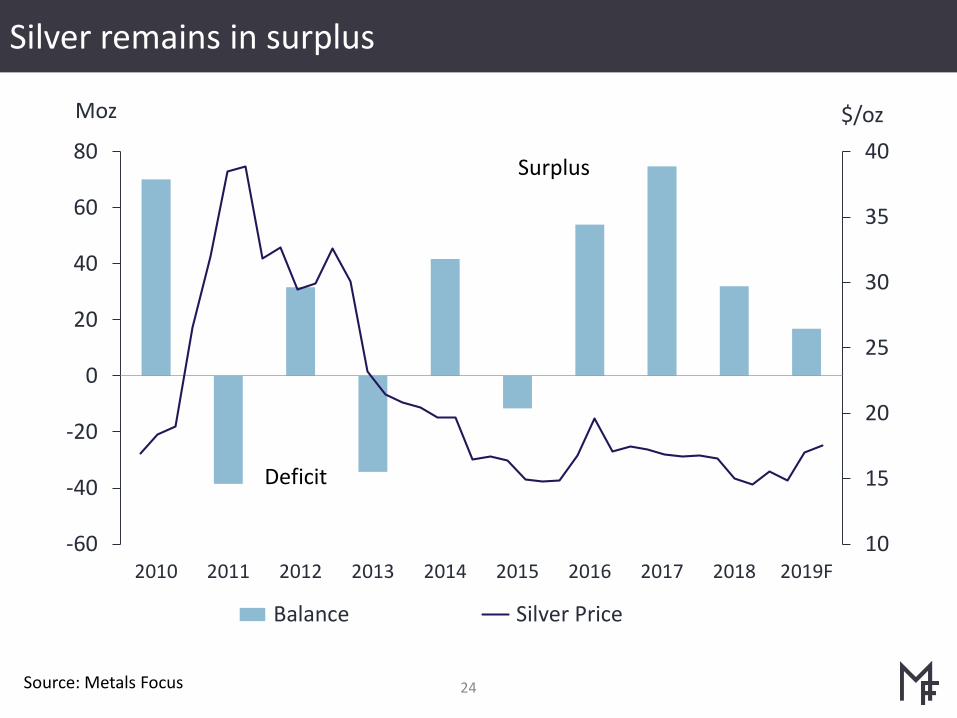
Silver remains in surplus
10
15
20
25
30
35
40
-60
-40
-20
0
20
40
60
80
2010 2011 2012 2013 2014 2015 2016 2017 2018 2019F
Balance Silver Price
Moz $/oz
Surplus
Deficit
Source: Metals Focus
25
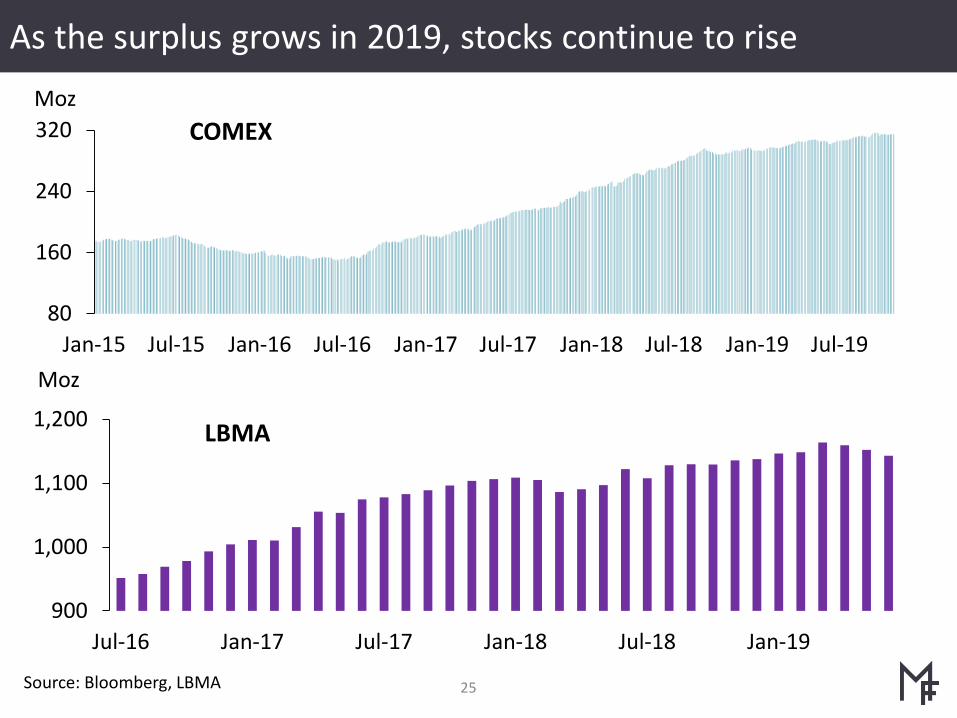
As the surplus grows in 2019, stocks continue to rise
Source: Bloomberg, LBMA
80
160
240
320
Jan-15 Jul-15 Jan-16 Jul-16 Jan-17 Jul-17 Jan-18 Jul-18 Jan-19 Jul-19
Moz
900
1,000
1,100
1,200
Jul-16 Jan-17 Jul-17 Jan-18 Jul-18 Jan-19
Moz
LBMA
COMEX
26
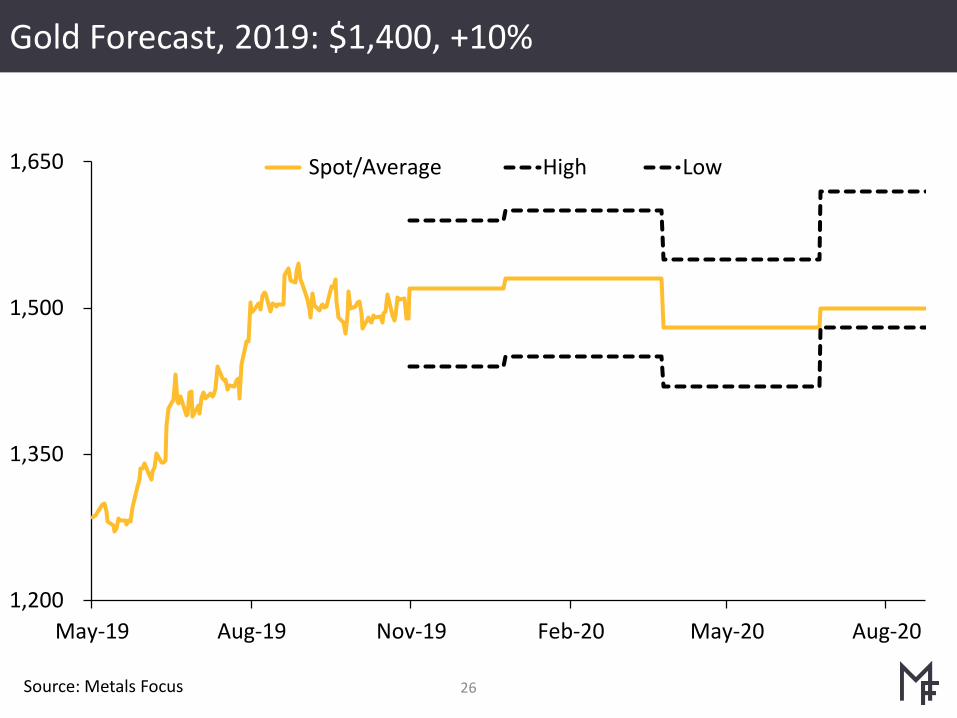
Gold Forecast, 2019: $1,400, +10%
Source: Metals Focus
1,200
1,350
1,500
1,650
May-19 Aug-19 Nov-19 Feb-20 May-20 Aug-20
Spot/Average High Low
27
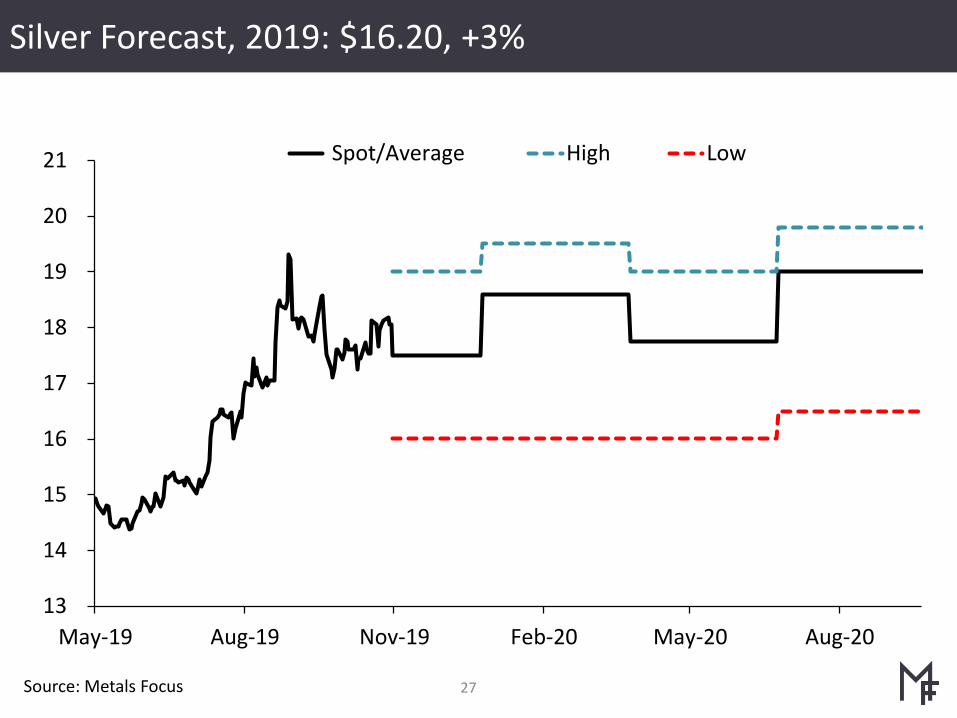
Silver Forecast, 2019: $16.20, +3%
Source: Metals Focus
13
14
15
16
17
18
19
20
21
May-19 Aug-19 Nov-19 Feb-20 May-20 Aug-20
Spot/Average High Low

AddressUnit T, Reliance Wharf2-10 Hertford RoadLondon N1 5ETUK
Tel: +44 20 3301 6510Email: [email protected] Metals Focus Launch Page: MTFOBloomberg chat: IB MFOCUS
For information about our products and services please contact;
Disclaimer & Copyright @ Metals Focus Ltd, 2019
Although every effort has been made to undertake this work with care and diligence, Metals Focus Ltd cannot guarantee the accuracy of any forecasts or assumptions. Nothing contained in this presentation constitutes an offer to buy or sell securities or commodities and nor does it constitute advice in relation to the buying or selling of investments. It is published only for informational purposes. Metals Focus Ltd does not accept responsibility for any losses or damages arising directly or indirectly from the use of this presentation.