THE SILVER MARKET IN 2016 · 2017-08-07 · THE SILVER MARKET IN 2016 Johann Wiebe Senior Analyst,...
32
Transcript of THE SILVER MARKET IN 2016 · 2017-08-07 · THE SILVER MARKET IN 2016 Johann Wiebe Senior Analyst,...

THE SILVER MARKET IN 2016
Johann Wiebe
Senior Analyst, Precious Metals Demand
The Silver Institute - 2016 Interim Report
November 16, 2016

REAL GDP GROWTH
-4
-2
0
2
4
6
8
10
12
2007 2008 2009 2010 2011 2012 2013 2014 2015 2016F
Emerging Countries
Advanced Economies
Source: IMF WEO
% Y
OY

GROWTH IN PHYSICAL SILVER DEMAND
-40
-30
-20
-10
0
10
20
30
40
2007 2008 2009 2010 2011 2012 2013 2014 2015 2016F
Emerging Countries
Advanced Economies
Source: GFMS, Thomson Reuters
% C
ha
ng
e

WORLD SILVER SUPPLY AND DEMAND
Source: GFMS, Thomson Reuters
Moz 2012 2013 2014 2015 2016f
% ∆ - 2015
% ∆ - 2012
Mine Production 790.8 823.7 868.0 893.0 887.4 -0.6% 12.2%
Total Supply 1,006.6 988.9 1,053.0 1,046.4 1,012.4 -3.2% 0.6%
Jewelry & Silverware 229.1 276.6 284.7 289.1 257.6 -10.9% 12.4%
Coins & Bars 159.6 241.9 236.5 292.4 222.0 -24.1% 39.1%
Industrial Fabrication 615.0 619.1 611.2 588.9 585.1 -0.6% -4.9%
Physical Demand 1,003.7 1,137.6 1,132.4 1,170.3 1,064.6 -9.0% 6.1%
Physical Surplus/Deficit 2.9 - 148.7 - 79.3 - 124.0 - 52.2 na na
Annual Average Silver Price $/oz 31.15 23.79 19.08 15.68 17.15 9.4% -44.9%

THE SILVER MARKET IN 2016
• SILVER PRICES
• DEMAND
• SUPPLY
• INVESTMENT
• PRICE OUTLOOK

US DOLLAR SILVER PRICES (As of 15th Nov)
Source: Thomson Reuters Eikon
*intra-period change refers to difference between the last business day and the first
business day of the year
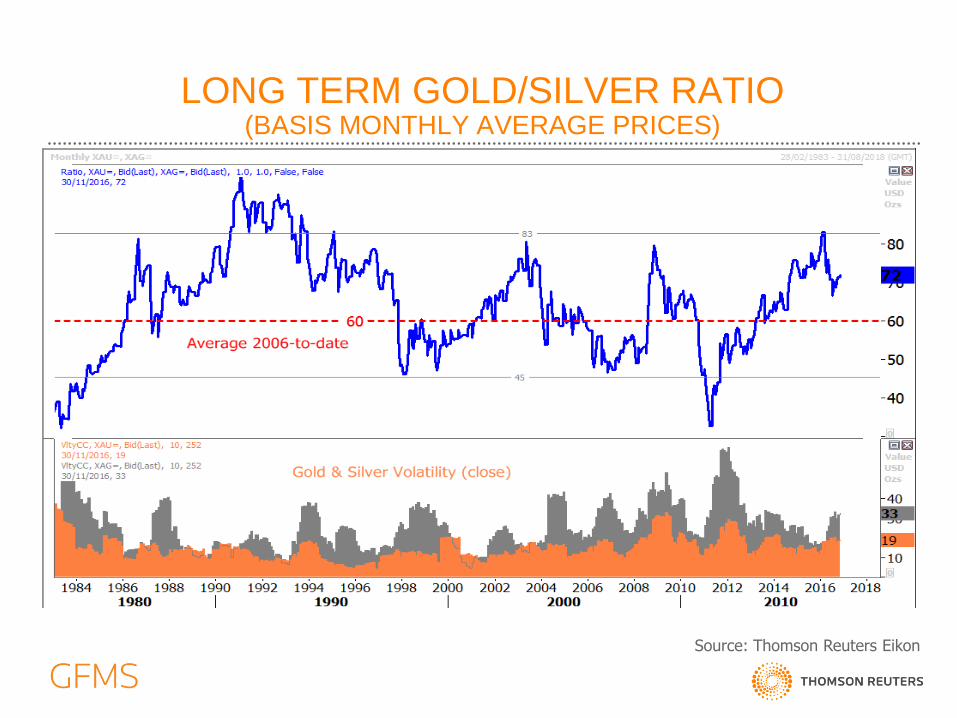
LONG TERM GOLD/SILVER RATIO
(BASIS MONTHLY AVERAGE PRICES)
Source: Thomson Reuters Eikon
THE SILVER MARKET IN 2016
• PRICES
• DEMAND
• SUPPLY
• INVESTMENT
• OUTLOOK
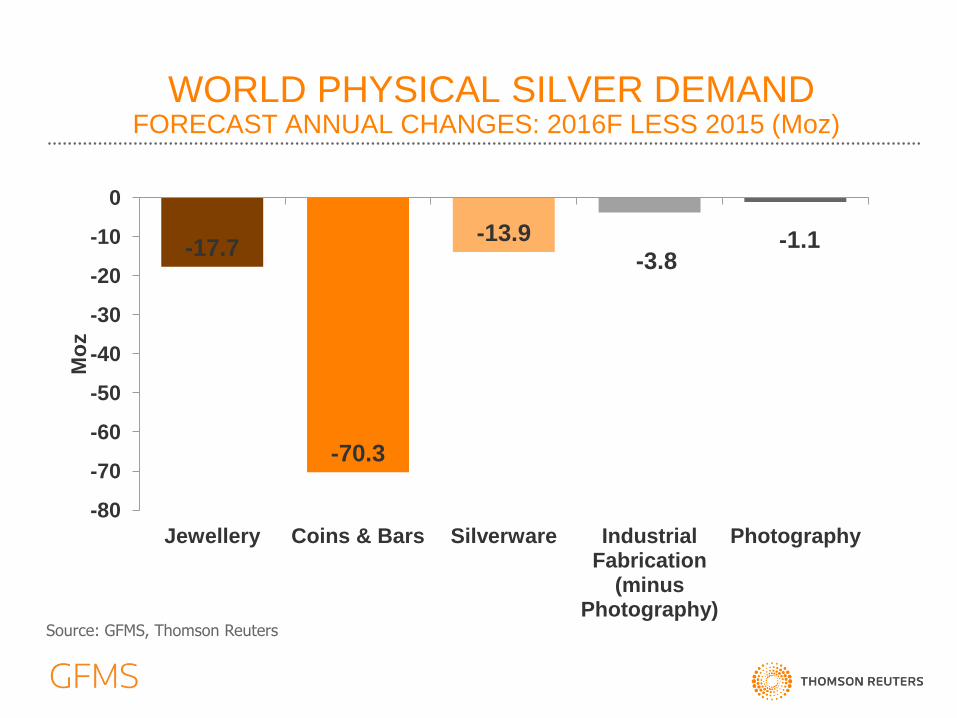
WORLD PHYSICAL SILVER DEMAND FORECAST ANNUAL CHANGES: 2016F LESS 2015 (Moz)
Source: GFMS, Thomson Reuters
-17.7
-70.3
-13.9 -3.8
-1.1
-80
-70
-60
-50
-40
-30
-20
-10
0
Jewellery Coins & Bars Silverware Industrial Fabrication
(minus Photography)
Photography
Mo
z

INDUSTRIAL FABRICATION FORECAST ANNUAL CHANGES: 2016F LESS 2015 (Moz)
-3.9
-2.1 -1.1
8.1
0.0
-4.7 -6
-4
-2
0
2
4
6
8
10
Electrical & Electronics
Brazing Alloys & Solders
Photography Solar Ethylene Oxide
Catalyst
Other Industrial
Application
Mo
z
Source: GFMS, Thomson Reuters

SOLAR DEMAND - SILVER POWDER PRODUCTION
Source: GFMS, Thomson Reuters
32% 39% 45% 45% 48% 45%
68%
60% 52%
43%
39% 41%
0
10
20
30
40
50
60
70
80
90
2011 2012 2013 2014 2015 2016F
Silver
Dem
an
d (
Mo
z)
Japan United States China

GLOBAL COIN SALES
*Excludes Commemorative and China Mint coins Source: GFMS, Thomson Reuters – Quarterly Coin Sales Survey
0
5
10
15
20
25
30
35
08-Q1 09-Q1 10-Q1 11-Q1 12-Q1 13-Q1 14-Q1 15-Q1 16-Q1
Co
in S
ale
s M
oz
N America Europe Asia Other
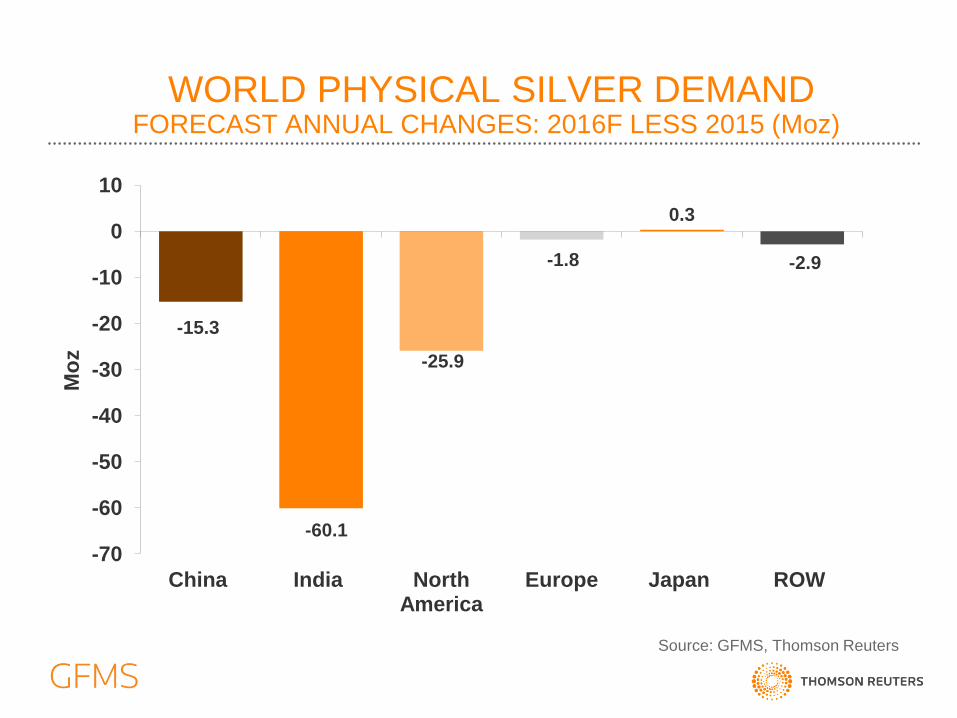
-15.3
-60.1
-25.9
-1.8
0.3
-2.9
-70
-60
-50
-40
-30
-20
-10
0
10
China India North America
Europe Japan ROW
WORLD PHYSICAL SILVER DEMAND FORECAST ANNUAL CHANGES: 2016F LESS 2015 (Moz)
Mo
z
Source: GFMS, Thomson Reuters
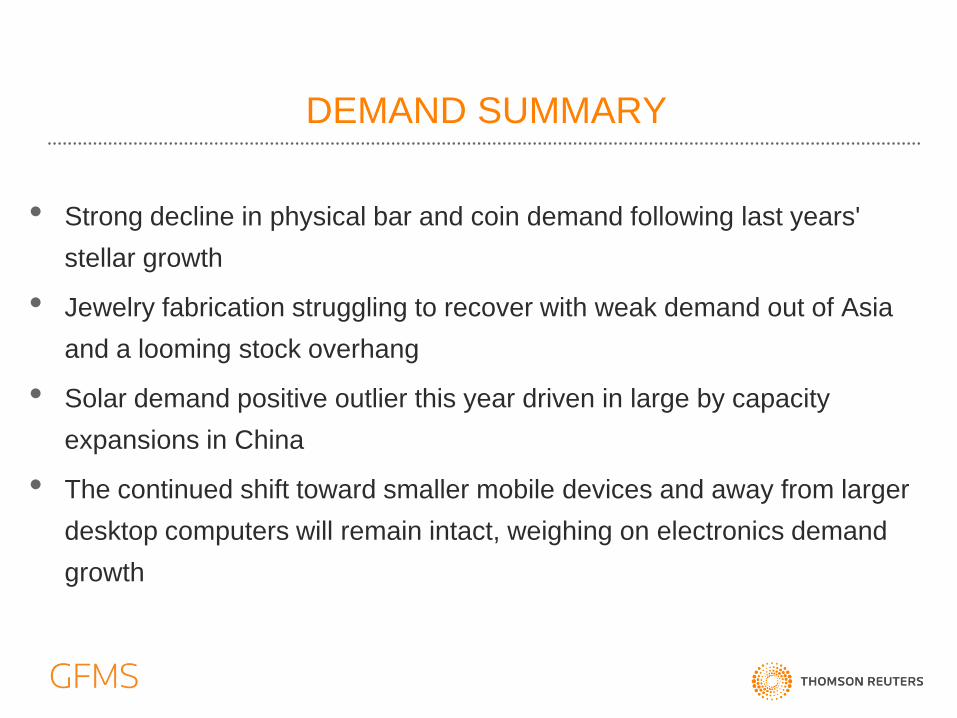
DEMAND SUMMARY
• Strong decline in physical bar and coin demand following last years'
stellar growth
• Jewelry fabrication struggling to recover with weak demand out of Asia
and a looming stock overhang
• Solar demand positive outlier this year driven in large by capacity
expansions in China
• The continued shift toward smaller mobile devices and away from larger
desktop computers will remain intact, weighing on electronics demand
growth

THE SILVER MARKET IN 2016
• PRICES
• DEMAND
• SUPPLY
• INVESTMENT
• OUTLOOK

MINE PRODUCTION WINNERS AND LOSERS H1 2015 VERSUS H1 2016
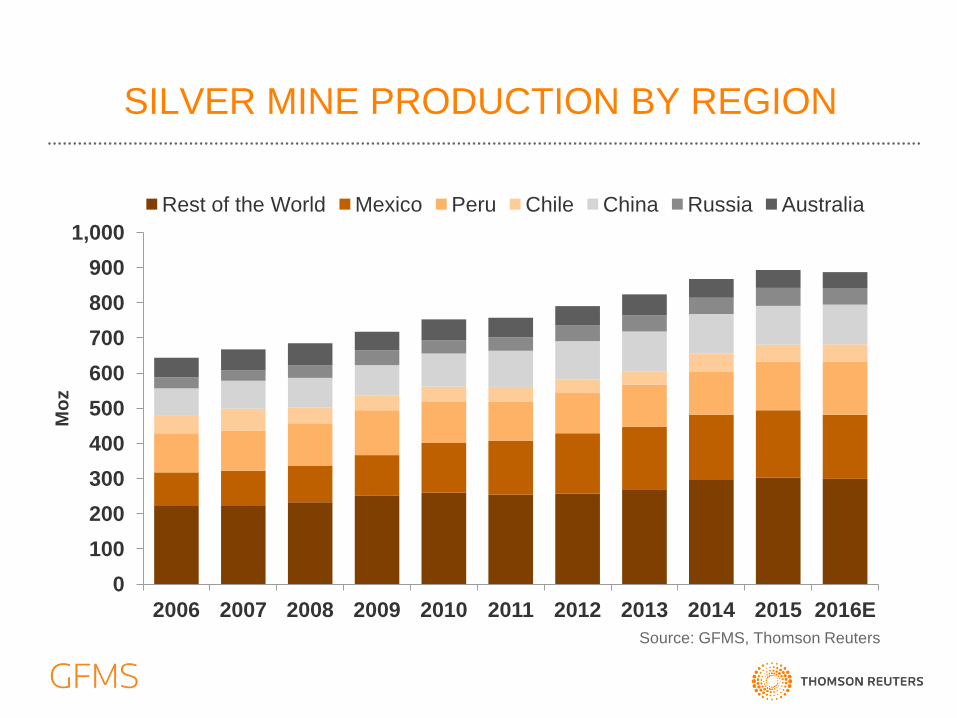
SILVER MINE PRODUCTION BY REGION
Source: GFMS, Thomson Reuters
0
100
200
300
400
500
600
700
800
900
1,000
2006 2007 2008 2009 2010 2011 2012 2013 2014 2015 2016E
Mo
z
Rest of the World Mexico Peru Chile China Russia Australia

SILVER MINE PRODUCTION BY SOURCE METAL
Source: GFMS, Thomson Reuters
primary 30.4%
lead/zinc 34.4%
copper 22.1%
gold 12.5%
other 0.6%
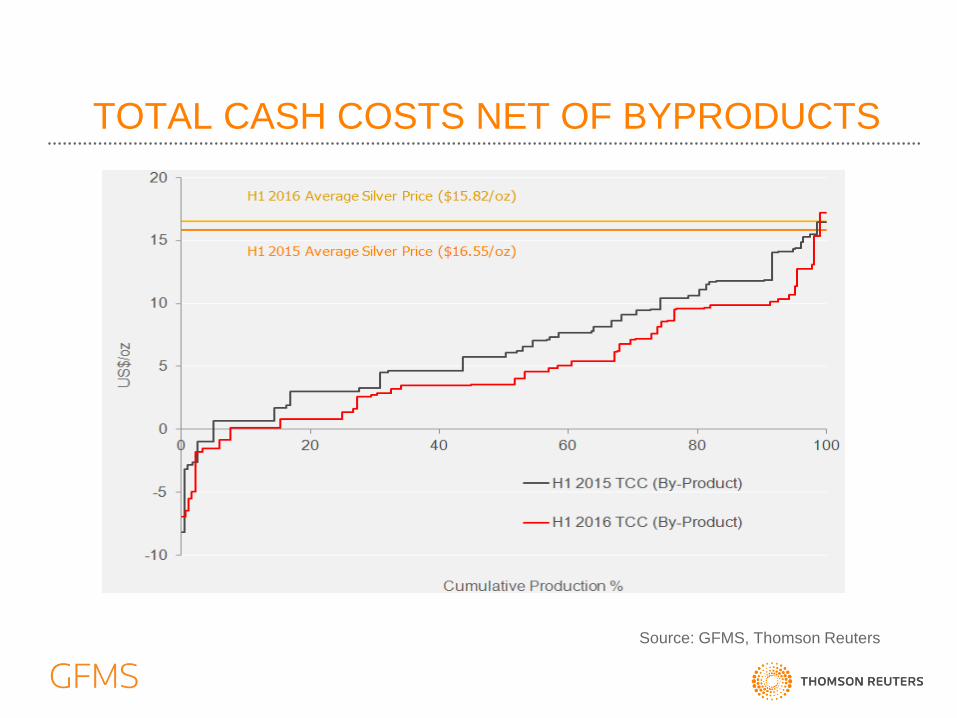
TOTAL CASH COSTS NET OF BYPRODUCTS
Source: GFMS, Thomson Reuters

TOTAL CASH COST ON A COPRODUCT BASIS + CAPEX
Source: GFMS, Thomson Reuters
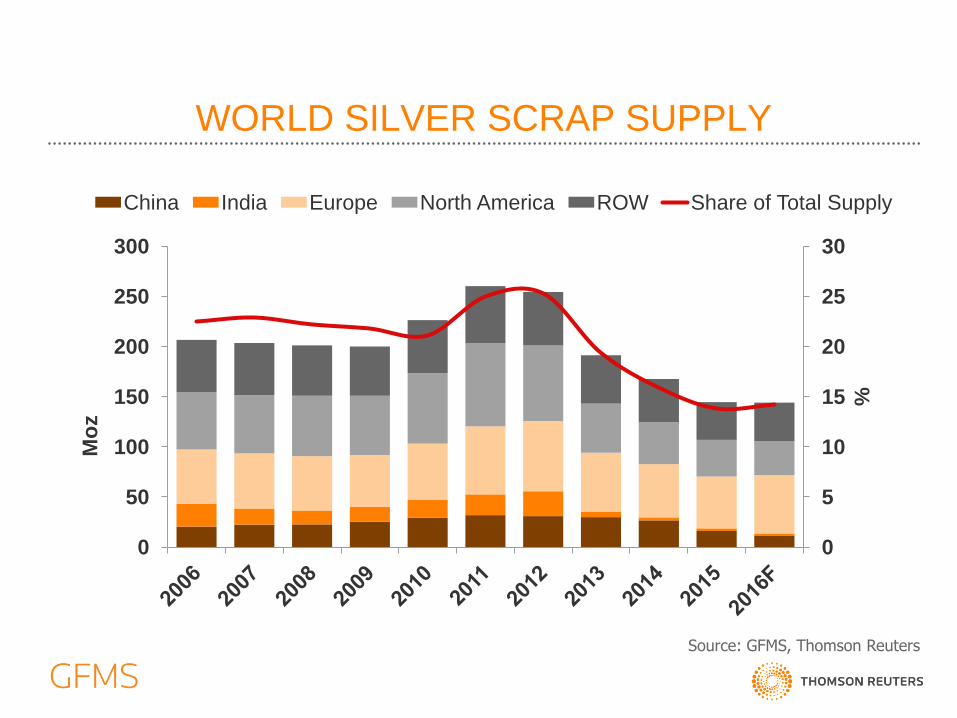
WORLD SILVER SCRAP SUPPLY
Source: GFMS, Thomson Reuters
0
5
10
15
20
25
30
0
50
100
150
200
250
300
%
Mo
z
China India Europe North America ROW Share of Total Supply

OUTSTANDING DELTA ADJUSTED PRODUCERS HEDGE POSITION
Source: GFMS, Thomson Reuters
-60
-40
-20
-
20
40
60
2007 2008 2009 2010 2011 2012 2013 2014 2015 2016
Mo
z y
ea
r-on-y
ea
r ch
an
ge
Net Hedging
Net De-hedging

SUPPLY SUMMARY
• We estimate that mine supply peaked in 2015 and will trend lower in the
foreseeable future.
• Supply from scrap is expected to stabilize around 2016 levels in the
medium term.
• The hedge book remains at low levels and hedging is not forecast to
return to the market in strength.
• Government sales are not expected to be a feature of the market in the
years ahead .
• Declining total supply is expected to be a key driver of annual deficits in
the silver market going forward.
THE SILVER MARKET IN 2016
• PRICES
• DEMAND
• SUPPLY
• INVESTMENT
• OUTLOOK

WORLD SILVER IDENTIFIABLE INVESTMENT VOLUME AND VALUE
Source: GFMS, Thomson Reuters Identifiable Investment is the sum of bars, coins and ETPs.
0
1
2
3
4
5
6
7
8
9
-50
0
50
100
150
200
250
300
350
2007 2008 2009 2010 2011 2012 2013 2014 2015 2016
US
$ B
n
Mo
z
Coins & Bars
ETP Inventory Build
Total Identifiable Investment in US$ Bn (RHS)

INVESTORS’ POSITIONS IN COMEX SILVER FUTURES & OPTIONS
As of 15th November Thomson Reuters Datastream
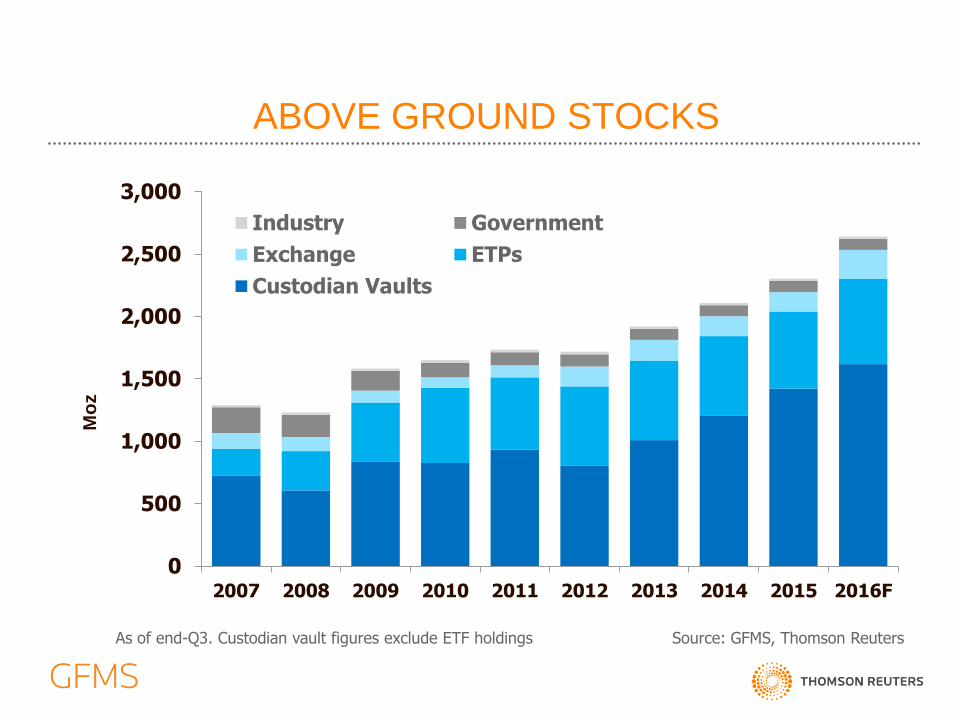
ABOVE GROUND STOCKS
*
Source: GFMS, Thomson Reuters As of end-Q3. Custodian vault figures exclude ETF holdings
0
500
1,000
1,500
2,000
2,500
3,000
2007 2008 2009 2010 2011 2012 2013 2014 2015 2016F
Industry Government
Exchange ETPs
Custodian Vaults
Mo
z
THE SILVER MARKET IN 2016
• PRICES
• DEMAND
• SUPPLY
• INVESTMENT
• OUTLOOK
OUTLOOK
• The sluggish sentiment in Asia has had a significant impact on silver
offtake in 2016, a theme expected to persist in 2017, albeit to a lesser
extent.
• Physical demand is expected to pick up again (Europe) supported by
short term falling prices.
• PV demand in the solar sector is expected to continue to be the star
performer of industrial offtake.
• Mine supply is expected to decline in the long run and we believe that
2016 was the beginning of this protracted decline. Meanwhile, scrap
levels are expected to stabilize.
• Above ground stocks are expected to flat line going forward amid a
chronic shortfall of supply against physical demand. This will provide
support to prices in the long run

DISCLAIMER
The information and opinions contained in this presentation have been obtained
from sources believed to be reliable, but no representation, guarantee, condition
or warranty, express or implied, is made that such information is accurate or
complete and it should not be relied upon as such. Accordingly, Reuters Ltd
accepts no liability whatsoever to the people or organizations attending this
presentation, or to any third party, in connection with the information contained in,
or any opinion set out or inferred or implied in, this presentation. This presentation
does not purport to make any recommendation or provide investment advice to
the effect that any gold related transaction is appropriate for all investment
objectives, financial situations or particular needs. Prior to making any investment
decisions investors should seek advice from their advisers on whether any part of
this presentation is appropriate to their specific circumstances. This presentation
is not, and should not be construed as, an offer or solicitation to buy or sell silver
or any other metal. Expressions of opinion are those of Reuters Ltd only and are
subject to change without notice.