TRICAN WELL SERVICE LTD. Q2 2019 INTERIM REPORT 2019 -FS (FINAL).pdfTRICAN WELL SERVICE LTD. Q2 2019...
20
TRICAN WELL SERVICE LTD. Q2 2019 INTERIM REPORT Condensed Consolidated Interim Financial Statements Three and Six Months Ended June 30, 2019 and 2018 (Unaudited)
Transcript of TRICAN WELL SERVICE LTD. Q2 2019 INTERIM REPORT 2019 -FS (FINAL).pdfTRICAN WELL SERVICE LTD. Q2 2019...

TRICAN WELL SERVICE LTD.
Q2 2019 INTERIM REPORT
Condensed Consolidated Interim Financial Statements
Three and Six Months Ended June 30, 2019 and 2018
(Unaudited)

Page left intentionally blank.

Trican Well Service Ltd.
Q2 2019 Interim Report | 3
TABLE OF CONTENTS
CONDENSED CONSOLIDATED INTERIM STATEMENTS OF FINANCIAL POSITION .........................................................................................................4
CONDENSED CONSOLIDATED INTERIM STATEMENTS OF COMPREHENSIVE LOSS .....................................................................................................5
CONDENSED CONSOLIDATED INTERIM STATEMENTS OF CHANGES IN EQUITY ..........................................................................................................6
CONDENSED CONSOLIDATED INTERIM STATEMENTS OF CASH FLOWS...........................................................................................................................7
NOTES TO THE CONDENSED CONSOLIDATED INTERIM FINANCIAL STATEMENTS .....................................................................................................9
Note 1 - Nature of Business and Basis of Preparation ....................................................................................................................................................................................9
Note 2 - Critical Accounting Estimates and Judgments ..............................................................................................................................................................................9
Note 3 - Changes in Signifi cant Accounting Policies.....................................................................................................................................................................................9
Note 4 - Right-of-Use Assets and Lease Liabilities .........................................................................................................................................................................................11
Note 5 - Loans and Borrowings ................................................................................................................................................................................................................................12
Note 6 - Share Capital .....................................................................................................................................................................................................................................................13
Note 7 - Earnings / (Loss) Per Share ........................................................................................................................................................................................................................14
Note 8 - Share-Based Payments ...............................................................................................................................................................................................................................14
Note 9 - Cost of Sales and Administrative Expenses ...................................................................................................................................................................................16
Note 10 - Income Taxes..................................................................................................................................................................................................................................................17
Note 11 - Financial Instruments ................................................................................................................................................................................................................................17
Note 12 - Other Commitments and Contingencies .....................................................................................................................................................................................18
Note 13 - Subsequent Events .....................................................................................................................................................................................................................................18

Trican Well Service Ltd.
4 | Q2 2019 Interim Report
CONDENSED CONSOLIDATED INTERIM STATEMENTS OF FINANCIAL POSITION
(Stated in thousands; unaudited) June 30, 2019 December 31, 2018
ASSETS
Current assets
Cash and cash equivalents $24,473 $8,246
Trade and other receivables 98,224 140,417
Current tax assets 2,189 2,364
Inventory 33,181 36,261
Prepaid expenses 6,846 11,008
Assets held for sale - 3,247
164,913 201,543
Property and equipment 601,006 660,395
Intangible assets 39,644 44,872
Right-of-use assets (note 3, 4) 22,504 -
Goodwill 131,000 131,000
$959,067 $1,037,810
LIABILITIES AND SHAREHOLDERS’ EQUITY
Current liabilities
Trade and other payables $87,069 $85,833
Current portion of lease liabilities (note 3, 4) 5,350 -
92,419 85,833
Lease liabilities - non-current portion (note 3, 4 18,126 -
Loans and borrowings (note 5) 11,981 45,910
Deferred tax liabilities 42,049 61,925
Shareholders’ equity
Share capital (note 6) 1,054,430 1,099,352
Contributed surplus 85,953 83,615
Accumulated other comprehensive loss (481) (1,111)
Defi cit (345,410) (337,714)
Total equity attributable to equity holders of the Company 794,492 844,142
$959,067 $1,037,810
See accompanying notes to the condensed consolidated interim fi nancial statements.
Trican Well Service Ltd.
Q2 2019 Interim Report | 5
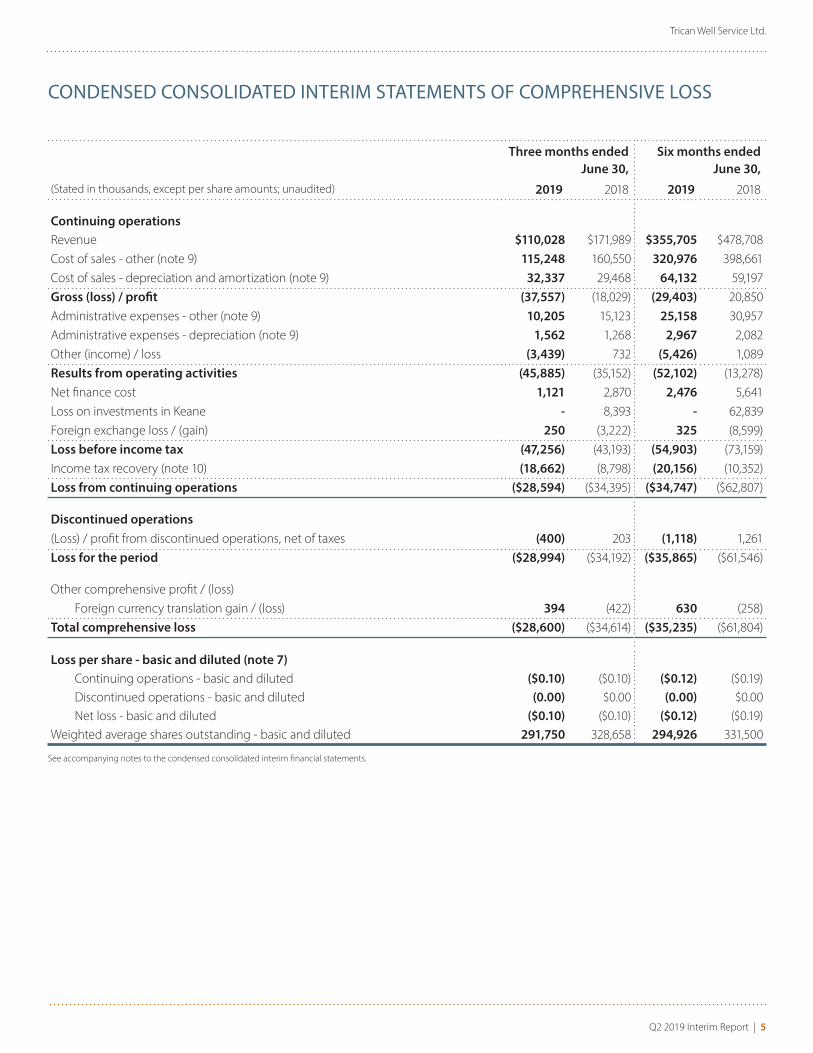
CONDENSED CONSOLIDATED INTERIM STATEMENTS OF COMPREHENSIVE LOSS
Three months ended
June 30,
Six months ended
June 30,
(Stated in thousands, except per share amounts; unaudited) 2019 2018 2019 2018
Continuing operations
Revenue $110,028 $171,989 $355,705 $478,708
Cost of sales - other (note 9) 115,248 160,550 320,976 398,661
Cost of sales - depreciation and amortization (note 9) 32,337 29,468 64,132 59,197
Gross (loss) / profi t (37,557) (18,029) (29,403) 20,850
Administrative expenses - other (note 9) 10,205 15,123 25,158 30,957
Administrative expenses - depreciation (note 9) 1,562 1,268 2,967 2,082
Other (income) / loss (3,439) 732 (5,426) 1,089
Results from operating activities (45,885) (35,152) (52,102) (13,278)
Net fi nance cost 1,121 2,870 2,476 5,641
Loss on investments in Keane - 8,393 - 62,839
Foreign exchange loss / (gain) 250 (3,222) 325 (8,599)
Loss before income tax (47,256) (43,193) (54,903) (73,159)
Income tax recovery (note 10) (18,662) (8,798) (20,156) (10,352)
Loss from continuing operations ($28,594) ($34,395) ($34,747) ($62,807)
Discontinued operations
(Loss) / profi t from discontinued operations, net of taxes (400) 203 (1,118) 1,261
Loss for the period ($28,994) ($34,192) ($35,865) ($61,546)
Other comprehensive profi t / (loss)
Foreign currency translation gain / (loss) 394 (422) 630 (258)
Total comprehensive loss ($28,600) ($34,614) ($35,235) ($61,804)
Loss per share - basic and diluted (note 7)
Continuing operations - basic and diluted ($0.10) ($0.10) ($0.12) ($0.19)
Discontinued operations - basic and diluted (0.00) $0.00 (0.00) $0.00
Net loss - basic and diluted ($0.10) ($0.10) ($0.12) ($0.19)
Weighted average shares outstanding - basic and diluted 291,750 328,658 294,926 331,500
See accompanying notes to the condensed consolidated interim fi nancial statements.

Trican Well Service Ltd.
6 | Q2 2019 Interim Report
CONDENSED CONSOLIDATED INTERIM STATEMENTS OF CHANGES IN EQUITY
(Stated in thousands; unaudited)
Share
capital
Contributed
surplus
Accumulated
other
comprehensive
income / (loss) Defi cit
Total
Equity
Balance at January 1, 2018 $1,236,618 $78,629 $36,222 ($175,421) $1,176,048
Adoption of IFRS 9 on January 1, 2018 - - (36,419) 36,419 $-
Loss for the period - - - (61,546) ($61,546)
Foreign currency translation loss - - (258) - ($258)
Share-based compensation expense - 3,017 - - $3,017
Share options exercised 991 (342) - - $649
Shares cancelled under Normal Course Issuer Bid (45,553) - - 1,816 ($43,737)
Balance at June 30, 2018 $1,192,056 $81,304 ($455) ($198,732) $1,074,173
Balance at January 1, 2019 $1,099,352 $83,615 ($1,111) ($337,714) $844,142
Loss for the period - - - (35,865) (35,865)
Foreign currency translation gain - - 630 - 630
Share-based compensation expense - 2,358 - - 2,358
Share options exercised 71 (20) - - 51
Shares cancelled under Normal Course Issuer Bid (44,993) - - 28,169 (16,824)
Balance at June 30, 2019 $1,054,430 $85,953 ($481) ($345,410) $794,492
See accompanying notes to the condensed consolidated interim fi nancial statements.

Trican Well Service Ltd.
Q2 2019 Interim Report | 7
CONDENSED CONSOLIDATED INTERIM STATEMENTS OF CASH FLOWS
Three months ended June 30, Six months ended June 30,
(Stated in thousands; unaudited) 2019 2018 2019 2018Cash provided by / (used in):
Operations
Loss from continuing operations ($28,594) ($34,395) ($34,747) ($62,807)
Charges to income not involving cash:
Depreciation and amortization 33,899 30,736 67,099 61,279
Share-based compensation 1,077 1,623 2,358 3,016
(Gain) / loss on disposal of property and equipment (3,105) 1,062 (4,622) 1,069
Finance costs / amortization of debt issuance costs 1,121 3,464 2,476 6,918
Unrealized foreign exchange gain 572 4,997 453 1,001
Realized gain on Keane - - - (21,083)
Unrealized loss on investments in Keane - 8,393 - 83,922
Tax recovery (18,662) (8,798) (20,156) (10,352)
Change in inventories (2,849) (3,463) 3,111 1,114
Change in trade and other receivables 112,246 82,061 42,190 44,404
Change in prepaid expenses 1,696 (2,235) 4,164 (15,238)
Change in trade and other payables (35,169) (30,363) 5,420 (33,747)
Interest paid (1,121) (5,395) (2,476) (6,614)
Income tax received / (paid) 324 (2,622) 542 (11,245)
Continuing operations $61,435 $45,065 $65,812 $41,637
Discontinued operations (608) 582 (1,464) 465
Cash fl ow from operating activities $60,827 $45,647 $64,348 $42,102
Investing
Purchase of property and equipment (6,156) (15,742) (18,869) (28,507)
Proceeds from the sale of property and equipment 12,527 7,388 17,008 12,621
Proceeds from investment in Keane - - - 33,592
Insurance recovery - - - 6,141
Net change in non-cash working capital - 5,000 - (1,141)
Continuing operations $6,371 ($3,354) ($1,861) $22,706
Discontinued operations - - - -
Cash fl ow from / (used in) investing activities $6,371 ($3,354) ($1,861) $22,706
Financing
Net proceeds from issuance of share capital 10 512 51 649
Repayment of Revolving Credit Facility (45,000) (17,000) (27,283) (18,000)
Net proceeds from settlement of currency derivatives - 17,066 - 17,066
Repayment of senior notes - (20,684) - (20,882)
Payment of lease (1,389) (1,058) (2,722) (1,910)
Repurchase and cancellation of shares under NCIB (7,231) (14,920) (16,824) (43,737)
Continuing operations ($53,610) ($36,084) ($46,778) ($66,814)
Discontinued operations - - - -
Cash fl ow used in fi nancing activities ($53,610) ($36,084) ($46,778) ($66,814)
Eff ect of exchange rate changes on cash 282 - 518 707
Increase of cash and cash equivalents
Continuing operations 14,196 6,293 17,173 (2,471)
Discontinued operations (326) 582 (946) 1,172
Cash and cash equivalents, beginning of period 10,603 4,565 8,246 12,739
Cash and cash equivalents, end of period $24,473 $11,440 $24,473 $11,440
See accompanying notes to the condensed consolidated interim fi nancial statements.

NOTES TO THE CONDENSED CONSOLIDATED
INTERIM FINANCIAL STATEMENTS (UNAUDITED)
For the Three and Six Months Ended June 30, 2019 and 2018

Trican Well Service Ltd.
Q2 2019 Interim Report | 9
NOTE 1 – NATURE OF BUSINESS AND BASIS OF PREPARATIONNature of Business
Trican Well Service Ltd. (the “Company” or “Trican”) is an oilfi eld services company incorporated under the laws of the
province of Alberta. These condensed consolidated interim fi nancial statements include the accounts of the Company
and its subsidiaries, all of which are wholly owned. The Company provides a comprehensive array of specialized products,
equipment, services and technology for use in the drilling, completion, stimulation and reworking of oil and gas wells
primarily through its continuing pressure pumping operations in Canada. The Company’s head offi ce is Suite 2900, 645 – 7th
Avenue S.W., Calgary, Alberta, T2P 4G8.
Basis of Presentation
These condensed consolidated interim fi nancial statements for the three and six months period ended June 30, 2019,
have been prepared in accordance with IAS 34 Interim Financial Reporting. They do not include all disclosures that would
otherwise be required in a complete set of fi nancial statements and should be read in conjunction with the Company’s 2018
consolidated annual fi nancial statements which have been prepared in accordance with International Financial Reporting
Standards (“IFRS”) as issued by the International Accounting Standards Board (“IASB”). These condensed consolidated interim
fi nancial statements follow the same policies as in the Company’s 2018 consolidated annual fi nancial statements except as
noted below.
The condensed consolidated interim fi nancial statements are presented in Canadian dollars and have been rounded to the
nearest thousands, except where indicated. Certain fi gures have been reclassifi ed to conform to the current presentation of
these fi nancial statements. Changes to signifi cant accounting policies are described in note 3.
These condensed consolidated interim fi nancial statements were authorized for issue by the Board of Directors on July 31,
2019.
NOTE 2 - CRITICAL ACCOUNTING ESTIMATES AND JUDGMENTSThe preparation of the condensed consolidated interim fi nancial statements in compliance with IAS 34 requires
management to make certain critical accounting estimates. It also requires management to exercise judgment in applying
the Company's accounting policies. The areas where signifi cant judgment and estimates have been made in preparing the
fi nancial statements and their eff ect are disclosed in Note 1 of the Company's 2018 consolidated annual fi nancial statement.
NOTE 3 - CHANGES IN SIGNIFICANT ACCOUNTING POLICIESNew Accounting Policies
IFRS 16 Leases
Trican has adopted IFRS 16 - Leases eff ective January 1, 2019. The new standard requires lessees to recognize assets and
liabilities for most leases on their statements of fi nancial position under a single accounting model for all leases based on a
“right-of-use”. The Company applied IFRS 16 using the modifi ed retrospective approach, whereby the incremental increase
to right-of-use assets and lease obligations was $15.9 million in respect to property leases. The Company had pre-existing
vehicle fi nance lease assets and liabilities of $10.2 million. The right-of-use assets recognized were measured at amounts
equal to the lease obligation.
NOTES TO THE CONDENSED CONSOLIDATED INTERIM FINANCIAL STATEMENTS (UNAUDITED)For the three and six months ended June 30, 2019 and 2018

Trican Well Service Ltd.
10 | Q2 2019 Interim Report
Comparative information in the Company’s condensed consolidated interim statements of fi nancial position, condensed
consolidated interim statements of comprehensive loss, condensed consolidated interim statement of changes in equity and
condensed consolidated interim statements of cash fl ows are not restated. The impact of the adoption of IFRS 16 - Leases to
the condensed consolidated statements of fi nancial position is disclosed in the table below:
The right-of-use assets and lease obligations recognized consist of property and vehicle leases. The weighted average
incremental borrowing rate used to determine the lease obligation at adoption is approximately 7%.
The Company used the following practical expedients when applying IFRS 16 to leases previously classifi ed as operating
leases under IAS 17:
Applied the exemption not to recognize right-of-use assets and liabilities for leases with less than 12 months of lease
term.
Applied the exemption not to recognize right-of-use assets and liabilities for low-value leases. The Company recognizes
the lease payments associated with these leases as an expense on a straight line basis over the lease term.
As at December 31, 2018, the Company had an existing lease obligation of $10.2 million. The total current and non-current
lease liability recognized on January 1, 2019 of $26.1 million represented an increase of $15.9 million from the Company's pre-
existing fi nance leases under IAS 17. The total exemption recognized for low-value and short-term leases at adoption was
$0.5 million. The impact of the adoption of IFRS 16 - Leases to the commitments is described in the table below:
(Stated in thousands)
Reported as at
Dec. 31, 2018
Incremental lease
under IFRS 16
Pre-existing lease
adjustments (1)
Restated as at
January 1, 2019
Property and equipment $660,395 $- ($10,187) $650,208
Right-of-use assets - 15,928 10,187 26,115
Trade and other payables (85,833) - 3,385 (82,448)
Current portion of lease liabilities - (2,242) (3,385) (5,627)
Lease liabilities - non-current portion - (13,686) (6,802) (20,488)
Loans and borrowings (39,108) - 6,802 (32,306)
Total $535,454 $- $- $535,454
1) Recategorized previous fi nance leases under IAS 17.
(Stated in thousands) January 1, 2019
Operating lease commitment at December 31, 2018 20,835
Finance lease commitment at December 31, 2018 11,008
Less: Discounted using the incremental borrowing rate at January 1, 2019 (5,728)
Lease liabilities recognized at January 1, 2019 26,115
Accounting Policy
The Company recognizes a right-of-use asset and lease liability at the lease commencement date. The right-of-use asset is
initially measured at cost, and subsequently at cost less any accumulated depreciation and impairment losses and adjusted
for certain measurements of the lease liability.
The lease liability is initially measured at the present value of the lease payments that are not paid at commencement of the
lease, discounted using the interest rate implicit in the lease or, if that rate cannot be readily determined, at the Company’s
incremental borrowing rate. Payments are applied against the lease obligation and interest expense is recognized on the
lease obligations using the eff ective interest method.

Trican Well Service Ltd.
Q2 2019 Interim Report | 11
The Company applies judgment to determine the lease term for some lease contracts which include renewal options. The
assessment of whether the Company is reasonably certain to exercise such options impacts the lease term, which may
signifi cantly aff ect the amount of lease liabilities and right-of-use assets recognized. The Company does not recognize short-
term leases with a term of 12 months or less, or leases of low-value assets.
NOTE 4 - RIGHT-OF-USE ASSETS AND LEASE LIABILITIES
(Stated in thousands) Property (1) Vehicles (2) Total
Cost
Balance, January 1, 2019 $15,928 $17,314 $33,242
Additions 251 - 251
Termination of Leases - (1,393) (1,393)
Balance at June 30, 2019 $16,179 $15,921 $32,100
Accumulated Depreciation
Balance, January 1, 2019 $- $7,127 $7,127
Depreciation 1,871 1,702 3,573
Termination of leases - (1,104) (1,104)
Balance at June 30, 2019 $1,871 $7,725 $9,596
Carrying Amounts
At January 1, 2019 $15,928 $10,187 $26,115
At June 30, 2019 $14,308 $8,196 $22,504
1) Incremental lease per IFRS 16 (note 3).
2) Recategorized previous fi nance leases under IAS 17 (note 3).
The Company incurs lease payments related to properties and vehicles. Leases are entered into and exited in coordination
with specifi c business requirements which includes the assessment of the appropriate durations for the related leased assets.
The Company has recognized lease liabilities in relation to all lease arrangements measured at the present value of the
remaining lease payments at an incremental borrowing rate of approximately 7%.
The Company has the following future commitments associated with its lease obligations:
(Stated in thousands) As at June 30, 2019
Less than 1 year $6,813
1 - 3 years 11,476
4 - 5 years 4,526
After 5 years 5,709
Total lease payments 28,524
Amounts representing interest over the term of the lease (5,048)
Present value of net lease payments 23,476
Current portion of lease liabilities (5,350)
Non-current portion of lease liabilities $18,126

Trican Well Service Ltd.
12 | Q2 2019 Interim Report
For the six-month period ended June 30, 2019, cash fl ow used of $2.7 million relate to the principal component of lease
payments, interest expense of $0.9 million and an incremental increase of $1.9 million to depreciation was recognized in
relation to the Company’s lease obligations.
Short-term leases with a lease term of twelve months or less and low-value assets are expensed in the condensed
consolidated interim statements of comprehensive loss.
NOTE 5 - LOANS AND BORROWINGS
(Stated in thousands) As at June 30, 2019 As at December 31, 2018RCF, net of transaction costs $11,981 $39,108
Finance lease obligations - 10,187
Total $11,981 $49,295
Current portion of fi nance lease obligations (1) - 3,385
Non-current $11,981 $45,910
1) Amount previously included in Trade and other payables.
Revolving Credit Facility ("RCF")
On December 6, 2018, as a part of an overall restructuring of the Company's credit facilities, Trican entered into an agreement
with its RCF providers which amends and extends its RCF ("Amended RCF").
The Amended RCF matures December 5, 2021, a date that may be extended on an annual basis upon agreement of the
RCF lenders, and the Company may draw up to $275.0 million (December 31, 2018 – $275.0 million). The Amended RCF has
a general security charge against the assets of the Company and bears interest at the applicable Canadian prime rate, U.S.
prime rate, Banker’s Acceptance rate, or at LIBOR, plus 45 to 300 basis points (December 31, 2018 – Canadian prime rate, U.S.
prime rate, Banker’s Acceptance rate, or at LIBOR, plus 45 to 300 basis points). At June 30, 2019, the undrawn amount of the
RCF is $262.0 million (December 31, 2018 – $235.0 million) of which $256.8 million is accessible (December 31, 2018 – $229.1
million accessible) due to the Company’s Letters of Credit and amounts drawn on the Canadian dollar swing line as at June
30, 2019.
As at June 30, 2019, Trican had a $10 million (December 31, 2018 – $10 million) Letter of Credit facility with its syndicate of
banks included in the $275.0 million amended RCF described above. As at June 30, 2019, Trican had $2.1 million in letters of
credit outstanding (December 31, 2018 – $2.1 million).
Covenants
The Company is required to comply with covenants that are applicable to the Amended RCF. Trican is required to comply
with the following leverage and interest coverage ratio covenants, based on the last twelve-month calculation basis:
Leverage Ratio <3.5x
Interest Coverage Ratio >2.5x
Certain non-cash expenses (including depreciation, amortization, impairment expenses, equity-settled stock based
compensation), gains and losses resulting from Investments in Keane, personnel based expenses (such as severance) and
certain other items, are permitted to be adjusted to EBITDA to arrive at bank EBITDA for covenant calculation purposes. In
accordance with the defi nition under the Amended RCF, the covenant calculation excludes the impact of leases recognized
under IFRS 16.
Trican Well Service Ltd.
Q2 2019 Interim Report | 13
(Stated in thousands) June 30, 2019 Dec. 31, 2018
Senior Net Debt $- $45,224
Bank EBITDA 71,568 114,103
Leverage Ratio 0.0 0.4
(Stated in thousands) June 30, 2019 Dec. 31, 2018
Interest Expense $5,338 $7,297
Bank EBITDA 71,568 114,103
Interest Coverage Ratio 13.4 15.6
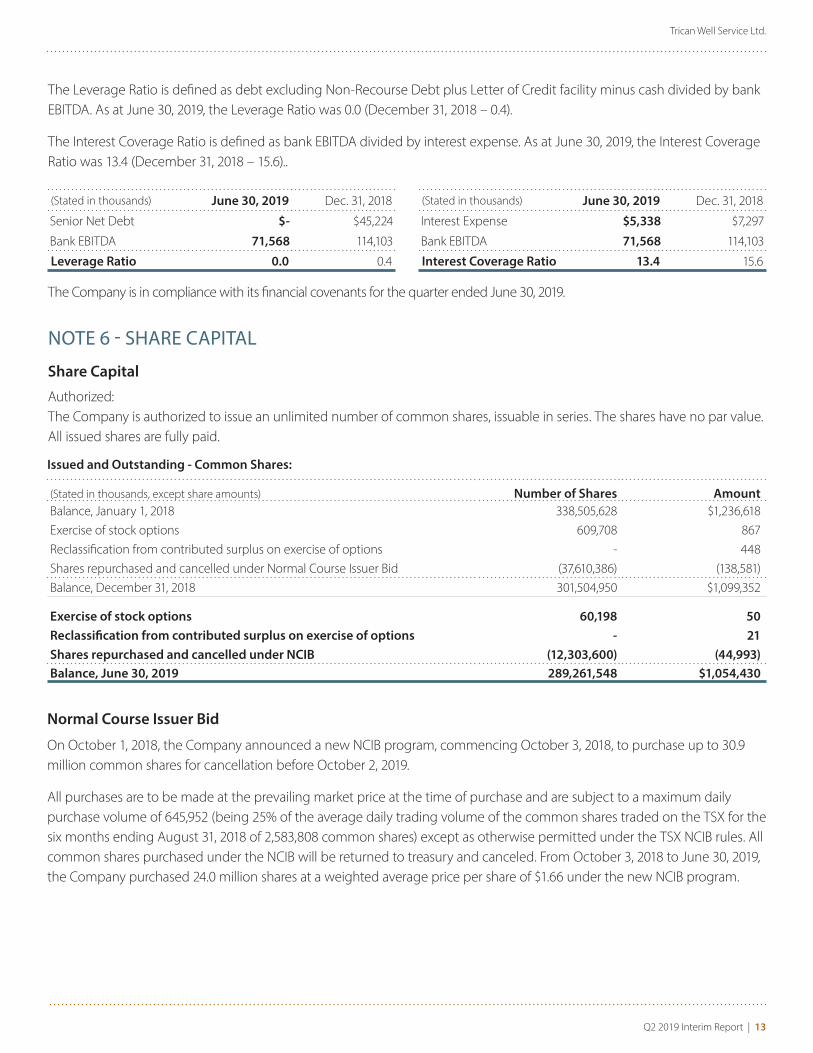
The Leverage Ratio is defi ned as debt excluding Non-Recourse Debt plus Letter of Credit facility minus cash divided by bank
EBITDA. As at June 30, 2019, the Leverage Ratio was 0.0 (December 31, 2018 – 0.4).
The Interest Coverage Ratio is defi ned as bank EBITDA divided by interest expense. As at June 30, 2019, the Interest Coverage
Ratio was 13.4 (December 31, 2018 – 15.6)..
The Company is in compliance with its fi nancial covenants for the quarter ended June 30, 2019.
NOTE 6 - SHARE CAPITAL
Share Capital
Authorized:
The Company is authorized to issue an unlimited number of common shares, issuable in series. The shares have no par value.
All issued shares are fully paid.
Issued and Outstanding - Common Shares:
(Stated in thousands, except share amounts) Number of Shares Amount
Balance, January 1, 2018 338,505,628 $1,236,618
Exercise of stock options 609,708 867
Reclassifi cation from contributed surplus on exercise of options - 448
Shares repurchased and cancelled under Normal Course Issuer Bid (37,610,386) (138,581)
Balance, December 31, 2018 301,504,950 $1,099,352
Exercise of stock options 60,198 50
Reclassifi cation from contributed surplus on exercise of options - 21
Shares repurchased and cancelled under NCIB (12,303,600) (44,993)
Balance, June 30, 2019 289,261,548 $1,054,430
Normal Course Issuer Bid
On October 1, 2018, the Company announced a new NCIB program, commencing October 3, 2018, to purchase up to 30.9
million common shares for cancellation before October 2, 2019.
All purchases are to be made at the prevailing market price at the time of purchase and are subject to a maximum daily
purchase volume of 645,952 (being 25% of the average daily trading volume of the common shares traded on the TSX for the
six months ending August 31, 2018 of 2,583,808 common shares) except as otherwise permitted under the TSX NCIB rules. All
common shares purchased under the NCIB will be returned to treasury and canceled. From October 3, 2018 to June 30, 2019,
the Company purchased 24.0 million shares at a weighted average price per share of $1.66 under the new NCIB program.

Trican Well Service Ltd.
14 | Q2 2019 Interim Report
Three months ended June 30, Six months ended June 30,
(Stated in thousands, except share and per share amounts) 2019 2018 2019 2018
Basic & diluted weighted average number of common shares 291,749,806 328,658,084 294,926,282 331,499,921
Attributable to Owners of the Company 2019 2018 2019 2018
Loss from continuing operations ($28,594) ($34,395) ($34,747) ($62,807)
Per share - basic and diluted ($0.10) ($0.10) ($0.12) ($0.19)
Loss from discontinued operations ($400) $203 ($1,118) $1,261
Per share - basic and diluted (0.00) $0.00 (0.00) $0.00
Loss for the period ($28,994) ($34,192) ($35,865) ($61,546)
Per share - basic and diluted ($0.10) ($0.10) ($0.12) ($0.19)
Three months ended June 30, Six months ended June 30,
(Stated in thousands) 2019 2018 2019 2018
Cash-settled share-based compensation expense
Expense / (recovery) arising from DSUs ($118) $8 $669 ($784)
Expense / (recovery) arising from RSUs (83) 33 (85) (121)
Expense / (recovery) arising from PSUs (79) (22) 372 (140)
Total expense / (recovery) cash-settled share-based
compensation expense ($280) $19 $956 ($1,045)
Equity-settled share-based compensation expense
Stock Options 1,077 1,624 2,358 3,017
Total expense / (recovery) equity-settled share-based
compensation expense $1,077 $1,624 $2,358 $3,017
Total expense / (recovery) share-based compensation
expense $797 $1,643 $3,314 $1,972
Three months ended June 30, Six months ended June 30,
(Stated in thousands, except share and per share amounts) 2019 2018 2019 2018
Number of common shares repurchased 5,262,000 4,634,700 12,303,600 12,415,800
Weighted average price per share $1.37 $3.22 $1.37 $3.52
Amount of repurchase (1) $7,231 $14,920- $16,824 $43,737
1) Includes brokerage fees.
For the period from July 1, 2019 to July 31, 2019, the Company purchased and canceled 786,600 common shares at a
weighted average price per share of $1.06 pursuant to its NCIB.
NOTE 7 - EARNINGS / (LOSS) PER SHARE
For the three and six months ended June 30, 2019 and 2018, all shares issued under the stock option plan were excluded in
calculating the weighted average number of diluted shares outstanding as they were considered anti-dilutive as there was a
net loss during the period.
NOTE 8 - SHARE-BASED PAYMENTSThe Company has four shared-based compensation plans as described in the Notes to the Consolidated Financial
Statements for the year ended December 31, 2018.
Trican Well Service Ltd.
Q2 2019 Interim Report | 15
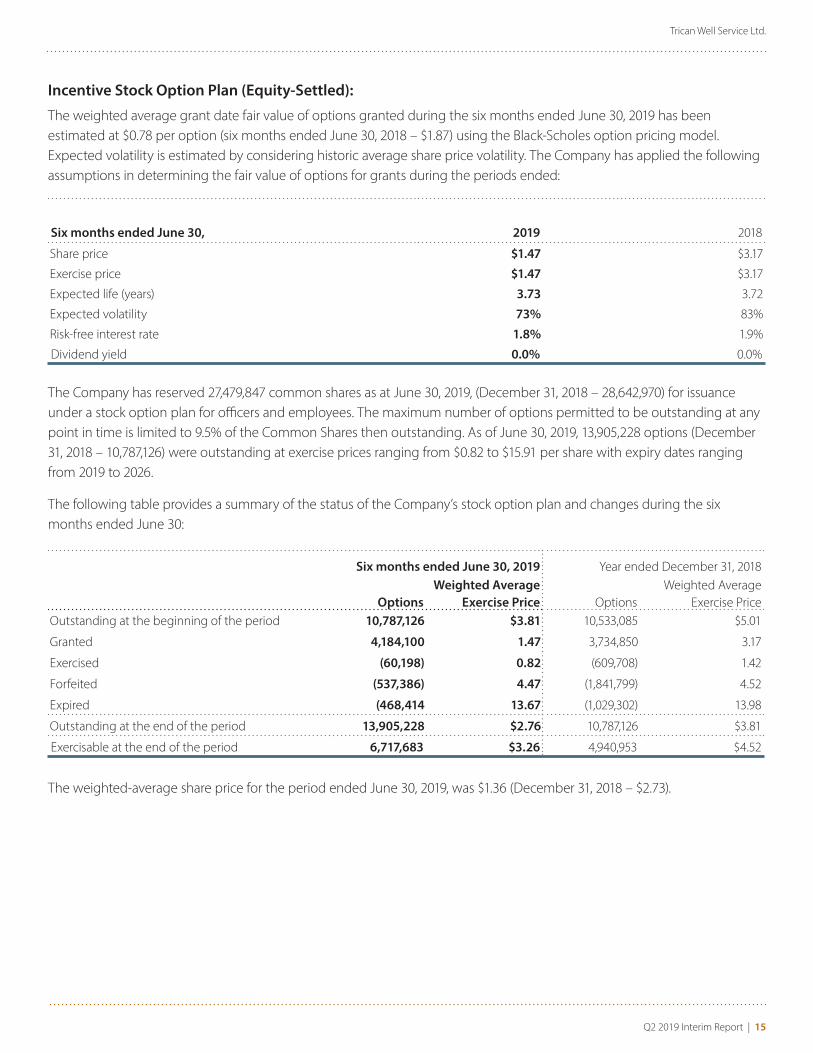
Incentive Stock Option Plan (Equity-Settled):
The weighted average grant date fair value of options granted during the six months ended June 30, 2019 has been
estimated at $0.78 per option (six months ended June 30, 2018 – $1.87) using the Black-Scholes option pricing model.
Expected volatility is estimated by considering historic average share price volatility. The Company has applied the following
assumptions in determining the fair value of options for grants during the periods ended:
The Company has reserved 27,479,847 common shares as at June 30, 2019, (December 31, 2018 – 28,642,970) for issuance
under a stock option plan for offi cers and employees. The maximum number of options permitted to be outstanding at any
point in time is limited to 9.5% of the Common Shares then outstanding. As of June 30, 2019, 13,905,228 options (December
31, 2018 – 10,787,126) were outstanding at exercise prices ranging from $0.82 to $15.91 per share with expiry dates ranging
from 2019 to 2026.
The following table provides a summary of the status of the Company’s stock option plan and changes during the six
months ended June 30:
Six months ended June 30, 2019 2018
Share price $1.47 $3.17
Exercise price $1.47 $3.17
Expected life (years) 3.73 3.72
Expected volatility 73% 83%
Risk-free interest rate 1.8% 1.9%
Dividend yield 0.0% 0.0%
Six months ended June 30, 2019 Year ended December 31, 2018
Options
Weighted Average
Exercise Price Options
Weighted Average
Exercise Price
Outstanding at the beginning of the period 10,787,126 $3.81 10,533,085 $5.01
Granted 4,184,100 1.47 3,734,850 3.17
Exercised (60,198) 0.82 (609,708) 1.42
Forfeited (537,386) 4.47 (1,841,799) 4.52
Expired (468,414 13.67 (1,029,302) 13.98
Outstanding at the end of the period 13,905,228 $2.76 10,787,126 $3.81
Exercisable at the end of the period 6,717,683 $3.26 4,940,953 $4.52
The weighted-average share price for the period ended June 30, 2019, was $1.36 (December 31, 2018 – $2.73).

Trican Well Service Ltd.
16 | Q2 2019 Interim Report
(Units) DSU RSU PSU
Balance, January 1, 2018 1,399,002 424,566 920,200
Granted 198,847 - 611,700
Exercised - (99,003) (296,700)
Forfeited - (167,894) -
Balance, December 31, 2018 1,597,849 157,669 1,235,200
Granted 345,015 - 1,187,000
Exercised - (84,004) (217,700)
Forfeited - (11,165) -
Balance, June 30, 2019 1,942,864 62,500 2,204,500
Vested at June 30, 2019 1,942,864 109,637 -
The following table summarizes information about stock options outstanding at June 30, 2019:
Options Outstanding Options Exercisable
Range of Exercise PricesNumber
Outstanding
Weighted Average
Remaining Life
Weighted Average
Exercise Price
Number
Exercisable
Weighted Average
Exercise Price
$0.00 to $1.00 1,366,963 1.26 $0.82 1,366,963 $0.82
$1.01 to $3.00 6,190,053 5.75 1.64 2,077,803 1.98
$3.01 to $10.00 5,909,450 5.25 3.45 2,834,155 3.54
$10.01 to $15.91 438,762 0.19 15.16 438,762 15.16
$0.00 to $15.91 13,905,228 4.92 $2.76 6,717,683 $3.26
Share Unit Plans (Cash-Settled)
The following table provides a summary of the status of the Company’s cash-settled compensation plans and changes
during the six months ended June 30, 2019:
The outstanding liabilities for cash-settled compensation plans at June 30, 2019, of $3.7 million (December 31, 2018 – $2.7
million) are included in accounts payable and accrued liabilities.
NOTE 9 - COST OF SALES AND ADMINISTRATIVE EXPENSESThe Company classifi es the consolidated statement of comprehensive loss using the function of expense method, which
presents expenses according to their function, such as cost of sales and administrative expenses. This method is more closely
aligned to the Company business structure and provides more relevant information to the public.

Trican Well Service Ltd.
Q2 2019 Interim Report | 17
(Stated in thousands) Three months ended June 30, Six months ended June 30,
Cost of sales 2019 2018 2019 2018
Personnel expenses $37,848 $57,263 $95,533 $125,189
Direct costs 77,400 103,287 225,443 273,472
Cost of sales - other $115,248 $160,550 $320,976 $398,661
Cost of sales - depreciation and amortization 32,337 29,468 64,132 59,197
$147,585 $190,018 $385,108 $457,858
(Stated in thousands)
Administrative expenses
Personnel expenses $6,838 $8,537 $17,635 $18,700
General and organizational expenses 3,333 6,896 7,211 12,443
Bad debt expense 34 (310) 312 (186)
Administrative expenses - other $10,205 $15,123 $25,158 $30,957
Administrative expenses - depreciation 1,562 1,268 2,967 2,082
$11,767 $16,391 $28,125 $33,039
The following table provides additional information on the nature of the expenses:
NOTE 10 - INCOME TAXES
Three months ended June 30, Six months ended June 30,
(Stated in thousands) 2019 2018 2019 2018
Current income tax expense / (recovery) ($280) $1,005 ($280) $3,717
Deferred income tax expense / (recovery) (18,382) (9,803) (19,876) (14,069)
Total tax expense / (recovery) from continuing operations ($18,662) ($8,798) ($20,156) ($10,352)
For the six months ended June 30, 2019, the deferred tax recovery includes $6.5 million attributable to the decrease in the
Alberta provincial income tax rate for the periods from July 1, 2019 to January 1, 2022, which reduces the provincial rate
to 11% eff ective July 1, 2019, and further reduces it by 1% on January 1st for the years 2020, 2021, and 2022, bringing the
provincial rate to 8%.
NOTE 11 - FINANCIAL INSTRUMENTSFair Values of Financial Assets and Liabilities
The fair values of cash and cash equivalents, trade and other receivables, and trade and other payables included in the
consolidated statement of fi nancial position approximate their carrying amount due to the short-term maturity of these
instruments.
The fair value of the Amended RCF and capital lease obligations was determined by calculating future cash fl ows, including
interest at current rates.
For the three and six month period ended June 30, 2019, two customers accounted for 36.7% and 16.7% respectively, of the
Company's revenue (year ended December 31, 2018 - two customers accounted for 25.7% of revenue).
Trican Well Service Ltd.
18 | Q2 2019 Interim Report
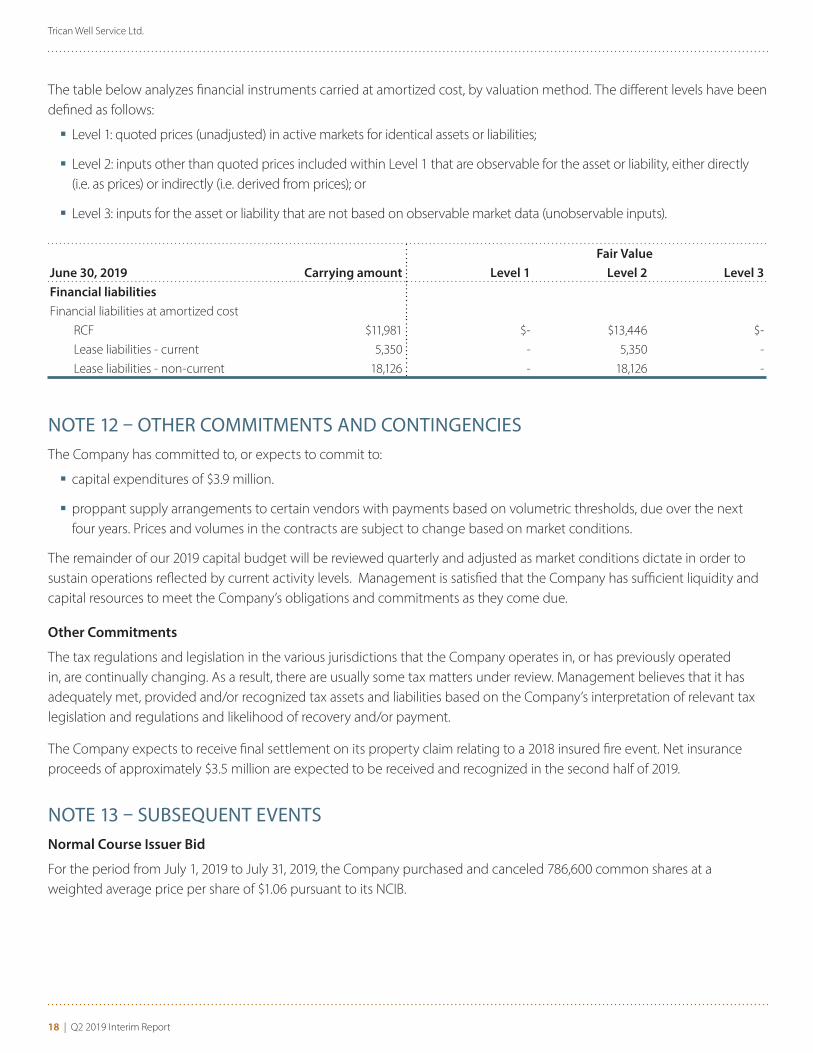
Fair Value
June 30, 2019 Carrying amount Level 1 Level 2 Level 3
Financial liabilities
Financial liabilities at amortized cost
RCF $11,981 $- $13,446 $-
Lease liabilities - current 5,350 - 5,350 -
Lease liabilities - non-current 18,126 - 18,126 -
The table below analyzes fi nancial instruments carried at amortized cost, by valuation method. The diff erent levels have been
defi ned as follows:
Level 1: quoted prices (unadjusted) in active markets for identical assets or liabilities;
Level 2: inputs other than quoted prices included within Level 1 that are observable for the asset or liability, either directly
(i.e. as prices) or indirectly (i.e. derived from prices); or
Level 3: inputs for the asset or liability that are not based on observable market data (unobservable inputs).
NOTE 12 – OTHER COMMITMENTS AND CONTINGENCIESThe Company has committed to, or expects to commit to:
capital expenditures of $3.9 million.
proppant supply arrangements to certain vendors with payments based on volumetric thresholds, due over the next
four years. Prices and volumes in the contracts are subject to change based on market conditions.
The remainder of our 2019 capital budget will be reviewed quarterly and adjusted as market conditions dictate in order to
sustain operations refl ected by current activity levels. Management is satisfi ed that the Company has suffi cient liquidity and
capital resources to meet the Company’s obligations and commitments as they come due.
Other Commitments
The tax regulations and legislation in the various jurisdictions that the Company operates in, or has previously operated
in, are continually changing. As a result, there are usually some tax matters under review. Management believes that it has
adequately met, provided and/or recognized tax assets and liabilities based on the Company’s interpretation of relevant tax
legislation and regulations and likelihood of recovery and/or payment.
The Company expects to receive fi nal settlement on its property claim relating to a 2018 insured fi re event. Net insurance
proceeds of approximately $3.5 million are expected to be received and recognized in the second half of 2019.
NOTE 13 – SUBSEQUENT EVENTSNormal Course Issuer Bid
For the period from July 1, 2019 to July 31, 2019, the Company purchased and canceled 786,600 common shares at a
weighted average price per share of $1.06 pursuant to its NCIB.

Page left intentionally blank.

BOARD OF DIRECTORS
Bradley P.D. Fedora (4)
Chairman
G. Allen Brooks (2, 3, 5)
President
G. Allen Brooks, LLC
Kevin L. Nugent (1, 3)
Independent Businessman
Alexander J. Pourbaix (2, 3)
President & Chief Executive Offi cer
Cenovus Energy Inc.
Deborah S. Stein (1, 2)
Independent Businesswoman
Michael B. Rapps (1, 4)
President, CEO & Director
Clarke Inc.
Dale M. Dusterhoft (4)
President & Chief Executive Offi cer
Trican Well Service Ltd.
OFFICERS
Dale M. Dusterhoft
President & Chief Executive Offi cer
Michael A. Baldwin, C.A.
Executive Vice President
Robert Skilnick
Chief Financial Offi cer
Robert J. Cox
Senior Vice President, Operations
Chika B. Onwuekwe
Vice President, Legal, General Counsel and
Corporate Secretary
(1) Member of the Audit Committee
(2) Member of the Human Resources and Compensation Committee
(3) Member of the Corporate Governance Committee
(4) Member of the Health, Safety and Environment Committee
(5) Lead Director
CORPORATE OFFICE
Trican Well Service Ltd.
2900, 645 – 7th Avenue S.W.
Calgary, Alberta T2P 4G8
Telephone: (403) 266-0202
Facsimile: (403) 237-7716
Website: www.TricanWellService.com
AUDITORS
KPMG LLP, Chartered Accountants
Calgary, Alberta
BANKERS
The Bank of Nova Scotia
Calgary, AB
REGISTRAR AND TRANSFER AGENT
Computershare Trust Company of Canada
Calgary, Alberta
STOCK EXCHANGE LISTING
The Toronto Stock Exchange
Trading Symbol: TCW
INVESTOR RELATIONS INFORMATION
Requests for information should be directed to:
Dale M. Dusterhoft
President & Chief Executive Offi cer
Robert Skilnick
Chief Financial Offi cer
CORPORATE INFORMATION