Interim Results Announcement Half Year ended 31 January ... · Half Year ended 31 January 2016 ....
32
1 Interim Results Announcement Half Year ended 31 January 2016 Highlights • Slower start to Agri-Services trading in seasonally quiet first half. • Highly adverse weather conditions combined with the current difficult market backdrop for primary producers resulting in increased seasonality and a more challenging trading environment. • Well established autumn and winter cropping base providing favourable platform for seasonally important second half. • Geographic extension of farm services distribution footprint following completion of acquisitions in Poland and Romania. All performing to expectation. • Initiating policy of semi-annual dividends with payment of interim dividend of 3.15 cent per share in April 2016. • Maintaining full year adjusted diluted EPS guidance of between 51 and 53 cent. 6 months ended 31 Jan 2016 €’000 6 months ended 31 Jan 2015 €’000 Change Revenue – Agri-Services 507,213 531,599 (4.6%) Group operating (loss)/profit - Operating (loss)/profit - Agri-Services* (1,790) 4,110 (143.6%) - Associates and joint venture** 1,476 6,284 (A) (76.5%) Total group operating (loss)/profit* (314) 10,394 (103.0%) Finance cost, net (3,769) (2,789) (A) (35.1%) (Loss)/profit before tax* (4,083) 7,605 (153.7%) Basic (loss)/earnings per share (cent) (5.24) 1.64 (419.5%) Adjusted diluted (loss)/earnings per share (cent)*** (2.47) 5.80 (142.6%) Group net debt**** 168,272 161,204 €7.1m Interim dividend per ordinary share (cent) 3.15 - 3.15c * Before amortisation of non-ERP intangible assets and exceptional items. ** Profit after interest and tax before amortisation of non-ERP intangible assets and before exceptional items. *** Before amortisation of non-ERP intangible assets, net of related deferred tax (2016: €3.5 million, 2015: €4.0 million) and exceptional items, net of tax (2016: €Nil, 2015: €1.3 million charge). **** Includes restricted cash of €2.9 million (2015: €Nil). (A) The Group’s 32 per cent interest in Valeo Foods Group (‘Valeo’) was disposed of in July 2015. The 2015 comparatives for ‘Associates and joint venture’ and ‘Finance cost, net’ reflect a full 6 month contribution from Valeo and 6 months interest receivable on the Group’s outstanding vendor loan note, respectively.
Transcript of Interim Results Announcement Half Year ended 31 January ... · Half Year ended 31 January 2016 ....

1
Interim Results Announcement Half Year ended 31 January 2016
Highlights • Slower start to Agri-Services trading in seasonally quiet first half. • Highly adverse weather conditions combined with the current difficult market backdrop for primary
producers resulting in increased seasonality and a more challenging trading environment. • Well established autumn and winter cropping base providing favourable platform for seasonally
important second half. • Geographic extension of farm services distribution footprint following completion of acquisitions in
Poland and Romania. All performing to expectation. • Initiating policy of semi-annual dividends with payment of interim dividend of 3.15 cent per share in
April 2016. • Maintaining full year adjusted diluted EPS guidance of between 51 and 53 cent.
6 months ended
31 Jan 2016 €’000
6 months ended 31 Jan 2015
€’000
Change
Revenue – Agri-Services
507,213
531,599
(4.6%)
Group operating (loss)/profit - Operating (loss)/profit - Agri-Services* (1,790) 4,110 (143.6%) - Associates and joint venture** 1,476 6,284 (A) (76.5%) Total group operating (loss)/profit* (314) 10,394 (103.0%) Finance cost, net (3,769) (2,789) (A) (35.1%) (Loss)/profit before tax* (4,083) 7,605 (153.7%) Basic (loss)/earnings per share (cent) (5.24) 1.64 (419.5%) Adjusted diluted (loss)/earnings per share (cent)*** (2.47) 5.80 (142.6%) Group net debt**** 168,272 161,204 €7.1m
Interim dividend per ordinary share (cent) 3.15 - 3.15c
* Before amortisation of non-ERP intangible assets and exceptional items. ** Profit after interest and tax before amortisation of non-ERP intangible assets and before exceptional items. *** Before amortisation of non-ERP intangible assets, net of related deferred tax (2016: €3.5 million, 2015: €4.0 million) and exceptional items, net of tax (2016: €Nil, 2015: €1.3 million charge). **** Includes restricted cash of €2.9 million (2015: €Nil). (A) The Group’s 32 per cent interest in Valeo Foods Group (‘Valeo’) was disposed of in July 2015. The 2015
comparatives for ‘Associates and joint venture’ and ‘Finance cost, net’ reflect a full 6 month contribution from Valeo and 6 months interest receivable on the Group’s outstanding vendor loan note, respectively.

2
Origin Enterprises plc Chief Executive Officer’s comment: Commenting on the announcement of the 2016 Interim Results, Origin Chief Executive Officer Tom O'Mahony said: “Trading for the seasonally quiet first half of the financial year has been both slow and challenging with the Group recording an operating loss of €1.8 million from Agri-Services. Highly adverse and unseasonal weather patterns have significantly limited in-field crop maintenance activity during the second quarter in particular. This, combined with weak farmer confidence reflecting the current pressures on primary producer incomes and cash flows, is expected to result in a greater concentration of service and input demand arising during the main application period in the second half of the financial year. The Central and Eastern European acquisition development completed during the period furthers our objective of building a coherent, scalable and geographically diverse farm services footprint. We are committed to extending the Group’s crop management systems and yield enhancement capabilities to positively influence the profitability and sustainability of the Group’s 30,000 plus farm customers. With the seasonally more important second half of the financial year to come and assuming normal weather patterns and no material adverse change in current exchange rates, the Group expects to achieve full year adjusted diluted earnings per share of between 51 and 53 cent. We will provide a further update on guidance at the time of the announcement of the Group’s third quarter trading update in May 2016.” ENDS
3
The 2016 Interim Results Announcement is available on the company website www.originenterprises.com. There will be a live conference call at 8.00am (GMT) today. To listen to this conference call, please dial the number below. Participants are requested to dial in 5 to 10 minutes prior to the scheduled start time.
Participant access numbers: Ireland: Tel: +353 (0)1 246 5602 UK/International: Tel: +44 (0)20 3427 1913 Confirmation Code: 4631182 Enquiries: Origin Enterprises plc Imelda Hurley Chief Financial Officer Tel: +353 (0)1 612 1259 Goodbody (ESM Adviser) Kevin Keating Tel: +353 (0)1 667 0420 Davy (Nominated Adviser) Anthony Farrell Tel: +353 (0)1 614 9993 Murray Consultants Joe Heron Tel: +353 (0)1 498 0315 Mobile: +353 (0)87 690 9735 10 March 2016
4
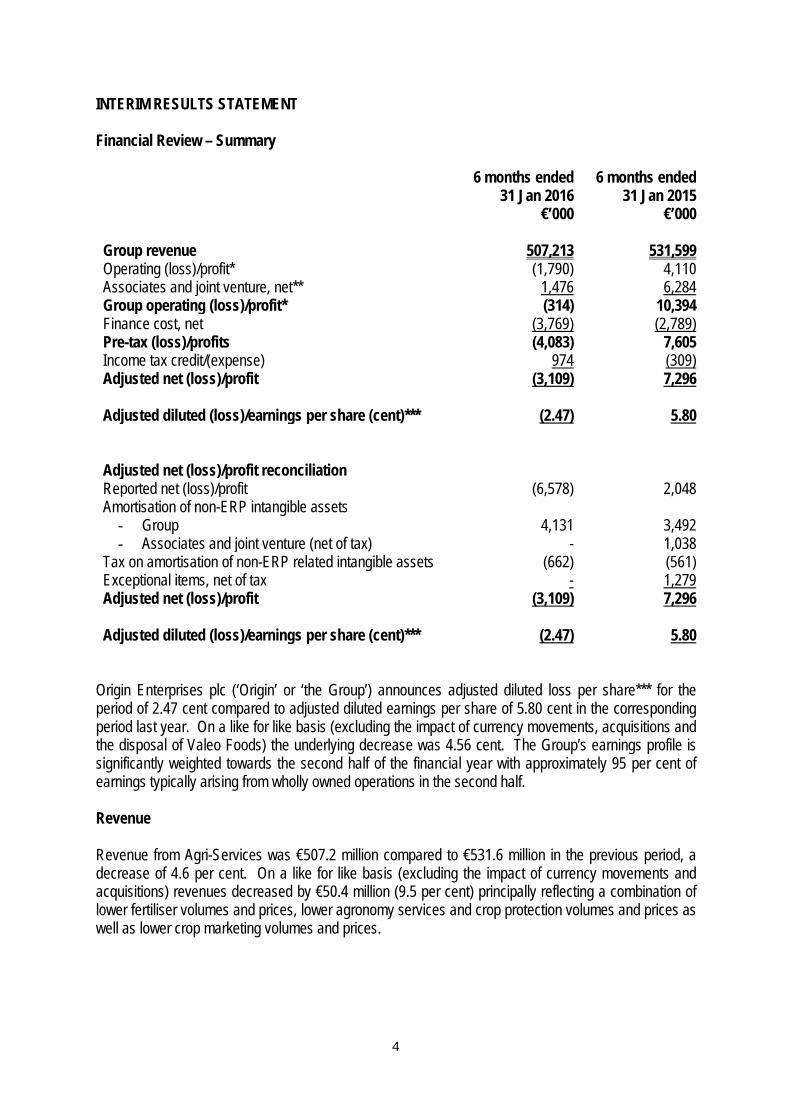
INTERIM RESULTS STATEMENT Financial Review – Summary 6 months ended
31 Jan 2016 €’000
6 months ended 31 Jan 2015
€’000 Group revenue 507,213 531,599 Operating (loss)/profit* (1,790) 4,110 Associates and joint venture, net** 1,476 6,284 Group operating (loss)/profit* (314) 10,394 Finance cost, net (3,769) (2,789) Pre-tax (loss)/profits (4,083) 7,605 Income tax credit/(expense) 974 (309) Adjusted net (loss)/profit (3,109) 7,296 Adjusted diluted (loss)/earnings per share (cent)*** (2.47) 5.80 Adjusted net (loss)/profit reconciliation Reported net (loss)/profit (6,578) 2,048 Amortisation of non-ERP intangible assets
- Group 4,131 3,492 - Associates and joint venture (net of tax) - 1,038
Tax on amortisation of non-ERP related intangible assets (662) (561) Exceptional items, net of tax - 1,279 Adjusted net (loss)/profit (3,109) 7,296 Adjusted diluted (loss)/earnings per share (cent)*** (2.47) 5.80
Origin Enterprises plc (‘Origin’ or ‘the Group’) announces adjusted diluted loss per share*** for the period of 2.47 cent compared to adjusted diluted earnings per share of 5.80 cent in the corresponding period last year. On a like for like basis (excluding the impact of currency movements, acquisitions and the disposal of Valeo Foods) the underlying decrease was 4.56 cent. The Group’s earnings profile is significantly weighted towards the second half of the financial year with approximately 95 per cent of earnings typically arising from wholly owned operations in the second half. Revenue Revenue from Agri-Services was €507.2 million compared to €531.6 million in the previous period, a decrease of 4.6 per cent. On a like for like basis (excluding the impact of currency movements and acquisitions) revenues decreased by €50.4 million (9.5 per cent) principally reflecting a combination of lower fertiliser volumes and prices, lower agronomy services and crop protection volumes and prices as well as lower crop marketing volumes and prices.
5
Operating result* Operating result* from the Agri-Services business was a loss of €1.8 million compared to a profit of €4.1 million in the previous period. On a like for like basis (excluding the impact of currency movements and acquisitions) the decrease year on year was €6.6 million. This decrease in profits in the seasonally quiet first half of the year was mainly attributable to lower fertiliser volumes and prices, along with lower agronomy services and crop protection volumes and prices, partially offset by improved performance in the Feed Ingredients business. Associates and joint venture** Origin’s share of the profit after interest and taxation from associates and joint venture decreased by €4.8 million to €1.5 million, primarily as a result of the disposal of our interest in Valeo Foods in July 2015. Financing costs, net debt and working capital Net finance costs amounted to €3.8 million, an increase of €1.0 million on the prior period. Average net debt in the period amounted to €166 million compared to €196 million in the prior period. Net debt at 31 January 2016 was €168.3 million***** compared with €161.2 million at 31 January 2015 and is 2.18 times**** EBITDA for the twelve months to 31 January 2016. Following the seasonal investment in working capital the net cash outflow from operating activities was €168.5 million (2015: €115.8 million). Year on year there was an increase of €40.0 million in working capital principally reflecting seasonal requirements. Dividend On 18 December 2015 an annual dividend of 21.00 cent per share was paid in respect of the year ended 31 July 2015 totalling €26.4 million. The Group’s dividend policy has previously been to declare an annual dividend at the time of the preliminary results announcement. Following a review, the Board is now initiating a new policy of semi-annual dividend payments. An interim dividend of 3.15 cent per share will be paid on 15 April 2016 to shareholders on the register on 1 April 2016. * Operating result and Group operating (loss)/profit are stated before amortisation of non-ERP intangible assets and exceptional items. ** Profit after interest and tax before amortisation of non-ERP intangible assets and before exceptional items. *** Before amortisation of non-ERP intangible assets, net of related deferred tax (2016: €3.5 million, 2015: €4.0 million) and exceptional items, net of tax (2016: €Nil, 2015: €1.3 million charge). **** Net debt/EBITDA ratio as per the requirements of the Group’s syndicated bank loan agreement. ***** Includes restricted cash of €2.9 million (2015: €Nil).

6
Review of Operations Agri-Services Change on prior period
2016 €m
2015 €m
Change €m
Underlying** €m
Revenue 507.2 531.6 (24.4) (50.4) Operating (loss)/profit* (1.8) 4.1 (5.9) (6.6) * Before amortisation of non-ERP intangible assets and exceptional items. ** Excluding the impact of currency movements and acquisitions. Agri-Services comprises integrated on-farm agronomy services and business-to-business agri-inputs. These businesses provide customised solutions that address the efficiency, quality and output requirements of primary food producers in Ireland, the United Kingdom, Poland, Romania and Ukraine. The Group’s earnings profile is significantly weighted towards the second half of the financial year. Revenue and Operating result were €507.2 million and a loss of €1.8 million, respectively. On a like for like basis, excluding the impact of currency movements and acquisitions, revenue and operating result decreased by €50.4 million and €6.6 million, respectively. This was due to greater seasonality, principally reflecting lower fertiliser volumes and prices, lower agronomy services and crop protection volumes and prices, partially offset by improved performance in the Feed Ingredients business. Integrated On-Farm Agronomy Services United Kingdom Agrii recorded lower agronomy revenues and margins in the seasonally quiet first half largely reflecting the impact of a delayed harvest and poor weather. Record rainfall across much of the United Kingdom during December and January led to widespread flooding. In-field crop maintenance and cultivation activity was significantly curtailed during the second quarter due to these weather patterns which resulted in generally poorer ground conditions and the inability to travel on land. This contrasts sharply with excellent in-field conditions towards the end of the first quarter which supported robust crop planting activity. While we can expect a level of minor crop damage in those areas worst affected by the flooding, conditions for crop establishment and growth were generally excellent largely due to above average temperatures throughout the winter period. Assuming normal weather patterns during the main growing season, we remain positive regarding catch up agronomy revenue development in the second half as farmers address the current weather effects of, among others, higher disease levels in crops, saturated soils and nutrient deficiencies. The total area for the principal autumn and winter crops is approximately 3.03 million hectares which is 0.8 per cent lower than the prior period. Total winter wheat area is approximately 1.9 million hectares which represents a 2.5 per cent increase on last year. Winter oil seed rape plantings are approximately 11.3 per cent lower at 550,000 hectares due to the later harvest last year along with the impact of agronomic and crop rotational planning. The sown areas for the remaining winter crops are largely equivalent to the prior period. The total planted area for spring crops is expected to be approximately

7
1.26 million hectares, some 3.6 per cent lower than the prior period. The combined winter and spring cropping area is, therefore, estimated at 4.29 million hectares which is approximately 1.6 per cent lower than last year and provides a strong foundation for the seasonally important second half. The challenging market backdrop for primary producers continues to drive greater competitive intensity across our service and input portfolios as farm budgets are rigorously scrutinised for value and returns. Agrii’s integrated service offer and prescription based approach continues to maintain relevance and momentum through emphasising complete agronomy programmes that maximise the economic potential of farmers’ crops. Poland Poland achieved a good first half result with higher agronomy revenues and margins in the period. Performance was principally driven by the benefit of an extended autumn season, which in combination with the successful introduction of new service offers supported solid volume development across the agronomy portfolios.
Sustained high temperatures during the 2015 summer period led to a difficult maize harvest for farmers and resulted in significantly lower yields. Total autumn and winter plantings are some 2.3 per cent lower than last year at 5.57 million hectares which is in line with expectations with generally favourable weather supporting good crop development. Spring plantings are expected to be broadly equivalent to last year at 4.55 million hectares resulting in a combined winter and spring cropping area estimate of 10.12 million hectares, some 1.7 per cent below the prior period.
As previously announced, the Group completed the acquisition of the Kazgod Group (‘Kazgod’) on 23 November 2015.
Kazgod, which had operated a direct farm and retail distribution network throughout central and eastern Poland, now strongly complements the Group’s Dalgety business whose activities were principally concentrated in Western Poland. During the period, the Group combined Dalgety and Kazgod to form Agrii and create the leading agronomy and crop input service provider in Poland.
Integration is progressing well across commercial, technical and business processes with the combined business now operating a single sales organisation and customer interface. The enlarged business significantly extends Origin’s reach and service capability to provide value added solutions and applications that meet the yield and sustainability requirements of an increasingly professionalised and technically orientated farm customer.
Romania
The Group’s objective to establish a leading agronomy led farm services footprint in Romania was progressed during the period following the completion of the acquisitions of Redoxim and Comfert on 17 September 2015 and 16 December 2015, respectively. Romania provides important geographic extension opportunity with highly relevant routes-to-market for the Group’s service offer and technology sets. Redoxim and Comfert operate leading sector positions focused on advisory service linked to crop input provision. The businesses maintain a multi-application service focus dedicated to arable, horticulture and vegetable farm enterprises.
Business performance was satisfactory and in line with expectations during the seasonally quiet first half of the year. Farmers adopted a cautious approach to investment spend in advance of the main season following delays in the receipt of the Single Farm Payment and the impact of sustained drought conditions last year which significantly reduced yields for spring crops in 2015.

8
Crop establishment over the autumn and winter period has been favourable despite the impact of unseasonably high temperatures on soil condition following the earlier intense drought. Total plantings for the principal winter crops are estimated at 3.5 million hectares which is approximately 6.8 per cent higher than the prior period. Current estimates for spring plantings indicate a cropping area of approximately 3.9 million hectares which represents a 1.9 per cent reduction on last year. Combined winter and spring plantings are, therefore, forecast at 7.4 million hectares which is equivalent to a 2.0 per cent increase on last year. Notwithstanding that current weather conditions are conducive to crop development, normal rainfall during the early growing season will become an increasingly important requirement in maximising the planted area and the potential of spring crops in particular.
Integration process planning was commenced during the period with the initial focus on combined commercial opportunity and the establishment of a technically based agronomy communication infrastructure.
Ukraine Agroscope achieved an improved result in the first half supported by higher early season agronomy revenues. The business is well positioned for the season ahead with volume growth in the period principally reflecting an increased level of customer commitments secured ahead of the main second half application period.
Trading conditions remain extremely competitive as farmers face heightened cash flow pressures which are due mainly to significant year on year local currency weakness against the dollar and euro. The business continues to emphasise a risk based focus for the management of working capital and currency exposures largely through prioritising the acceleration of trading cash flows.
The autumn and winter crop planting programme was significantly impacted following the sustained high temperatures and drought conditions last year. Approximately 70 per cent of the target arable cropping area has been completed which is equivalent to a total planted area of 5.8 million hectares compared with a normal autumn and winter area of 8.3 million hectares. Farm management plans are being adopted to extend winter planting where weather and soil conditions allow along with a switch to increased spring plantings. Total forecast plantings for the season as a whole are expected to be equivalent to last year at 20.5 million hectares.
Agroscope continues to successfully pursue new development opportunity through the broadening of its agronomy sales force and the regional extension of its farm services distribution footprint along with the creation of service offers that are principally dedicated to the independent farms channel.
Business-to-business Agri-Inputs – Ireland and the United Kingdom Business-to-business Agri-Inputs has had a challenging first half with lower revenues and margins principally reflecting slower fertiliser volume development which was partially offset by the benefit, in particular, of higher feed volumes.
9
Fertiliser A combination of reduced farmer confidence and delayed seasonal timing due to poor weather drove weak early season fertiliser demand. Lack of certainty on near term fertiliser price development has provided customers with little incentive to buy forward in the first half despite a more competitive trading backdrop. We remain positive regarding the full year fertiliser volume outlook in Ireland with application expected to be underpinned by higher livestock numbers. While we anticipate lower market volumes in the UK for the year as a whole, we expect volume development to improve during what will be a more concentrated off-take period in the second half. Amenity
Origin Amenity which services the professional sports turf, landscaping and amenity sectors performed satisfactorily in the period. The professional sports turf channel continued to drive new customer opportunity in the period with new product and service innovation underpinning improved brand awareness through the development of advanced turf management and maintenance solutions.
Feed Ingredients
Higher volumes and improved margins supported a good first half performance from Feed Ingredients. Volume development in the period reflected favourable spot demand and we anticipate a stable volume outlook for the full year. Associates and joint venture John Thompson & Sons Limited (‘John Thompson’) John Thompson, the largest single site multi species animal feed mill in the European Union, in which Origin has a 50 per cent shareholding, delivered a satisfactory result in the period against lower volume performance. Outlook Reflecting the seasonality profile of the business for the current financial year the Group will earn in excess of 100 per cent of full year operating profits from Agri-Services in the second half. At this stage in the year, assuming normal weather patterns and no material adverse change in current exchange rates, the Group expects to achieve full year adjusted diluted earnings per share of between 51 and 53 cent. A further update on the full year outlook will be provided at the timing of the announcement of the third quarter Trading Update on 26 May 2016. ENDS

10
About Origin Enterprises plc Origin Enterprises plc is a focused Agri-Services group providing on-farm advice and the supply of agri-inputs. The Agri-Services business through its manufacturing and distribution operations in Ireland, the United Kingdom, Poland, Romania and Ukraine has leading market positions in the supply of specialist agronomy services, crop nutrition and feed ingredients. The Group is listed on the ESM and AIM markets of the Irish and London Stock Exchanges. ESM ticker symbol: OIZ AIM ticker symbol: OGN Website: www.originenterprises.com

11
Origin Enterprises plc Consolidated Income Statement for the six months ended 31 January 2016
Six months Six months Year ended ended ended January January July 2016 2015 2015 Total Total Total €'000 €'000 €'000
Notes (Note 6) (Note 6) (Unaudited) (Unaudited) (Audited)
Revenue 3 507,213 531,599 1,458,098 Cost of sales (438,477) (458,871) (1,231,783)
Gross profit 68,736 72,728 226,315
Operating costs and other income (74,657) (72,846) (144,797)
Share of profit of associates and joint venture
1,476
4,628
9,679
Operating (loss)/profit 3 (4,445) 4,510 91,197
Finance income 273 1,511 3,268 Finance expense (4,042) (4,300) (8,078)
(Loss)/profit before tax (8,214) 1,721 86,387
Income tax credit/(expense) 1,636
327
(9,130)
(Loss)/profit attributable to equity shareholders
(6,578)
2,048
77,257
Six months Six months Year ended ended ended January
2016 January
2015 July
2015
Basic (loss)/earnings per share 5 (5.24c) 1.64c 61.72c Diluted (loss)/earnings per share 5 (5.24c) 1.63c 61.52c
12
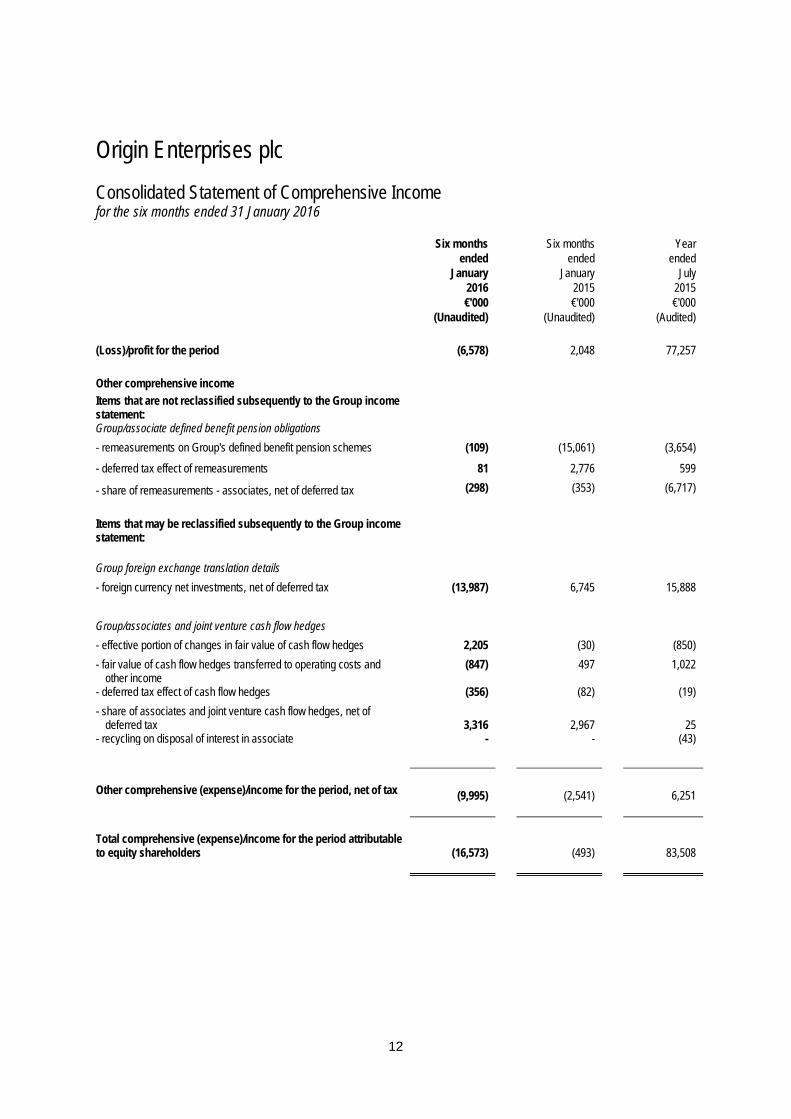
Origin Enterprises plc Consolidated Statement of Comprehensive Income for the six months ended 31 January 2016
Six months Six months Year ended ended ended January January July 2016 2015 2015 €'000 €'000 €'000 (Unaudited) (Unaudited) (Audited)
(Loss)/profit for the period (6,578) 2,048 77,257
Other comprehensive income Items that are not reclassified subsequently to the Group income statement:
Group/associate defined benefit pension obligations - remeasurements on Group's defined benefit pension schemes (109) (15,061) (3,654)
- deferred tax effect of remeasurements 81 2,776 599
- share of remeasurements - associates, net of deferred tax (298) (353) (6,717)
Items that may be reclassified subsequently to the Group income statement:
Group foreign exchange translation details - foreign currency net investments, net of deferred tax (13,987) 6,745 15,888 Group/associates and joint venture cash flow hedges - effective portion of changes in fair value of cash flow hedges 2,205 (30) (850) - fair value of cash flow hedges transferred to operating costs and
other income (847) 497 1,022
- deferred tax effect of cash flow hedges (356) (82) (19) - share of associates and joint venture cash flow hedges, net of
deferred tax
3,316
2,967
25 - recycling on disposal of interest in associate - - (43)
Other comprehensive (expense)/income for the period, net of tax (9,995) (2,541) 6,251
Total comprehensive (expense)/income for the period attributable to equity shareholders
(16,573)
(493)
83,508

13
Origin Enterprises plc Consolidated Statement of Financial Position as at 31 January 2016
January January July 2016 2015 2015 Notes €'000 €'000 €'000 (Unaudited) (Unaudited) (Audited)
ASSETS Non-current assets Property, plant and equipment 7 108,178 94,630 97,889 Investment properties 7,575 7,575 7,575 Goodwill and intangible assets 8 181,557 156,205 161,401 Investments in associates and joint venture 9 38,087 60,533 38,537 Other receivables 2,341 43,678 494 Deferred tax assets 4,391 4,818 3,236
Total non-current assets 342,129 367,439 309,132
Current assets Inventory 224,279 203,441 158,100 Trade and other receivables 256,671 156,714 336,021 Derivative financial instruments 2,145 2,665 96 Restricted cash 2,937 - 29,358 Cash and cash equivalents 66,659 86,349 199,303
Total current assets 552,691 449,169 722,878
TOTAL ASSETS 894,820 816,608 1,032,010
14
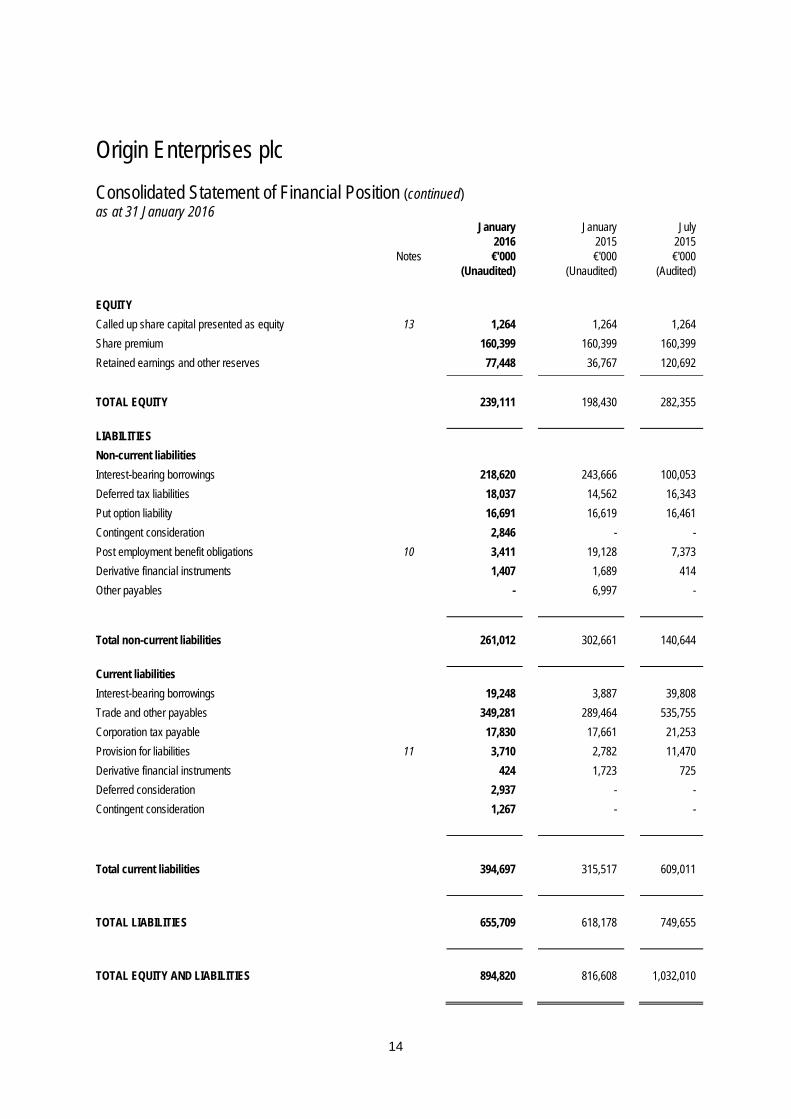
Origin Enterprises plc Consolidated Statement of Financial Position (continued) as at 31 January 2016
January January July 2016 2015 2015 Notes €'000 €'000 €'000 (Unaudited) (Unaudited) (Audited)
EQUITY Called up share capital presented as equity 13 1,264 1,264 1,264 Share premium 160,399 160,399 160,399 Retained earnings and other reserves 77,448 36,767 120,692 TOTAL EQUITY 239,111 198,430 282,355
LIABILITIES Non-current liabilities Interest-bearing borrowings 218,620 243,666 100,053 Deferred tax liabilities 18,037 14,562 16,343 Put option liability 16,691 16,619 16,461 Contingent consideration 2,846 - - Post employment benefit obligations 10 3,411 19,128 7,373 Derivative financial instruments 1,407 1,689 414 Other payables - 6,997 -
Total non-current liabilities 261,012 302,661 140,644
Current liabilities Interest-bearing borrowings 19,248 3,887 39,808 Trade and other payables 349,281 289,464 535,755 Corporation tax payable 17,830 17,661 21,253 Provision for liabilities 11 3,710 2,782 11,470 Derivative financial instruments 424 1,723 725 Deferred consideration 2,937 - - Contingent consideration 1,267 - -
Total current liabilities 394,697 315,517 609,011
TOTAL LIABILITIES 655,709 618,178 749,655
TOTAL EQUITY AND LIABILITIES 894,820 816,608 1,032,010

15
Origin Enterprises plc Consolidated Statement of Changes in Equity for the six months ended 31 January 2016 Share- Foreign Capital Cashflow based currency Share Share Treasury redemption hedge Revaluation payment Re-organisation translation Retained capital premium shares reserve reserve reserve reserve reserve reserve earnings Total €'000 €'000 €'000 €'000 €'000 €'000 €'000 €'000 €'000 €'000 €'000 At 1 August 2015 1,264 160,399 (12) 134 (1,748) 12,843 1,749 (196,884) 1,606 303,004 282,355 (Loss) for the period - - - - - - - - - (6,578) (6,578) Other comprehensive income for the
period
-
-
-
-
4,318
-
-
-
(13,987)
(326)
(9,995) Share-based payment credit - - - - - - (300) - - - (300) Dividend paid to shareholders (Note 15) - - - - - - - - - (26,371) (26,371)
At 31 January 2016 1,264 160,399 (12) 134 2,570 12,843 1,449 (196,884) (12,381) 269,729 239,111

16
Origin Enterprises plc Consolidated Statement of Changes in Equity for the six months ended 31 January 2015 Share- Foreign Capital Cashflow based currency Share Share Treasury redemption hedge Revaluation payment Re-organisation translation Retained capital premium shares reserve reserve reserve reserve reserve reserve earnings Total €'000 €'000 €'000 €'000 €'000 €'000 €'000 €'000 €'000 €'000 €'000 At 1 August 2014 1,264 160,399 (12) 134 (1,883) 12,843 1,825 (196,884) (14,282) 260,552 223,956 Profit for the period - - - - - - - - - 2,048 2,048 Other comprehensive income for the
period
-
-
-
-
3,352
-
-
-
6,745
(12,638)
(2,541) Dividend paid to shareholders - - - - - - - - - (25,033) (25,033)
At 31 January 2015 1,264 160,399 (12) 134 1,469 12,843 1,825 (196,884) (7,537) 224,929 198,430

17
Origin Enterprises plc Consolidated Statement of Cash Flows for the six months ended 31 January 2016
Six months Six months Year ended ended ended January 2016 January 2015 July 2015 €'000 €'000 €'000 (Unaudited) (Unaudited) (Audited)
Cash flows from operating activities (Loss)/profit before tax (8,214) 1,721 86,387 Exceptional items - 1,354 (9,587) Finance income (273) (1,511) (3,268) Finance expense 4,042 4,300 8,078 Profit on disposal of property, plant and equipment (16) - (117) Share of profit of associates and joint venture, net of intangible amortisation
(1,476)
(5,246)
(10,113)
Depreciation of property, plant and equipment 3,248 2,993 6,299 Amortisation of intangible assets 5,368 4,813 10,110 Employee share-based payment credit (300) - (76) Pension contributions in excess of service costs (4,158) (1,672) (1,615) Payment of exceptional employee rationalisation and other employee related costs (15,856) (1,527) (3,199) Payment of exceptional acquisition costs (658) - (2,090)
Operating cash flow before changes in working capital (18,293) 5,225 80,809 (Increase) in inventory (55,622) (63,239) (15,129) Decrease/(increase) in trade and other receivables 143,413 139,148 (24,700) (Decrease)/increase in trade and other payables (233,550) (191,389) 30,088
Cash (absorbed)/generated from operating activities (164,052) (110,255) 71,068 Interest paid (2,727) (3,172) (6,782) Income tax paid (1,714) (2,347) (9,402)
Cash (outflow)/inflow from operating activities (168,493) (115,774) 54,884

18
Origin Enterprises plc Consolidated Statement of Cash Flows (continued) for the six months ended 31 January 2016
Six months Six months Year ended ended ended January 2016 January 2015 July 2015 €'000 €'000 €'000 (Unaudited) (Unaudited) (Audited)
Cash flows from investing activities Proceeds from sale of property, plant and equipment 169 105 358 Purchase of property, plant and equipment (4,147) (4,967) (8,719) Additions to intangible assets (537) (255) (2,637) Acquisition of subsidiary undertakings (66,683) - - Restricted cash 26,421 - (29,358) Investment in/loans to associates and joint venture (172) - - Cash consideration on disposal of associate and joint venture - 475 42,946 Disposal/repayment of vendor loan note - principal - - 35,100 Disposal/repayment of vendor loan note - interest - - 9,070 Dividends received from associates 2,936 2,651 2,899
Net cash (outflow)/inflow from investing activities (42,013) (1,991) 49,659
Cash flows from financing activities Drawdown/(repayment) of bank loans 95,348 87,561 (33,812) Payment of dividends to equity shareholders (Note 15) (26,371) (25,033) (25,033) Increase/(decrease) of finance lease obligations 114 (76) (146)
Net cash inflow/(outflow) from financing activities 69,091 62,452 (58,991)
Net (decrease)/increase in cash and cash equivalents (141,415) (55,313) 45,552
Translation adjustment (2,865) 3,339 11,615
Cash and cash equivalents at start of period 191,803 134,636 134,636
Cash and cash equivalents at end of period (Note 12) 47,523 82,662 191,803
19
Origin Enterprises plc Notes to the Group Condensed Interim Financial Statements for the six months ended 31 January 2016 1 Basis of preparation
The Group condensed interim financial statements has been prepared in accordance with International Accounting Standard 34, Interim Financial Reporting (IAS 34), as endorsed by the EU as information to shareholders. The condensed interim financial statements do not include all the information and disclosures required in the annual financial statements and should be read in conjunction with the Group’s annual financial statements in respect of the year ended 31 July 2015, which have been prepared in accordance with IFRSs as endorsed by the EU. The financial statements for the year ended 31 July 2015 were filed with the Registrar of Companies and are available on the company’s website www.originenterprises.com. Those financial statements contained an unqualified audit report.
The group condensed interim financial statements for the six months ended 31 January 2016 and the comparative figures for the six months ended 31 January 2015 are unaudited and have not been reviewed by the Auditors. The summary financial statements for the year ended 31 July 2015 represents an abbreviated version of the Group’s full accounts for that year.
The Group condensed interim financial statements are presented in euro and rounded to the nearest thousand, which is the functional currency of the Parent. A comprehensive review of the group’s performance for the six months ended 31 January 2016 is included in the financial highlights section included on pages 1 to 10. The group’s business is seasonal and is heavily weighted towards the second half of the financial year.
2 Accounting policies
Except as described below, the group interim financial statements have been prepared on the basis of the accounting policies as set out on pages 52 to 58 of the Group’s Annual Report for the year ended 31 July 2015. The following amendment, issued by the International Accounting Standards Board (‘IASB’) and the International Financial Reporting Interpretations Committee (‘IFRIC’), is effective for the Group for the first time in the current financial period and where relevant has been adopted by the Group:
• IAS 19 (Amended) ‘Employee Benefits’
The above amendment is effective for accounting periods beginning on or after 1 February 2015.
Adoption of the standards above has had no significant impact on the results or financial position of the Group during the period. The Group has not applied early adoption of any standards for which the effective date is not yet required.
20
Origin Enterprises plc
Notes to the Group Condensed Interim Financial Statements (continued) for the six months ended 31 January 2016
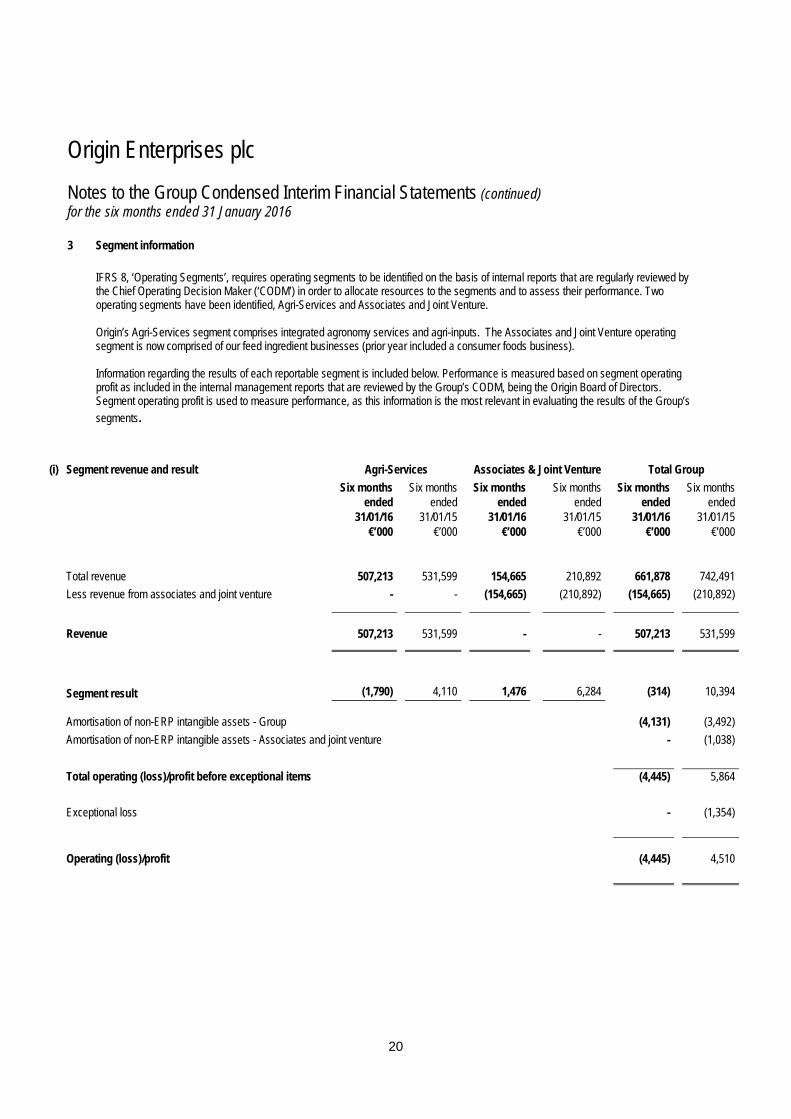
3 Segment information
IFRS 8, ‘Operating Segments’, requires operating segments to be identified on the basis of internal reports that are regularly reviewed by the Chief Operating Decision Maker (‘CODM’) in order to allocate resources to the segments and to assess their performance. Two operating segments have been identified, Agri-Services and Associates and Joint Venture. Origin’s Agri-Services segment comprises integrated agronomy services and agri-inputs. The Associates and Joint Venture operating segment is now comprised of our feed ingredient businesses (prior year included a consumer foods business). Information regarding the results of each reportable segment is included below. Performance is measured based on segment operating profit as included in the internal management reports that are reviewed by the Group’s CODM, being the Origin Board of Directors. Segment operating profit is used to measure performance, as this information is the most relevant in evaluating the results of the Group’s segments.
(i) Segment revenue and result Agri-Services Associates & Joint Venture Total Group Six months Six months Six months Six months Six months Six months ended ended ended ended ended ended 31/01/16 31/01/15 31/01/16 31/01/15 31/01/16 31/01/15 €’000 €’000 €’000 €’000 €’000 €’000 Total revenue 507,213 531,599 154,665 210,892 661,878 742,491 Less revenue from associates and joint venture - - (154,665) (210,892) (154,665) (210,892)
Revenue
507,213
531,599
-
-
507,213
531,599
Segment result
(1,790)
4,110
1,476
6,284
(314)
10,394 Amortisation of non-ERP intangible assets - Group (4,131) (3,492) Amortisation of non-ERP intangible assets - Associates and joint venture - (1,038) Total operating (loss)/profit before exceptional items (4,445) 5,864 Exceptional loss - (1,354) Operating (loss)/profit (4,445) 4,510

21
Origin Enterprises plc Notes to the Group Condensed Interim Financial Statements (continued) for the six months ended 31 January 2016 3 Segment information (continued)
(ii) Segment earnings before financing costs and tax is reconciled to reported profit before tax and profit after tax as follows: Six months Six months ended ended 31/01/16 31/01/15
€'000 €'000
Segment earnings before financing cost and tax (4,445) 4,510 Finance income 273 1,511 Finance expense (4,042) (4,300) Reported (loss)/profit before tax (8,214) 1,721 Income tax credit 1,636 327 Reported (loss)/profit after tax (6,578) 2,048
(iii) Segment assets Agri-Services Associates & Joint Venture
Total Group
Six months
Six months
Six months
Six months
Six months
Six months
ended ended ended ended ended ended 31/01/16 31/01/15 31/01/16 31/01/15 31/01/16 31/01/15 €’000 €’000 €’000 €’000 €’000 €’000 Segment assets excluding investment in associates and joint venture and investment properties 772,404 610,990 - - 772,404 610,990
Investment in associates and joint venture (including other financial assets) - - 38,709 104,211 38,709 104,211
Segment assets
772,404
610,990
38,709
104,211
811,113
715,201
Reconciliation to total assets as reported in Consolidated Statement of Financial Position
Cash and cash equivalents 66,659 86,349 Restricted cash 2,937 - Investment properties 7,575 7,575 Derivative financial instruments 2,145 2,665 Deferred tax assets 4,391 4,818 Total assets as reported in Consolidated Statement of
Financial Position
894,820
816,608

22
Origin Enterprises plc Notes to the Group Condensed Interim Financial Statements (continued) for the six months ended 31 January 2016
3 Segment information (continued)
(iv) Segment liabilities Agri-Services Associates & Joint
Venture Total Group
Six months
Six months
Six months
Six months
Six months
Six months
ended ended ended ended ended ended 31/01/16 31/01/15 31/01/16 31/01/15 31/01/16 31/01/15 €’000 €’000 €’000 €’000 €’000 €’000
Segment liabilities
380,143
334,990
-
-
380,143
334,990
Reconciliation to total liabilities as reported in Consolidated Statement of Financial Position
Interest-bearing loans and liabilities 237,868 247,553 Derivative financial instruments 1,831 3,412 Current and deferred tax liabilities 35,867 32,223 Total liabilities as reported in Consolidated Statement
of Financial Position
655,709
618,178
4 Exceptional items Exceptional items are those that, in management’s judgement, should be disclosed by virtue of their nature or amount. Such items are included within the consolidated income statement caption to which they relate. The following exceptional items arose in the period:
Six months Six months ended ended January January 2016 2015
€'000 €'000
Rationalisation and other costs (i) - (661) Arising in associates and joint venture (ii) - (618) Total exceptional charge, net of tax - (1,279)
(i) Rationalisation costs include termination payments arising from a restructuring of Agri-Services in the UK and a gain on
disposal. (ii) During the prior period, the exceptional costs arising in associates and joint venture related to the Group’s share of redundancy
and acquisition costs.
23
Origin Enterprises plc Notes to the Group Condensed Interim Financial Statements (continued) for the six months ended 31 January 2016
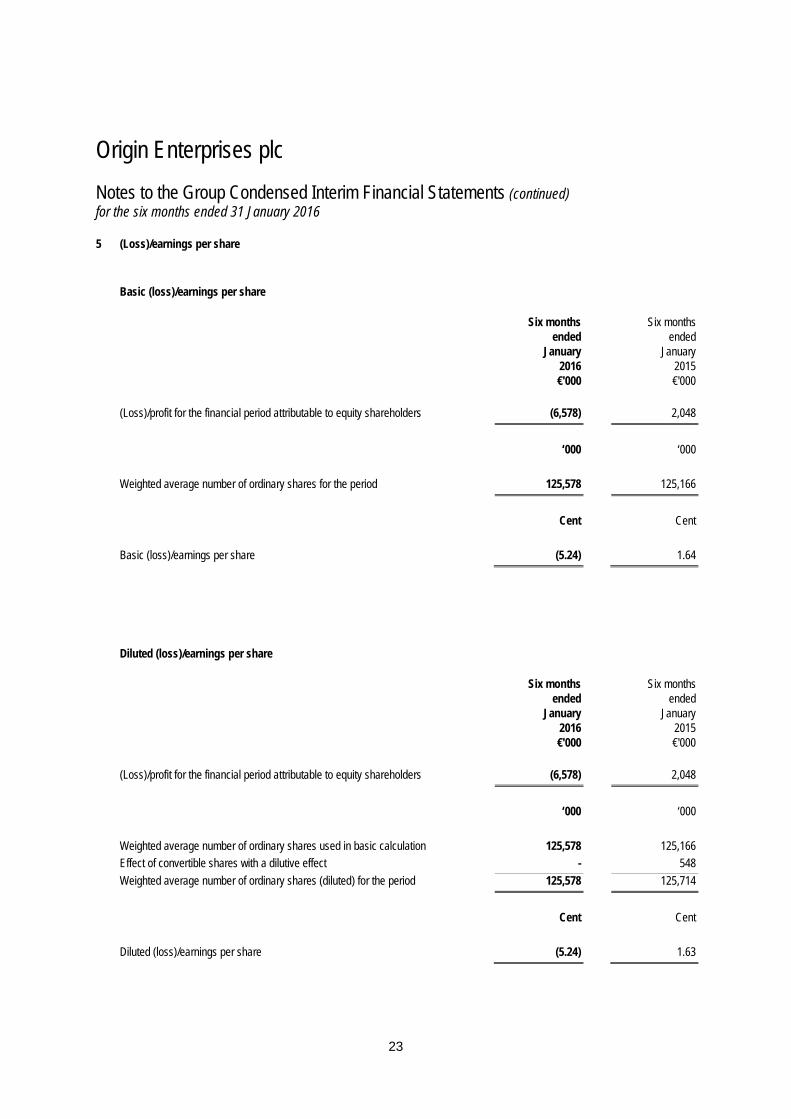
5 (Loss)/earnings per share
Basic (loss)/earnings per share
Six months Six months ended ended January January 2016 2015 €'000 €'000 (Loss)/profit for the financial period attributable to equity shareholders (6,578) 2,048 ‘000 ‘000 Weighted average number of ordinary shares for the period 125,578 125,166 Cent Cent Basic (loss)/earnings per share (5.24) 1.64 Diluted (loss)/earnings per share Six months Six months ended ended January January 2016 2015 €'000 €'000 (Loss)/profit for the financial period attributable to equity shareholders (6,578) 2,048 ‘000 ‘000 Weighted average number of ordinary shares used in basic calculation 125,578 125,166 Effect of convertible shares with a dilutive effect - 548 Weighted average number of ordinary shares (diluted) for the period 125,578 125,714 Cent Cent Diluted (loss)/earnings per share (5.24) 1.63

24
Origin Enterprises plc Notes to the Group Condensed Interim Financial Statements (continued) for the six months ended 31 January 2016
5 (Loss)/earnings per share (continued) Adjusted basic (loss)/earnings per share
Six months Six months ended ended January January 2016 2015 €'000 €'000 (Loss)/profit for the financial period attributable to equity shareholders (6,578) 2,048 Amortisation of non-ERP related intangible assets 4,131 3,492 Tax on amortisation of non-ERP related intangible assets (662) (561) Share of associates and joint venture amortisation of non-ERP related intangible assets, net of tax
-
1,038
Exceptional items, net of tax - 1,279 Adjusted basic (loss)/earnings (3,109) 7,296 Cent Cent Adjusted basic (loss)/earnings per share (2.47) 5.83
Total adjusted (loss)/earnings - as above (3,109) 7,296 Cent Cent
Total adjusted diluted (loss)/earnings per share (2.47) 5.80
The calculation of basic adjusted (loss)/earnings per share is based on the weighted average number of shares in issue during the period of 125,578,447 (31 January 2015: 125,165,906). The weighted average number of shares used in the calculation of adjusted diluted (loss)/earnings per share is 125,578,447 (31 January 2015: 125,714,124).

25
Origin Enterprises plc Notes to the Group Condensed Interim Financial Statements (continued) for the six months ended 31 January 2016
6 Consolidated Income Statements for the six months ended 31 January 2016, 31 January 2015 and year ended 31 July 2015 There were no net exceptional items arising in the six months ended 31 January 2016. An analysis of the Consolidated Income Statement
(including exceptional items) for the six months ended 31 January 2015 and year ended 31 July 2015 is set out below. Six months ended 31 January 2015
Six months ended Six months Six months January ended ended 2015 January January Pre- 2015 2015 Exceptional Exceptional Total €’000 €’000 €'000 (Unaudited) (Unaudited) (Unaudited) Revenue 531,599 - 531,599 Cost of sales (458,871) - (458,871) Gross profit 72,728 - 72,728 Operating costs and other income (72,110) (736) (72,846)
Share of profit of associates and joint venture
5,246
(618)
4,628
Operating profit 5,864 (1,354) 4,510 Finance income 1,511 - 1,511 Finance expense (4,300) - (4,300) Profit before tax 3,075 (1,354) 1,721 Income tax credit 252 75 327
Profit attributable to equity shareholders
3,327
(1,279)
2,048

26
Origin Enterprises plc Notes to the Group Condensed Interim Financial Statements (continued) for the six months ended 31 January 2016
6 Consolidated Income Statements for the six months ended 31 January 2016, 31 January 2015 and year ended 31 July 2015 (continued)
Year ended 31 July 2015
Year ended Year Year July ended ended 2015 July July Pre- 2015 2015 Exceptional Exceptional Total €’000 €’000 €'000 (Audited) (Audited) (Audited) Revenue 1,458,098 - 1,458,098 Cost of sales (1,231,783) - (1,231,783) Gross profit 226,315 - 226,315 Operating costs and other income (154,817) 10,020 (144,797)
Share of profit of associates and joint venture
10,112
(433)
9,679
Operating profit 81,610 9,587 91,197 Finance income 3,268 - 3,268 Finance expense (8,078) - (8,078) Profit before tax 76,800 9,587 86,387 Income tax (expense)/credit (11,507) 2,377 (9,130)
Profit attributable to equity shareholders
65,293
11,964
77,257

27
Origin Enterprises plc Notes to the Group Condensed Interim Financial Statements (continued) for the six months ended 31 January 2016
7 Property, plant and equipment
January July 2016 2015 €'000 €'000
At beginning of period 97,889 90,426 Arising on acquisitions (Note 14) 14,185 - Additions 3,789 8,536 Disposals (153) (241) Depreciation charge (3,248) (6,299) Translation adjustments (4,284) 5,467
At end of period 108,178 97,889
8 Goodwill and intangible assets
January July 2016 2015 €'000 €'000
At beginning of period 161,401 151,372 Arising on acquisitions (Note 14) 34,204 - Additions 523 2,637 Amortisation of non-ERP intangible assets (4,131) (7,397) ERP intangible amortisation (1,237) (2,713) Translation adjustments (9,203) 17,502
At end of period 181,557 161,401
Included in the total goodwill and intangible assets above is goodwill of €112,157,000 (July 2015: €98,858,000). There have been no indicators
of impairment in the first half of the year therefore a full assessment of the carrying value of goodwill and intangibles will be carried out in the second half of the year.

28
Origin Enterprises plc Notes to the Group Condensed Interim Financial Statements (continued) for the six months ended 31 January 2016
9 Investments in associates and joint venture
January
July
2016 2015 €'000 €'000
At beginning of period 38,537 54,911 Share of profits after tax, before exceptional items 1,476 14,077 Share of intangible amortisation, net of tax - (3,964) Share of acquisition and rationalisation costs, net of tax - (433) Dividends received (2,936) (2,899) Disposal of interest in Valeo Foods - (19,364) Share of other comprehensive income/(expense) 3,018 (6,693) Translation adjustments (2,008) 2,902
At end of period 38,087 38,537
10 Post employment benefit obligations The Group operates a number of defined benefit pension schemes and defined contribution schemes with assets held in separate
trustee administered funds. All of the defined benefit schemes are closed to new members. The valuations of the defined benefit schemes used for the purposes of the following disclosures are those of the most recent
actuarial review carried out effective 31 January 2016 by an independent, qualified actuary. The valuations have been performed using the projected unit method.
The following discount rates have been applied for the relevant periods:
January
July
2016 2015 €'000 €'000
Republic of Ireland schemes 2.3% 2.3% UK schemes 3.7% 3.8%

29
Origin Enterprises plc Notes to the Group Condensed Interim Financial Statements (continued) for the six months ended 31 January 2016 10 Post employment benefit obligations (continued) Movement in net liability recognised in the Consolidated Statement of Financial Position
January July 2016 2015 €'000 €'000
Net liability in schemes at beginning of the period 7,373 5,193 Current service cost 341 582 Past service cost 111 - Contributions (4,499) (2,197) Other finance expense 60 140 Remeasurements 109 3,654 Translation adjustments (84) 1
Net liability in schemes at end of the period 3,411 7,373 11 Provision for liabilities The estimate of provisions is a key judgement in the preparation of the financial statements.
January
July
2016 2015 €'000 €'000
At beginning of period 11,470 2,818 Provided in period - 11,377 Paid in period (7,256) (3,250) Released in period (210) - Translation adjustments (294) 525
At end of period 3,710 11,470
Provisions for liabilities relate to various operating and employment related costs.

30
Origin Enterprises plc Notes to the Group Condensed Interim Financial Statements (continued) for the six months ended 31 January 2016
12 Analysis of net debt
31 July
Non-cash
Translation
31 January 2015 Cash flow movements adjustment 2016 €'000 €'000 €'000 €'000 €'000 Cash 199,303 (128,765) - (3,879) 66,659 Overdraft (7,500) (12,650) - 1,014 (19,136) Cash and cash equivalents 191,803 (141,415) - (2,865) 47,523 Finance lease obligations (142) (114) - 8 (248) Loans (132,219) (95,348) (401) 9,484 (218,484)
Net cash/(debt)
59,442
(236,877)
(401)
6,627
(171,209)
Restricted cash 29,358 (26,421) - - 2,937 Net cash/(debt) including
restricted cash
88,800
(263,298)
(401)
6,627
(168,272)
The loans included above are unsecured and the facility extends to May 2020. 13 Share capital January July 2016 2015 €'000 €'000 Authorised 250,000,000 ordinary shares of €0.01 each (i) 2,500 2,500 Allotted, called up and fully paid 126,378,777 ordinary shares of €0.01 each (i) 1,264 1,264
(i) Ordinary shareholders are entitled to dividends as declared and each ordinary share carries equal voting rights at meetings of
the Company.

31
Origin Enterprises plc Notes to the Group Condensed Interim Financial Statements (continued) for the six months ended 31 January 2016
14 Acquisition of subsidiary undertakings During the period the Group completed a number of acquisitions in Romania and Poland as follows:
1. On 17 September 2015 the Group completed the acquisition of 100 per cent of Redoxim SRL. Based in Romania, Redoxim SRL is a leading provider of agronomy services, macro and micro inputs to arable, vegetable and horticulture growers.
2. On 23 November 2015 the Group completed the acquisition of 100 per cent of Kazgod Group. Based in Poland, Kazgod
Group is a leading provider of agronomy services, inputs, crop marketing solutions as well as a manufacturer of micro nutrition applications.
3. On 16 December 2015 the Group completed the acquisition of 100 per cent of Comfert SRL. Based in Romania, Comfert SRL
is a leading provider of agronomy services, integrated inputs and crop marketing support to arable and vegetable growers.
Details of the net assets acquired and goodwill arising from the business combinations are as follows:
Fair value €’000 Net assets acquired: Property, plant & equipment 14,185 Intangible assets 14,537 Inventory 22,948 Trade and other receivables 89,105 Deferred tax liability (876) Trade and other payables (85,173) Corporation tax (660) Net assets acquired 54,066 Goodwill arising on acquisitions 19,667 Consideration 73,733 Satisfied by: Cash consideration 41,511 Contingent consideration 4,113 Deferred consideration* 2,937 Finance leases 250 48,811 Debt acquired 29,145 Cash and cash equivalents acquired (4,223) Consideration 73,733
* Deferred consideration of €2.9 million relating to the acquisition of Redoxim is payable on 17 September 2016, one year following completion.

32
Origin Enterprises plc Notes to the Group Condensed Interim Financial Statements (continued) for the six months ended 31 January 2016
14 Acquisition of subsidiary undertakings (continued) The goodwill recognised on acquisitions is attributable to the skills and technical talent of the acquired business’ workforce and the synergies expected to be achieved from integrating the companies into the Group’s existing business. None of the goodwill recognised is expected to be deductible for income tax purposes.
Contingent consideration arrangements require the Group to make future payments in relation to two of the acquisitions. The final
amount payable will be dependent upon annual earnings targets being achieved in the period to 31 December 2020. The potential undiscounted amounts of all future payments that the Group could be required to make under this arrangement is between €1.0 and €4.5 million. The discounted fair value of the contingent consideration of €4.1 million was estimated based on applying a discount rate of 3.0% to the fair value of the potential amount payable of €4.5 million. This is a level 3 fair value measurement.
The fair values presented in this note are based on provisional valuations due to the close proximity of the transactions to the end of the half year period.
15 Dividends
On 18 December 2015 a dividend of 21.00 cent per ordinary share was paid in respect of the year ended 31 July 2015 totalling €26,371,474. The dividend was approved by shareholders at the Annual General Meeting on 27 November 2015. An interim dividend of 3.15 cent (2015: Nil) per ordinary share will be paid on 15 April 2016 to shareholders on the register on 1 April 2016. These condensed interim financial statements do not reflect this dividend payable.
16 Taxation
The taxation expense for the interim period is an estimate based on the expected full year effective tax rate on full year profits.
17 Contingent liabilities
The Group is not aware of any major changes with regard to contingent liabilities in comparison with the situation as of 31 July 2015. 18 Related party transactions
Related party transactions occurring in the period were similar in nature to those described in the 2015 Annual Report.
19 Release of half yearly condensed financial statements
The Group condensed financial information was approved for release by the Board on 9 March 2016.
20 Distribution of Interim Report
This interim report is available on the Group’s website (www.originenterprises.com). A printed copy is available to the public at the Company’s registered office.