First Half of FY2013 ended September 30, 2012
27
November 7, 2012 Keihan Electric Railway Co., Ltd. (Tokyo Stock Exchange 1st / Osaka Securities Exchange 1st Securities Code: 9045 http://www.keihan.co.jp/) [Notes on forecasts] Descriptions of business forecasts and future prospects are based on current information and certain assumptions about factors that may affect future business. The actual results of operating performance may differ from these forecasts. First Half of FY2013 (Ended September 30, 2012) Financial Results Presentation
Transcript of First Half of FY2013 ended September 30, 2012
November 7, 2012
Keihan Electric Railway Co., Ltd. (Tokyo Stock Exchange 1st / Osaka Securities Exchange 1st
Securities Code: 9045 http://www.keihan.co.jp/)
[Notes on forecasts]
Descriptions of business forecasts and future prospects are based on current information and certain
assumptions about factors that may affect future business. The actual results of operating
performance may differ from these forecasts.
First Half of FY2013 (Ended September 30, 2012)
Financial Results Presentation
Overview of the First Half of FY2013
Financial Results
(Millions of yen)
1H FY2012
Results
1H FY2013
Results Change Main factors of changes
May 2012
Estimate
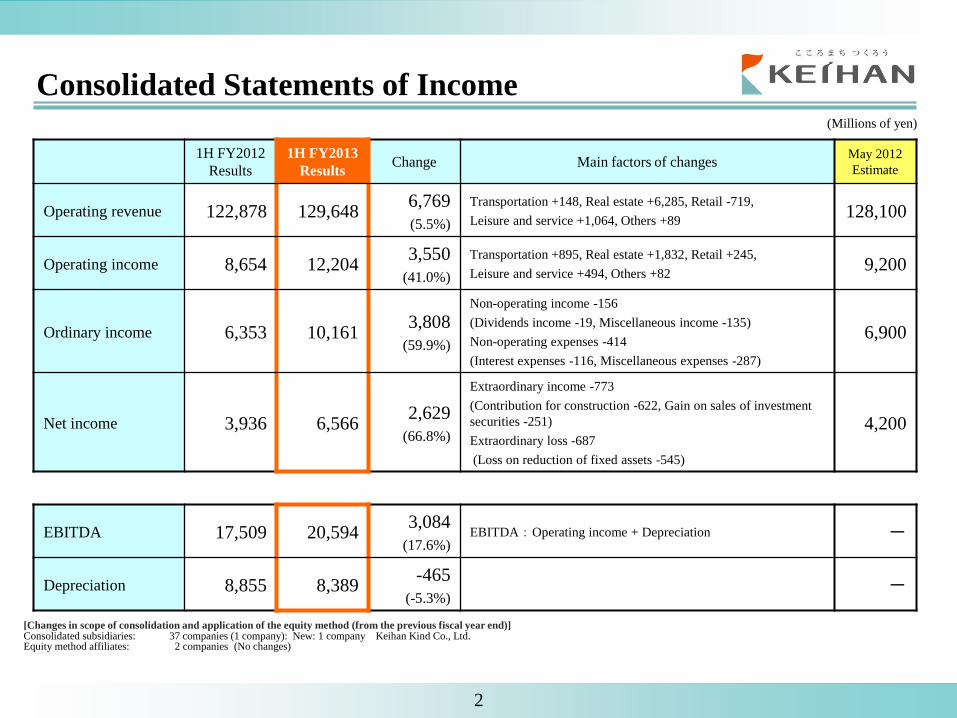
Operating revenue 122,878 129,648 6,769
(5.5%)
Transportation +148, Real estate +6,285, Retail -719,
Leisure and service +1,064, Others +89 128,100
Operating income 8,654 12,204 3,550
(41.0%)
Transportation +895, Real estate +1,832, Retail +245,
Leisure and service +494, Others +82 9,200
Ordinary income 6,353 10,161 3,808
(59.9%)
Non-operating income -156
(Dividends income -19, Miscellaneous income -135)
Non-operating expenses -414
(Interest expenses -116, Miscellaneous expenses -287)
6,900
Net income 3,936 6,566 2,629
(66.8%)
Extraordinary income -773
(Contribution for construction -622, Gain on sales of investment
securities -251)
Extraordinary loss -687
(Loss on reduction of fixed assets -545)
4,200
EBITDA 17,509 20,594 3,084
(17.6%) EBITDA:Operating income + Depreciation -
Depreciation 8,855 8,389 -465
(-5.3%) -
2
Consolidated Statements of Income
[Changes in scope of consolidation and application of the equity method (from the previous fiscal year end)] Consolidated subsidiaries: 37 companies (1 company): New: 1 company Keihan Kind Co., Ltd. Equity method affiliates: 2 companies (No changes)

FY2012
Results
1H FY2013
Results Change Main factors of changes
Current assets 137,064 133,248 -3,816 Notes and accounts receivable -6,514
Prepaid expenses +678
Cash and deposit +618
Fixed assets 505,438 503,665 -1,772 Investments and other assets -1,929
Total assets 642,502 636,913 -5,588
Current liabilities 184,947 188,317 3,369 Current portion of bonds +10,018
Income taxes payable +1,462
Accounts payable -8,129
Long-term liabilities 311,767 298,390 -13,376 Bonds -10,228
Long-term loans -1,602
Total liabilities 496,714 486,708 -10,006
Net assets 145,788 150,205 4,417 Retained earnings +5,374
Valuation difference on available-for-sale securities -1,126
* Equity capital ratio 23.1% (+0.8pt)
Total liabilities and net
assets 642,502 636,913 -5,588
Interest-bearing debt at
end of interim period 335,864 331,874 -3,989
Loans payable -2,484
Bonds -210
Long-term accounts payable -1,294
(Millions of yen)
3
Consolidated Balance Sheets
*Interest-bearing debt: Loans payable + bonds + accounts payable for Japan Railway Construction, Transport and Technology Agency (JRTT)
(Millions of yen)
1H FY2012
Results
1H FY2013
Results Change Main factors of changes
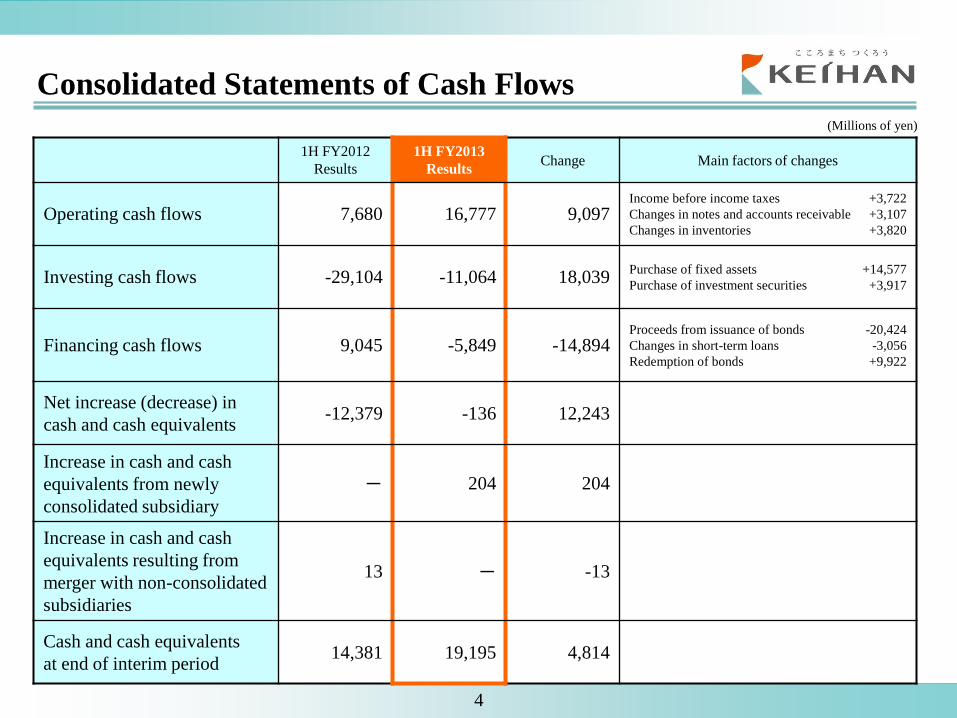
Operating cash flows 7,680 16,777 9,097 Income before income taxes +3,722
Changes in notes and accounts receivable +3,107
Changes in inventories +3,820
Investing cash flows -29,104 -11,064 18,039 Purchase of fixed assets +14,577
Purchase of investment securities +3,917
Financing cash flows 9,045 -5,849 -14,894 Proceeds from issuance of bonds -20,424
Changes in short-term loans -3,056
Redemption of bonds +9,922
Net increase (decrease) in
cash and cash equivalents -12,379 -136 12,243
Increase in cash and cash
equivalents from newly
consolidated subsidiary
- 204 204
Increase in cash and cash
equivalents resulting from
merger with non-consolidated
subsidiaries
13 - -13
Cash and cash equivalents
at end of interim period 14,381 19,195 4,814
4
Consolidated Statements of Cash Flows
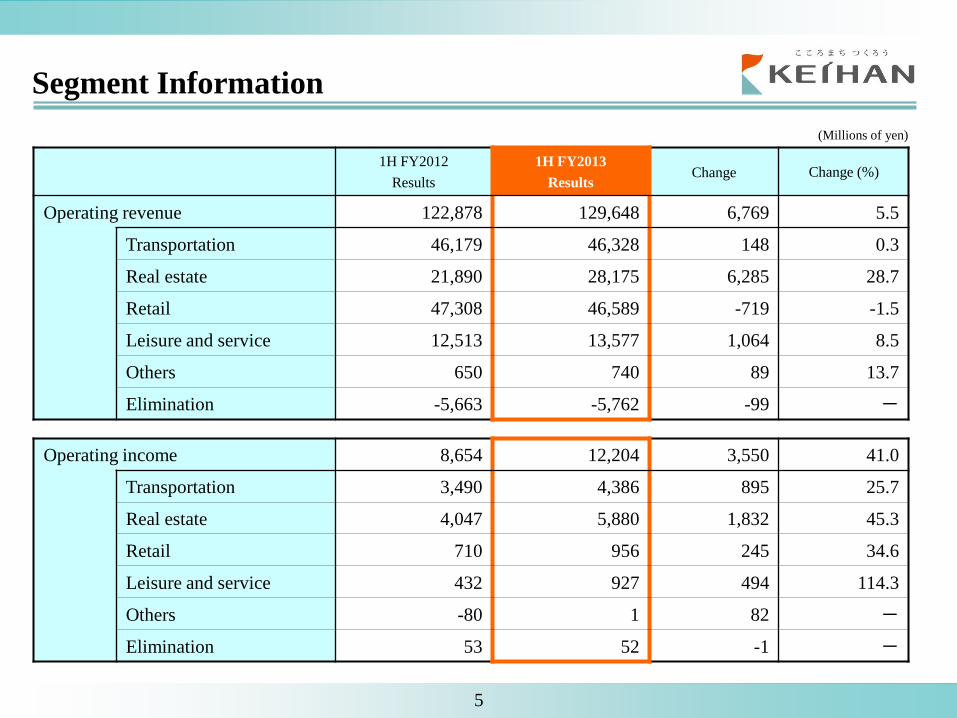
1H FY2012
Results
1H FY2013
Results Change Change (%)
Operating revenue 122,878 129,648 6,769 5.5
Transportation 46,179 46,328 148 0.3
Real estate 21,890 28,175 6,285 28.7
Retail 47,308 46,589 -719 -1.5
Leisure and service 12,513 13,577 1,064 8.5
Others 650 740 89 13.7
Elimination -5,663 -5,762 -99 -
Operating income 8,654 12,204 3,550 41.0
Transportation 3,490 4,386 895 25.7
Real estate 4,047 5,880 1,832 45.3
Retail 710 956 245 34.6
Leisure and service 432 927 494 114.3
Others -80 1 82 -
Elimination 53 52 -1 -
(Millions of yen)
5
Segment Information
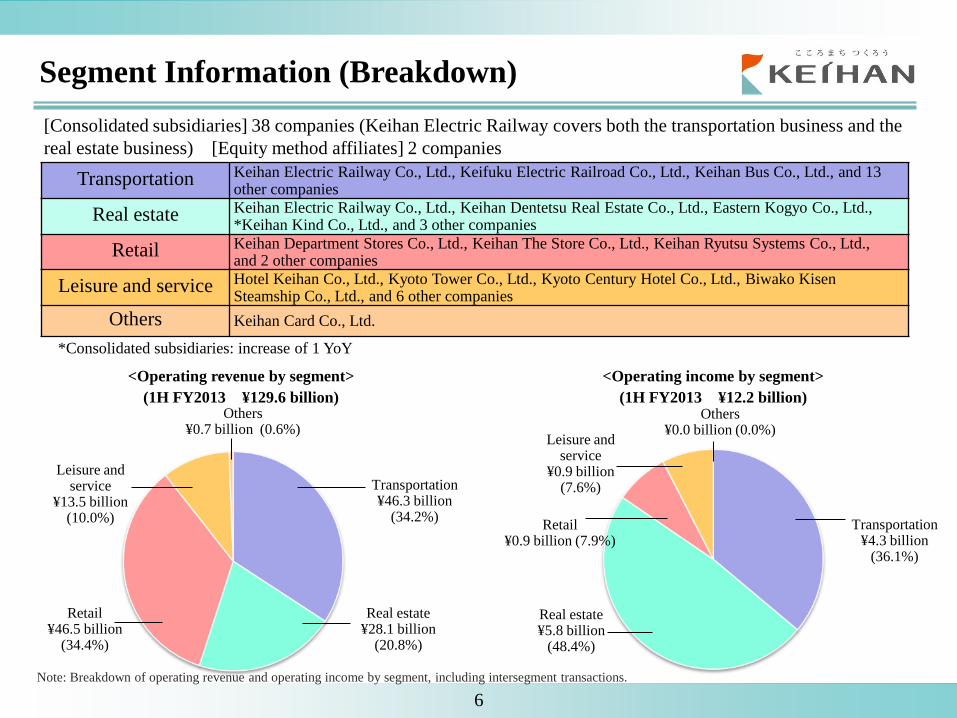
Segment Information (Breakdown)
6
[Consolidated subsidiaries] 38 companies (Keihan Electric Railway covers both the transportation business and the
real estate business) [Equity method affiliates] 2 companies
Transportation Keihan Electric Railway Co., Ltd., Keifuku Electric Railroad Co., Ltd., Keihan Bus Co., Ltd., and 13 other companies
Real estate Keihan Electric Railway Co., Ltd., Keihan Dentetsu Real Estate Co., Ltd., Eastern Kogyo Co., Ltd., *Keihan Kind Co., Ltd., and 3 other companies
Retail Keihan Department Stores Co., Ltd., Keihan The Store Co., Ltd., Keihan Ryutsu Systems Co., Ltd., and 2 other companies
Leisure and service Hotel Keihan Co., Ltd., Kyoto Tower Co., Ltd., Kyoto Century Hotel Co., Ltd., Biwako Kisen Steamship Co., Ltd., and 6 other companies
Others Keihan Card Co., Ltd.
<Operating revenue by segment>
(1H FY2013 ¥129.6 billion)
Transportation ¥46.3 billion
(34.2%)
Real estate ¥28.1 billion
(20.8%)
Retail ¥46.5 billion
(34.4%)
Leisure and service
¥13.5 billion (10.0%)
Others ¥0.7 billion (0.6%)
<Operating income by segment>
(1H FY2013 ¥12.2 billion)
Transportation ¥4.3 billion
(36.1%)
Real estate ¥5.8 billion
(48.4%)
Retail ¥0.9 billion (7.9%)
Leisure and service
¥0.9 billion (7.6%)
Others ¥0.0 billion (0.0%)
Note: Breakdown of operating revenue and operating income by segment, including intersegment transactions.
*Consolidated subsidiaries: increase of 1 YoY
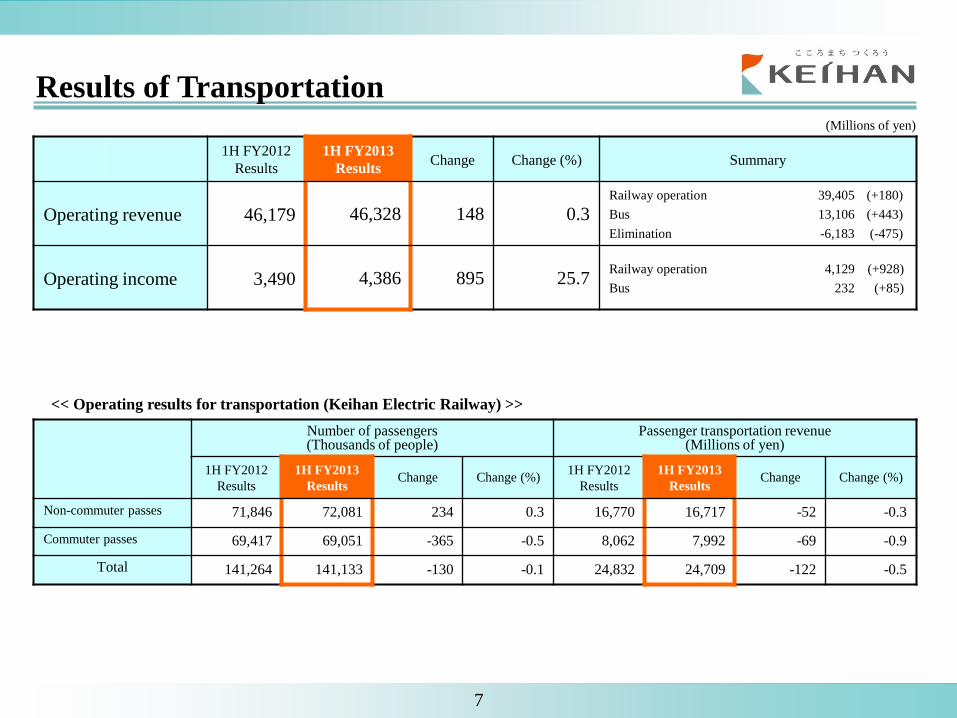
(Millions of yen)
1H FY2012
Results
1H FY2013
Results Change Change (%) Summary
Operating revenue 46,179 46,328 148 0.3 Railway operation 39,405 (+180)
Bus 13,106 (+443)
Elimination -6,183 (-475)
Operating income 3,490 4,386 895 25.7 Railway operation 4,129 (+928)
Bus 232 (+85)
Number of passengers (Thousands of people)
Passenger transportation revenue (Millions of yen)
1H FY2012
Results
1H FY2013
Results Change Change (%)
1H FY2012
Results
1H FY2013
Results Change Change (%)
Non-commuter passes 71,846 72,081 234 0.3 16,770 16,717 -52 -0.3
Commuter passes 69,417 69,051 -365 -0.5 8,062 7,992 -69 -0.9
Total 141,264 141,133 -130 -0.1 24,832 24,709 -122 -0.5
7
Results of Transportation
<< Operating results for transportation (Keihan Electric Railway) >>
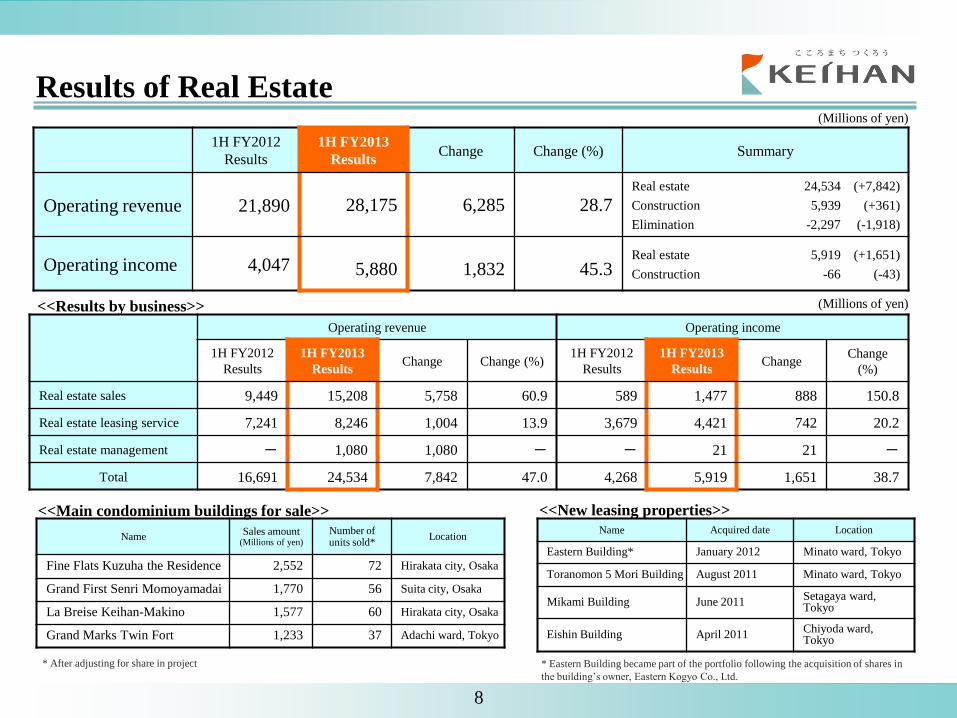
1H FY2012
Results
1H FY2013
Results Change Change (%) Summary
Operating revenue 21,890 28,175 6,285 28.7 Real estate 24,534 (+7,842)
Construction 5,939 (+361)
Elimination -2,297 (-1,918)
Operating income 4,047 5,880 1,832 45.3 Real estate 5,919 (+1,651)
Construction -66 (-43)
Name Sales amount
(Millions of yen)
Number of units sold*
Location
Fine Flats Kuzuha the Residence 2,552 72 Hirakata city, Osaka
Grand First Senri Momoyamadai 1,770 56 Suita city, Osaka
La Breise Keihan-Makino 1,577 60 Hirakata city, Osaka
Grand Marks Twin Fort 1,233 37 Adachi ward, Tokyo
Operating revenue Operating income
1H FY2012
Results
1H FY2013
Results Change Change (%)
1H FY2012
Results
1H FY2013
Results Change
Change
(%)
Real estate sales 9,449 15,208 5,758 60.9 589 1,477 888 150.8
Real estate leasing service 7,241 8,246 1,004 13.9 3,679 4,421 742 20.2
Real estate management - 1,080 1,080 - - 21 21 -
Total 16,691 24,534 7,842 47.0 4,268 5,919 1,651 38.7
(Millions of yen)
Name Acquired date Location
Eastern Building* January 2012 Minato ward, Tokyo
Toranomon 5 Mori Building August 2011 Minato ward, Tokyo
Mikami Building June 2011 Setagaya ward, Tokyo
Eishin Building April 2011 Chiyoda ward, Tokyo
8
Results of Real Estate
<<Results by business>>
<<Main condominium buildings for sale>>
<<New leasing properties>>
* Eastern Building became part of the portfolio following the acquisition of shares in
the building’s owner, Eastern Kogyo Co., Ltd.
(Millions of yen)
* After adjusting for share in project
1H FY2012
Results
1H FY2013
Results Change Change (%) Summary
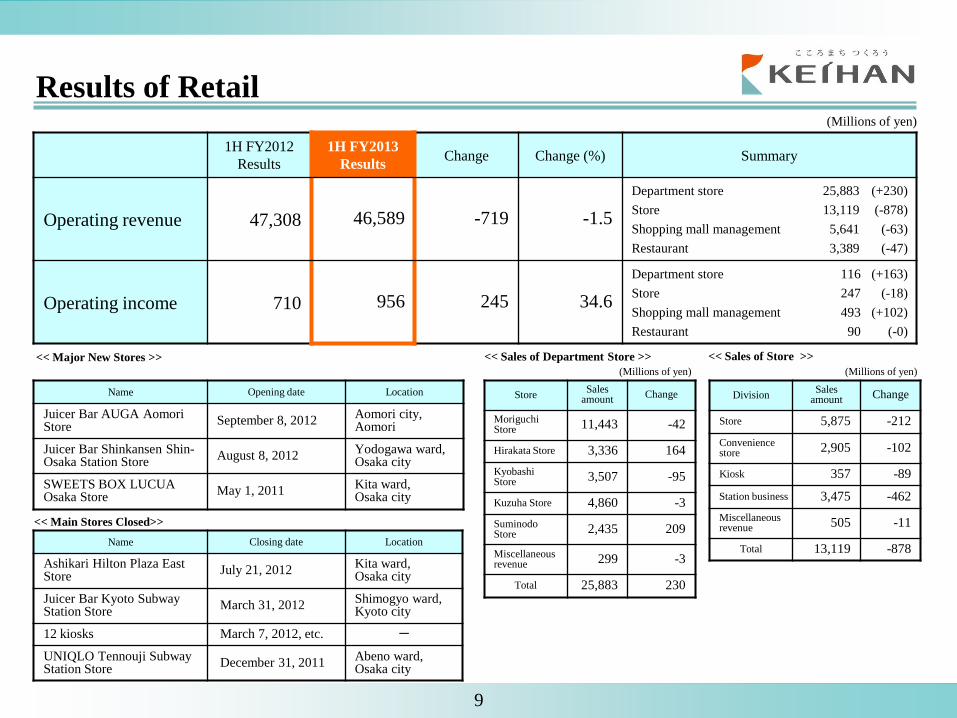
Operating revenue 47,308 46,589 -719 -1.5
Department store 25,883 (+230)
Store 13,119 (-878)
Shopping mall management 5,641 (-63)
Restaurant 3,389 (-47)
Operating income 710 956 245 34.6
Department store 116 (+163)
Store 247 (-18)
Shopping mall management 493 (+102)
Restaurant 90 (-0)
(Millions of yen)
Name Opening date Location
Juicer Bar AUGA Aomori Store
September 8, 2012 Aomori city, Aomori
Juicer Bar Shinkansen Shin-Osaka Station Store
August 8, 2012 Yodogawa ward, Osaka city
SWEETS BOX LUCUA Osaka Store
May 1, 2011 Kita ward, Osaka city
Store Sales
amount Change
Moriguchi Store 11,443 -42
Hirakata Store 3,336 164
Kyobashi Store 3,507 -95
Kuzuha Store 4,860 -3
Suminodo Store 2,435 209
Miscellaneous revenue 299 -3
Total 25,883 230
Division Sales
amount Change
Store 5,875 -212
Convenience store 2,905 -102
Kiosk 357 -89
Station business 3,475 -462
Miscellaneous revenue 505 -11
Total 13,119 -878
(Millions of yen) (Millions of yen)
9
Name Closing date Location
Ashikari Hilton Plaza East Store
July 21, 2012 Kita ward, Osaka city
Juicer Bar Kyoto Subway Station Store
March 31, 2012 Shimogyo ward, Kyoto city
12 kiosks March 7, 2012, etc. -
UNIQLO Tennouji Subway Station Store
December 31, 2011 Abeno ward, Osaka city
Results of Retail
<< Sales of Department Store >>
<< Main Stores Closed>>
<< Major New Stores >> << Sales of Store >>

1H FY2012
Results
1H FY2013
Results Change Change (%) Summary
Operating revenue 12,513 13,577 1,064 8.5 Hotel 11,053 (+1,108)
Leisure 2,602 (-36)
Operating income 432 927 494 114.3 Hotel 762 (+502)
Leisure 275 (+3)
(Millions of yen)
1H FY2012
Results
1H FY2013
Results Change
Number of
rooms Remarks
Hotel Keihan
Kyobashi 93.3% 91.6% -1.7pt 214
Temmabashi 81.4% 81.0% -0.4pt 317
Kyoto 91.4% 96.8% 5.4pt 286
Universal City 76.7% 82.5% 5.8pt 330
Universal Tower 75.6% 84.5% 8.9pt 641
Asakusa 84.9% 95.4% 10.5Pt 178
Sapporo 88.5% 93.1% 4.6pt 200
Biwako Hotel 79.1% 83.5% 4.4pt 171
Kyoto Tower
Kyoto Tower Hotel 90.4% 94.6% 4.2pt 158
Kyoto Dai-ni Tower Hotel 83.3% 86.4% 3.1pt 303
Kyoto Tower Hotel Annex 93.5% 96.4% 2.9pt 122
Kyoto Century Hotel 88.8% 91.1% 2.3pt 220 July 25, 2011 Acquisition of shares
Total - - - 3,140
10
Results of Leisure and Service
<< Hotel occupancy rates >>
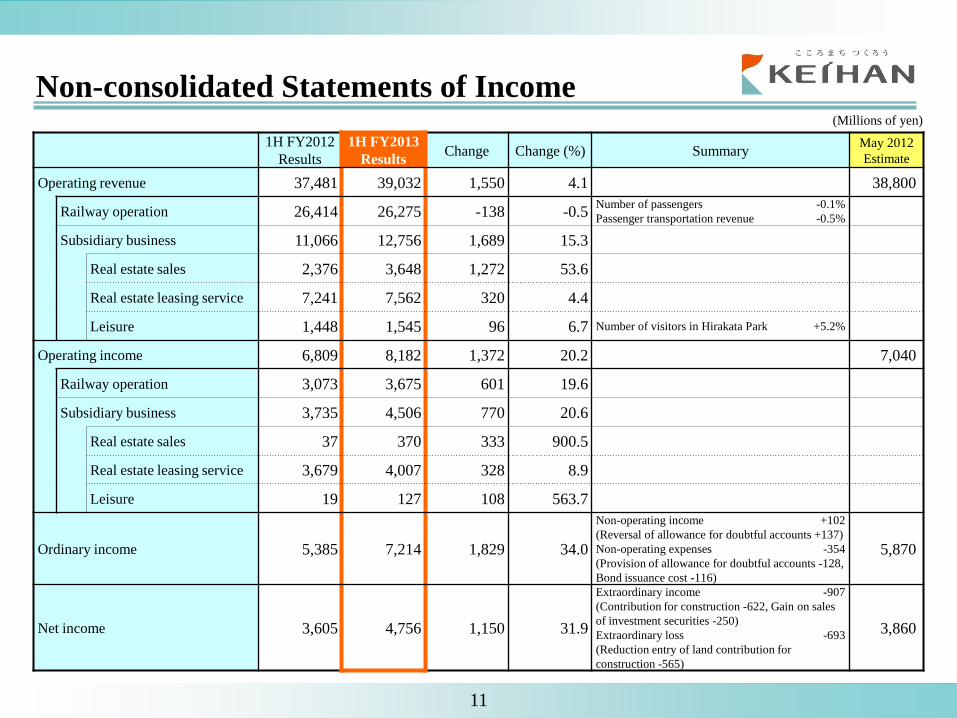
1H FY2012
Results
1H FY2013
Results Change Change (%) Summary
May 2012
Estimate
Operating revenue 37,481 39,032 1,550 4.1 38,800
Railway operation 26,414 26,275 -138 -0.5 Number of passengers -0.1%
Passenger transportation revenue -0.5%
Subsidiary business 11,066 12,756 1,689 15.3
Real estate sales 2,376 3,648 1,272 53.6
Real estate leasing service 7,241 7,562 320 4.4
Leisure 1,448 1,545 96 6.7 Number of visitors in Hirakata Park +5.2%
Operating income 6,809 8,182 1,372 20.2 7,040
Railway operation 3,073 3,675 601 19.6
Subsidiary business 3,735 4,506 770 20.6
Real estate sales 37 370 333 900.5
Real estate leasing service 3,679 4,007 328 8.9
Leisure 19 127 108 563.7
Ordinary income 5,385 7,214 1,829 34.0
Non-operating income +102
(Reversal of allowance for doubtful accounts +137)
Non-operating expenses -354
(Provision of allowance for doubtful accounts -128,
Bond issuance cost -116)
5,870
Net income 3,605 4,756 1,150 31.9
Extraordinary income -907
(Contribution for construction -622, Gain on sales
of investment securities -250)
Extraordinary loss -693
(Reduction entry of land contribution for
construction -565)
3,860
(Millions of yen)
11
Non-consolidated Statements of Income

FY2013 Forecasts
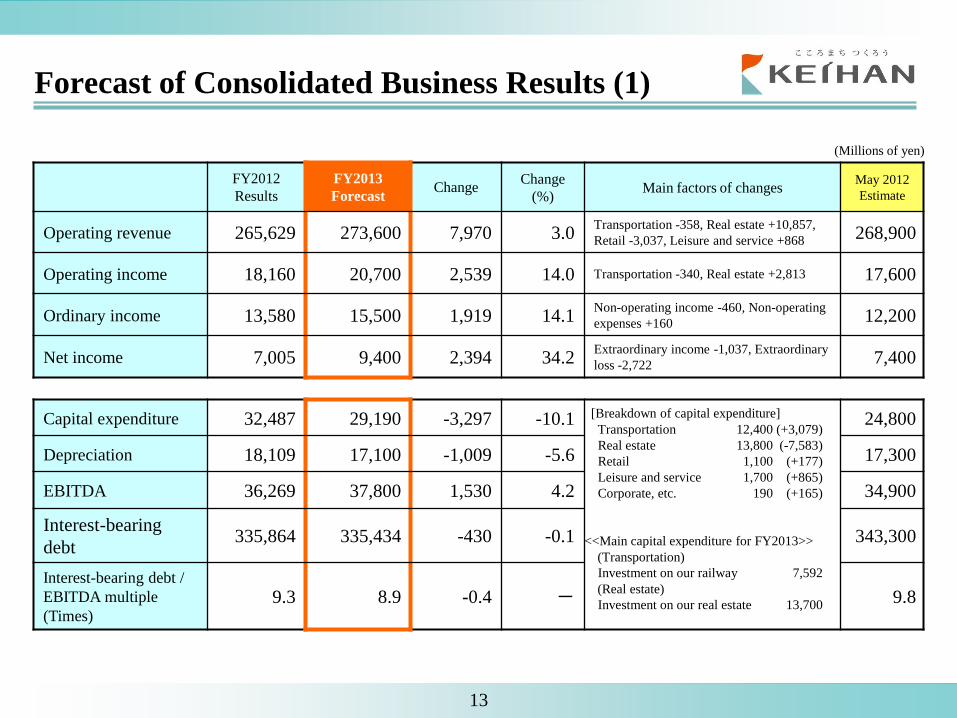
FY2012
Results
FY2013
Forecast Change
Change
(%) Main factors of changes
May 2012
Estimate
Operating revenue 265,629 273,600 7,970 3.0 Transportation -358, Real estate +10,857,
Retail -3,037, Leisure and service +868 268,900
Operating income 18,160 20,700 2,539 14.0 Transportation -340, Real estate +2,813 17,600
Ordinary income 13,580 15,500 1,919 14.1 Non-operating income -460, Non-operating
expenses +160 12,200
Net income 7,005 9,400 2,394 34.2 Extraordinary income -1,037, Extraordinary
loss -2,722 7,400
Capital expenditure 32,487 29,190 -3,297 -10.1 [Breakdown of capital expenditure]
Transportation 12,400 (+3,079)
Real estate 13,800 (-7,583)
Retail 1,100 (+177)
Leisure and service 1,700 (+865)
Corporate, etc. 190 (+165)
<<Main capital expenditure for FY2013>>
(Transportation)
Investment on our railway 7,592
(Real estate)
Investment on our real estate 13,700
24,800
Depreciation 18,109 17,100 -1,009 -5.6 17,300
EBITDA 36,269 37,800 1,530 4.2 34,900
Interest-bearing
debt 335,864 335,434 -430 -0.1 343,300
Interest-bearing debt /
EBITDA multiple
(Times)
9.3 8.9 -0.4 - 9.8
(Millions of yen)
13
Forecast of Consolidated Business Results (1)
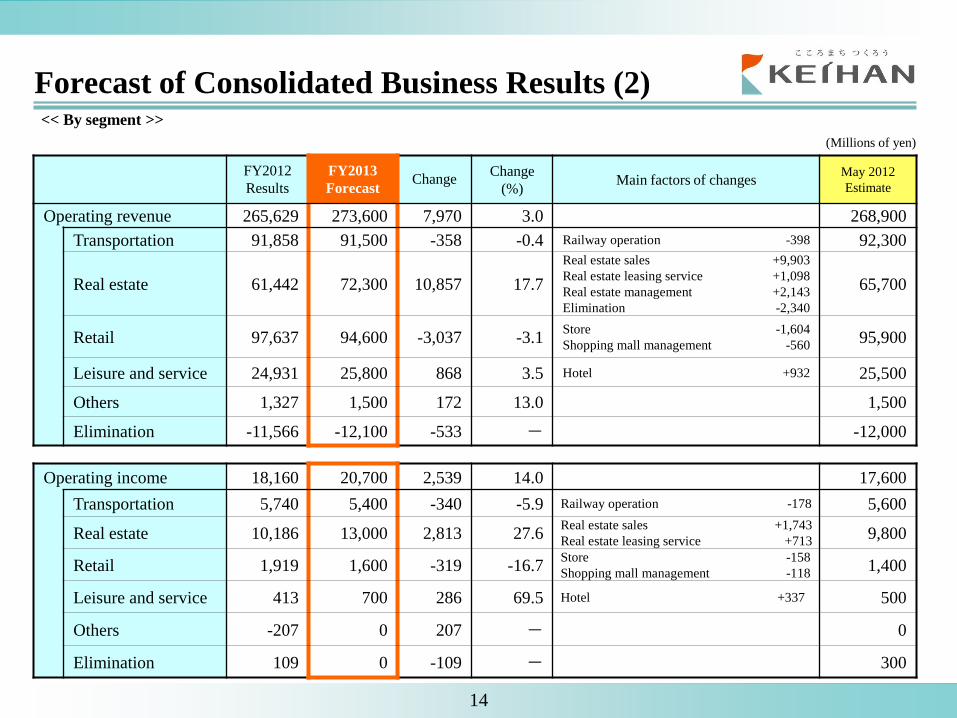
FY2012
Results
FY2013
Forecast Change
Change
(%) Main factors of changes
May 2012
Estimate
Operating revenue 265,629 273,600 7,970 3.0 268,900
Transportation 91,858 91,500 -358 -0.4 Railway operation -398 92,300
Real estate 61,442 72,300 10,857 17.7
Real estate sales +9,903
Real estate leasing service +1,098
Real estate management +2,143
Elimination -2,340
65,700
Retail 97,637 94,600 -3,037 -3.1 Store -1,604
Shopping mall management -560 95,900
Leisure and service 24,931 25,800 868 3.5 Hotel +932 25,500
Others 1,327 1,500 172 13.0 1,500
Elimination -11,566 -12,100 -533 - -12,000
Operating income 18,160 20,700 2,539 14.0 17,600
Transportation 5,740 5,400 -340 -5.9 Railway operation -178 5,600
Real estate 10,186 13,000 2,813 27.6 Real estate sales +1,743
Real estate leasing service +713 9,800
Retail 1,919 1,600 -319 -16.7 Store -158
Shopping mall management -118 1,400
Leisure and service 413 700 286 69.5 Hotel +337 500
Others -207 0 207 - 0
Elimination 109 0 -109 - 300
(Millions of yen)
14
Forecast of Consolidated Business Results (2) << By segment >>
(Millions of yen)
FY2012
Results
FY2013
Forecast Change Change (%) Main factors of changes
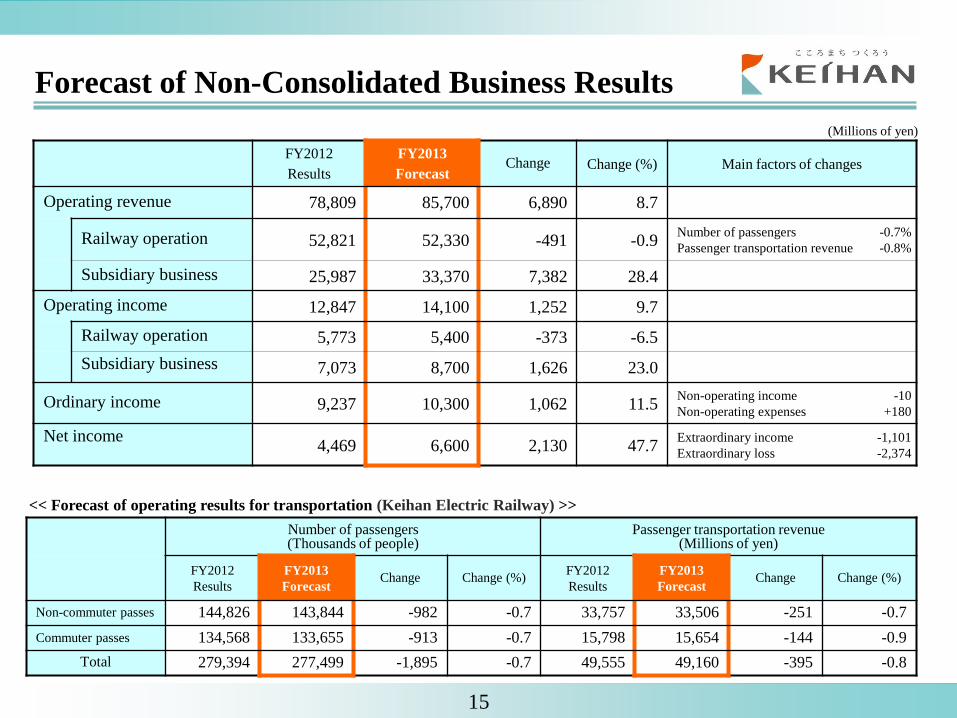
Operating revenue 78,809 85,700 6,890 8.7
Railway operation 52,821 52,330 -491 -0.9 Number of passengers -0.7%
Passenger transportation revenue -0.8%
Subsidiary business 25,987 33,370 7,382 28.4
Operating income 12,847 14,100 1,252 9.7
Railway operation 5,773 5,400 -373 -6.5
Subsidiary business 7,073 8,700 1,626 23.0
Ordinary income 9,237 10,300 1,062 11.5 Non-operating income -10
Non-operating expenses +180
Net income 4,469 6,600 2,130 47.7
Extraordinary income -1,101
Extraordinary loss -2,374
Number of passengers (Thousands of people)
Passenger transportation revenue (Millions of yen)
FY2012
Results
FY2013
Forecast Change Change (%)
FY2012
Results
FY2013
Forecast Change Change (%)
Non-commuter passes 144,826 143,844 -982 -0.7 33,757 33,506 -251 -0.7
Commuter passes 134,568 133,655 -913 -0.7 15,798 15,654 -144 -0.9
Total 279,394 277,499 -1,895 -0.7 49,555 49,160 -395 -0.8
15
Forecast of Non-Consolidated Business Results
<< Forecast of operating results for transportation (Keihan Electric Railway) >>
Progress of FY2013 Initiatives
TOPICS

Basic Policy
Building the foundations for a strong Keihan for the next 100 years
◆ Operating divisions
Create an efficient operating system through a radical review
of the business structure ・Overhaul business approaches
・Restructure and integrate businesses in the Group
・Exit unprofitable businesses or businesses with limited potential
◆ Administrative divisions
Achieve extensive efficiency gains through cost control
・Create a lean head office at Keihan Electric Railway by
reducing the size of administrative divisions
・Reduce costs in administrative divisions at Group companies
Strengthen the operating structure through
extensive efficiency gains
◆ Push ahead with site development
・Push ahead with the creation of highly livable areas by
developing strategic sites such as the KUZUHA MALL second-
stage development plan in order to ensure areas along our lines
continue to be chosen by the public well into the future
◆ Implement our Kyoto strategy
・Establish a position as the leading company in Kyoto
・Customers always associate Keihan with Kyoto
◆ Promote new businesses to develop areas along
rail lines
・Promote lifecycle support businesses
Revitalize areas along the
Keihan Railway lines
17
Keihan Group’s Medium-term Management Plan
(FY2013-2015)
Corporate Strategy

18
Revitalize areas along the Keihan Railway lines
<Kyoto and Otsu area>
[Implement our Kyoto strategy]
◆ Strengthen transportation network
Non-stop RAKU RAKU Keihan express service
Upgrade bus routes serving Kyoto Aquarium and sold special tickets
for the routes
◆ Enhance the value of Keihan Group facilities
Refurbish hotels, open new restaurants and implement other initiatives
◆ Revitalize areas along rail lines through a focus on local
communities
Hold events to mark the 100th anniversary of the opening of the
Otsu line
Hold events and operate trains with special designs that highlight
areas along rail lines
19
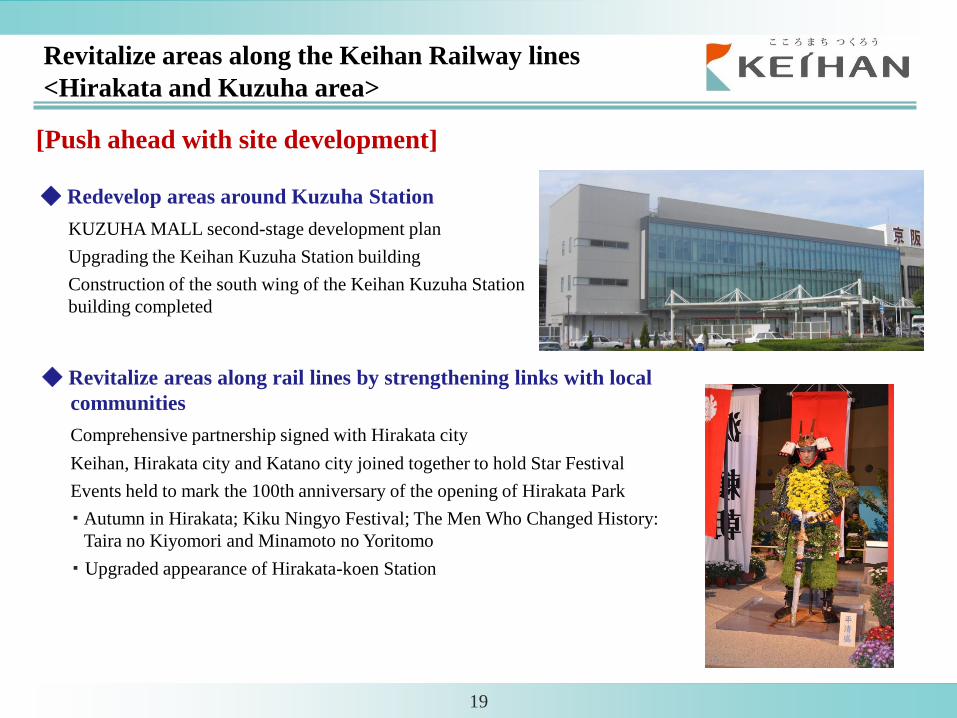
[Push ahead with site development]
◆ Redevelop areas around Kuzuha Station
KUZUHA MALL second-stage development plan
Upgrading the Keihan Kuzuha Station building
Construction of the south wing of the Keihan Kuzuha Station
building completed
◆ Revitalize areas along rail lines by strengthening links with local
communities
Comprehensive partnership signed with Hirakata city
Keihan, Hirakata city and Katano city joined together to hold Star Festival
Events held to mark the 100th anniversary of the opening of Hirakata Park
・ Autumn in Hirakata; Kiku Ningyo Festival; The Men Who Changed History:
Taira no Kiyomori and Minamoto no Yoritomo
・ Upgraded appearance of Hirakata-koen Station
Revitalize areas along the Keihan Railway lines
<Hirakata and Kuzuha area>

<Redevelopment plans for the Nakanoshima area>
Nov 2012: Nakanoshima Festival Tower
Festival Plaza retail facility opened in the tower
Feb 2013: Daibiru-Honkan Building
(22 aboveground floors, 2 underground floors)
Apr 2013: Festival Hall scheduled to open
Mar 2015: New Shin Daibiru Building (provisional name)
(31 aboveground floors, 2 underground floors)
Around 2018: Nakanoshima Festival Tower, second tower (West section)
<Events in Nakanoshima area>
Nakanoshima West Winter Story 2012 (Nov 28–Dec 25, 2012)
OSAKA Hikari-Renaissance 2012 (Dec 14–Dec 25, 2012)
<Kyobashi area>
Refurbishment of Hotel Keihan Kyobashi
Raibuza Kyobashi Theater opened in KiKi Kyobashi
20
(37 aboveground floors, 3 underground floors, 2 penthouse floors)
Revitalize areas along the Keihan Railway lines
<Nakanoshima and Kyobashi area>
[Revitalize areas along our lines ]
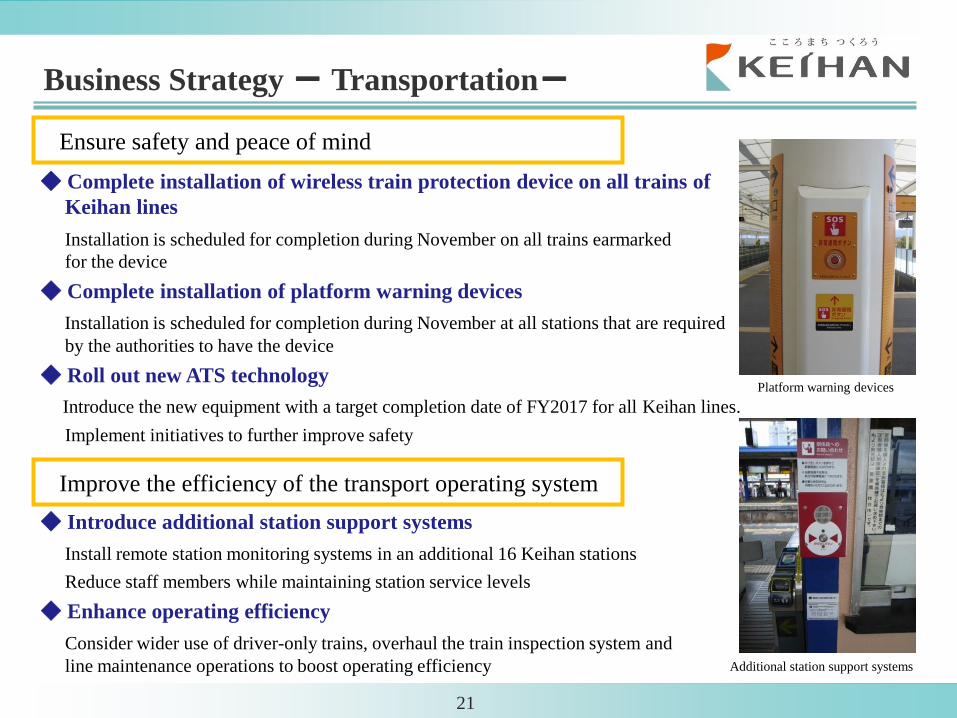
◆ Complete installation of wireless train protection device on all trains of
Keihan lines
Installation is scheduled for completion during November on all trains earmarked
for the device
◆ Complete installation of platform warning devices
Installation is scheduled for completion during November at all stations that are required
by the authorities to have the device
◆ Roll out new ATS technology
Introduce the new equipment with a target completion date of FY2017 for all Keihan lines.
Implement initiatives to further improve safety
21
Ensure safety and peace of mind
Improve the efficiency of the transport operating system
Platform warning devices
Additional station support systems
Business Strategy - Transportation-
◆ Introduce additional station support systems
Install remote station monitoring systems in an additional 16 Keihan stations
Reduce staff members while maintaining station service levels
◆ Enhance operating efficiency
Consider wider use of driver-only trains, overhaul the train inspection system and
line maintenance operations to boost operating efficiency
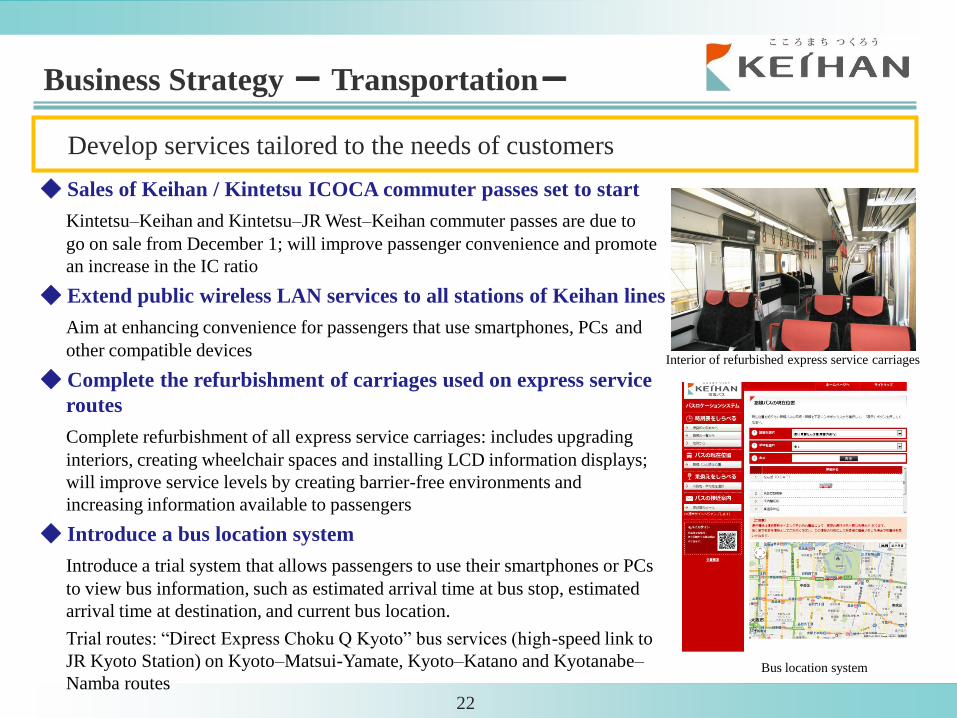
Develop services tailored to the needs of customers
Bus location system
Interior of refurbished express service carriages
Business Strategy - Transportation-
◆ Sales of Keihan / Kintetsu ICOCA commuter passes set to start
Kintetsu–Keihan and Kintetsu–JR West–Keihan commuter passes are due to
go on sale from December 1; will improve passenger convenience and promote
an increase in the IC ratio
◆ Extend public wireless LAN services to all stations of Keihan lines
Aim at enhancing convenience for passengers that use smartphones, PCs and
other compatible devices
◆ Complete the refurbishment of carriages used on express service
routes
Complete refurbishment of all express service carriages: includes upgrading
interiors, creating wheelchair spaces and installing LCD information displays;
will improve service levels by creating barrier-free environments and
increasing information available to passengers
◆ Introduce a bus location system
Introduce a trial system that allows passengers to use their smartphones or PCs
to view bus information, such as estimated arrival time at bus stop, estimated
arrival time at destination, and current bus location.
Trial routes: “Direct Express Choku Q Kyoto” bus services (high-speed link to
JR Kyoto Station) on Kyoto–Matsui-Yamate, Kyoto–Katano and Kyotanabe–
Namba routes
22
23
◆ Expand the condominium management and property management businesses
◆ Strategically replace portfolio assets and invest in real estate funds
Image of The Kourien Residence
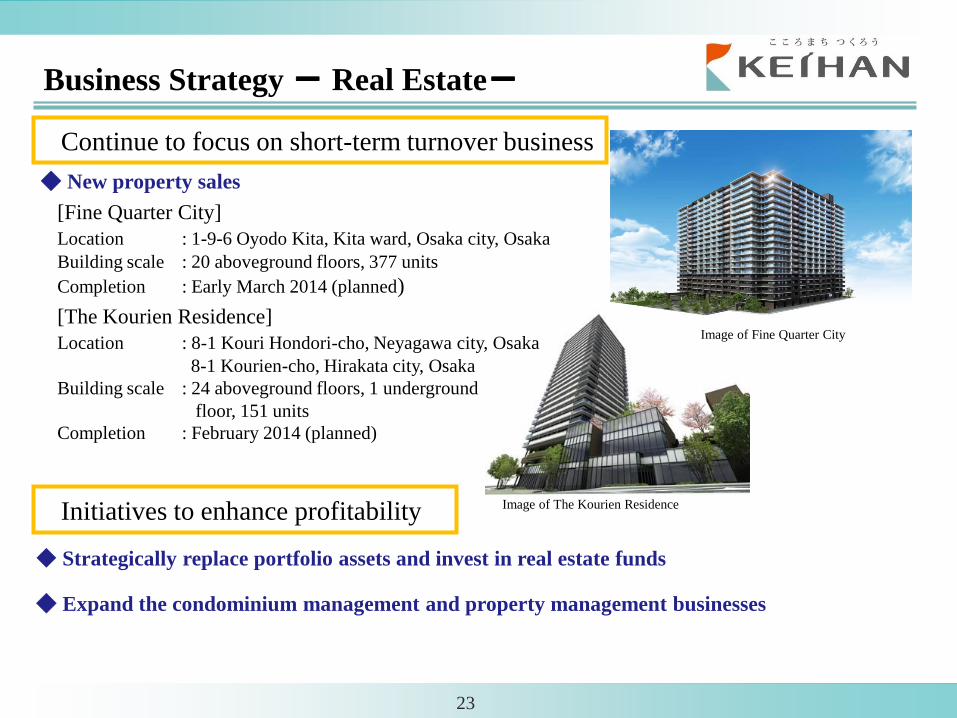
Continue to focus on short-term turnover business
Initiatives to enhance profitability
Image of Fine Quarter City
Business Strategy - Real Estate-
◆ New property sales
[Fine Quarter City]
Location : 1-9-6 Oyodo Kita, Kita ward, Osaka city, Osaka
Building scale : 20 aboveground floors, 377 units
Completion : Early March 2014 (planned)
[The Kourien Residence]
Location : 8-1 Kouri Hondori-cho, Neyagawa city, Osaka
8-1 Kourien-cho, Hirakata city, Osaka
Building scale : 24 aboveground floors, 1 underground
floor, 151 units
Completion : February 2014 (planned)
24
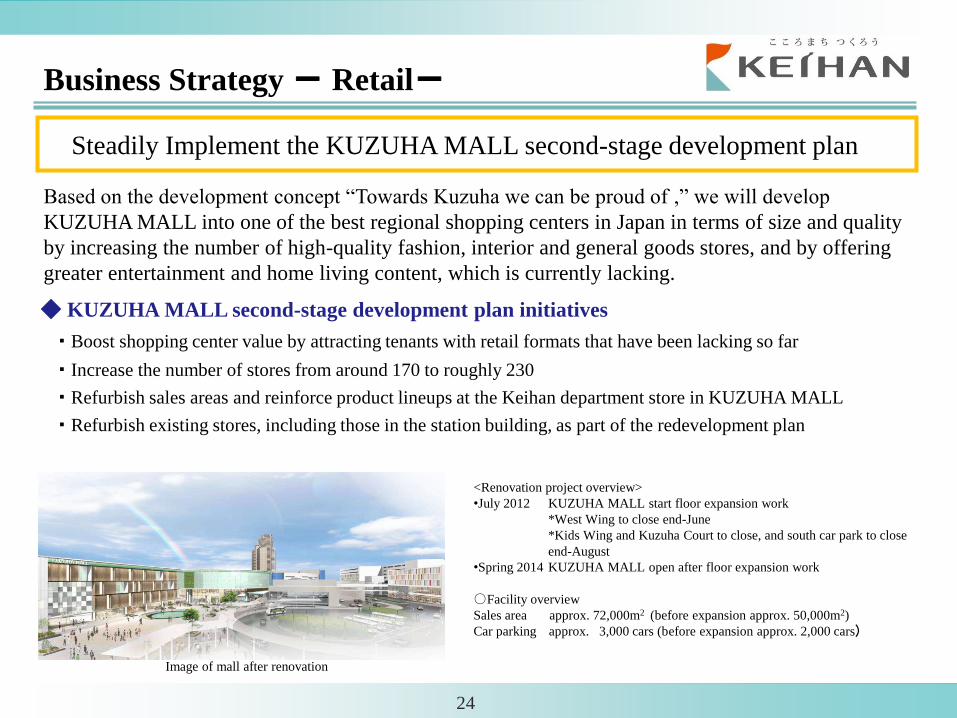
Steadily Implement the KUZUHA MALL second-stage development plan
Business Strategy - Retail-
Based on the development concept “Towards Kuzuha we can be proud of ,” we will develop
KUZUHA MALL into one of the best regional shopping centers in Japan in terms of size and quality
by increasing the number of high-quality fashion, interior and general goods stores, and by offering
greater entertainment and home living content, which is currently lacking.
◆ KUZUHA MALL second-stage development plan initiatives
・ Boost shopping center value by attracting tenants with retail formats that have been lacking so far
・ Increase the number of stores from around 170 to roughly 230
・ Refurbish sales areas and reinforce product lineups at the Keihan department store in KUZUHA MALL
・ Refurbish existing stores, including those in the station building, as part of the redevelopment plan
<Renovation project overview>
•July 2012 KUZUHA MALL start floor expansion work
*West Wing to close end-June
*Kids Wing and Kuzuha Court to close, and south car park to close
end-August
•Spring 2014 KUZUHA MALL open after floor expansion work
○Facility overview Sales area approx. 72,000m2 (before expansion approx. 50,000m2)
Car parking approx. 3,000 cars (before expansion approx. 2,000 cars)
Image of mall after renovation

Initiatives to enhance profitability
Raibuza Kyobashi Theater
Shapo Ichikawa Store Juicer Bar Shinkansen Shin-Osaka Store
Kiki Kyobashi
Business Strategy - Retail-
◆ Newly opened stores
[Juicer Bar]
・ Shinkansen Shin-Osaka Store (August 8)
・ AUGA Aomori Store (September 8)
・ Shapo Ichikawa Store (October 23)
[SWEETS BOX]
・ Shapo Ichikawa Store (October 23)
・ Shin-Akitsu Store (November 1)
=>First store in Kanto area
◆ Newly opened attractions
Raibuza Kyobashi Theater opened in KiKi
Kyobashi to stage live performances of popular
drama (November 3)
One of Japan’s largest popular drama theaters (460 seats)
Theater opened to revitalize the facility and the surrounding
Kyobashi area
◆ Target new orders in the property management business
25
26
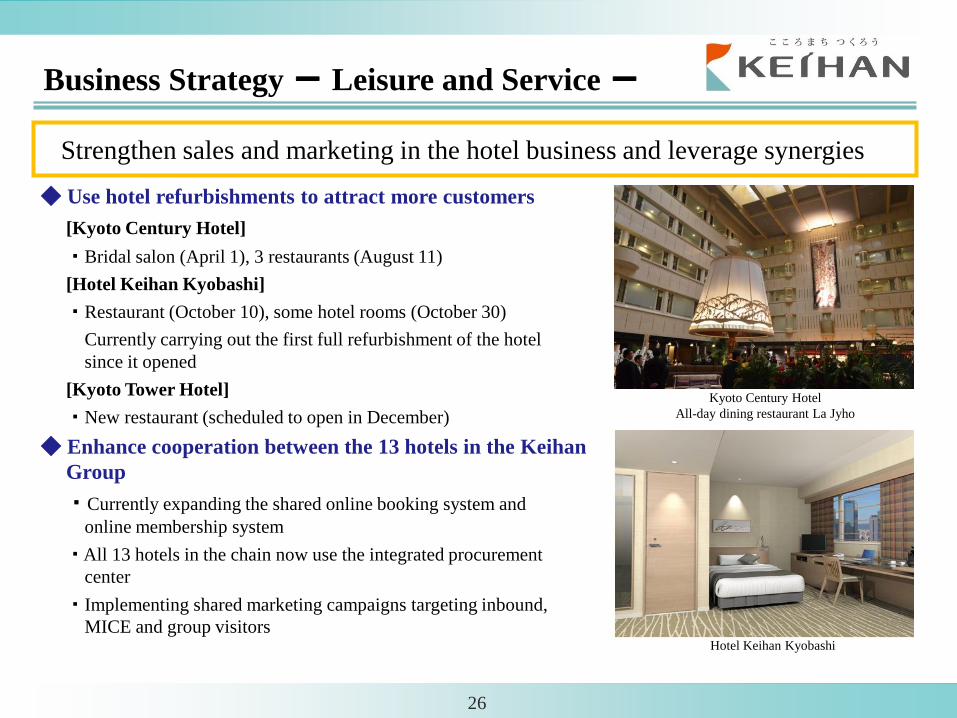
Strengthen sales and marketing in the hotel business and leverage synergies
Kyoto Century Hotel
All-day dining restaurant La Jyho
Hotel Keihan Kyobashi
Business Strategy - Leisure and Service -
◆ Use hotel refurbishments to attract more customers
[Kyoto Century Hotel]
・ Bridal salon (April 1), 3 restaurants (August 11)
[Hotel Keihan Kyobashi]
・ Restaurant (October 10), some hotel rooms (October 30)
Currently carrying out the first full refurbishment of the hotel
since it opened
[Kyoto Tower Hotel]
・ New restaurant (scheduled to open in December)
◆ Enhance cooperation between the 13 hotels in the Keihan
Group
・ Currently expanding the shared online booking system and
online membership system
・ All 13 hotels in the chain now use the integrated procurement
center
・ Implementing shared marketing campaigns targeting inbound,
MICE and group visitors