financial report half year ended 2017
12
Transcript of financial report half year ended 2017


contents
Directors' Report to the Shareholders
Condensed Interim Balance Sheet
Condensed Interim Profit and Loss Account
Condensed Interim Statement of Comprehensive Income
Condensed Interim Cash Flow Statement
Condensed Interim Statement of Changes in Equity
Notes to the Condensed Interim Financial Information
Company Information
2
4
6
7
8
9
11
18
Auditor's Report to the Members on Review of Condensed Interim Financial Information 3

2 3
Directors' Report to the ShareholdersThe Directors of the Company are pleased to submit the half-year report along with the reviewed condensed interim financial information of the company for the six months period ended June 30, 2017.
We are pleased with our value creation progress in the first half of 2017. This includes solid operational improvements as well as portfolio management choices. Profitability is in line with our expectations, as operational savings and efficiencies have offset higher commodity costs. We are accelerating our margin improvement initiatives.
The financial performance for the six months period is summarized below:
Operating Profit:We delivered an Operating Profit of 20.8% (+164bps). The increase is largely owing to improved gross margin, operational savings and effective cost management.
Net Profit after tax:Our Net Profit After Tax stood at PKR 7.9 billion, registering a strong growth of 23.6%.
Future Outlook:We will continue to have a positive outlook on growth and earnings, however we do foresee certain external developments namely currency risk, global commodities cost increases and fiscal budget pressures which could impact future results.
For and on behalf of the Board of Directors
BRUNO BORIS OLIERHOEKChief Executive
Lahore: August 22, 2017
Sales:The sales revenue grew by PKR 5.6 billion, yielded a growth of +10.0% largely driven by volume. Our export sales during the period stood at PKR 2.6 billion registering a growth of +10.7%.
Gross Profit:We delivered a Gross Margin of 38.3% (+89bps) on the back of improvement in product mix and optimization of the value cha in th rough Nes t lé Con t inuous Excellence (NCE) initiatives.
Sales
Operating Profit
% of sales
Net Profit after tax
% of sales
Earnings per share
Jan – Jun 2016
PKR Million
Jan – Jun 2017
PKR Million
Change
% of sales
Gross Profit
61,941
23,717
38.3%
12,881
20.8%
7,934
12.8%
174.95
56,296
21,057
37.4%
10,784
19.2%
6,421
11.4%
141.58
+ 10.0%
+12.6%
+ 19.4%
+ 23.6%
+ 23.6%
Introduction
We have reviewed the accompanying condensed interim balance sheet of Nestlé Pakistan Limited (“the Company”) as at June 30, 2017 and the related condensed interim profit and loss account, condensed interim statement of comprehensive income, condensed interim cash flow statement and condensed interim statement of changes in equity and notes to the accounts for the six month period then ended (here-in-after referred to as the “condensed interim financial information”). Management is responsible for the preparation and presentation of this condensed interim financial information in accordance with approved accounting standards as applicable in Pakistan for interim financial reporting. Our responsibility is to express a conclusion on this condensed interim financial information based on our review.
Scope of Review
We conducted our review in accordance with International Standard on Review Engagements 2410, "Review of Interim Financial Information Performed by the Independent Auditor of the Entity." A review of condensed interim financial information consists of making inquiries, primarily of persons responsible for financial and accounting matters, and applying analytical and other review procedures. A review is substantially less in scope than an audit conducted in accordance with International Standards on Auditing and consequently does not enable us to obtain assurance that we would become aware of all significant matters that might be identified in an audit. Accordingly, we do not express an audit opinion.
Conclusion
Based on our review, nothing has come to our attention that causes us to believe that the accompanying condensed interim financial information is not prepared, in all material respects, in accordance with approved accounting standards as applicable in Pakistan for interim financial reporting.
The figures for the three months period ended June 30, 2017 and June 30, 2016 in the condensed interim profit and loss account and condensed interim statement of comprehensive income have not been reviewed and we do not express a conclusion on them.
Auditor's Report to the Members on Review of Condensed Interim Financial Information
LahoreDate: August 22, 2017
KPMG Taseer Hadi & Co.Chartered Accountants(Bilal Ali)

Financed by:Share capital and reservesAuthorized capital75,000,000 (December 31, 2016: 75,000,000) ordinary shares of Rs 10 each
Issued, subscribed and paid-up capitalShare premiumGeneral reserve
Accumulated profit
(Un-audited)Jun. 30,
2017
(Audited)Dec. 31,
2016
Condensed Interim Balance SheetAs at June 30, 2017 (Un-audited)
Non-current assets
Property, plant and equipmentCapital work-in-progress
Intangible assetsLong term loans and advancesLong term deposits and prepayments
Current assetsStores and sparesStock in tradeTrade debts Current portion of long term loans and advancesSales tax refundable - netAdvances, deposits, prepayments and other receivablesCash and bank balances
4
Current liabilities
Current portion of long term financesShort term borrowings - secured Short term running finance under markup arrangements - secured
Note (Un-audited)Jun. 30,
2017
(Audited)Dec. 31,
2016
Customer security deposits - interest freeIncome tax - netTrade and other payablesInterest and mark-up accrued
Net working capitalTotal capital employed
Long term and deferred liabilitiesLong term finances - securedDeferred taxationRetirement benefits
Contingencies and commitmentsNet assets
750,000
453,496249,527280,000
7,839,1218,812,052
(10,092)
750,000
453,496249,527280,000
8,063,3899,042,937
(3,475)Hedging reserve
4 5
5
JOHN MICHAEL DAVISHead of Finance & Control
SYED YAWAR ALIChairmanChief Executive
BRUNO BORIS OLIERHOEK
28,046,1242,765,730
31,600338,449
32,046
1,308,32911,207,230
564,460
5,374,745661,325
24,920,599
33,027,347
(13,459,526)17,754,423
1,943,3431,361,555
8,942,371
8,812,052
1,458,740240,843
98,565
19,567,821
2,013,120
-
5,637,473
353,167
31,213,949
28,388,1111,864,418
27,566340,796
36,913
1,366,92817,147,5061,246,125
4,812,7383,217,948
25,718,093
40,423,501
(11,925,445)18,732,359
2,131,7311,281,601
9,689,422
9,042,937
2,303,758251,455
139,105
28,498,056
1,166,857
17,184
6,276,090
567,706
30,657,804
(Rupees in thousand) (Rupees in thousand)
The annexed notes 1 to 13 form an integral part of this condensed interim financial information.
4,345,15710,845,157
48,888120,997
26 7
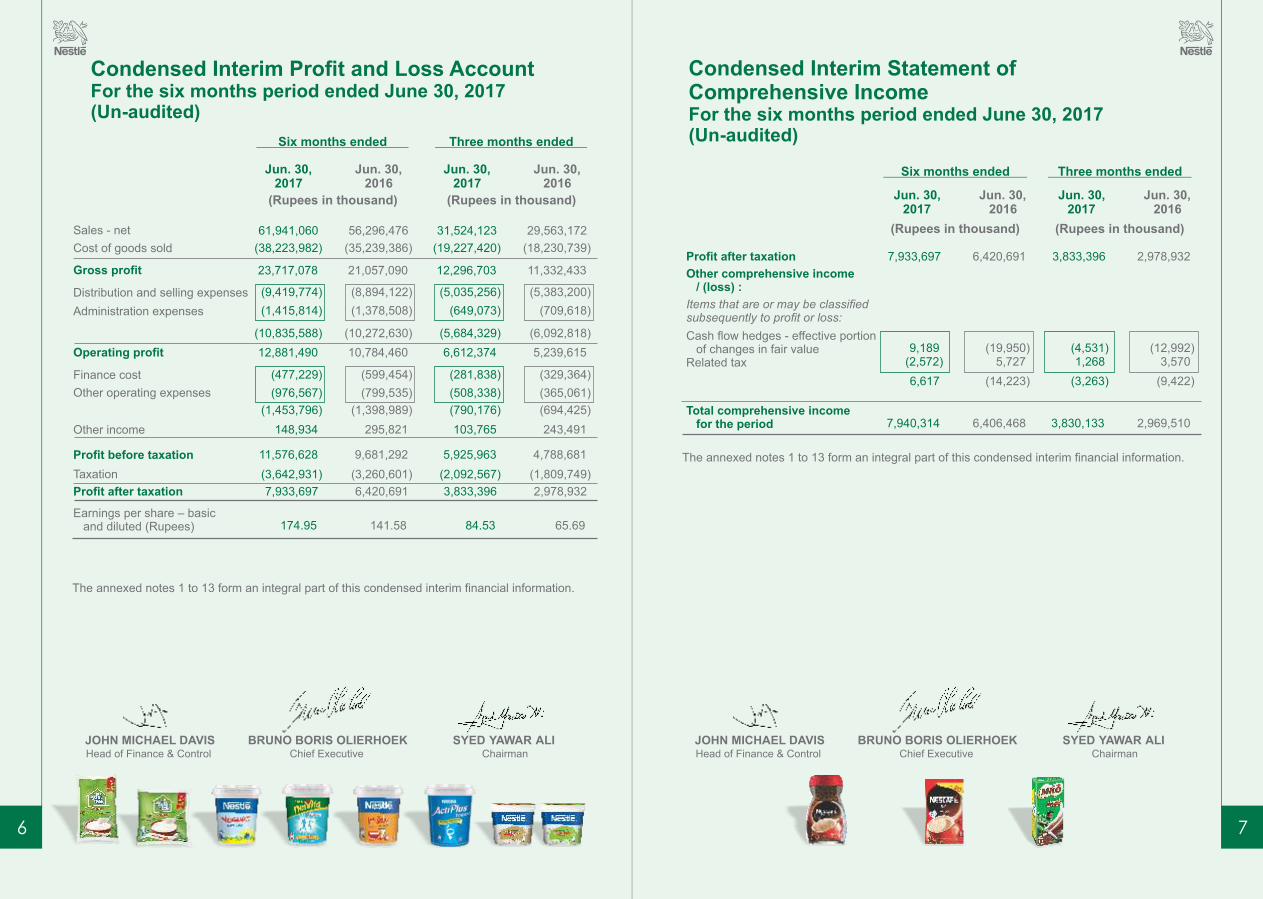
Condensed Interim Statement of Comprehensive IncomeFor the six months period ended June 30, 2017(Un-audited)
Condensed Interim Profit and Loss Account For the six months period ended June 30, 2017 (Un-audited)
Profit after taxation
Other comprehensive income / (loss) :
Items that are or may be classified subsequently to profit or loss:
Cash flow hedges - effective portion of changes in fair valueRelated tax
Total comprehensive income for the period
Jun. 30, 2017
Jun. 30, 2016
2,978,932
2,969,510
(12,992)3,570
JOHN MICHAEL DAVISHead of Finance & Control
SYED YAWAR ALIChairmanChief Executive
BRUNO BORIS OLIERHOEKJOHN MICHAEL DAVISHead of Finance & Control
SYED YAWAR ALIChairmanChief Executive
BRUNO BORIS OLIERHOEK
(9,422)
Sales - net
Cost of goods sold
Gross profit
Distribution and selling expenses
Administration expenses
Operating profit
Finance cost
Other operating expenses
Other income
Profit before taxation
Taxation
Profit after taxation
Earnings per share – basic and diluted (Rupees)
Jun. 30,2017
Jun. 30,2016
Three months ended
(19,227,420)
31,524,123
12,296,703
(5,035,256)
(649,073)
(5,684,329)
(281,838)
(508,338)
(790,176)
103,765
(2,092,567)
3,833,396
84.53
6,612,374
5,925,963
Three months ended
(18,230,739)
29,563,172
11,332,433
(5,383,200)
(709,618)
(6,092,818)
(329,364)
(365,061)
(694,425)
243,491
(1,809,749)
2,978,932
65.69
5,239,615
4,788,681
3,830,133
(4,531)1,268
(3,263)
3,833,396
(Rupees in thousand)
(Rupees in thousand)
The annexed notes 1 to 13 form an integral part of this condensed interim financial information.
The annexed notes 1 to 13 form an integral part of this condensed interim financial information.
Jun. 30,2017
Jun. 30,2016
Six months ended
(38,223,982)
61,941,060
23,717,078
(9,419,774)
(1,415,814)
(10,835,588)
(477,229)
(976,567)
(1,453,796)
148,934
(3,642,931)
7,933,697
174.95
12,881,490
11,576,628
(35,239,386)
56,296,476
21,057,090
(8,894,122)
(1,378,508)
(10,272,630)
(599,454)
(799,535)
(1,398,989)
295,821
(3,260,601)
6,420,691
141.58
10,784,460
9,681,292
(Rupees in thousand) Jun. 30, 2017
Jun. 30, 2016
6,420,691
6,406,468
(19,950)5,727
(14,223)
Six months ended
7,940,314
9,189(2,572)
6,617
7,933,697
(Rupees in thousand)

Cash flow from operating activities
Cash generated from operationsIncrease in long term loans and advances
Sales tax refundable - netRetirement and other benefits paidFinance cost paidIncome taxes paid
6
Note Jun. 30, 2017
Jun. 30, 2016
Condensed Interim Cash Flow StatementFor the six months period ended June 30, 2017(Un-audited)
Net cash generated from operating activities
Cash flow from investing activities
Cash flow from financing activities
Long term finances - netShort term borrowings - secured - netDividend paid
Fixed capital expenditureSale proceeds of property, plant and equipmentNet cash used in investing activities
Net cash used in financing activities
Net increase in cash and cash equivalentsCash and cash equivalents at beginning of the period
Cash and cash equivalents at end of the period
28
7,732,987(2,464)
(35,615)(119,927)
4,283,274
(627,043)450,746
(176,297)
(1,047,600)2,500,000
(4,068,402)
(2,616,002)
1,490,975(2,208,381)
(717,406)
(630,931)(2,670,974)
5,353,938(42,887)
562,007(206,710)
2,654,876
(1,172,022)125,880
(1,046,142)
655,8016,500,000
(7,703,733)
(547,932)
1,060,802(1,659,953)
(599,151)
(405,120)(2,612,097)
JOHN MICHAEL DAVISHead of Finance & Control
SYED YAWAR ALIChairmanChief Executive
BRUNO BORIS OLIERHOEK
7
(Rupees in thousand)
The annexed notes 1 to 13 form an integral part of this condensed interim financial information.
Increase in customer security deposits - interest free 9,51410,612
(Increase) / decrease in long term deposits and prepayments 684(4,867)
Co
nd
en
sed
In
teri
m S
tate
men
t o
f C
han
ges in
Eq
uit
y
Fo
r th
e s
ix m
on
ths p
eri
od
en
ded
Ju
ne 3
0, 2017 (
Un
-au
dit
ed
)
Ba
lance
as
at D
ece
mbe
r 31, 2015 (
audite
d)
Sh
are
cap
ital
Sh
are
pre
miu
m
453,4
96
249,5
27
To
tal c
om
pre
hensi
ve in
com
e for
the p
eriod:
Pro
fit a
fter
tax
Ca
shflo
w h
edges
- effect
ive p
ort
ion o
f ch
anges
in
fa
ir v
alu
e -
net
Cap
ital R
eserv
es
Ac
cu
mu
late
dp
rofi
tsTo
tal
11,6
52
,011
12
,63
7,7
62
Gen
era
lre
serv
e
280,0
00
Hed
gin
gre
serv
e
2,7
28
Reven
ue
Reserv
es
--
--
6,4
20
,69
16
,42
0,6
91
--
-(1
4,2
23)
(14
,22
3)
-
(14,2
23)
6,4
06
,46
86
,42
0,6
91
--
-
(Ru
pe
es
in
th
ou
sa
nd
)
9
Tra
nsa
ctio
ns
with
ow
ners
of th
e C
om
pany
r
eco
gniz
ed d
irect
ly in
equity
Fin
al d
ivid
end for
the y
ear
ended
D
ece
mber
31, 2015 (
Rs.
90 p
er
share
) -
--
-(4
,08
1,4
63
)(4
,08
1,4
63
)
453,4
96
249,5
27
13
,99
1,2
39
14
,96
2,7
67
280,0
00
(11,4
95)
Ba
lance
as
at Ju
ne 3
0, 2016 (
un-a
udite
d)
To
tal c
om
pre
hensi
ve in
com
e for
the p
eriod:
Pro
fit a
fter
tax
Ca
shflo
w h
edges
- effect
ive p
ort
ion o
f ch
anges
in
fa
ir v
alu
e -
net
Rem
easu
rem
ent lo
ss o
n e
mplo
yee
re
tirem
ent benefit
s-ne
t
--
--
5,4
26
,28
25
,42
6,2
82
--
-1,4
03
1,4
03
-
5,4
13
,43
05
,41
2,0
27
1,4
03
--
--
(14
,25
5)
(14
,25
5)

Notes to the Condensed Interim Financial Information For the six months period ended June 30, 2017(Un-audited)
11
1. Legal status and nature of business
Nestlé Pakistan Limited ("the Company") is a public limited company incorporated in Pakistan and its shares are quoted on the Pakistan Stock Exchange. The principal activity of the Company is manufacturing, purchase, processing and sale of food products including imported products (dairy, confectionery, culinary, coffee, beverages, infant nutrition and drinking water). Registered office of the Company is situated at Babar Ali Foundation Building, 308-Upper Mall, Lahore.
2. Basis of preparation
2.1 Statement of compliance
This condensed interim financial information is being submitted to the shareholders as required by section 237 of the Companies Act, 2017 (“the Act”) and is un-audited but subject to limited scope review by external auditors as required by the Act and Code of Corporate Governance.
On May 30, 2017 the Companies Act, 2017 was enacted which replaced and repealed the Companies Ordinance, 1984 (the "repealed Ordinance"). However, the Securities and Exchange Commission of Pakistan (SECP) vide its circular 17 dated July 20, 2017 and press release of the said date, has clarified that all the companies whose financial year, including quarterly and other interim period, closes on or before June 30, 2017, can prepare their financial statements in accordance with the provisions of the repealed Companies Ordinance, 1984. The Companies Act, 2017 requires certain additional disclosures which would be applicable for financial year ending after June 30, 2017.
This condensed interim financial information of the Company for the six months period ended June 30, 2017 has been prepared in accordance with the requirement of the International Accounting Standard 34 - "Interim Financial Reporting" and provisions of and directives issued under the repealed Companies Ordinance, 1984. In case where requirements differ, the provisions of or directives issued under the repealed Companies Ordinance, 1984 have been followed.
This condensed interim financial information does not include all of the information required for annual financial statements and should be read in conjunction with the annual financial statements as at and for the year ended December 31, 2016. Selected explanatory notes are included to explain events and transactions that are significant to and understanding of the changes in the Company’s financial position and performance since the last financial statements.
2.2 Judgments and estimates
The preparation of condensed interim financial information requires management to make judgments, estimates and assumptions for the application of accounting policies and the reported amounts of assets and liabilities, income and expenses. Actual results may differ from these estimates. In preparing this condensed interim financial information, the significant judgments made by the management in applying accounting policies and key sources of estimation were the same as those that were applied to the financial statements as at and for the year ended December 31, 2016, except as disclosed otherwise.
3. Significant accounting policies
3.1 The accounting policies and the methods of computation adopted in the preparation of this condensed interim financial information are same as those applied in the preparation of the
Sh
are
cap
ital
Sh
are
pre
miu
m
Cap
ital R
eserv
es
Accu
mu
late
dp
rofi
tsTo
tal
Gen
era
lre
serv
eH
ed
gin
gre
serv
e
Reve
nu
e
Reserv
es
(Ru
pe
es
in
th
ou
sa
nd
)
10
Cash
flow
hedges
- effect
ive p
ort
ion o
f ch
anges
in
Bala
nce
as
at Ju
ne 3
0, 2017 (
un-a
udite
d)
453,4
96
249,5
27
8,0
63
,38
99
,04
2,9
37
280,0
00
--
--
--
--
(3,4
75)
7,9
33
,69
77
,93
3,6
97
6,6
17
6,6
17
7,9
33
,69
77
,94
0,3
14
6,6
17
Tota
l com
pre
hensi
ve in
com
e for
the p
eriod:
Pro
fit a
fter
tax
fa
ir v
alu
e -
net
--
-
Th
e a
nnexe
d n
ote
s 1 t
o 1
3 form
an in
tegra
l part
of th
is c
ondense
d in
terim
financi
al i
nfo
rmatio
n.
SY
ED
YA
WA
R A
LI
Chairm
an
Chie
f E
xecu
tive
BR
UN
O B
OR
IS O
LIE
RH
OE
KJ
OH
N M
ICH
AE
L D
AV
ISH
ead o
f F
inance
& C
ontr
ol
Inte
rim
div
idend for
the s
ix m
onth
s period e
nded
Ju
ne 3
0, 2016 (
Rs.
70 p
er
share
) -
--
-(3
,17
4,4
72
)(3
,17
4,4
72
)
453,4
96
249,5
27
7,8
39
,12
18
,81
2,0
52
280,0
00
(10,0
92)
--
--
(11
,56
4,1
45
)(1
1,5
64
,14
5)
Ba
lance
as
at D
ece
mber
31, 2016 (
audite
d)
Inte
rim
div
idend for
the n
ine m
onth
s period e
nded
S
epte
mber
30, 2016 (
Rs.
185 p
er
share
) -
--
-(8
,38
9,6
73
)(8
,38
9,6
73
)
Tra
nsa
ctio
ns
with
ow
ners
of th
e C
om
pany
r
eco
gniz
ed d
irect
ly in
equity
Fin
al d
ivid
end for
the y
ear
ended
D
ece
mber
31, 2016
(R
s. 1
70 p
er
share
)-
--
-(7
,70
9,4
29
)(7
,70
9,4
29
)
Tra
nsa
ctio
ns
with
ow
ners
of th
e C
om
pany
r
eco
gniz
ed d
irect
ly in
equity

12 13
(Un-audited)Jun. 30,
2017
(Audited)Dec. 31,
2016
Contingencies and commitments
5.1 There is no material contingency as at balance sheet date.
Guarantees
Outstanding guarantees
Un-utilized portion of limits with banks
5.2
263,486
296,514
334,043
543,957
5.
(Rupees in thousand)
Commitments 5.3
5.3.1 The amount of future payments under Ijarah and the period in which these payments will become due are as follows:
Not later than one year
Later than one year but not later than five years
(Un-audited)Jun. 30,
2017
(Audited)Dec. 31,
2016
5.3.2 Commitments in respect of capital expenditure
Letters of creditOutstanding letters of credit
Un-utilized portion of limits with banks
41,925
13,164
55,089
2,480,350
7,111,680
34,467
-
34,467
3,993,708
6,866,692
5.4
275,7043,070,040
(Rupees in thousand)
Property, plant and equipment
Opening balance - net book valueAdditions during the period / year
Book value of property, plant and equipment disposed / scrapped during the period / yearDepreciation charged during the period / year
Impairment reversed during the period / yearFixed assets charged off
Closing balance - net book value
4.
(Un-audited)Jun. 30,
2017
(Audited)Dec. 31,
2016
29,996,0952,182,268
32,178,363
(428,019)
68,546(276,935)
28,046,124
28,046,1242,073,334
30,119,458
(63,808)
--
28,388,111
(3,495,831)(1,667,539)
(Rupees in thousand)
financial statements for the year ended December 31, 2016, except as mentioned in note 3.1.1 below.
3.1.1 The Company has changed its accounting policy for valuation of inventories i.e. for 'goods purchased for resale with effect from January 01, 2017. Previously, in recognising the consumption and valuation of goods purchased for resale, the Company used First In First Out (FIFO) basis, however, the Company has now adopted the weighted average basis for recognizing consumption and valuation as the management considers that this change gives a fair presentation of the results and financial position of the Company. This change in accounting policy has been applied prospectively in accordance with International Accounting Standard 8 (IAS-8) "Accounting Policies, Changes in Accounting Estimates and Errors" as resulting impact is considered to be immaterial.
3.2 There is no significant impact of new standards and amendments to standards, including any consequential amendments to other standards, with a date of initial application of January 01, 2017, as mentioned in the financial statements for the year ended December 31, 2016.
Profit before working capital changes
6. Cash generated from operations
Profit before taxationAdjustment for non-cash items: Depreciation on property, plant and equipment Fixed assets charged off Amortization of intangible assets (Reversal of)/ provision for stock in trade Provision for obsolete stores and spares Provision for workers' profit participation fund Provision for workers' welfare fund Gain on disposal of property, plant and equipment Reversal of impairment on property, plant and equipment Provision for doubtful debts and advances Unrealized exchange loss Exchange gain on foreign currency loan from
associated company Retirement and other benefits Finance cost
(Un-audited)Jun. 30,
2017
(Un-audited)Jun. 30,
2016
13,151,936
(150)
9,681,292
1,738,186276,935
4,03452,62595,106
520,627198,237
(108,403)(122,639)
21,786
14,732,778
-
11,576,628
1,667,539-
4,034(16,677)81,955
620,347209,967(62,072)
-
47,072
(Rupees in thousand)
8,890-
185,956126,756599,454477,229

1514
Beverages
OtherOperations Total
61,941,060-
61,941,060
1,671,572
12,881,490
(477,229)
(976,567)148,934
(3,642,931)
7,933,697
402,293-
402,293
36,007
(163,783)
14,628,488-
14,628,488
443,027
2,766,421
46,910,279-
46,910,279
1,192,538
10,278,852
Milk & NutritionProducts
Sales External sales Inter-segment sales Total revenue
Depreciation and amortizationOperating profit before tax and unallocated expenses
Unallocated corporate expenses: Finance cost Other operating expenses Other income TaxationProfit after taxation
(Rupees in thousand)
Other related partiesContribution to staff retirement benefit planRemuneration to key management personnel
All transactions with related parties have been carried out on commercial terms and conditions.
(Un-audited)Jun. 30,
2017
(Un-audited)Jun. 30,
2016
Associated companies: Royalty and technical assistance fee Purchase of assets, goods, services and rental Interest on foreign currency loan Repayment of foreign currency loan Sales of goods Insurance claims received Donations
328,2032,190,203
13,296
1,585,3137,309,040
7,9841,047,600
24,025
362,2192,368,299
22,480
1,761,1127,758,860
--
33,514
(Rupees in thousand)
Effect on cash flow due to working capital changes:Increase in current assets: Stores and spares Stock in trade Trade debts Advances, deposits, prepayments and other receivables(Decrease) / increase in current liabilities: Trade and other payables
(6,333,837)(448,003)(642,763)
2,151,823
(5,418,949)
7,732,987
(146,169)(5,923,599)
(681,665)(2,562,290)
(70,732)
(9,378,840)
5,353,938
(140,554)
7. Cash and cash equivalents
Cash and bank balancesShort term running finances - secured
268,624(986,030)
(717,406)
567,706(1,166,857)
(599,151)
Transactions with related parties8.
Related parties comprise of Nestlé S.A (holding company), its subsidiaries and associates, and other companies with common directors that of the Company, employees retirement benefit funds and key management personnel. Significant transactions with related parties are summarized as follows:
(Un-audited)Jun. 30,
2017
(Un-audited)Jun. 30,
2016
(Rupees in thousand)
2,5002,500
9. Segment reporting
Segment information is presented in respect of the Company's business. The primary format, business segment, is based on the Company's management reporting structure.
Segment results, assets and liabilities include items directly attributable to a segment as well as those that can be allocated on a reasonable basis. Unallocated assets and liabilities include short term and long term borrowings, employees retirement benefits and other operating liabilities.
Segment capital expenditure is the total cost incurred during the period to acquire segment assets that are expected to be used for more than one year.
The Company's operations comprise of the following main business segments:
- Milk and nutrition products
- Bevrages
These segments comprise of following major types of products:
- Milk and nutrition products
Milk based products and cereals
- Beverages
Juices & water
9.1 Segment analysis for the six months ended June 30, 2017 (Un-audited)

16 17
JOHN MICHAEL DAVISHead of Finance & Control
SYED YAWAR ALIChairmanChief Executive
BRUNO BORIS OLIERHOEK
10. Financial risk management
The Company's financial risk management objective and policies are consistent with that disclosed in the audited financial statements of the Company for the year ended December, 31 2016.
There is no change in the nature and corresponding hierarchies of fair valuation levels of financial instruments from those as disclosed in the audited financial statements of the Company for the year ended December 31, 2016.
11. Date of authorization for issue
This un-audited condensed interim financial information was authorized for issue on August 22, 2017 by the Board of Directors.
12. Dividend
The Board of Directors in their meeting held on August 22, 2017 have proposed an interim cash dividend for the six months period ended June 30, 2017 of Rs. 170 per share (June 30, 2016: Rs. 70 per share) per share, amounting to Rs. 7,709.43 million (June 30, 2016 : Rs. 3,174.47 million). This condensed interim financial information does not reflect this dividend.
13. General
This condensed interim financial information is presented in Pakistan rupees which is the Company's functional currency and the figures have been rounded off to the nearest thousand of rupee.
Corresponding figures have been re-arranged and re-classified, wherever necessary, for the purposes of comparison and better presentation as per reporting framework, however no material reclassification has been made.
As at June 30, 2017 (Un-audited)
As at December 31, 2016 (Audited)
Segment assets
Segment assets
Unallocated assets
Unallocated assets
Total assets
Total assets
Segment liabilities
Segment liabilities
Unallocated liabilities
Unallocated liabilities
Total liabilities
Total liabilities
Beverages
OtherOperations Total
50,040,654
43,923,472
9,115,206
6,858,298
59,155,860
50,781,770
25,942,730
25,161,442
50,112,923
41,969,718
558,015
482,510
166,859
160,175
12,103,078
11,927,256
6,318,909
5,360,924
37,379,561
31,513,706
19,456,962
19,640,343
Milk & NutritionProducts
24,170,193
16,808,276
Reportable segment assets and liabilities
(Rupees in thousand)
(Un-audited)Jun. 30,
2017
(Un-audited)Jun. 30,
2016
9.2 Geographical segments
Sales are made by the Company in following countries:
Pakistan Afghanistan Other foreign countries
53,956,1732,315,771
24,532
56,296,476
59,350,5032,525,462
65,095
61,941,060
(Rupees in thousand)
The company manages and operates manufacturing facilities and sales offices in Pakistan only.
Beverages
OtherOperations Total
56,296,476-
56,296,476
1,742,220
10,784,460
(599,454)
(799,535)295,821
(3,260,601)
6,420,691
356,227-
356,227
36,466
(232,209)
12,662,975-
12,662,975
448,945
1,808,854
43,277,274-
43,277,274
1,256,809
9,207,815
Milk & NutritionProducts
Sales External sales Inter-segment sales Total revenue
Depreciation and amortizationOperating profit before tax and unallocated expenses
Unallocated corporate expenses: Finance cost Other operating expenses Other income TaxationProfit after taxation
Segment analysis for the six months ended June 30, 2016 (Un-audited)
(Rupees in thousand)

COMPANY INFORMATION
Board ofDirectors
Company Secretary
Ali Sadozai
Management
Syed Yawar AliBruno Boris OlierhoekSyed Babar AliSyed Hyder AliOsman Khalid WaheedJohn Michael DavisJuan Jose Aranols CampilloNaveed Ahmad KhanJohn Martin Miller
ChairmanChief Executive / Managing DirectorDirectorDirectorDirectorDirectorDirectorDirectorDirector
General Counsel
Abdullah Jawaid AhmadAkmal SaeedAli Sadozai Arsalan Ul Haq Khan
Jason Avancena Babar Hussain KhanBruno Boris OlierhoekFuad Saqib Ghazanfar
Humaira AsharJohn Michael DavisKhurram Zia
Muhammad Nauman KhanNaveed Ahmad Khan
Usman Iqbal Bhatti
Rustem OguzSamra MaqboolSheikh Waqar AhmadSyeda Nausheen Iqbal Jaffery
Haseeb Aslam
Business Executive Officer - Chilled DairyHead of Human ResourcesHead of Legal Affairs & Company SecretaryHead of SalesBusiness Excellence Officer – Infant NutritionBusiness Executive Officer - JuicesManaging DirectorBusiness Executive Officer - Food, Coffee, CPW
Market Innovation LeadHead of Finance and ControlsBusiness Executive Officer - Nestlé Waters PakistanBusiness Executive Officer - Nestlé ProfessionalHead of Technical
Business Executive Officer - Dairy Nutrition Solution
Head of Supply ChainHead of Communication and Marketing ServicesHead of Corporate AffairsMarket Business Excellence Manager
Registered & CorporateOffice
308 – Upper Mall, Lahore – 54000, Pakistan.PABX : (042) 111 637 853Fax (042) 35789303 - 4 :
304 – Upper Mall, Lahore – 54000, Pakistan.309 – Upper Mall, Lahore – 54000, Pakistan. 309-A – Upper Mall, Lahore – 54000, Pakistan.
CorporateOffice Annex
18 19
Auditors
Share Registrar / Transfer Agent
LegalAdvisor
Bankers
KPMG Taseer Hadi & Co. (Chartered Accountants)
Chima & IbrahimAdvocates Corporate Counsel
Conventional banking relationsAllied Bank Limited Citibank N.ADeutsche Bank A.G.Habib Bank LimitedMCB Bank LimitedMeezan Bank LimitedNational Bank of Pakistan LimitedStandard Chartered Bank (Pakistan) LimitedUnited Bank LimitedTameer Microfinance Bank Limited
Islamic banking relationsMeezan Bank LimitedStandard Chartered Bank (Pakistan) LimitedHabib Bank Limited
10 Kilometer, Khanewal - Kabirwala Road, KabirwalaDistrict Khanewal, Punjab, Pakistan.Phone: (065) 111 637 853 Fax: (065) 2411432
29 Kilometer, Lahore – Sheikhupura RoadSheikhupura, Punjab, Pakistan.Phone: (056) 3406615 - 25
Factories Sheikhupura
Kabirwala
Plot No. A – 23, North Western Industrial Zone,Port Qasim, Karachi, Pakistan. Phone: (021) 34720151-4
Karachi
Plot No. 32, Sector (I-10/3), Industrial Area,Islamabad, Pakistan.Phone: (051) 4445997
Islamabad
Share Registrar DepartmentCentral Depository Company of Pakistan LimitedCDC-House, 99-B, Block-B, SMCHS, Main Shahra – e- Faisal Karachi-74400, Tel: Customer Support Services (Toll Free) 0800-CDCPL(23275)Fax: (92-21) 34326053 E-mail: [email protected] website: www.cdcpakistan.com Public dealings: : Monday to Friday: 09:00 am to 07:00 pmSaturday: 09:00 am to 01:00 pm
Business Executive Officer - Family Dairy