Interim Report First quarter 2018 - ds-norden.com · ANNOUNCEMENT NO. 8 – 2 ... Net...
24
DAMPSKIBSSELSKABET NORDEN A/S 52, STRANDVEJEN, DK-2900 HELLERUP, DENMARK WWW.DS-NORDEN.COM CVR NUMBER 67758919 ANNOUNCEMENT NO. 8 – 2 MAY 2018 1/24 Interim Report First quarter 2018
-
Upload
nguyennhan -
Category
Documents
-
view
213 -
download
0
Transcript of Interim Report First quarter 2018 - ds-norden.com · ANNOUNCEMENT NO. 8 – 2 ... Net...
DAMPSKIBSSELSKABET NORDEN A/S 52, STRANDVEJEN, DK-2900 HELLERUP, DENMARK WWW.DS-NORDEN.COM CVR NUMBER 67758919
ANNOUNCEMENT NO. 8 – 2 MAY 2018
1/24
Interim Report First quarter 2018

ANNOUNCEMENT NO. 8 – 2 MAY 2018
2/24
INTERIM REPORT
First quarter 2018
Results Markets Performance Vessel values Guidance
Adjusted result* for Q1 2018: USD 9 million (Q1 2017: USD 1 million) • Dry Operator: USD 3 million
• Dry Owner: USD 5 million
• Tankers: USD 0 million (USD 10 million)
EBIT Q1 2018: USD 18 million (USD 0 million) * ”Profit/loss for the period” adjusted for “Profit from sale of vessels etc.”
• Dry Cargo: Normal seasonal weakening of dry cargo market at rate levels higher than recent years
• Tankers: Disappointing winter market
• Dry Operator: Positive result and investment in positioning of vessels
• Dry Owner: 2 vessels sold, 3 newbuildings delivered and T/C portfolio further expanded
• Tankers: TCE earnings 7% above benchmark – short-term capacity further increased
• Dry Cargo: +1%
• Tankers: -2%
Expectations for the adjusted result for the year maintained at USD 10 to 50 million.
GOOD START TO THE YEAR ”The Dry Operator business unit continued to deliver a profitable performance in a first quarter market characterised by seasonal weakening. In addition to profit taking in regional markets, Dry Operator invested in positioning of vessels into the Atlantic, which we will benefit from in the second quarter. The Tanker business once again outperformed the market generating a break-even result, and NORDEN maintains the full-year expectations despite increased uncertainty for demand growth due to rising global trade tensions. With low fleet growth and agile business units, NORDEN is well positioned to make the most of the markets regardless of this.”
CEO Jan Rindbo
A telephone conference will be held today at 3:30 p.m. (CET), where CEO Jan Rindbo and CFO Martin Badsted will comment on the interim report. It is requested that all participants have joined the meeting by latest 3:25 p.m. (CET) – international participants please dial in on +44 (0)330 336 9411 or +1 929 477 0448, Danish participants please dial in on +45 3515 8121. The telephone conference will be shown live at www.ds-norden.com, where the accompanying presentation also will be available. For further information: CEO Jan Rindbo, tel. +45 3315 0451.

ANNOUNCEMENT NO. 8 – 2 MAY 2018
3/24
THE GROUP
Key figures and ratios for NORDEN
2018 2017 2017 2018 2017 2017 USD million Q1 Q1 Q1-Q4 USD million Q1 Q1 Q1-Q4
INCOME STATEMENT Revenue 591.2 440.2 1,808.6 SHARE RELATED KEY FIGURES Contribution margin 31.8 20.7 116.7 AND FINANCIAL RATIOS:
EBITDA 17.1 10.3 68.1 Number of shares of DKK 1 each
Profit/loss from the sale (including treasury shares) 42,200,000 42,200,000 42,200,000 of vessels, etc., net 9.2 -0.2 0.9 Number of shares of DKK 1 each
Depreciation, amortisation and (excluding treasury shares) 40,467,615 40,467,615 40,467,615 impairment loss, net -10.5 -10.6 -42.2 Number of treasury shares 1,732,385 1,732,385 1,732,385
Profit from operations (EBIT) 18.4 0.1 23.3 Earnings per share (EPS)(DKK) 0.44 (3) 0.00 (0) 0.61 (4)
Profit for the period 18.0 0.7 24.6 Diluted earnings per share
Adjusted result for the period* 8.8 0.9 28.4 (diluted EPS) (DKK) 0.44 (3) 0.00 (0) 0.61 (4)
Book value per share (excluding 2018 2017 2017 treasury shares) (DKK) 1) 21.0 (126) 19.6 (136) 19.8 (123)
31/3 31/3 31/12 Share price at end of period, DKK 108.3 141.2 116.5 Price/book value (DKK) 1) 0.86 1.04 0.90
STATEMENT OF FINANCIAL POSITION
Total assets 1,310.8 1,280.8 1,326.5 OTHER KEY FIGURES AND FINANCIAL RATIOS:
Equity 849.6 792.6 834.4 EBITDA-ratio 2) 2.9% 2.4% 3.8%
Liabilities 461.2 488.2 492.1 ROIC 2.8% 0.0% 2.9%
Invested capital 891.4 739.7 836.7 ROE 2.8% 0.1% 3.0%
Net interest-bearing assets -41.8 52.8 -2.3 Equity ratio 64.8% 61.9% 62.9%
Cash and securities 203.1 264.0 219.5 Total no. of ship days for NORDEN 28,804 22,093 93,738
USD/DKK rate at end of the period 601.01 696.55 620.77 CASH FLOWS Average USD/DKK rate 605.90 698.27 659.53
From operating activities -25.3 -9.4 6.3
From investing activities -19.5 33.0 -0.2 – hereof investments in property equipment and vessels -65.1 -4.2 -106.9 1) Converted at the USD/DKK rate at end of period.
2) The ratios were computed in accordance with ”Recommendations and Financial Ratios 2015” published by the Danish Society of Financial Analysts.
However, ”Profits from the sale of vessels, etc.” have not been included in EBITDA.
* Adjusted result for the period was computed as “Profit/loss for the period” adjusted for “Profit from the sale of vessels, etc.” including vessels in joint
ventures.
From financing activities 22.5 -5.1 3.0
Change in liquidity for the period -22.3 18.5 9.1
4/24
ANNOUNCEMENT NO. 8 – 2 MAY 2018
THE GROUP
Comments on the development of NORDEN for the period 1 January – 31 March 2018
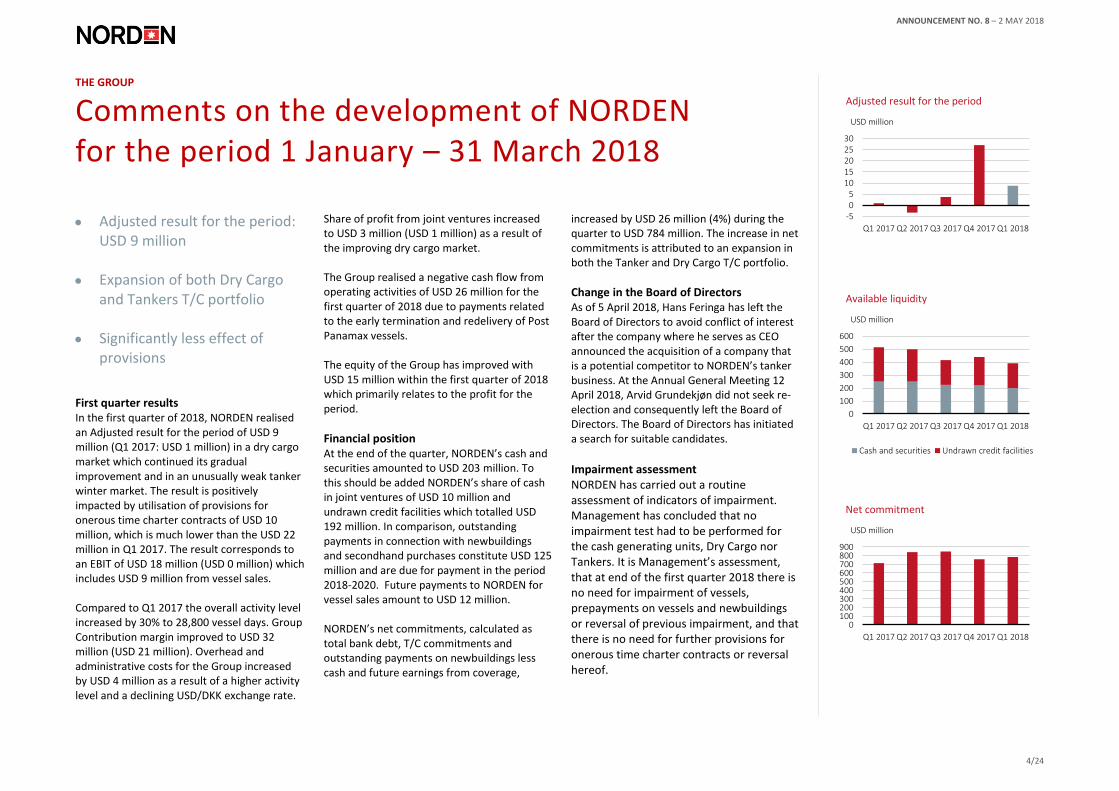
• Adjusted result for the period: USD 9 million
• Expansion of both Dry Cargo and Tankers T/C portfolio
• Significantly less effect of provisions
First quarter results In the first quarter of 2018, NORDEN realised an Adjusted result for the period of USD 9 million (Q1 2017: USD 1 million) in a dry cargo market which continued its gradual improvement and in an unusually weak tanker winter market. The result is positively impacted by utilisation of provisions for onerous time charter contracts of USD 10 million, which is much lower than the USD 22 million in Q1 2017. The result corresponds to an EBIT of USD 18 million (USD 0 million) which includes USD 9 million from vessel sales. Compared to Q1 2017 the overall activity level increased by 30% to 28,800 vessel days. Group Contribution margin improved to USD 32 million (USD 21 million). Overhead and administrative costs for the Group increased by USD 4 million as a result of a higher activity level and a declining USD/DKK exchange rate.
Share of profit from joint ventures increased to USD 3 million (USD 1 million) as a result of the improving dry cargo market. The Group realised a negative cash flow from operating activities of USD 26 million for the first quarter of 2018 due to payments related to the early termination and redelivery of Post Panamax vessels. The equity of the Group has improved with USD 15 million within the first quarter of 2018 which primarily relates to the profit for the period.
Financial position At the end of the quarter, NORDEN’s cash and securities amounted to USD 203 million. To this should be added NORDEN’s share of cash in joint ventures of USD 10 million and undrawn credit facilities which totalled USD 192 million. In comparison, outstanding payments in connection with newbuildings and secondhand purchases constitute USD 125 million and are due for payment in the period 2018-2020. Future payments to NORDEN for vessel sales amount to USD 12 million. NORDEN’s net commitments, calculated as total bank debt, T/C commitments and outstanding payments on newbuildings less cash and future earnings from coverage,
increased by USD 26 million (4%) during the quarter to USD 784 million. The increase in net commitments is attributed to an expansion in both the Tanker and Dry Cargo T/C portfolio.
Change in the Board of Directors As of 5 April 2018, Hans Feringa has left the Board of Directors to avoid conflict of interest after the company where he serves as CEO announced the acquisition of a company that is a potential competitor to NORDEN’s tanker business. At the Annual General Meeting 12 April 2018, Arvid Grundekjøn did not seek re-election and consequently left the Board of Directors. The Board of Directors has initiated a search for suitable candidates.
Impairment assessment NORDEN has carried out a routine assessment of indicators of impairment. Management has concluded that no impairment test had to be performed for the cash generating units, Dry Cargo nor Tankers. It is Management’s assessment, that at end of the first quarter 2018 there is no need for impairment of vessels, prepayments on vessels and newbuildings or reversal of previous impairment, and that there is no need for further provisions for onerous time charter contracts or reversal hereof.
-505
1015202530
Q1 2017 Q2 2017 Q3 2017 Q4 2017 Q1 2018
Adjusted result for the period
USD million
0
100
200
300
400
500
600
Q1 2017 Q2 2017 Q3 2017 Q4 2017 Q1 2018
Available liquidity
Cash and securities Undrawn credit facilities
USD million
0100200300400500600700800900
Q1 2017 Q2 2017 Q3 2017 Q4 2017 Q1 2018
Net commitment
USD million

5/24
ANNOUNCEMENT NO. 8 – 2 MAY 2018
THE GROUP
Selected segment figures
Adjusted result for the period
USD 9 million
Market value of owned vessels and newbuildings
USD 875 million
USD million Dry Operator Dry Owner Tankers Total
Contribution margin 13 8 11 32
Profit before depreciation, amortisation and impairment losses etc. (EBITDA) 4 6 8 17
Profit from operations (EBIT) 4 14 0 18
Profit for the period 3 15 0 18
Adjusted result for the period 3 5 0 9
Fleet values
USD million Dry Owner Tankers Total
Market value of owned vessels and newbuildings (charter free) 464 412 875
Broker estimated value of certain charter parties attached to owned vessels 17 1 18
Carrying amount / costs 452 503 955
Value added 28 -91 -62
Theoretical value of purchase and extension options 23 20 43
Adjusted result for the period
-4
0
4
8
12
16
Q3 2017 Q4 2017 Q1 2018
Dry Owner
USD million
-4
0
4
8
12
16
Q3 2017 Q4 2017 Q1 2018
Dry Operator
USD million
-4
0
4
8
12
16
Q1 2017 Q2 2017 Q3 2017 Q4 2017 Q1 2018
Tankers
USD million

6/24
ANNOUNCEMENT NO. 8 – 2 MAY 2018
For further information on the segments see note 2.
DRY OPERATOR
Positive result and investment in positioning voyages
“Adjusted result since mid-2017 amounts to USD 15 million.”
Dry Operator key figures (USD million) USD million 2017
H2
2018
Q1
Total
Contribution margin 26.7 12.9 39.6
O/A costs -17.2 -8.8 -26.0
EBITDA 9.5 4.1 13.6
Adjusted result 11.8 3.1 14.9
Vessel days 46,674 24,442 71,116
CM per vessel day (USD/day) 572 530 557
Adj. result per vessel day (USD/day) 253 124 210
Contribution margin (CM) is defined as “Revenue” less “Vessel operating
costs” plus “Other operating income, net”
• Adjusted result for the period: USD 3 million
• Increased activity
• Vessels positioned into promising Atlantic market
Results for the first quarter of 2018 In the first quarter of 2018, the Dry Operator generated a Contribution margin of USD 13 million, which resulted in an Adjusted result of USD 3 million for the period. During the quarter, Dry Operator generated profit in regional markets while investing in positioning of vessels into a stronger seasonal second quarter market in the Atlantic. The positioning voyages were conducted towards the end of the first quarter and will generate profit in the second quarter of 2018.
Average number of vessels operated in Q1
272
Other operating income which mainly consists of pool management fees declined to USD 1 million as a result of NORDEN’s previous decision to terminate the pool activities in Dry Operator. The lack of this income going forward is expected to be more than offset by Dry Operator’s ability to generate a positive margin on its own activities. New office and increased activity
During the quarter, a new NORDEN office
in Vancouver was opened and got off to a
good start. The increase in the activity
continued with a total of 24,442 vessels
days – equivalent to an average fleet size
of 272 vessels – handled by the Dry
Operator in the first quarter. This is an
increase in the number of vessel days by
5% compared to the average of second
half of 2017.
Average earnings per vessel day Since the establishment of the Dry Operator at mid-year 2017, the business unit has generated a Contribution margin of USD 40 million and an Adjusted result of USD 15 million. The average Contribution margin per vessel day has been USD 557 per day, while the margin after inclusion of all costs has been USD 210 per day. The margin is generated among others through continuous logistical optimisation of trading patterns and increased number of clip deals where voyages are performed on third party vessels with a minimum of market risk.
Outlook Looking forward to the second quarter of 2018, the result of the Dry Operator is expected to be higher than in the first quarter of 2018 as the positive effect of the positioning of vessels into the Atlantic is realised through securing fronthaul voyages. The overall activity levels in the Dry Operator are expected to increase slightly from the levels in the first quarter. Focus continues to be on both improving the profitability of each vessel day handled by the Dry Operator as well as positioning the organisation for further growth.

7/24
ANNOUNCEMENT NO. 8 – 2 MAY 2018
DRY OWNER
Optimising the position
Source: Baltic Exchange
Dry Owner TCE Days USD/day
Post-
Panamax 272 8,852
Panamax 1,823 12,104
Supramax 1,865 10,517
Handysize 895 10,101
Dry Owner key figures (USD million) USD million 2017
H2
2018
Q1
Total
Contribution margin 29.2 7.7 36.9
O/A costs -4.3 -2.2 -6.5
EBITDA 24.9 5.5 30.4
Adjusted result 18.5 5.4 23.9 Contribution margin (CM) is defined as “Revenue” less “Vessel operating costs” plus “Other operating income, net”
• Adjusted result for the period: USD 5 million
• Continued improvement in market
Results for the first quarter of 2018
In the first quarter, NORDEN realised an
Adjusted result for the period of USD 5
million. This corresponds to an EBIT of USD
14 million including USD 9 million from
vessel sales.
Dry Cargo market
The Dry Cargo market in the first quarter of
2018 developed as expected with rates going
through the usual seasonal developments
although at levels higher than in 2017. The
average Baltic earnings for Supramax vessels
were 1,863 USD/day higher than in Q1 2017
and Panamax rates were 2,553 USD/day
higher. The improvements were driven by
stronger global economic activity combined
with lower fleet growth.
For the rest of 2018, low fleet growth should
enable gradual improvements in rates
compared to last year, despite expected
lower growth rates in Chinese imports.
However, the uncertainty for demand growth
has grown in recent months with increased
risk of a trade war. While, the currently published tariffs from both the USA and China are not considered as highly detrimental for dry cargo volumes, there could be an overall negative influence on global activity levels because of increased uncertainty. This uncertainty may also have been a contributing factor to the drop in ordering activity.
Dry Owner fleet and activity During the first quarter, NORDEN continued to optimise the position of Dry Owner, concentrating its ownership on Panamax and Supramax vessels. Two vessels were agreed sold during the quarter (1 older Supramax, NORD MARU, and 1 Handysize, NORD SEOUL), and 1 vessel was agreed sold after the quarter (Handysize, NORD AUCKLAND). In addition, 1 vessel which was sold during the last quarter of 2017 were delivered to its new owners (Handysize, NORD SHANGHAI). NORDEN also took delivery of 3 newbuildings of which 1 Panamax vessel was previously agreed sold and delivered directly to its new owners.
The T/C portfolio was further expanded in
the first quarter by 5 2-3-year contracts with
purchase options and period optionality.
Cover increased
With the Dry Operator set-up in place, Dry
Owner has begun to gradually relet its open
fleet capacity on fixed market rates to Dry
Operator as opposed to pure spot rates.
This allows more of NORDEN’s 1-year
exposure to be managed by Dry Operator.
As a result, Dry Owner coverage has increa-
sed to 67% by the end of the first quarter.
Fleet value
Based on the average of 3 independent
broker valuations, the market value of
NORDEN’s owned vessels and newbuilding
orders in the dry cargo segment was
estimated at USD 480 million. This is an
increase of 1% compared to the end of
2017 for the vessels owned throughout the
quarter. Additionally, the market forward
rates increased during the quarter, adding
to the value of T/C-in contracts.
Dry Owner maintains a significantly open
position in the coming years and is
therefore well positioned to benefit from an
improving market in the medium term.
Market value of vessels (USD)
480 million
0
5,000
10,000
15,000
Spot rates
Supramax Panamax
USD per day

8/24
ANNOUNCEMENT NO. 8 – 2 MAY 2018
DRY OWNER
Capacity and coverage
Dry Cargo ROY 2018 capacity (ship days)
13,064
Dry Cargo coverage ROY 2018
67%
A considerably part of NORDEN’s exposure consists of vessel days from long-term chartered capacity which should be included when the Company’s capital structure is evaluated. The full annual details of the portfolio as well as a “ready to use” calculator to estimate the value of the portfolio based on expectations for the long-term rates in dry cargo markets can be found on NORDEN’s website www.ds-norden.com.
At 31 March 2018
2018 ROY 2018 ROY
Q2 Q3 Q4 2018 2019 2020 Q2 Q3 Q4 2018 2019 2020
Own vessels Ship days
Panamax 352 366 363 1,081 1,376 1,444
Supramax 623 684 734 2,041 3,699 4,390
Handysize 528 517 456 1,501 1,810 1,815
Total 1,503 1,566 1,553 4,622 6,885 7,648
Chartered vessels Cash costs for T/C capacity (USD per day)
Post-Panamax 64 - - 64 - - 14,229 - - 14,229 -
Panamax 1,462 1,517 1,517 4,496 5,996 5,673 12,586 12,557 12,543 12,562 13,510 13,669
Supramax 981 1,004 919 2,904 4,160 5,949 11,524 11,407 10,845 11,269 11,555 11,345
Handysize 264 315 400 978 1,199 639 12,185 11,830 11,360 11,734 11,329 11,585
Total 2,770 2,836 2,836 8,442 11,354 12,261 12,210 12,069 11,826 12,034 12,564 12,433
Cash costs for total capacity (USD per day)*
Total capacity 4,274 4,402 4,389 13,064 18,239 19,919 9,709 9,602 9,454 9,587 9,959 9,639
Coverage Revenue from coverage (USD per day)
Post-Panamax - - - - - - - - - - - -
Panamax 1,546 1,619 1,560 4,725 3,810 2,655 12,915 12,936 12,996 12,949 14,028 14,765
Supramax 969 1,005 902 2,876 2,197 2,234 11,549 11,559 11,685 11,595 12,261 12,576
Handysize 378 393 393 1,164 1,568 1,570 11,831 11,820 11,820 11,824 11,809 11,813
Total 2,892 3,018 2,856 8,765 7,575 6,459 12,316 12,332 12,420 12,355 13,056 13,290
Coverage in %
Post-Panamax - - - - - -
Panamax 85% 86% 83% 85% 52% 37%
Supramax 60% 60% 55% 58% 28% 22%
Handysize 48% 47% 46% 47% 52% 64%
Total 68% 69% 65% 67% 42% 32%
Accounting effect of
provision (USD million) 5 5 5 15 21 12
* Including cash running costs of owned vessels. Costs are excluding O/A.

9/24
ANNOUNCEMENT NO. 8 – 2 MAY 2018
TANKERS
Break-even in unusually weak winter market
Source: Braemer ACM
Oil demand (YoY growth)
Source: IEA
Tankers key figures (USD million) USD million 2017
Q1
2018
Q1
Contribution margin 18.6 11.2
O/A costs -2.0 -3.7
EBITDA 16.6 7.5
Adjusted result 10.3 0.3 Contribution margin (CM) is defined as “Revenue” less “Vessel operating costs” plus “Other operating income, net”
• Adjusted result USD 0 million
• Benchmark outperformed by USD 828 per day
Results for the first quarter of 2018
In the first quarter NORDEN's tanker
business generated an Adjusted result of
0 million (Q1 2017: USD 10 million) and
outperformed a disappointing market.
The result corresponds to an EBIT of USD
0 million (USD 10 million).
NORDEN’s Handysize tankers generated
average daily earnings of USD 12,183,
while average daily earnings for the MRs
amounted to USD 13,700. Compared to
the average 1-year T/C rate during the last
12 months, NORDEN continued its
operational outperformance of the
market by 7%, which corresponds to extra
earnings of USD 828 per day compared to
the market.
Tanker market
The tanker market was unusually weak
during the first quarter. High refinery
maintenance and stock draws resulted in
less oil products being exported. The
crude tanker market was under even
more pressure, and as a consequence
most LR1/LR2 newbuildings opted for the
clean trade. On the positive side, the
challenging market led to a significant
uptick in tanker scrapping compared to
the last few years and during the first 3
months of 2018 the total tanker fleet
growth was 0.5% (Clarkson).
Due to the current low rates, it is
expected that scrapping will continue at
a high level and result in annual fleet
growth of approximately 3% –
significantly below previous years.
According to the IEA, oil demand is
expected to grow by 1.5% in 2018. As
stocks return to a normal level, transport
demand will increase as more exports
will be needed resulting in a gradual
increase in tanker rates.
Tanker fleet and activity
At the end of the first quarter 2018,
NORDEN owned a total of 21 tanker
vessels of which 11 were MRs and the
remaining Handysize. Based on the
average of 3 independent broker
valuations, the market
value of NORDEN’s owned vessels and
newbuilding orders in the tanker segment
was estimated at USD 412 million. This is a
reduction of 2% compared to the end of
2017 for vessels owned throughout the
quarter. After the quarter, NORDEN has
purchased 2 2009-built secondhand MR
product tankers.
The NORDEN Tanker business continued
the gradual build-up of T/C capacity from
last year and 1,965 days in forward capacity
were added to the tanker T/C portfolio
during the quarter.
In total, NORDEN has 13,754 and 12,730
open days in 2019 and 2020, respectively.
To this should be added 4,492 optional
days and NORDEN is therefore well
positioned to benefit from the
improvement in rates which is expected
towards the end of 2018. The theoretical
value of the Tanker business’ purchase and
extension options is estimated at USD 20
million at the end of the quarter.
Forward T/C capacity added in Q1
1,965 days
0%
1%
2%
2016 2017 Est. 2018 Est.
0
5,000
10,000
15,000
20,000
Jan
-16
Ap
r-1
6
Jul-
16
Oct
-16
Jan
-17
Ap
r-1
7
Jul-
17
Oct
-17
Jan
-18
Ap
r-1
8
MR spot rates
MR EAST CPP MR WEST CPP
USD per day

10/24
ANNOUNCEMENT NO. 8 – 2 MAY 2018
TANKERS
Position and rates
Tankers ROY 2018 capacity (ship days)
12,844
Tankers coverage ROY 2018
13%
* Weighted average. NORDEN TCE is calculated as freight income less voyage costs (such as broker commission, bunkers and port costs), but before payment of pool management fee
Capacity and coverage at 31 March 2018
2018 ROY 2018 ROY
Q2 Q3 Q4 2018 2019 2020 Q2 Q3 Q4 2018 2019 2020
Owned vessels Ship days
MR 1,059 1,025 1,008 3,091 3,923 3,955
Handysize 880 902 916 2,697 3,591 3,593
Total 1,939 1,926 1,923 5,788 7,514 7,548
Chartered vessels Cash costs for T/C capacity (USD per day)
LR1 176 184 184 544 730 397 18,655 18,655 18,655 18,655 18,655 18,655
MR 2,135 1,907 1,605 5,647 4,420 4,234 13,779 14,002 14,188 14,847 14,847 14,868
Handysize 313 276 276 865 1,095 552 11,093 12,729 12,729 12,729 12,729 12,729
Total 2,623 2,367 2,065 7,056 6,245 5,182 13,786 14,215 14,391 14,107 14,921 14,930
Cash costs for total capacity (USD per day)*
Total capacity 4,562 4,293 3,988 12,844 13,759 12,730 10,628 10,660 10,438 10,580 10,206 9,799
Coverage Revenue from coverage (USD per day)
LR1 - - - - - - - - - - - -
MR 947 365 138 1,450 5 - 12,574 14,093 14,117 13,103 12,888 -
Handysize 201 55 - 256 - - 10,827 14,982 - 11,719 - -
Total 1,148 420 138 1,706 5 - 12,268 14,209 14,117 12,896 12,888 -
Coverage in %
LR1 - - - - - -
MR 30% 12% 5% 17% 0% -
Handysize 17% 5% - 7% - -
Total 25% 10% 3% 13% 0% - * Including cash running costs of owned vessels. Costs are excluding O/A.
Employment and rates, Tankers, Q1 2018
Vessel type LR1 MR Handysize Total*
NORDEN's ship days 180 3,196 1,272 4,648
NORDEN spot TCE (USD per day, net) 12,714 13,333 12,207 12,966
NORDEN TCE (USD per day, net) 12,714 13,700 12,183 13,247
NORDEN TCE 12 months average (USD per day, net) 12,063 14,439 11,376 13,464
Benchmark 12 months average (USD per day, net) 12,854 13,180 11,352 12,636
NORDEN vs. Benchmark (12 months average) -6% 10% 0% 7%

11/24
ANNOUNCEMENT NO. 8 – 2 MAY 2018
THE GROUP
Outlook for 2018
“NORDEN expects adjusted results for the year of USD 10 to 50 million.”
Expectations for 2018 USD million Adjusted result for the year
Dry Operator 10 to 20
Dry Owner 15 to 25
Tankers -15 to 5
Group 10 to 50
Forward-looking statements
This report includes forward-looking statements
reflecting management’s current perception of
future trends and financial performance. The
statements for the rest of 2018 and the years to
come naturally carry some uncertainty, and
NORDEN’s actual results may therefore differ from
expectations. Factors that may cause the results
achieved to differ from the expectations are, among
other things, but not exclusively, changes in the
macroeconomic and political conditions – especially
in the Group’s key markets – changes in NORDEN’s
assumptions of rate development and operating
costs, volatility in rates and vessel prices, changes in
legislation, possible interruptions in traffic and
operations as a result of external events, etc.
NORDEN maintains expectations NORDEN maintains its expectations for the Adjusted results for the year at USD 10 to 50 million. Both the dry cargo and tanker markets have developed in line with expectations, and the Dry Operator performance in the first quarter and the forward position also support the announced expectations.
Risk and uncertainties
The Dry Operator results are sensitive to both market conditions as well as NORDEN’s ability
to identify and execute business opportunities.
Earnings expectations in Dry Owner primarily depend on the development in the spot
market. At the end of April, Dry Owner had about 3,300 open vessel days, which gives rise to
a change in earnings of about USD 3.3 million at a change of USD 1,000 per day in expected
T/C equivalents.
Earnings expectations in Tankers primarily depend on the development in the spot market.
Based on about 10,200 open vessel days in Tankers at the end of April, a change of USD
1,000 per day in expected T/C equivalents would mean a change in earnings of
approximately USD 10.2 million.
All business units are furthermore sensitive to counterparty risks as well as operational risks.
Events after the reporting date
No events have occurred after 31 March 2018 which significantly affect the interim report
for the period 1 January – 31 March 2018, other than the developments disclosed in the
Management Review.

12/24
ANNOUNCEMENT NO. 8 – 2 MAY 2018
THE GROUP
Statement by the Board of Directors and Executive Management
NORDEN A/S’ consolidated activities
and cash flows for the period 1 January
to 31 March 2018.
Furthermore, in our opinion the
Management Review gives a fair
representation of the Group’s activities
and financial position as well as a
description of the material risks and
uncertainties which the Group is facing.
The Board of Directors and the Executive
Management have today reviewed and
approved the Interim Report for the period
1 January to 31 March 2018 of
Dampskibsselskabet NORDEN A/S.
The interim consolidated financial
statements of Dampskibsselskabet NORDEN
A/S have been prepared in accordance with
IAS 34 Interim Financial Reporting as
adopted by the EU and additional Danish
disclosure requirements for interim financial
reporting of listed companies.
The interim consolidated financial
statements have not been subject to audit
or review by the Independent Auditors of
Dampskibsselskabet NORDEN A/S.
We consider the accounting policies applied
to be appropriate and the accounting
estimates made to be adequate.
Furthermore, we find the overall
presentation of the Interim Report to
present a true and fair view.
Besides what has been disclosed in the
Interim Report, no other significant changes
in the Group’s risks and uncertainties have
occurred relative to what was disclosed in
the consolidated annual report for 2017.
In our opinion, the interim consolidated
financial statements give a true and fair
view of Dampskibsselskabet NORDEN A/S’
consolidated assets, equity and liabilities
and the financial position at 31 March 2018
as well as the result of Dampskibsselskabet
Hellerup, 2 May 2018
Executive Management
Jan Rindbo
Chief Executive Officer
Martin Badsted
Chief Financial Officer
Board of Directors Klaus Nyborg Chairman
Johanne Riegels Østergård Vice Chairman
Karsten Knudsen
Thomas Intrator Susanne Fauerskov Jesper Svenstrup Lars Enkegaard Biilmann (employee-elected) (employee-elected) (employee-elected)

13/24
ANNOUNCEMENT NO. 8 – 2 MAY 2018
Consolidated income statement
Note USD million
2018
Q1
2017
Q1
2017
Q1-Q4
2 Revenue 591.2 440.2 1,808.6
2 Other operating income 0.7 2.9 11.1
2 Vessel operating costs -560.1 -422.3 -1.703
2 Contribution margin 31.8 20.7 116.7
2, 3 Overhead and administration costs -14.7 -10.4 -48.6
Profit/loss before depreciation, amortisation and impairment losses, etc. (EBITDA) 17.1 10.3 68.1
Profit/loss from the sale of vessels, etc. 9.2 -0.2 0.9
5 Depreciation, amortisation and impairment losses -10.5 -10.6 -42.2
Share of profit/loss of joint ventures 2.6 0.6 -3.5
Profit from operations (EBIT) 18.4 0.1 23.3
Financial income 4.1 5.0 14.0
Financial expenses -3.2 -3.4 -14.9
Profit before tax 19.3 1.7 22.4
Tax -1.3 -1.0 2.2
PROFIT FOR THE PERIOD 18.0 0.7 24.6
Attributable to:
Shareholders of NORDEN 18.0 0.7 24.6
Earnings per share (EPS), USD 0.44 0.00 0.61
Diluted earnings per share, USD 0.44 0.00 0.61
Adjusted result for the period 8.8 0.9 28.4

14/24
ANNOUNCEMENT NO. 8 – 2 MAY 2018
Consolidated statement of comprehensive income
Note USD million
2018
Q1
2017
Q1
2017
Q1-Q4
Results for the period 18.0 0.7 24.6
Items which will be reclassified to the income statement:
4 Fair value adjustment for the period, cash flow hedges -2.9 -10.0 6.8
Fair value adjustment for the period, securities -0.1 0.2 0.7
Tax on fair value adjustment of securities 0.0 0.0 0.0
Other comprehensive income, total after tax -3.0 -9.8 7.5
Total comprehensive income for the period, after tax 15.0 -9.1 32.1
Attributable to:
Shareholders of NORDEN 15.0 -9.1 32.1

15/24
ANNOUNCEMENT NO. 8 – 2 MAY 2018
Consolidated statement of financial position
Note USD million
2018
31/3
2017
31/3
2017
31/12 Note USD million
2018
31/3
2017
31/3
2017
31/12
ASSETS EQUITY AND LIABILITIES
5 Vessels 717.5 671.9 691.7 Share capital 6.7 6.7 6.7
Property and equipment 49.5 50.6 49.6 Reserves 4.0 -10.3 7.0
6 Prepayments on vessels and newbuildings 23.9 22.7 33.9 Retained earnings 838.9 796.2 820.7
Tangible assets 790.9 745.2 775.2 Equity 849.6 792.6 834.4
Investments in joint ventures 11.5 16.6 11.3 Loans 159.8 184.2 195.5
Financial assets 11.5 16.6 11.3 Provisions 37.2 78.8 42.5
Non-current liabilities 197.0 263.0 238.0
Non-current assets 802.4 761.8 786.5
Loans 85.0 27.0 26.3
Inventories 68.4 52.1 67.7 Provisions 25.2 83.9 36.1
Freight receivables 119.6 59.4 124.0 Trade payables 60.4 52.2 62.6
Receivables from joint ventures 1.8 13.3 0.0 Debt to joint ventures 0.0 0.0 1.9
Other receivables 32.7 58.6 33.9 Other payables 57.6 39.7 74.6
Prepayments 71.9 66.0 79.0 Deferred income 34.8 15.4 51.3
Securities 4.6 14.1 8.1 263.0 218.2 252.8
Cash and cash equivalents 198.5 249.9 211.4 Liabilities relating to vessels
497.5 513.4 524.1 held for sale 1.2 7.0 1.3
7 Vessels held for sale 10.9 5.6 15.9 Current liabilities 264.2 225.2 254.1
Current assets 508.4 519.0 540.0
Liabilities 461.2 488.2 492.1
TOTAL ASSETS 1,310.8 1,280.8 1,326.5 TOTAL EQUITY AND LIABILITIES 1,310.8 1,280.8 1,326.5
16/24
ANNOUNCEMENT NO. 8 – 2 MAY 2018
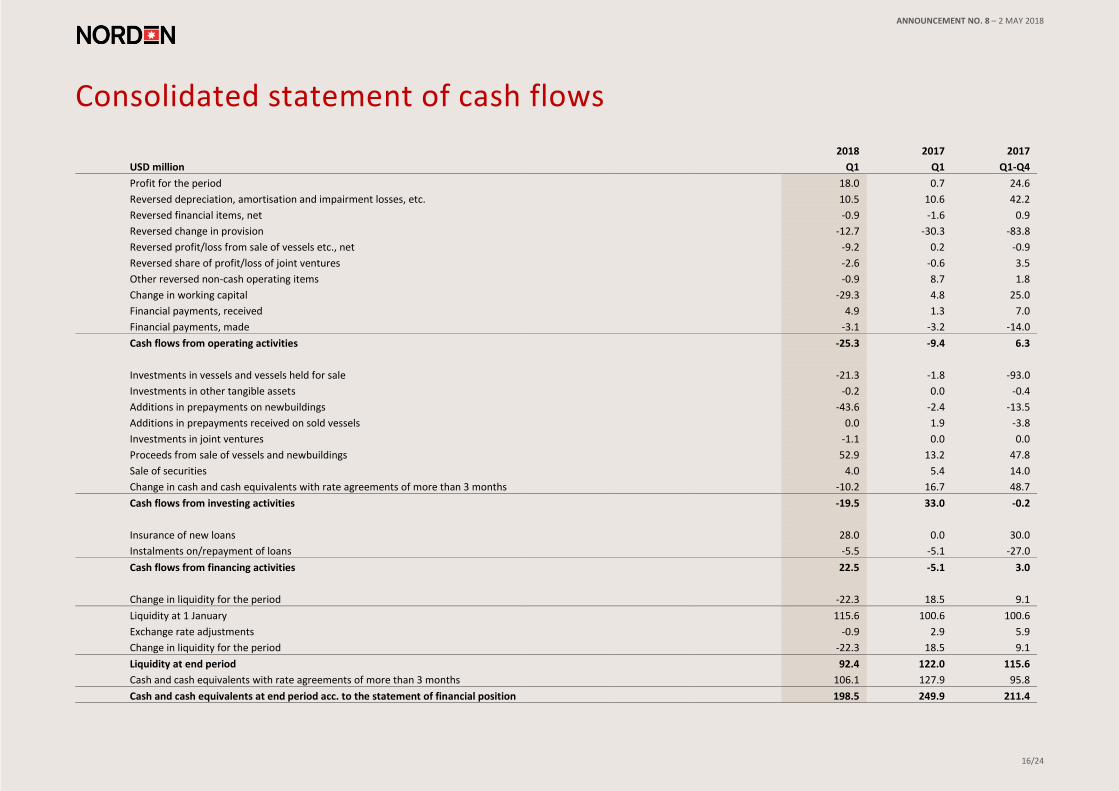
Consolidated statement of cash flows
USD million
2018
Q1
2017
Q1
2017
Q1-Q4
Profit for the period 18.0 0.7 24.6
Reversed depreciation, amortisation and impairment losses, etc. 10.5 10.6 42.2
Reversed financial items, net -0.9 -1.6 0.9
Reversed change in provision -12.7 -30.3 -83.8
Reversed profit/loss from sale of vessels etc., net -9.2 0.2 -0.9
Reversed share of profit/loss of joint ventures -2.6 -0.6 3.5
Other reversed non-cash operating items -0.9 8.7 1.8
Change in working capital -29.3 4.8 25.0
Financial payments, received 4.9 1.3 7.0
Financial payments, made -3.1 -3.2 -14.0
Cash flows from operating activities -25.3 -9.4 6.3
Investments in vessels and vessels held for sale -21.3 -1.8 -93.0
Investments in other tangible assets -0.2 0.0 -0.4
Additions in prepayments on newbuildings -43.6 -2.4 -13.5
Additions in prepayments received on sold vessels 0.0 1.9 -3.8
Investments in joint ventures -1.1 0.0 0.0
Proceeds from sale of vessels and newbuildings 52.9 13.2 47.8
Sale of securities 4.0 5.4 14.0
Change in cash and cash equivalents with rate agreements of more than 3 months -10.2 16.7 48.7
Cash flows from investing activities -19.5 33.0 -0.2
Insurance of new loans 28.0 0.0 30.0
Instalments on/repayment of loans -5.5 -5.1 -27.0
Cash flows from financing activities 22.5 -5.1 3.0
Change in liquidity for the period -22.3 18.5 9.1
Liquidity at 1 January 115.6 100.6 100.6
Exchange rate adjustments -0.9 2.9 5.9
Change in liquidity for the period -22.3 18.5 9.1
Liquidity at end period 92.4 122.0 115.6
Cash and cash equivalents with rate agreements of more than 3 months 106.1 127.9 95.8
Cash and cash equivalents at end period acc. to the statement of financial position 198.5 249.9 211.4

17/24
ANNOUNCEMENT NO. 8 – 2 MAY 2018
Consolidated statement of changes in equity
Shareholders of NORDEN
USD million Share capital Reserves
Retained
earnings Total equity
Equity at 1 January 2018 6.7 7.0 820.7 834.4
Total comprehensive income for the period - -3.0 18.0 15.0
Share-based payment - - 0.2 0.2
Changes in equity 0.0 -3.0 18.2 15.2
Equity at 31 March 2018 6.7 4.0 838.9 849.6
Equity at 1 January 2017 6.7 -0.5 795.3 801.5
Total comprehensive income for the period - -9.8 0.9 -8.9
Share-based payment - - 0.2 0.2
Changes in equity 0.0 -9.8 1.0 -8.7
Equity at 31 March 2017 6.7 -10.3 796.2 792.6

18/24
ANNOUNCEMENT NO. 8 – 2 MAY 2018
Notes to the interim consolidated financial statements
1. Significant accounting policies, judgements and estimates
Accounting policies
The interim consolidated financial statements have been prepared in accordance with IAS 34
Interim financial reporting as adopted by the EU and additional Danish disclosure
requirements for the interim financial reporting of listed companies.
The accounting policies, judgements and estimates are consistent with those applied in the
consolidated annual report for 2017, apart from changes described below.
Changes in accounting policies
As from 1 January 2018, NORDEN has implemented IFRS 15, Revenue from contracts with
customers.
According to IFRS 15, revenue is recognised as the customer receives the agreed-upon service.
Under IAS 18, freight income was recognised under the discharge-to-discharge method.
Under IFRS 15, revenue is recognised over the period of time when the cargo is being
transported. At the same time, costs directly attributable to transportation of the vessel to
the loading port are capitalised and amortised over the course of the transportation period.
The transition to IFRS 15 has had no significant impact on NORDEN.
Due to the implementation of IFRS 15, the accounting policy regarding revenue recognition
has amended as follows:
Revenue comprises the present value of services rendered, net of discounts. Services
rendered comprise freight income and time charter income. Revenue is recognised in the
income statement for the financial year as earned.
All freight income and voyage costs are recognized as the freight services are rendered
(percentage of completion). The percentage of completion is determined using the load-
to-discharge method based on the percentage of the estimated duration of the voyage
completed at the reporting date. According to this method, freight income and related
costs are recognised in the income statement according to the entered charter parties
from the vessel’s load date to the delivery of the cargo (discharge). The voyage begins on
the date when the cargo is loaded, and the voyage ends at the date of the next discharge
(load to discharge). This applies to all spot transports and transports under Contracts of
Affreightment (COAs). Costs directly attributable to relocating the vessel to the load port
under the contract are capitalized to the extent that they are recoverable.
Demurrage is recognised if the claim is considered probable.
In addition to IFRS 15, NORDEN has implemented the following standards and
interpretations:
• Amendments to IFRS 2: Classification and Measurement of Share-based Payment
Transactions
• Part of annual improvements 2014-2016
• IFRIC 22 - Foreign currency transactions and advance consideration
Implementation of these standards and interpretations has not had any impact on
recognition and measurement.
For a complete description of accounting policies other than the accounting policy
regarding IFRS 15 above, see the notes to the consolidated financial statements for 2017,
pages 71 - 104 in the consolidated annual report for 2017.

19/24
ANNOUNCEMENT NO. 8 – 2 MAY 2018
Notes to the interim consolidated financial statements
1. Significant accounting policies, judgements and estimates (cont.) Standards not yet in force
At the end of April 2018, IASB has issued and the EU has endorsed the following new financial
reporting standards and interpretations which are estimated to be of relevance to NORDEN
and which are expected to have a material impact on the financial statements:
• IFRS 16 Leasing – For the lessee, the distinction between finance and operating leases will
be removed. In the future, operating leases must be recognised in the balance sheet as an
asset and a corresponding lease commitment. The standard comes into force in 2019.
Please see the annual report 2017 page 73 for an assessment of the potential effect from
adoption of IFRS 16.
Significant accounting estimates and judgements
The accounting estimates and judgments, which Management deems to be significant to the
preparation of the consolidated financial statements, are; impairment test, onerous contracts
and assessment of control in shared ownership – pool arrangements. Reference is made to
note 1.1 on page 72 for a further description in the consolidated annual report for 2017.

20/24
ANNOUNCEMENT NO. 8 – 2 MAY 2018
* Information is provided on the Group’s 3 business segments, Dry Owner, Dry Operator, together the Dry Cargo and Tankers. Previously NORDEN operated two business segments, Dry Cargo and Tankers. In July 2017, Dry Cargo has been split into a Dry Operator and a Dry Owner. Comparative information for Q1 2017 is not provided, as it has not been possible to establish this information. Therefore, segment information for Dry Cargo is presented for both Q1 2017 and Q1 2018. Certain changes to the line items presented have been made in Q1 2018 compared to the previously presented line items due to alignment with the internal financial reporting. ** Adjusted result for the period was computed as “Profit/loss for the period” adjusted for “Profit/loss from sale of vessels, etc.” including vessels in joint ventures.
Notes to the interim consolidated financial statements 2. Segment Information
USD million Q1 2018 Q1 2017
Dry Operator Dry Owner Eliminations Dry Cargo Tankers Total Dry Cargo Tankers Total
Revenue - services rendered, external 480.5 9.2 0.0 489.7 101.5 591.2 331.0 109.1 440.1
Revenue, services rendered, internal 0.0 39.3 -39.3 0.0 0.0 0.0 - - -*
Voyage costs -209.0 -0.2 0.0 -209.2 -41.3 -250.5 -173.0 -56.0 -229.0
T/C equivalent revenue 271.5 48.3 -39.3 280.5 60.2 340.7 158.0 53.1 211.1
Other operating income 0.6 0.1 0.0 0.7 0.0 0.7 2.9 0.0 2.9
Charter hire -259.2 -33.9 39.3 -253.8 -37.5 -291.3 -150.7 -25.9 -176.6
Operating costs owned vessels - -6.8 0.0 -6.8 -11.5 -18.3 -8.1 -8.6 -16.7
Contribution margin 12.9 7.7 0.0 20.6 11.2 31.8 2.1 18.6 20.7
Overhead and administration costs -8.8 -2.2 0.0 -11.0 -3.7 -14.7 -8.4 -2.0 -10.4
Profit/loss before depreciation, amortisation and
Impairment losses, etc. (EBITDA) 4.1 5.5 0.0 9.6 7.5 17.1 -6.3 16.6 10.3
Profit/loss from sale of vessels, etc. 0.0 9.2 0.0 9.2 0.0 9.2 0.0 -0.2 -0.2
Depreciation, amortisation and impairment losses -0.1 -3.2 0.0 -3.3 -7.2 -10.5 -3.4 -7.2 -10.6
Share of profit/loss of joint ventures 0.0 2.7 0.0 2.7 -0.1 2.6 0.2 0.4 0.6
Profit/loss from operations (EBIT) 4.0 14.2 0.0 18.2 0.2 18.4 -9.5 9.6 0.1
Financial income 0.0 2.5 0.0 2.5 1.6 4.1 3.0 2.0 5.0
Financial expenses 0.0 -1.9 0.0 -1.9 -1.3 -3.2 -2.0 -1.4 -3.4
Profit/loss before tax 4.0 14.8 0.0 18.8 0.5 19.3 -8.5 10.2 1.7
Tax -0.9 -0.2 0.0 -1.1 -0.2 -1.3 -0.9 -0.1 -1.0
Profit/loss for the period 3.1 14.6 0.0 17.7 0.3 18.0 -9.4 10.1 0.7
Adjusted for:
Profit/loss from sale of vessels, etc. 0.0 9.2 0.0 9.2 0.0 9.2 0.0 -0.2 -0.2
Adjusted result for the period** 3.1 5.4 0.0 8.5 0.3 8.8 -9.4 10.3 0.9
21/24
ANNOUNCEMENT NO. 8 – 2 MAY 2018
Notes to the interim consolidated financial statements
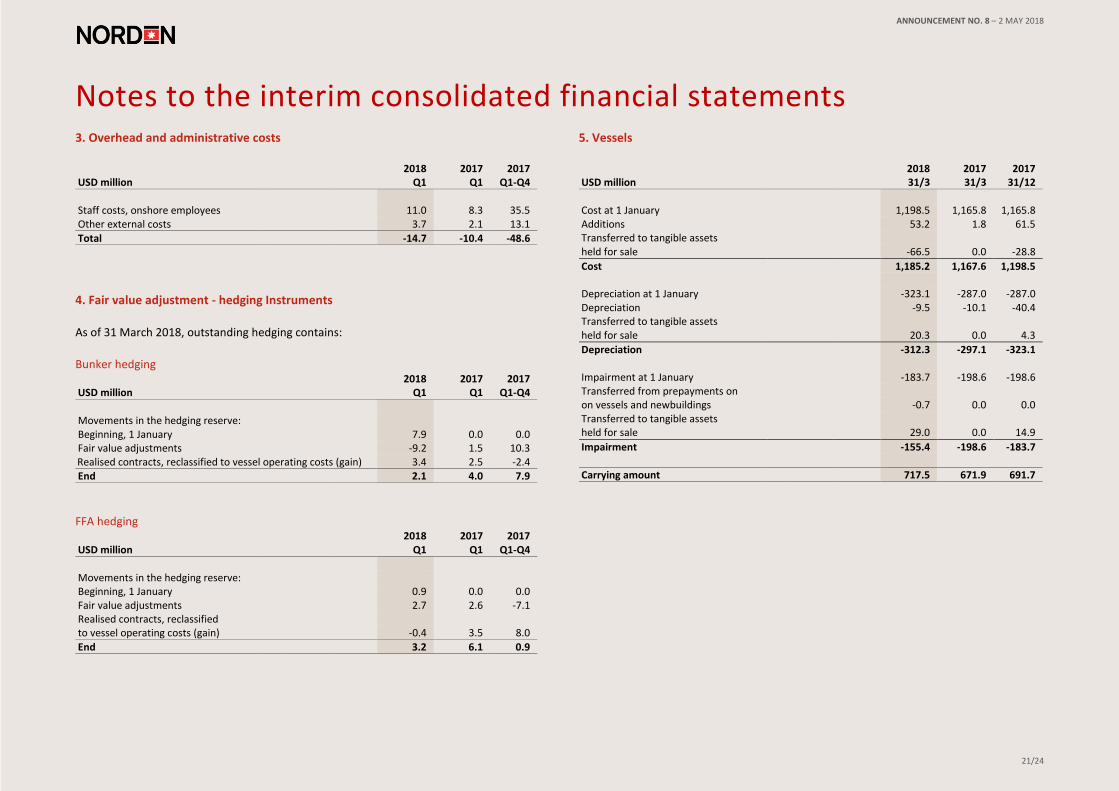
3. Overhead and administrative costs
USD million 2018
Q1 2017
Q1 2017
Q1-Q4
Staff costs, onshore employees 11.0 8.3 35.5 Other external costs 3.7 2.1 13.1
Total -14.7 -10.4 -48.6
4. Fair value adjustment - hedging Instruments
As of 31 March 2018, outstanding hedging contains:
Bunker hedging
USD million 2018
Q1 2017
Q1 2017
Q1-Q4
Movements in the hedging reserve: Beginning, 1 January 7.9 0.0 0.0 Fair value adjustments -9.2 1.5 10.3 Realised contracts, reclassified to vessel operating costs (gain) 3.4 2.5 -2.4 End 2.1 4.0 7.9
FFA hedging
USD million 2018
Q1 2017
Q1 2017
Q1-Q4 Movements in the hedging reserve: Beginning, 1 January 0.9 0.0 0.0 Fair value adjustments 2.7 2.6 -7.1 Realised contracts, reclassified to vessel operating costs (gain) -0.4 3.5 8.0
End 3.2 6.1 0.9
5. Vessels
USD million 2018 31/3
2017 31/3
2017 31/12
Cost at 1 January 1,198.5 1,165.8 1,165.8 Additions 53.2 1.8 61.5 Transferred to tangible assets held for sale -66.5 0.0 -28.8
Cost 1,185.2 1,167.6 1,198.5 Depreciation at 1 January -323.1 -287.0 -287.0 Depreciation -9.5 -10.1 -40.4 Transferred to tangible assets held for sale 20.3 0.0 4.3
Depreciation -312.3 -297.1 -323.1 Impairment at 1 January -183.7 -198.6 -198.6 Transferred from prepayments on on vessels and newbuildings -0.7 0.0 0.0 Transferred to tangible assets held for sale 29.0 0.0 14.9
Impairment -155.4 -198.6 -183.7
Carrying amount 717.5 671.9 691.7

22/24
ANNOUNCEMENT NO. 8 – 2 MAY 2018
Notes to the interim consolidated financial statements
6. Prepayments on vessels and newbuildings
USD million 2018 31/3
2017 31/3
2017 31/12
Cost at 1 January 41.4 31.2 31.2 Additions 43.6 2.4 13.6 Transferred to vessels -54.2 0.0 0.0 Transferred to tangible assets held for sale 0.0 -3.4 -3.4 Transferred to other items -0.1 0.0 0.0
Cost 30.7 30.2 41.4 Impairment at 1 January -7.5 -11.3 -11.3 Transferred 0.7 3.8 3.8
Impairment -6.8 -7.5 -7.5
Carrying amount 23.9 22.7 33.9
7. Vessels held for sale
USD million 2018 31/3
2017 31/3
2017 31/12
Cost at 1 January 15.9 22.2 22.2 Additions to tangible assets held for sale 0.0 0.0 31.5 Additions from prepayments on vessels and newbuildings 17.2 3.4 -0.5 Additions from vessels 21.3 -3.9 9.6 Disposals -43.5 -16.1 -46.9
Carrying amount 10.9 5.6 15.9 Which can be specified as follows: Vessels 10.9 9.2 9.6 Newbuildings 0.0 -3.6 15.9 Total 10.9 5.6 15.9
8. Related party disclosure No significant changes have occurred to related parties or types and scale of transactions
with these parties other than what is disclosed in the consolidated annual report for 2017.
9. Contingent assets and liabilities Since the end of 2017, no significant changes have occurred to contingent assets and
liabilities other than those referred to in this interim report.

23/24
ANNOUNCEMENT NO. 8 – 2 MAY 2018
Notes to the interim consolidated financial statements
10. Overview of deliveries of owned vessels and fleet values
NORDEN's Tanker fleet at 31 March 2018
Vessel type LR1 MR Handysize Total
Vessels in operation Owned vessels 0.0 11.0 10.0 21.0 Chartered vessels 2.0 27.0 6.0 35.0
Total active fleet 2.0 38.0 16.0 56.0 Vessels to be delivered Owned vessels 0.0 0.0 0.0 0.0 Chartered vessels 0.0 11.0 0.0 11.0
Total vessels to be delivered 0.0 11.0 0.0 11.0
Total gross fleet 2.0 49.0 16.0 67.0
NORDEN's Tanker fleet values at 31 March 2018 (USD million)
Vessel type LR1 MR Handysize Total
Average age of owned vessels 0 5 9 Market value of owned vessels and newbuildings* 0 263 148 412 Broker estimated value of certain charter parties attached to owned vessels 0 0 0 1 Carrying amount/cost 0 299 204 503 Value added 0 -36 -55 -91
Value of purchase and extension options on chartered tonnage 0 2 18 20
* Charter free and including joint ventures and assets held for sale, if any.
NORDEN's Dry Owner fleet at 31 March 2018
Vessel type Post-Panamax Panamax Supramax Handysize Total
Vessels in operation Owned vessels 0.0 4.0 6.5 6.0 16.5 Chartered vessels 2.0 12.5 13.0 4.0 31.5
Total active fleet 2.0 16.5 19.5 10.0 48.0 Vessels to be delivered Owned vessels 0.0 0.0 6.0 0.0 6.0 Chartered vessels 0.0 2.0 8.0 2.0 12.0
Total vessels to be delivered 0.0 2.0 14.0 2.0 18.0
Total gross fleet 2.0 18.5 33.5 12.0 66.0
NORDEN's Dry Owner fleet values at 31 March 2018 (USD million)
Vessel type Post-Panamax Panamax Supramax Handysize Total
Average age of owned vessels 11.6 4.8 6.3 7.0 Market value of owned vessels and newbuildings* 0 60 323 80 464 Broker estimated value of certain charter parties attached to owned vessels 0 9 0 8 17 Carrying amount/cost 0 60 302 89 452 Value added 0 8 21 -1 28
Value of purchase and extension options on chartered tonnage 0 11 12 0 23
* Charter free and including joint ventures and assets held for sale, if any.
24/24
ANNOUNCEMENT NO. 8 – 2 MAY 2018
Notes to the interim consolidated financial statements
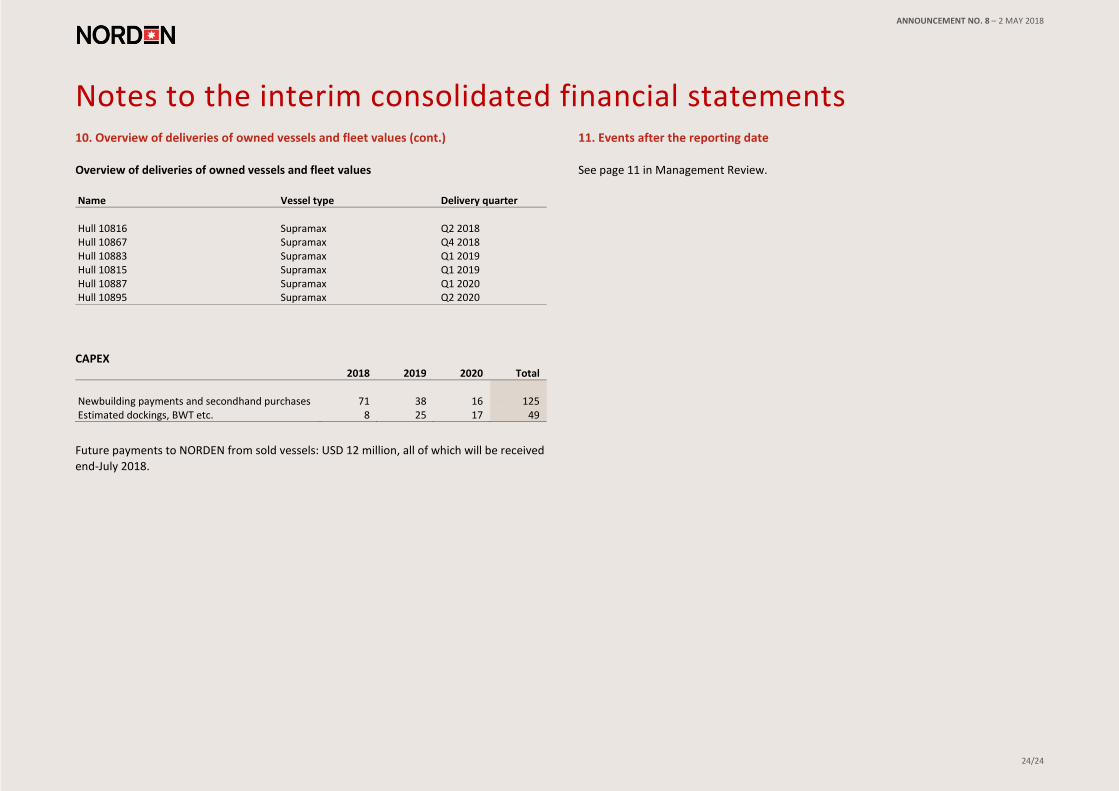
10. Overview of deliveries of owned vessels and fleet values (cont.)
Overview of deliveries of owned vessels and fleet values
Name Vessel type Delivery quarter
Hull 10816 Supramax Q2 2018 Hull 10867 Supramax Q4 2018 Hull 10883 Supramax Q1 2019 Hull 10815 Supramax Q1 2019 Hull 10887 Supramax Q1 2020 Hull 10895 Supramax Q2 2020
CAPEX 2018 2019 2020 Total
Newbuilding payments and secondhand purchases 71 38 16 125 Estimated dockings, BWT etc. 8 25 17 49
Future payments to NORDEN from sold vessels: USD 12 million, all of which will be received
end-July 2018.
11. Events after the reporting date
See page 11 in Management Review.