Interim Report Third quarter of 2018 - ds-norden.com · 1) Converted at the USD/DKK rate at end of...
25
DAMPSKIBSSELSKABET NORDEN A/S 52, STRANDVEJEN, DK-2900 HELLERUP, DENMARK WWW.DS-NORDEN.COM CVR NUMBER 67758919 ANNOUNCEMENT NO. 12 – 7 NOVEMBER 2018 1/25 Interim Report Third quarter of 2018 NORD COLORADO, 2017 built Supramax vessel calling Melbourne, Australia
-
Upload
truongthien -
Category
Documents
-
view
214 -
download
0
Transcript of Interim Report Third quarter of 2018 - ds-norden.com · 1) Converted at the USD/DKK rate at end of...

DAMPSKIBSSELSKABET NORDEN A/S 52, STRANDVEJEN, DK-2900 HELLERUP, DENMARK WWW.DS-NORDEN.COM CVR NUMBER 67758919
ANNOUNCEMENT NO. 12 – 7 NOVEMBER 2018
1/25
Interim Report Third quarter of 2018
NORD COLORADO, 2017 built Supramax vessel calling Melbourne, Australia

ANNOUNCEMENT NO. 12 – 7 NOVEMBER 2018
2/25
INTERIM REPORT
Third quarter of 2018
Results Markets Performance Values Guidance
Adjusted Result* for Q3 2018: USD -12 million (Q3 2017: USD 4 million) • Dry Operator: USD 2 million (USD -2
million)
• Dry Owner: USD 4 million (USD 7 million)
• Tankers: USD -18 million (USD -1 million)
EBIT Q3 2018: USD -7 million (USD -2 million) * ”Profit/loss for the period” adjusted for “Profit from sale of vessels etc.
• Dry Cargo: Continued improvements in rates driven by stronger global economic activity combined with lower fleet growth
• Tankers: Continued oversupply and weak demand growth. Foundation for improvement towards 2020 still in place.
• Dry Operator: Adjusted Result of USD 27 million over last 4 quarters. Contribution margin significantly higher than in Q3 2017.
• Dry Owner: Year on year market improvements continue. Cover for 2019 increased and further focus of ownership on Supramax and Panamax vessels
• Tankers: Despite very weak spot market performance almost on par with 1-year T/C
Vessel values
• Dry Cargo: -1%
• Tankers: -4%
Expectations for the Adjusted Result for the year are maintained at USD 0 to 30 million.
The Board of Directors has decided to initiate a share buy-back programme of up to a total of USD 10 million
WEAK TANKER MARKET OVERSHADOWING GOOD PERFORMANCE IN HEALTHY DRY CARGO MARKET “Good performance in Dry Operator delivering another positive result cannot make up for the severe headwinds, we are facing in the tanker market. Dry Operator has responded well to changing trade flows following trade tensions between US and China and has during the third quarter protected value in positions that will benefit results in the fourth quarter. Dry Owner continues to benefit from an improving market and has increased cover. In tankers a gradual improvement in 2019 is expected as the market prepares for the IMO sulphur regulation. With a modern fleet, NORDEN is well prepared for this.”
CEO Jan Rindbo
A telephone conference will be held today at 3:30 p.m. (CET), where CEO Jan Rindbo and CFO Martin Badsted will comment on the interim report. It is requested that all participants have joined the meeting by latest 3:25 p.m. (CET) – international participants please dial in on +44 (0)330 336 9411 or +1 929 477 0324, Danish participants please dial in on +45 3515 8121. The telephone conference will be shown live at www.ds-norden.com, where the accompanying presentation also will be available. For further information: CEO Jan Rindbo, tel. +45 3315 0451.
ANNOUNCEMENT NO. 12 – 7 NOVEMBER 2018
3/25
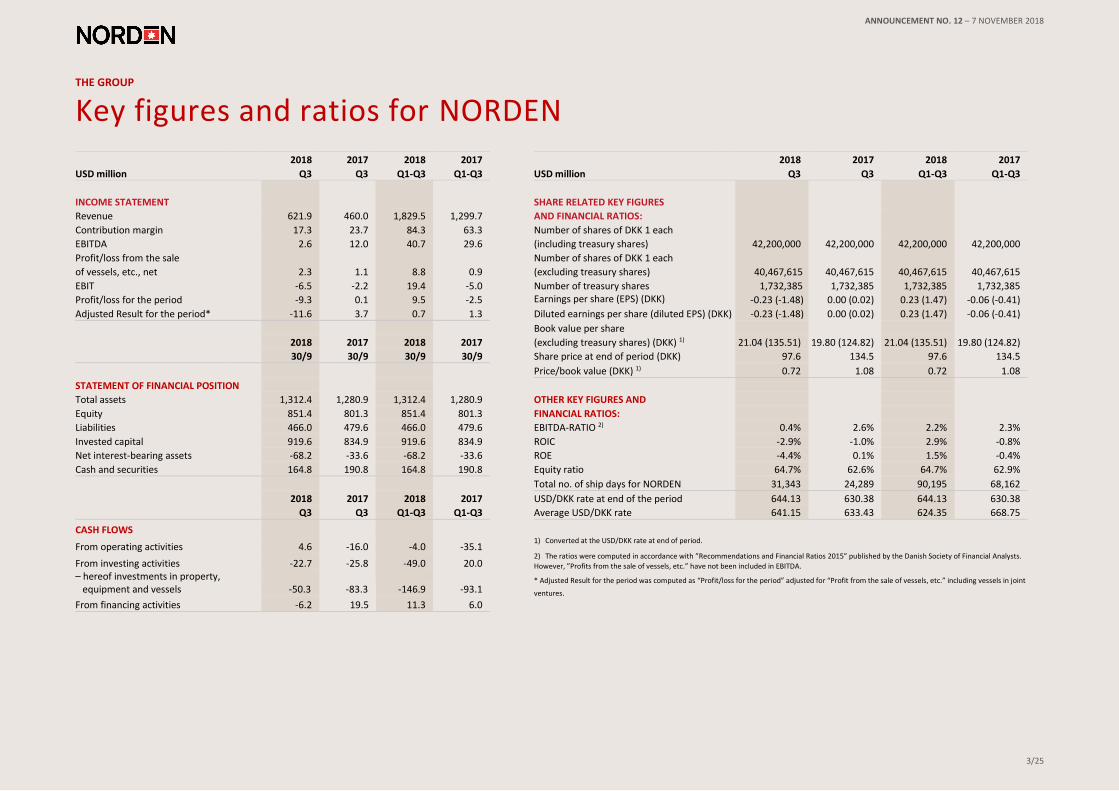
THE GROUP
Key figures and ratios for NORDEN
2018 2017 2018 2017 2018 2017 2018 2017
USD million Q3 Q3 Q1-Q3 Q1-Q3 USD million Q3 Q3 Q1-Q3 Q1-Q3
INCOME STATEMENT SHARE RELATED KEY FIGURES
Revenue 621.9 460.0 1,829.5 1,299.7 AND FINANCIAL RATIOS:
Contribution margin 17.3 23.7 84.3 63.3 Number of shares of DKK 1 each
EBITDA 2.6 12.0 40.7 29.6 (including treasury shares) 42,200,000 42,200,000 42,200,000 42,200,000
Profit/loss from the sale Number of shares of DKK 1 each
of vessels, etc., net 2.3 1.1 8.8 0.9 (excluding treasury shares) 40,467,615 40,467,615 40,467,615 40,467,615
EBIT -6.5 -2.2 19.4 -5.0 Number of treasury shares 1,732,385 1,732,385 1,732,385 1,732,385
Profit/loss for the period -9.3 0.1 9.5 -2.5 Earnings per share (EPS) (DKK) -0.23 (-1.48) 0.00 (0.02) 0.23 (1.47) -0.06 (-0.41)
Adjusted Result for the period* -11.6 3.7 0.7 1.3 Diluted earnings per share (diluted EPS) (DKK) -0.23 (-1.48) 0.00 (0.02) 0.23 (1.47) -0.06 (-0.41)
Book value per share
2018 2017 2018 2017 (excluding treasury shares) (DKK) 1) 21.04 (135.51) 19.80 (124.82) 21.04 (135.51) 19.80 (124.82)
30/9 30/9 30/9 30/9 Share price at end of period (DKK) 97.6 134.5 97.6 134.5
Price/book value (DKK) 1) 0.72 1.08 0.72 1.08
STATEMENT OF FINANCIAL POSITION
Total assets 1,312.4 1,280.9 1,312.4 1,280.9 OTHER KEY FIGURES AND
Equity 851.4 801.3 851.4 801.3 FINANCIAL RATIOS:
Liabilities 466.0 479.6 466.0 479.6 EBITDA-RATIO 2) 0.4% 2.6% 2.2% 2.3%
Invested capital 919.6 834.9 919.6 834.9 ROIC -2.9% -1.0% 2.9% -0.8%
Net interest-bearing assets -68.2 -33.6 -68.2 -33.6 ROE -4.4% 0.1% 1.5% -0.4%
Cash and securities 164.8 190.8 164.8 190.8 Equity ratio 64.7% 62.6% 64.7% 62.9%
Total no. of ship days for NORDEN 31,343 24,289 90,195 68,162
2018 2017 2018 2017 USD/DKK rate at end of the period 644.13 630.38 644.13 630.38
Q3 Q3 Q1-Q3 Q1-Q3 Average USD/DKK rate 641.15 633.43 624.35 668.75
CASH FLOWS
1) Converted at the USD/DKK rate at end of period.
2) The ratios were computed in accordance with ”Recommendations and Financial Ratios 2015” published by the Danish Society of Financial Analysts.
However, ”Profits from the sale of vessels, etc.” have not been included in EBITDA.
* Adjusted Result for the period was computed as “Profit/loss for the period” adjusted for “Profit from the sale of vessels, etc.” including vessels in joint
ventures.
From operating activities 4.6 -16.0 -4.0 -35.1
From investing activities -22.7 -25.8 -49.0 20.0
– hereof investments in property, equipment and vessels -50.3 -83.3 -146.9 -93.1
From financing activities -6.2 19.5 11.3 6.0

4/25
ANNOUNCEMENT NO. 12 – 7 NOVEMBER 2018
THE GROUP
Comments on the development of NORDEN in the third quarter of 2018
• Adjusted Result: USD -12 million
• USD 10 million share buy-back programme to be initiated
• New candidates to the board of directors
Results In the third quarter, NORDEN realised an Adjusted Result for the period of USD -12 million (Q3 2017: USD 4 million) in a historically poor tanker market, which overshadowed a healthy dry cargo market. The third quarter result corresponds to an EBIT of USD -7 million (USD -2 million) and is less impacted by utilisation of provisions for onerous contracts (USD 5.2 million, compared to USD 21.0 million in the third quarter of 2017).
Cash flow and activity Cash flow from operating activities amounted to USD 5 million for the quarter, a significant improvement compared to the same period last year (USD -16 million). Contribution margin amounted to USD 17 million (USD 24 million). Overhead and administration costs increased by USD 3 million to USD 15 million compared to the third quarter of 2017 primarily due to investment to support the gradual expansion of Dry Operator. Equity increased by USD 50 million compared to the third quarter of 2017 while the book value per share increased to DKK 135,5 (DKK 124,8)
Financial position At the end of the quarter, NORDEN’s cash and securities amounted to USD 165 million. Combined with NORDEN’s share of cash in joint ventures of USD 4 million and undrawn credit facilities totalling USD 189 million, liquidity amounted to USD 358 million. NORDEN has sufficient cash to cover the outstanding payments of USD 94 million due in 2018-2020 in connection with newbuilding instalments. NORDEN’s net commitments, calculated as total bank debt, T/C commitments and outstanding payments on newbuildings less cash and future earnings from coverage, were reduced by USD 63 million during the quarter to USD 715 million partly due to reduced short-term exposure in Tankers.
Share repurchase programme The Board of Directors has approved to initiate a share buy-back programme of USD 10 million which will be announced separately later today.
New candidates to the board of directors The board of directors proposes election of 2 new candidates to the board:
Helle Østergaard Kristiansen, female, Danish citizen, CFO in Danske Commodities, which was recently sold to Equinor. Danske Commodities is an energy trading house, trading power, gas and certificates throughout Europe. Helle Østergaard Kristiansen has comprehensive experience with finance, risk
management, optimising processes and digitalisation.
Stephen John Kunzer, male, British citizen, former CEO of Eastern Pacific. An accomplished shipping Chief Executive with 30 years’ experience, of which the last 20 years in Asia latterly running one of the world’s largest private family ship owners with crude and product tankers, containerships, bulk carriers, PCTCs, stainless steel chemical tankers and LPG tankers.
An Extraordinary General Meeting with the sole agenda item of conducting election to the board of directors will be held at 12 December 2018. Separate announcement with further details will follow.
Impairment assessment NORDEN has carried out a routine assessment of indicators of impairment. Based on this, the Company has assessed that in the cash generating unit Dry Cargo there is no indication of a need for impairment or reversal of previous impairment, and that there is no need for further provisions for onerous contracts or reversal hereof.
For the cash generating unit Tankers, Management has deemed it necessary to carry out an impairment test. Based on this, Management has assessed that the long-term values of the tanker fleet continue to support the carrying amounts. The assessment is obviously subject to uncertainty. For a more detailed description, please see note 5.
-15-10
-505
1015202530
Q3 2017 Q4 2017 Q1 2018 Q2 2018 Q3 2018
Adjusted Result for the period
USD million
0
100
200
300
400
500
Q3 2017 Q4 2017 Q1 2018 Q2 2018 Q3 2018
Available liquidity (update)
Cash and securities Undrawn credit facilities
USD million
0
300
600
900
Q3 2017 Q4 2017 Q1 2018 Q2 2018 Q3 2018
Net commitment
USD million

5/25
ANNOUNCEMENT NO. 12 – 7 NOVEMBER 2018
THE GROUP
Selected segment figures Q3 2018
Adjusted Result for the period
USD -12 million
Change in value of owned vessels and newbuildings – Dry Cargo
-1% Change in value of owned vessels and newbuildings - Tankers -4%
USD million Dry Operator Dry Owner Tankers Total
Contribution margin 11.5 10.9 -5.1 17.3
Profit before depreciation, amortisation and impairment losses etc. (EBITDA) 2.7 8.7 -8.8 2.6
Profit/loss from operations (EBIT) 2.6 8.0 -17.1 -6.5
Profit/loss for the period 2.3 6.4 -18.0 -9.3
Adjusted Result for the period 2.3 4.0 -17.9 -11.6
Fleet values
USD million Dry Owner Tankers Total
Market value of owned vessels and newbuildings (charter free) 417 422 839
Broker estimated value of certain charter parties attached to owned vessels 16 0 16
Carrying amount / costs 389 520 909
Market value vs. book value 43 -98 -54
Theoretical value of purchase and extension options 24 12 36
Adjusted Result for the period
For further information on the segments see note 2.
-18
-12
-6
0
6
12
Q3 2017 Q4 2017 Q1 2018 Q2 2018 Q3 2018
Dry Owner
USD million
-18
-12
-6
0
6
12
Q3 2017 Q4 2017 Q1 2018 Q2 2018 Q3 2018
Dry Operator
USD million
-18
-12
-6
0
6
12
Q3 2017 Q4 2017 Q1 2018 Q2 2018 Q3 2018
Tankers
USD million

6/25
ANNOUNCEMENT NO. 12 – 7 NOVEMBER 2018
DRY OPERATOR
Focus on profitability
Dry Operator key figures (USD million) USD million 2017
Q3
2018
Q3
Last 4
Quarters
Contribution margin 3.0 11.5 65.8
O/A costs -7.6 -8.8 -35.8
EBIT -5.0 2.6 29.6
Adjusted Result -2.1 2.3 27.1
Vessel days 23,187 23,833 96,952
CM per vessel day (USD/day) 129 483 679
Adj. Result per vessel day
(USD/day)
-91 96 280
Contribution margin (CM) is defined as “Revenue” less “Vessel operating
costs” plus “Other operating income, net”
• Adjusted Result for the third quarter: USD 2 million
• USD 66 million generated in the last 4 quarters before overheads
• Adjusted Result per vessel day last 4 quarters: 280 USD/day
Results for the third quarter of 2018 In the third quarter of 2018, Dry Operator generated a Contribution margin of USD 11.5 million and an Adjusted Result of USD 2.3 million for the period. The result is an improvement compared to the same period in 2017, where the Adjusted Result amounted to USD -2.1 million.
Over the last 4 quarters the Dry Operator
has generated an Adjusted Result of USD 27
million which is considered as a highly
attractive risk-adjusted result given the low
capital requirements of this business unit.
In total, 96,952 vessel days have been
handled by the operator in the latest 4
Average number of vessels operated in the third quarter
264
quarters with an average Contribution margin per vessel day of USD 679 per day. The Adjusted Result per vessel day was USD 280. Activity in the third quarter A total of 23,833 vessels days, the equivalent of an average fleet size of 264 vessels, were operated by Dry Operator in the third quarter of 2018. This is an increase of 3% compared to the same quarter last year, but lower than the high activity levels in the second quarter of 2018. During the third quarter, Dry Operator focused on inter basin employment of vessels and chose not to charter in a large number of vessels and position them into the Atlantic. NORDEN had more moderate expectations to the North American grain season than in previous years – partly as a result of trade tariffs – and rates on period vessels from the Pacific were relative expensive.
Well positioned for fourth quarter
Despite the strategy of a continued
expansion of Dry Operator, NORDEN
decided to temporarily reduce the
number of chartered vessels
to protect the value creation during the
quarter and to optimise the positioning
for the fourth quarter of 2018. As a
consequence, the results for Dry
Operator are expected to be significantly
higher in the fourth quarter than in third
quarter. Looking further ahead Dry Operator continues to expand its research and risk management capabilities while improving margins from the logistical operation. The focus will be on profitable growth taking advantage of the scalability of the model.
“Adjusted Result latest 4 quarters: USD 27 million”
23187 2348724442
25190
23833
20.00021.00022.00023.00024.00025.00026.00027.00028.000
Q3 17 Q4 17 Q1 18 Q2 18 Q3 18
Dry Operator vessel days

7/25
ANNOUNCEMENT NO. 12 – 7 NOVEMBER 2018
DRY OWNER
Continued gradual market improvement
Source: Baltic Exchange
Dry Owner TCE Days USD/day
Panamax 1,841 12,160
Supramax 2,061 11,402
Handysize 745 9,499
Dry Owner key figures (USD million) USD million 2017
Q3
2018
Q3
2018
YTD
Contribution margin 12.0 10.9 30.1
O/A costs -1.9 -2.2 -6.5
EBIT 3.4 8.0 28.8
Adjusted Result 6.8 4.0 12.6 Contribution margin (CM) is defined as “Revenue” less “Vessel operating costs” plus “Other operating income, net”
• USD 4 million in Adjusted Result in the third quarter
• Ownership further concentrated
Results for the third quarter of 2018
In the third quarter, Dry Owner realised an
Adjusted Result of USD 4 million. This
corresponds to an EBIT of USD 8 million.
For the first three quarters of 2018, Dry
Owner has realised an Adjusted Result of
USD 13 million corresponding to an EBIT of
USD 29 million.
Dry cargo market
In the third quarter, the dry cargo market
was stronger than in the same period of
2017. The average Baltic earnings for
Supramax vessels was 25% higher than in
the third quarter of 2017, and Panamax
rates were 20% higher. The improvements
were driven by an overall strong global
demand growth and fairly low fleet growth.
Based forecasts of continued low fleet
growth, NORDEN expects rates in 2019 to
resemble the rate environment seen in
2018. Global macro-economic conditions
will likely be slightly weaker than in 2018,
but fleet growth continues to be at
manageable levels – especially for
Supramax and Panamax vessels.
Growth in Chinese economic activity and
commodity imports are slowing down
compared to the levels seen over the last 2
years. The Chinese government, however,
has taken initial steps to stimulate the
economy which are expected to lead to
improved growth levels in imports in 2019.
Dry owner fleet and activity
NORDEN continues to concentrate the Dry
Owner fleet on Supramax and Panamax
vessels. During the third quarter, the 2
Handysize vessels which were sold during
the second quarter of 2018 were delivered
to their new owners.
Additionally, NORDEN entered into
agreements with Japanese tonnage
providers to charter in 2 Panamax, (82,000
tdw.) over a 5-year duration with delivery
in 2020 and purchase option and attractive
optionality. The vessels will be of eco
design and fitted with scrubbers.
Cover increased
The Dry Owner has continued to increase
the cover for 2019 and has covered 100%
of its capacity the next 6 months. NORDEN
still expects a healthy dry cargo market in
2019, leaving the short-term exposure to
be managed by the Dry Operator while Dry
Owner will benefit from locked-in revenue.
Fleet value
Based on the average of 3 independent
broker valuations, the market value of
NORDEN’s owned dry cargo vessels and
newbuilding orders was estimated at USD
432 million. This is a decrease of 1 %
compared to the end of the second quarter
2018 for the vessels owned throughout the
period. As of the end of the third quarter,
Dry Owner had chartered in 11,250 and
12,866 vessel days for 2019 and 2020,
respectively.
Market value of dry cargo vessels (USD)
432 million
0
5
10
15
20
25
Jan
-16
Ap
r-1
6
Jul-
16
Oct
-16
Jan
-17
Ap
r-1
7
Jul-
17
Oct
-17
Jan
-18
Ap
r-1
8
Jul-
18
Asset Values 5-year old
Panamax Supramax
Million USD

8/25
ANNOUNCEMENT NO. 12 – 7 NOVEMBER 2018
DRY OWNER
Capacity and coverage
Year to date, Dry Owner has generated an Adjusted Result of
USD 13 million
A considerable part of NORDEN’s exposure consists of vessel days from long-term chartered capacity which should be included when the Company’s capital structure is evaluated. The full annual details of the portfolio as well as a “ready to use” calculator to estimate the value of the portfolio based on expectations for the long-term rates in dry cargo markets can be found on NORDEN’s website www.ds-norden.com.
At 30 September 2018
Q4 2018 2019 2020 Q4 2018 2019 2020
Own vessels Ship days
Panamax 368 1,376 1,444
Supramax 746 3,694 4,028
Handysize 368 1,448 1,452
Total 1,482 6,518 6,924
Chartered vessels Cash costs for T/C capacity (USD per day)
Panamax 1,504 5,996 6,405 12,554 13,415 13,413
Supramax 1,069 4,106 5,873 11,528 12,064 12,011
Handysize 344 1,148 588 11,689 12,241 11,796
Total 2,917 11,250 12,866 12,076 12,802 12,700
Cash costs for total capacity (USD per day)*
Total capacity 4,399 17,768 19,790 9,716 10,099 10,160
Coverage Revenue from coverage (USD per day)
Panamax 2,105 5,514 3,633 12,824 13,540 14,090
Supramax 2,096 7,357 4,784 11,882 12,105 12,292
Handysize 462 1,933 1,746 11,568 11,467 11,629
Total 4,663 14,803 10,163 12,276 12,556 12,821
Coverage in %
Panamax 112% 75% 46%
Supramax 116% 94% 48%
Handysize 65% 74% 86%
Total 106% 83% 51%
Accounting effect of
provision (USD million) 5 21 12
* Including cash running costs of owned vessels. Costs are excluding O/A.

9/25
ANNOUNCEMENT NO. 12 – 7 NOVEMBER 2018
TANKERS
Weak third quarter market – improvement expected in the fourth quarter
Tankers key figures (USD million)
Source: NORDEN spot
Source: Energy Aspects *Expected
Tankers key figures (USD million) USD million 2017
Q3
2018
Q3
2018
YTD
Contribution margin 8.7 -5.1 12.2
O/A costs -2.2 -3.7 -10.9
EBIT -0.6 -17.0 -24.7
Adjusted Result -1.0 -17.9 -25.1 Contribution margin (CM) is defined as “Revenue” less “Vessel operating costs” plus “Other operating income, net”
• Adjusted Result for the period: USD -18 million
• Improvement expected in the fourth quarter
Results for the third quarter of 2018
In the historically weak third quarter of
2018, NORDEN’s tanker business
generated an Adjusted Result of -18
million (Q3 2017: USD -1 million),
corresponding to an EBIT of USD -17
million.
The Company’s Handysize tankers
generated daily earnings of an average of
USD 9,062, while daily earnings in the MR
fleet amounted to USD 10,347. Compared
to the average 1-year T/C rate during the
last 12 months the NORDEN result was 1%
lower corresponding to USD -161 per
vessel day.
Severe headwind
The product tanker market suffered
severe headwinds during the quarter and
spot rates were the lowest seen in a
decade. The main factors pushing the
market down were declining product
imports in Asia, South America and
Middle East in combination with
significant competition from crude
vessels due to low rates in that market.
Improvement in fourth quarter
While high oil prices continue to dampen
oil demand growth, slowing supply
growth and normal seasonality imply
that rates are expected to improve in the
fourth quarter. At the beginning of the
fourth quarter rates for crude vessels
have improved and there have also been
positive signs for product tanker rates in
the Atlantic.
in 2019, additions to refinery capacity,
low fleet growth and a better crude
tanker market are expected to lead to
improving product tanker rates. In
addition, the introduction of the IMO
sulphur cap on emissions from bunker
fuel is expected to further support the
market balance starting in the second
half of 2019.
Tanker fleet and activity
At the end of the third quarter 2018,
NORDEN owned a total of 22 tanker
vessels – 13 MR's and 9 Handysize
tankers. During the quarter, NORDEN
took delivery of 2 MR vessels acquired
during the second quarter and
delivered a previously sold Handysize
tanker to her new owners. In the third
quarter, period rates were not aligned with
spot rates and NORDEN utilized the gap to
cover part of its exposure for the next 6
months while not taking in new short-term
capacity. With 38 % of MR capacity covered
for the fourth quarter of 2018 at 12,310
USD/day NORDEN expects the Tanker
result to improve compared to the third
quarter result.
Vessel values NORDEN has carried out an impairment test for the Tanker cash generating unit. Based on this, Management has assessed that the long-term values of the tanker fleet continue to support the carrying amounts. The assessment is obviously subject to uncertainty. For a more detailed description, please see note 5.
0
5.000
10.000
15.000
20.000
25.000
Q1
20
16
Q2
20
16
Q3
20
16
Q4
20
16
Q1
20
17
Q2
20
17
Q3
20
17
Q4
20
17
Q1
20
18
Q2
20
18
Q3
20
18
MR Spot rates
USD/day
0,0%
1,0%
2,0%
3,0%
2013 2014 2015 2016 2017 2018*2019*
CPP demandYoY growth
10/25
ANNOUNCEMENT NO. 12 – 7 NOVEMBER 2018
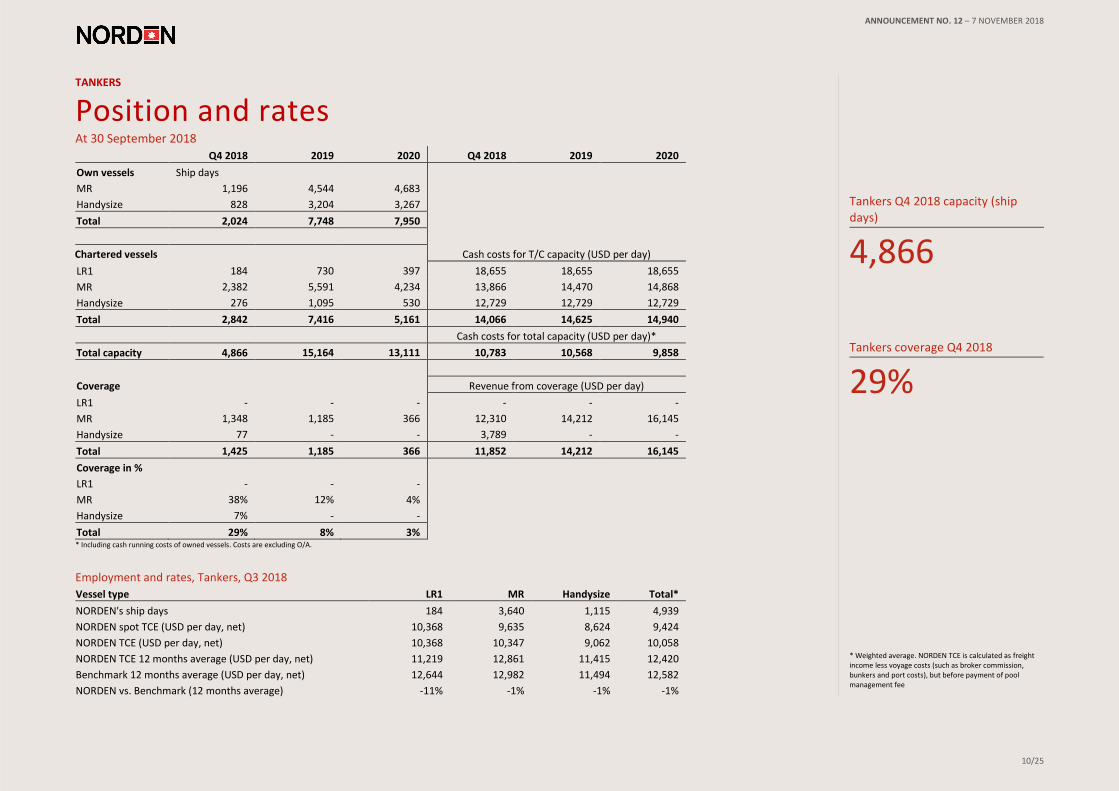
TANKERS
Position and rates At 30 September 2018
Q4 2018 2019 2020 Q4 2018 2019 2020
Own vessels Ship days
MR 1,196 4,544 4,683
Handysize 828 3,204 3,267
Total 2,024 7,748 7,950
Chartered vessels Cash costs for T/C capacity (USD per day)
LR1 184 730 397 18,655 18,655 18,655
MR 2,382 5,591 4,234 13,866 14,470 14,868
Handysize 276 1,095 530 12,729 12,729 12,729
Total 2,842 7,416 5,161 14,066 14,625 14,940
Cash costs for total capacity (USD per day)*
Total capacity 4,866 15,164 13,111 10,783 10,568 9,858
Coverage Revenue from coverage (USD per day)
LR1 - - - - - -
MR 1,348 1,185 366 12,310 14,212 16,145
Handysize 77 - - 3,789 - -
Total 1,425 1,185 366 11,852 14,212 16,145
Coverage in %
LR1 - - -
MR 38% 12% 4%
Handysize 7% - -
Total 29% 8% 3% * Including cash running costs of owned vessels. Costs are excluding O/A.
Employment and rates, Tankers, Q3 2018
Vessel type LR1 MR Handysize Total*
NORDEN's ship days 184 3,640 1,115 4,939
NORDEN spot TCE (USD per day, net) 10,368 9,635 8,624 9,424
NORDEN TCE (USD per day, net) 10,368 10,347 9,062 10,058
NORDEN TCE 12 months average (USD per day, net) 11,219 12,861 11,415 12,420
Benchmark 12 months average (USD per day, net) 12,644 12,982 11,494 12,582
NORDEN vs. Benchmark (12 months average) -11% -1% -1% -1%
Tankers Q4 2018 capacity (ship days)
4,866
Tankers coverage Q4 2018
29%
* Weighted average. NORDEN TCE is calculated as freight income less voyage costs (such as broker commission, bunkers and port costs), but before payment of pool management fee

11/25
ANNOUNCEMENT NO. 12 – 7 NOVEMBER 2018
THE GROUP
Outlook for 2018
“NORDEN expects an Adjusted Result for the year of USD 0 to 30 million.”
Expectations for 2018 USD million Adjusted Result for the year
Dry Operator 20 to 30
Dry Owner 15 to 20
Tankers -35 to -20
Group 0 to 30
Forward-looking statements
This report includes forward-looking statements
reflecting management’s current perception of
future trends and financial performance. The
statements for the rest of 2018 and the years to
come naturally carry some uncertainty, and
NORDEN’s actual results may therefore differ from
expectations. Factors that may cause the results
achieved to differ from the expectations are, among
other things, but not exclusively, changes in the
macroeconomic and political conditions – especially
in the Group’s key markets – changes in NORDEN’s
assumptions of rate development and operating
costs, volatility in rates and vessel prices, changes in
legislation, possible interruptions in traffic and
operations as a result of external events, etc.
NORDEN maintains expectations NORDEN maintains the expectations for the Adjusted Result for the year at USD 0-30 million. Tankers An expected seasonal improvement in tanker rates have been observed in recent weeks – especially in the Atlantic region where NORDEN currently has the greatest spot exposure. The full year expectations for Tankers is maintained on that basis – although in the lower part of the guidance range. Dry Operator Dry Operator continues to perform well and the expectations for the full year results are maintained. Dry Owner The dry cargo market has developed in line with expectations, and due to high coverage, there is limited uncertainty around the 2018 result for Dry Owner and the guidance is maintained.
Risk and uncertainties
The Dry Operator results are sensitive to both market conditions as well as NORDEN’s ability to
identify and execute business opportunities. At the end of September, Dry Owner had no
material exposure to spot rates in the second half of 2018. Earnings expectations in Tankers
primarily depend on the development in the spot market. Based on about 3,400 open vessel
days in Tankers at the end of September, a change of USD 1,000 per day in expected T/C
equivalents would mean a change in earnings of approximately USD 3.4 million.
All business units are furthermore sensitive to counterparty risks as well as operational risks.
Events after the reporting date No events have occurred after 30 September 2018 which significantly affect the interim report for the period 1 January – 30 September 2018, other than the developments disclosed in the Management Review.

12/25
ANNOUNCEMENT NO. 12 – 7 NOVEMBER 2018
THE GROUP
Statement by the Board of Directors and Executive Management
NORDEN A/S’ consolidated activities
and cash flows for the period 1 January
to 30 September 2018.
Furthermore, in our opinion the
Management Review gives a fair
representation of the Group’s activities
and financial position as well as a
description of the material risks and
uncertainties which the Group is facing.
The Board of Directors and the Executive
Management have today reviewed and
approved the Interim Report for the period
1 January to 30 September 2018 of
Dampskibsselskabet NORDEN A/S.
The interim consolidated financial
statements of Dampskibsselskabet NORDEN
A/S have been prepared in accordance with
IAS 34 Interim Financial Reporting as
adopted by the EU and additional Danish
disclosure requirements for interim financial
reporting of listed companies.
The interim consolidated financial
statements have not been subject to audit
or review by the Independent Auditors of
Dampskibsselskabet NORDEN A/S.
We consider the accounting policies applied
to be appropriate and the accounting
estimates made to be adequate.
Furthermore, we find the overall
presentation of the Interim Report to
present a true and fair view.
Besides what has been disclosed in the
Interim Report, no other significant changes
in the Group’s risks and uncertainties have
occurred relative to what was disclosed in
the consolidated annual report for 2017.
In our opinion, the interim consolidated
financial statements give a true and fair
view of Dampskibsselskabet NORDEN A/S’
consolidated assets, equity and liabilities
and the financial position at 30 September
2018 as well as the result of
Dampskibsselskabet
Hellerup, 7 November 2018
Executive Management
Jan Rindbo
Chief Executive Officer
Martin Badsted
Chief Financial Officer
Board of Directors Klaus Nyborg Chairman
Johanne Riegels Østergård Vice Chairman
Karsten Knudsen
Thomas Intrator Susanne Fauerskov Jesper Svenstrup Lars Enkegaard Biilmann (employee-elected) (employee-elected) (employee-elected)

13/25
ANNOUNCEMENT NO. 12 – 7 NOVEMBER 2018
Consolidated income statement
Note USD million
2018
Q3
2017
Q3
2018
Q1-Q3
2017
Q1-Q3
2017
Q1-Q4
2 Revenue 621.9 460.0 1,829.5 1,299.7 1,808.6
2 Other operating income 0.9 2.8 1.8 8.8 11.1
2 Vessel operating costs -605.5 -439.1 -1,747.0 -1,245.2 -1.703.0
2 Contribution margin 17.3 23.7 84.3 63.3 116.7
2, 3 Overhead and administration costs -14.7 -11.7 -43.6 -33.7 -48.6
Profit/loss before depreciation, amortisation and impairment losses,
etc. (EBITDA) 2.6 12.0 40.7 29.6 68.1
2 Profit/loss from the sale of vessels, etc., net 2.3 1.1 8.8 0.9 0.9
2, 5 Depreciation, amortisation and impairment losses -11.6 -10.7 -32.9 -31.5 -42.2
2 Share of profit/loss of joint ventures 0.2 -4.6 2.8 -4.0 -3.5
Profit/loss from operations (EBIT) -6.5 -2.2 19.4 -5.0 23.3
2 Financial income 2.9 1.3 5.3 11.9 14.0
2 Financial expenses -5.3 -3.2 -12.2 -11.8 -14.9
Profit/loss before tax -8.9 -4.1 12.5 -4.9 22.4
Tax -0.4 4.2 -3.0 2.4 2.2
PROFIT/LOSS FOR THE PERIOD -9.3 0.1 9.5 -2.5 24.6
Attributable to:
Shareholders of NORDEN -9.3 0.1 9.5 -2.5 24.6
Earnings per share (EPS), USD -0.23 0.00 0.23 -0.06 0.61
Diluted earnings per share, USD -0.23 0.00 0.23 -0.06 0.61
Adjusted Result for the period -11.6 3.7 0.7 1.3 28.4
14/25
ANNOUNCEMENT NO. 12 – 7 NOVEMBER 2018
Consolidated statement of comprehensive income
Note USD million
2018
Q3
2017
Q3
2018
Q1-Q3
2017
Q1-Q3
2017
Q1-Q4
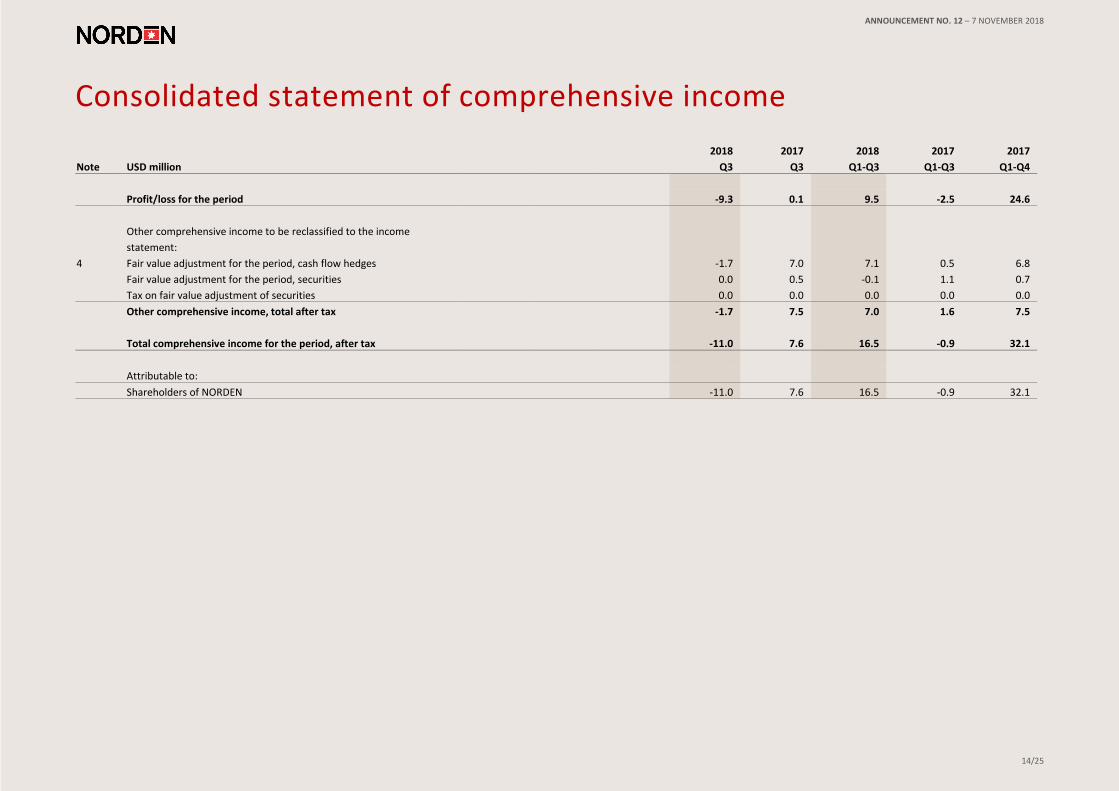
Profit/loss for the period -9.3 0.1 9.5 -2.5 24.6
Other comprehensive income to be reclassified to the income
statement:
4 Fair value adjustment for the period, cash flow hedges -1.7 7.0 7.1 0.5 6.8
Fair value adjustment for the period, securities 0.0 0.5 -0.1 1.1 0.7
Tax on fair value adjustment of securities 0.0 0.0 0.0 0.0 0.0
Other comprehensive income, total after tax -1.7 7.5 7.0 1.6 7.5
Total comprehensive income for the period, after tax -11.0 7.6 16.5 -0.9 32.1
Attributable to:
Shareholders of NORDEN -11.0 7.6 16.5 -0.9 32.1

15/25
ANNOUNCEMENT NO. 12 – 7 NOVEMBER 2018
Consolidated statement of financial position
Note USD million
2018
30/9
2017
30/9
2017
31/12 Note USD million
2018
30/9
2017
30/9
2017
31/12
ASSETS EQUITY AND LIABILITIES
5 Vessels 744.3 710.6 691.7 Share capital 6.7 6.7 6.7
Property and equipment 53.0 49.7 49.6 Reserves 14.0 1.1 7.0
6 Prepayments on vessels and newbuildings 28.2 26.5 33.9 Retained earnings 830.7 793.5 820.7
Investments in joint ventures 11.2 10.7 11.3 Equity 851.4 801.3 834.4
Non-current assets 836.7 797.5 786.5
Loans 178.8 172.4 195.5
Inventories 69.6 66.6 67.7 Provisions 26.0 52.4 42.5
Freight receivables 140.9 113.4 124.0 Non-current liabilities 204.8 224.8 238.0
Other receivables 26.4 43.6 33.9 Loans 54.3 52.0 26.3
Prepayments 79.0 69.0 79.0 Provisions 25.5 67.1 36.1
Securities 4.2 12.0 8.1 Trade payables 92.8 66.0 62.6
Cash and cash equivalents 160.6 178.8 211.4 Debt to joint ventures 4.7 0.4 1.9
Income tax payable 1.8 0.0 0.0
480.7 483.4 524.1 Other payables 36.8 36.0 74.6
Deferred income 45.3 33.3 51.3
7 Vessels held for sale 0.0 0.0 15.9 261.2 254.8 252.8
Current assets 480.7 483.4 540.0
Liabilities relating to vessels held for sale 0.0 0.0 1.3
TOTAL ASSETS 1,317.4 1,280.9 1,326.5 Current liabilities 261.2 254.8 254.1
Liabilities 466.0 479.6 492.1
TOTAL EQUITY AND LIABILITIES 1,317.4 1,280.9 1,326.5

16/25
ANNOUNCEMENT NO. 12 – 7 NOVEMBER 2018
Consolidated statement of cash flows
USD million
2018
Q3
2017
Q3
2018
Q1-Q3
2017
Q1-Q3
2017
Q1-Q4
Profit/loss for the period -9.3 0.1 9.5 -2.5 24.6
Reversed depreciation, amortisation and impairment losses 11.6 10.7 32.9 31.5 42.2
Reversed financial items, net 2.4 1.9 6.9 -0.1 0.9
Reversed change in provision -5.3 -21.0 -23.2 -64.2 -83.8
Reversed profit/loss from the sale of vessels etc., net -2.3 -1.1 -8.8 -0.9 -0.9
Reversed share of profit/loss of joint ventures -0.2 4.6 -2.8 4.0 3.5
Other reversed non-cash operating items -0.6 -1.8 2.0 -0.7 1.8
Change in working capital 11.8 -6.2 -13.3 3.3 25.0
Financial payments, received 2.9 -0.2 5.7 5.4 7.0
Financial payments, paid -5.2 -3.0 -11.7 -10.9 -14.0
Income tax paid -1.2 0.0 -1.2 0.0 0.0
Cash flows from operating activities 4.6 -16.0 -4.0 -35.1 6.3
Investments in vessels and vessels held for sale -41.3 -53.2 -66.6 -60.6 -93.0
Investments in other tangible assets -0.4 0.0 -4.2 0.0 -0.4
Additions in prepayments on newbuildings -8.6 -30.1 -76.1 -32.5 -13.5
Additions in prepayments received on sold vessels -3.6 -2.1 -1.3 -5.1 -3.8
Investments in joint ventures 0.0 0.0 -1.1 0.0 0.0
Proceeds from sale of vessels and newbuildings 35.9 21.2 88.4 46.0 47.8
Proceeds from sale of other tangible assets 0.2 0.0 0.0 0.0 0.0
Sale of securities 0.0 0.0 4.0 9.5 14.0
Change in cash and cash equivalents with rate agreements of more than 3 months -4.9 38.4 7.9 62.7 48.7
Cash flows from investing activities -22.7 -25.8 -49.0 20.0 -0.2
Proceeds from loans 25.0 25.0 106.0 25.0 30.0
Repayments of loans -31.2 -5.5 -94.7 -19.0 -27.0
Cash flows from financing activities -6.2 19.5 11.3 6.0 3.0
Change in liquidity for the period -24.3 -22.3 -41.7 -9.1 9.1
Liquidity at beginning the of period 97.2 116.7 115.6 100.6 100.6
Exchange rate adjustments -0.4 2.5 -1.4 5.4 5.9
Change in liquidity for the period -24.3 -22.3 -41.7 -9.1 9.1
Liquidity at end period 72.5 96.9 72.5 96.9 115.6
Cash and cash equivalents with rate agreements of more than 3 months 88.1 81.9 88.1 81.9 95.8
Cash and cash equivalents at end period acc. to the statement of financial position 160.6 178.8 160.6 178.8 211.4
17/25
ANNOUNCEMENT NO. 12 – 7 NOVEMBER 2018
Consolidated statement of changes in equity
Shareholders of NORDEN
USD million Share capital Reserves
Retained
earnings Total equity
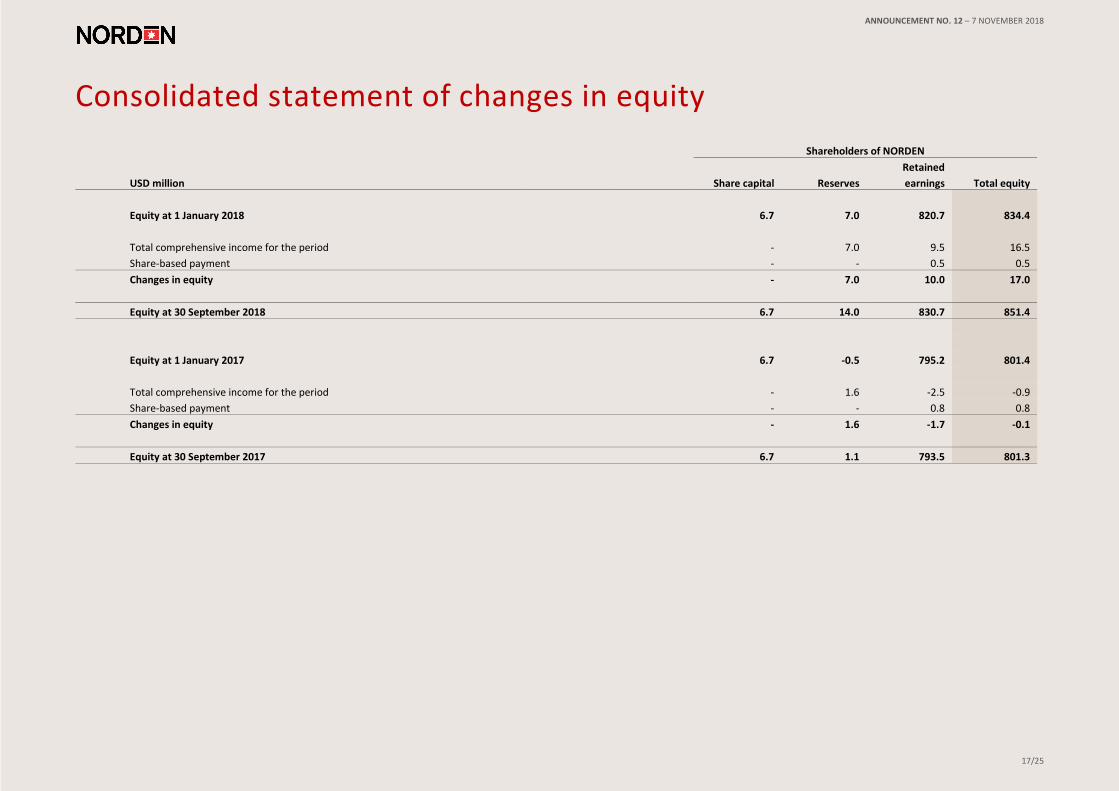
Equity at 1 January 2018 6.7 7.0 820.7 834.4
Total comprehensive income for the period - 7.0 9.5 16.5
Share-based payment - - 0.5 0.5
Changes in equity - 7.0 10.0 17.0
Equity at 30 September 2018 6.7 14.0 830.7 851.4
Equity at 1 January 2017 6.7 -0.5 795.2 801.4
Total comprehensive income for the period - 1.6 -2.5 -0.9
Share-based payment - - 0.8 0.8
Changes in equity - 1.6 -1.7 -0.1
Equity at 30 September 2017 6.7 1.1 793.5 801.3

18/25
ANNOUNCEMENT NO. 12 – 7 NOVEMBER 2018
Notes to the interim consolidated financial statements
1. Significant accounting policies, judgements and estimates
Accounting policies
The interim consolidated financial statements have been prepared in accordance with IAS 34
Interim financial reporting as adopted by the EU and additional Danish disclosure
requirements for the interim financial reporting of listed companies.
The accounting policies, judgements and estimates are consistent with those applied in the
consolidated annual report for 2017, apart from changes described below.
Changes in accounting policies
As from 1 January 2018, NORDEN has implemented IFRS 15, Revenue from contracts with
customers.
According to IFRS 15, revenue is recognised as the customer receives the agreed-upon service.
Under IAS 18, freight income was recognised under the discharge-to-discharge method.
Under IFRS 15, revenue is recognised over the period of time when the cargo is being
transported. At the same time, costs directly attributable to transportation of the vessel to
the loading port are capitalised and amortised over the course of the transportation period.
The transition to IFRS 15 has had no significant impact on NORDEN.
Due to the implementation of IFRS 15, the accounting policy regarding revenue recognition
has amended as follows:
Revenue comprises the present value of services rendered, net of discounts. Services
rendered comprise freight income and time charter income. Revenue is recognised in the
income statement for the financial year as earned.
All freight income and voyage costs are recognized as the freight services are rendered
(percentage of completion). The percentage of completion is determined using the load-
to-discharge method based on the percentage of the estimated duration of the voyage
completed at the reporting date. According to this method, freight income and related
costs are recognised in the income statement according to the entered charter parties
from the vessel’s load date to the delivery of the cargo (discharge). The voyage begins on
the date when the cargo is loaded, and the voyage ends at the date of the next discharge
(load to discharge). This applies to all spot transports and transports under Contracts of
Affreightment (COAs). Costs directly attributable to relocating the vessel to the load port
under the contract are capitalized to the extent that they are recoverable.
Demurrage is recognised if the claim is considered probable.
In addition to IFRS 15, NORDEN has implemented the following standards and
interpretations:
• Amendments to IFRS 2: Classification and Measurement of Share-based Payment
Transactions
• Part of annual improvements 2014-2016
• IFRIC 22 - Foreign currency transactions and advance consideration
Implementation of these standards and interpretations has not had any impact on
recognition and measurement.
For a complete description of accounting policies other than the accounting policy
regarding IFRS 15 above, see the notes to the consolidated financial statements for 2017,
pages 71 - 104 in the consolidated annual report for 2017.

19/25
ANNOUNCEMENT NO. 12 – 7 NOVEMBER 2018
Notes to the interim consolidated financial statements
1. Significant accounting policies, judgements and estimates (continued) Standards not yet in force
At the end of April 2018, IASB has issued and the EU has endorsed the following new financial
reporting standards and interpretations which are estimated to be of relevance to NORDEN
and which are expected to have a material impact on the financial statements:
• IFRS 16 Leasing – For the lessee, the distinction between finance and operating leases will
be removed. In the future, operating leases must be recognised in the balance sheet as an
asset and a corresponding lease commitment. The standard comes into force in 2019.
Please see the annual report 2017 page 73 for an assessment of the potential effect from
adoption of IFRS 16.
Significant accounting estimates and judgements
The accounting estimates and judgments, which Management deems to be significant to the
preparation of the consolidated financial statements, are; impairment test, onerous contracts
and assessment of control in shared ownership – pool arrangements. Reference is made to
note 1.1 on page 72 for a further description in the consolidated annual report for 2017.

20/25
ANNOUNCEMENT NO. 12 – 7 NOVEMBER 2018
* Information is provided on the Group’s 3 business segments, Dry Owner, Dry Operator, together the Dry Cargo and Tankers. Previously NORDEN operated two business segments, Dry Cargo and Tankers. In July 2017, Dry Cargo has been split into a Dry Operator and a Dry Owner. Comparative informations for Q2 2017 and H1 2017 is not provided, as it has not been possible to establish this information. Therefore, segment information for Dry Cargo is presented for both Q2 2017 and Q2 2018 and H1 2017 and H1 2018. Certain changes to the line items presented have been made in Q2 and H1 2018 2018 compared to the previously presented line items due to alignment with the internal financial reporting. ** Adjusted Result for the period was computed as “Profit/loss for the period” adjusted for “Profit/loss from sale of vessels, etc.” including vessels in joint ventures.
Notes to the interim consolidated financial statements 2. Segment Information
USD million Q3 2018 Q3 2017
Dry Operator Dry Owner Eliminations Dry Cargo Tankers Total Dry Cargo Tankers Total
Revenue - services rendered, external 495.3 12.4 - 507.7 114.2 621.9 358.3 101.7 460.0
Revenue, services rendered, internal - 38.0 -38.0 - - - - - -*
Voyage costs -205.7 -0.2 - -205.9 -66.7 -272.6 -157.8 -50.4 -208.2
T/C equivalent revenue 289.6 50.2 -38.0 301.8 47.5 349.3 200.5 51.3 251.8
Other operating income 0.2 0.6 - 0.8 0.1 0.9 2.8 - 2.8
Charter hire -278.3 -33.0 38.0 -273.3 -40.8 -314.1 -180.1 -30.3 -210.4
Operating costs owned vessels - -6.9 - -6.9 -11.9 -18.8 -8.2 -12.3 -20.5
Contribution margin 11.5 10.9 - 22.4 -5.1 17.3 15.0 8.7 23.7
Overhead and administration costs -8.8 -2.2 - -11.0 -3.7 -14.7 -9.5 -2.2 -11.7
Profit/loss before depreciation, amortisation and
Impairment losses, etc. (EBITDA) 2.7 8.7 - 11.4 -8.8 2.6 5.5 6.5 12.0
Profit/loss from sale of vessels, etc. - 2.4 - 2.4 -0.1 2.3 1.1 0.0 1.1
Depreciation, amortisation and impairment losses -0.1 -3.6 - -3.7 -7.9 -11.6 -3.4 -7.3 -10.7
Share of profit/loss of joint ventures - 0.5 - 0.5 -0.3 0.2 -4.8 0.2 -4.6
Profit/loss from operations (EBIT) 2.6 8.0 - 10.6 -17.1 -6.5 -1.6 -0.6 -2.2
Financial income - 1.7 - 1.7 1.2 2.9 0.8 0.5 1.3
Financial expenses - -3.2 - -3.2 -2.1 -5.3 -1.9 -1.3 -3.2
Profit/loss before tax 2.6 6.5 - 9.1 -18.0 -8.9 -2.7 -1.4 -4.1
Tax -0.3 -0.1 - -0.4 0.0 -0.4 3.8 0.4 4.2
Profit/loss for the period 2.3 6.4 - 8.7 -18.0 -9.3 1.1 -1.0 0.1
Adjusted for:
Profit/loss from sale of vessels, etc. - 2.4 - 2.4 -0.1 2.3 3.6 - 3.6
Adjusted Result for the period** 2.3 4.0 - 6.3 -17.9 -11.6 4.7 -1.0 3.7
21/25
ANNOUNCEMENT NO. 12 – 7 NOVEMBER 2018
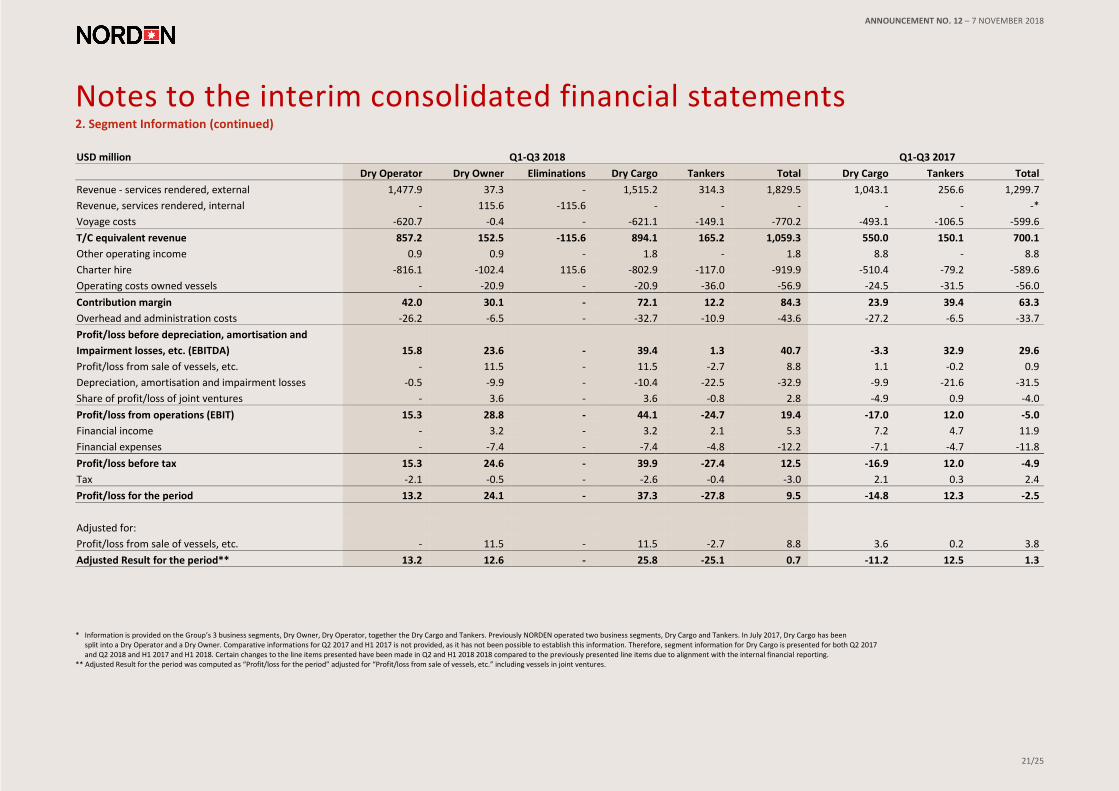
* Information is provided on the Group’s 3 business segments, Dry Owner, Dry Operator, together the Dry Cargo and Tankers. Previously NORDEN operated two business segments, Dry Cargo and Tankers. In July 2017, Dry Cargo has been split into a Dry Operator and a Dry Owner. Comparative informations for Q2 2017 and H1 2017 is not provided, as it has not been possible to establish this information. Therefore, segment information for Dry Cargo is presented for both Q2 2017 and Q2 2018 and H1 2017 and H1 2018. Certain changes to the line items presented have been made in Q2 and H1 2018 2018 compared to the previously presented line items due to alignment with the internal financial reporting. ** Adjusted Result for the period was computed as “Profit/loss for the period” adjusted for “Profit/loss from sale of vessels, etc.” including vessels in joint ventures.
Notes to the interim consolidated financial statements 2. Segment Information (continued)
USD million Q1-Q3 2018 Q1-Q3 2017
Dry Operator Dry Owner Eliminations Dry Cargo Tankers Total Dry Cargo Tankers Total
Revenue - services rendered, external 1,477.9 37.3 - 1,515.2 314.3 1,829.5 1,043.1 256.6 1,299.7
Revenue, services rendered, internal - 115.6 -115.6 - - - - - -*
Voyage costs -620.7 -0.4 - -621.1 -149.1 -770.2 -493.1 -106.5 -599.6
T/C equivalent revenue 857.2 152.5 -115.6 894.1 165.2 1,059.3 550.0 150.1 700.1
Other operating income 0.9 0.9 - 1.8 - 1.8 8.8 - 8.8
Charter hire -816.1 -102.4 115.6 -802.9 -117.0 -919.9 -510.4 -79.2 -589.6
Operating costs owned vessels - -20.9 - -20.9 -36.0 -56.9 -24.5 -31.5 -56.0
Contribution margin 42.0 30.1 - 72.1 12.2 84.3 23.9 39.4 63.3
Overhead and administration costs -26.2 -6.5 - -32.7 -10.9 -43.6 -27.2 -6.5 -33.7
Profit/loss before depreciation, amortisation and
Impairment losses, etc. (EBITDA) 15.8 23.6 - 39.4 1.3 40.7 -3.3 32.9 29.6
Profit/loss from sale of vessels, etc. - 11.5 - 11.5 -2.7 8.8 1.1 -0.2 0.9
Depreciation, amortisation and impairment losses -0.5 -9.9 - -10.4 -22.5 -32.9 -9.9 -21.6 -31.5
Share of profit/loss of joint ventures - 3.6 - 3.6 -0.8 2.8 -4.9 0.9 -4.0
Profit/loss from operations (EBIT) 15.3 28.8 - 44.1 -24.7 19.4 -17.0 12.0 -5.0
Financial income - 3.2 - 3.2 2.1 5.3 7.2 4.7 11.9
Financial expenses - -7.4 - -7.4 -4.8 -12.2 -7.1 -4.7 -11.8
Profit/loss before tax 15.3 24.6 - 39.9 -27.4 12.5 -16.9 12.0 -4.9
Tax -2.1 -0.5 - -2.6 -0.4 -3.0 2.1 0.3 2.4
Profit/loss for the period 13.2 24.1 - 37.3 -27.8 9.5 -14.8 12.3 -2.5
Adjusted for:
Profit/loss from sale of vessels, etc. - 11.5 - 11.5 -2.7 8.8 3.6 0.2 3.8
Adjusted Result for the period** 13.2 12.6 - 25.8 -25.1 0.7 -11.2 12.5 1.3
22/25
ANNOUNCEMENT NO. 12 – 7 NOVEMBER 2018
Notes to the interim consolidated financial statements
3. Overhead and administration costs
USD million
2018 Q3
2017 Q3 2018
Q1-Q3
2017 Q1-Q3
2017 Q1-Q4
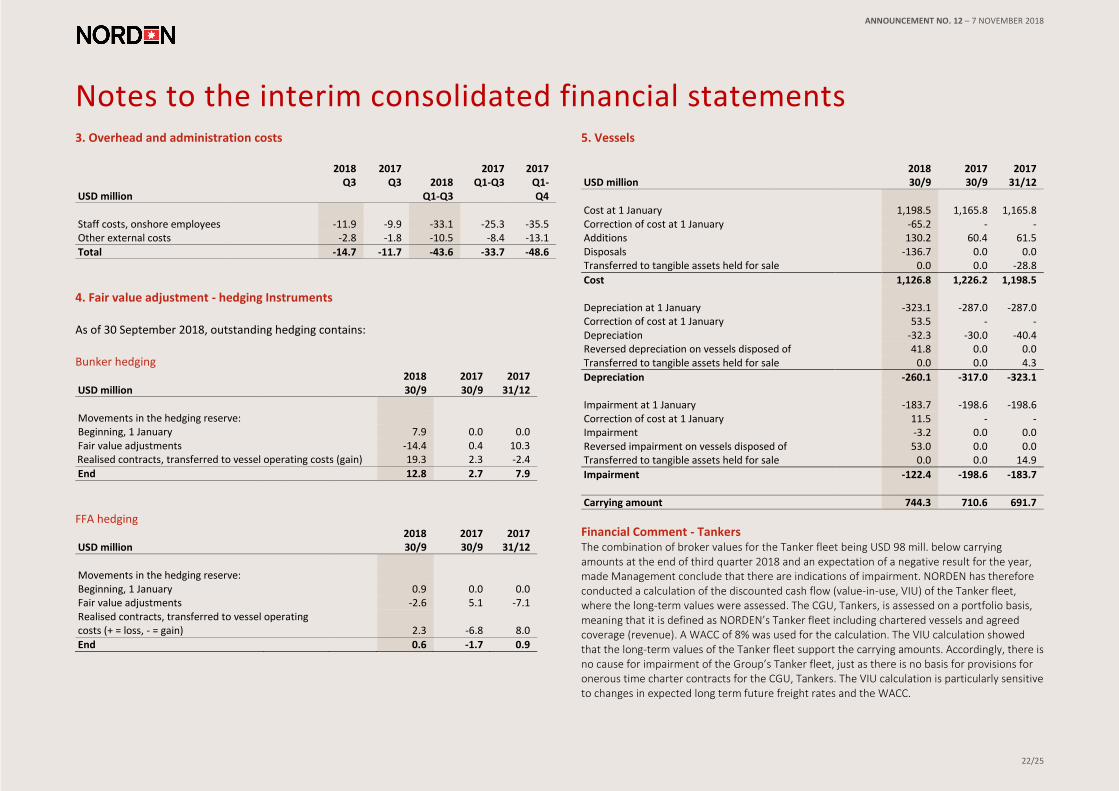
Staff costs, onshore employees -11.9 -9.9 -33.1 -25.3 -35.5 Other external costs -2.8 -1.8 -10.5 -8.4 -13.1
Total -14.7 -11.7 -43.6 -33.7 -48.6
4. Fair value adjustment - hedging Instruments
As of 30 September 2018, outstanding hedging contains:
Bunker hedging
USD million 2018 30/9
2017 30/9
2017 31/12
Movements in the hedging reserve: Beginning, 1 January 7.9 0.0 0.0 Fair value adjustments -14.4 0.4 10.3 Realised contracts, transferred to vessel operating costs (gain) 19.3 2.3 -2.4
End 12.8 2.7 7.9
FFA hedging
USD million 2018 30/9
2017 30/9
2017 31/12
Movements in the hedging reserve: Beginning, 1 January 0.9 0.0 0.0 Fair value adjustments -2.6 5.1 -7.1 Realised contracts, transferred to vessel operating costs (+ = loss, - = gain) 2.3 -6.8 8.0
End 0.6 -1.7 0.9
5. Vessels
USD million 2018 30/9
2017 30/9
2017 31/12
Cost at 1 January 1,198.5 1,165.8 1,165.8 Correction of cost at 1 January -65.2 - - Additions 130.2 60.4 61.5 Disposals -136.7 0.0 0.0 Transferred to tangible assets held for sale 0.0 0.0 -28.8
Cost 1,126.8 1,226.2 1,198.5 Depreciation at 1 January -323.1 -287.0 -287.0 Correction of cost at 1 January 53.5 - - Depreciation -32.3 -30.0 -40.4 Reversed depreciation on vessels disposed of 41.8 0.0 0.0 Transferred to tangible assets held for sale 0.0 0.0 4.3
Depreciation -260.1 -317.0 -323.1 Impairment at 1 January -183.7 -198.6 -198.6 Correction of cost at 1 January 11.5 - - Impairment -3.2 0.0 0.0 Reversed impairment on vessels disposed of 53.0 0.0 0.0 Transferred to tangible assets held for sale 0.0 0.0 14.9
Impairment -122.4 -198.6 -183.7
Carrying amount 744.3 710.6 691.7
Financial Comment - Tankers The combination of broker values for the Tanker fleet being USD 98 mill. below carrying amounts at the end of third quarter 2018 and an expectation of a negative result for the year, made Management conclude that there are indications of impairment. NORDEN has therefore conducted a calculation of the discounted cash flow (value-in-use, VIU) of the Tanker fleet, where the long-term values were assessed. The CGU, Tankers, is assessed on a portfolio basis, meaning that it is defined as NORDEN’s Tanker fleet including chartered vessels and agreed coverage (revenue). A WACC of 8% was used for the calculation. The VIU calculation showed that the long-term values of the Tanker fleet support the carrying amounts. Accordingly, there is no cause for impairment of the Group’s Tanker fleet, just as there is no basis for provisions for onerous time charter contracts for the CGU, Tankers. The VIU calculation is particularly sensitive to changes in expected long term future freight rates and the WACC.
23/25
ANNOUNCEMENT NO. 12 – 7 NOVEMBER 2018
Notes to the interim consolidated financial statements
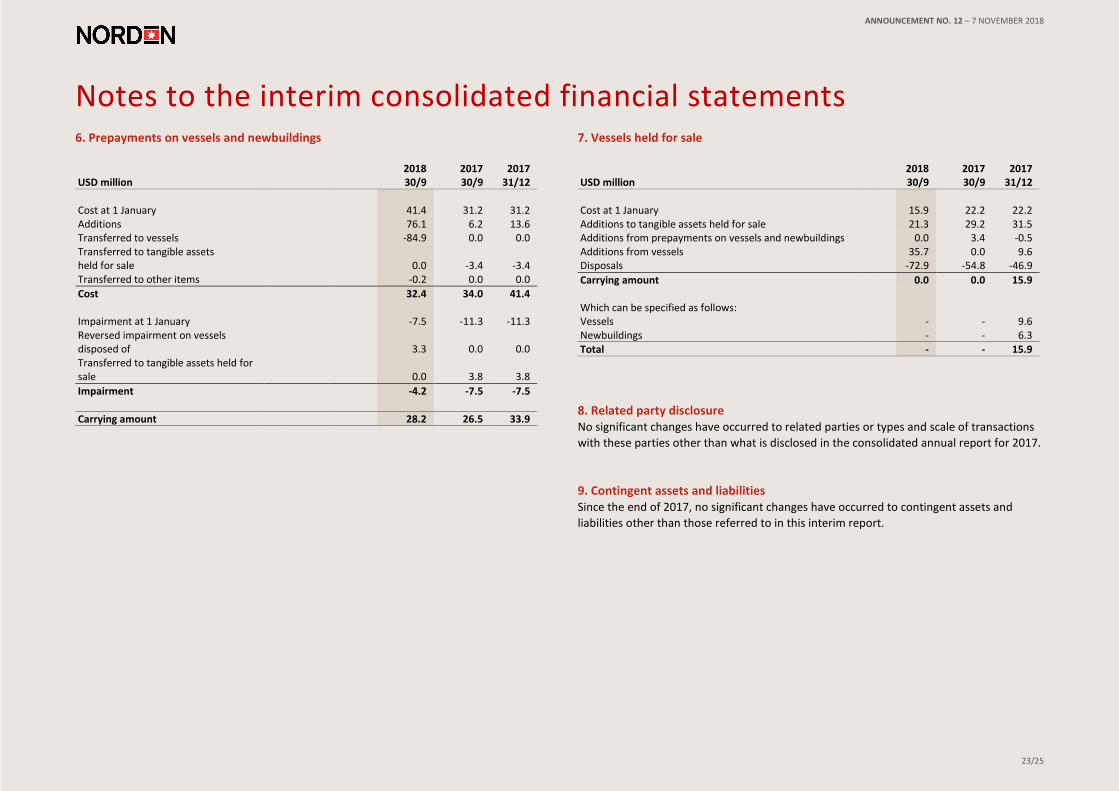
6. Prepayments on vessels and newbuildings
USD million 2018 30/9
2017 30/9
2017 31/12
Cost at 1 January 41.4 31.2 31.2 Additions 76.1 6.2 13.6 Transferred to vessels -84.9 0.0 0.0 Transferred to tangible assets held for sale 0.0 -3.4 -3.4 Transferred to other items -0.2 0.0 0.0
Cost 32.4 34.0 41.4 Impairment at 1 January -7.5 -11.3 -11.3 Reversed impairment on vessels disposed of 3.3 0.0 0.0 Transferred to tangible assets held for sale 0.0 3.8 3.8
Impairment -4.2 -7.5 -7.5
Carrying amount 28.2 26.5 33.9
7. Vessels held for sale
USD million 2018 30/9
2017 30/9
2017 31/12
Cost at 1 January 15.9 22.2 22.2 Additions to tangible assets held for sale 21.3 29.2 31.5 Additions from prepayments on vessels and newbuildings 0.0 3.4 -0.5 Additions from vessels 35.7 0.0 9.6 Disposals -72.9 -54.8 -46.9
Carrying amount 0.0 0.0 15.9 Which can be specified as follows: Vessels - - 9.6 Newbuildings - - 6.3 Total - - 15.9
8. Related party disclosure No significant changes have occurred to related parties or types and scale of transactions
with these parties other than what is disclosed in the consolidated annual report for 2017.
9. Contingent assets and liabilities Since the end of 2017, no significant changes have occurred to contingent assets and
liabilities other than those referred to in this interim report.

24/25
ANNOUNCEMENT NO. 12 – 7 NOVEMBER 2018
Notes to the interim consolidated financial statements
10. Overview of deliveries of owned vessels and fleet values
NORDEN's Tanker fleet at 30 September 2018
Vessel type LR1 MR Handysize Total
Vessels in operation Owned vessels 0.0 13.0 9.0 22.0 Chartered vessels 2.0 28.0 5.0 35.0
Total active fleet 2.0 41.0 14.0 57.0 Vessels to be delivered Owned vessels 0.0 0.0 0.0 0.0 Chartered vessels 0.0 9.0 0.0 9.0 Total vessels to be delivered 0.0 9.0 0.0 9.0 Total gross fleet 2.0 50.0 14.0 66.0
NORDEN's Tanker fleet values at 30 September 2018 (USD million)
Vessel type LR1 MR Handysize Total Average age of owned vessels N/A 6.4 9.1 7.5 Market value of owned vessels 0 294 128 422 and newbuildings* Broker estimated value of certain 0 0 0 0 charter parties attached to owned vessels Carrying amount/cost 0 333 187 520 Value added 0 -39 -59 -98
Value of purchase and extension options on chartered tonnage 0 1 11 12
* Charter free and including joint ventures and assets held for sale, if any.
NORDEN's Dry Owner fleet at 30 September 2018
Vessel type Panamax Supramax Handysize Total
Vessels in operation Owned vessels 4.0 7.5 4.0 15.5 Chartered vessels 12.5 15.0 4.0 31.5
Total active fleet 16.5 22.5 8.0 47.0 Vessels to be delivered Owned vessels 0.0 5.0 0.0 5.0 Chartered vessels 3.0 7.0 1.0 11.0 Total vessels to be delivered 3.0 12.0 1.0 16.0 Total gross fleet 19.5 34.5 9.0 63.0
NORDEN's Dry Owner fleet values at 30 September 2018 (USD million)
Vessel type Panamax Supramax Handysize Total Average age of owned vessels 12.0 4.7 6.3 7.0 Market value of owned vessels and newbuildings* 61 299 57 417 Broker estimated value of certain charter parties 5 0 10 16 attached to owned vessels Carrying amount/cost 58 265 66 389 Value added 8 33 2 43
Value of purchase and extension options on chartered tonnage 14 10 0 24
* Charter free and including joint ventures and assets held for sale, if any.

25/25
ANNOUNCEMENT NO. 12 – 7 NOVEMBER 2018
Notes to the interim consolidated financial statements
10. Overview of deliveries of owned vessels and fleet values (cont.)
Overview of deliveries of owned vessels and fleet values
Name Vessel type Delivery quarter
Hull 10867 Supramax Q4 2018 Hull 10883 Supramax Q1 2019 Hull 10815 Supramax Q1 2019 Hull 10887 Supramax Q1 2020 Hull 10895 Supramax Q2 2020
CAPEX USD million 2018 2019 2020 Total
Newbuilding payments and secondhand purchases 20 39 38 97 Estimated dockings and BWT etc. 1 32 7 40 Estimated cost of scrubbers and installation 0 33 7 40
11. Events after the reporting date
See page 11 in Management Review.