Interim Management’s Discussion and Analysis For the second quarter ended May 31,...
31
Page 1 Interim Management’s Discussion and Analysis For the second quarter ended May 31, 2011 General Management's Discussion and Analysis of the financial position and results of operations ("MD&A") of MTY Food Group Inc. ("MTY”) is supplementary information and should be read in conjunction with the Company’s consolidated financial statements and accompanying notes and with the most recent annual report, for the fiscal year ended November 30, 2010. In the MD&A, MTY Food Group Inc., MTY, or the Company, designates, as the case may be, MTY Food Group Inc. and its Subsidiaries, or MTY Food Group Inc., or one of its subsidiaries. The consolidated financial statements contained in this interim report have not been reviewed by MTY’s external auditors. This MD&A was prepared as at July 1, 2011. Supplementary information about MTY, including its latest annual and quarterly reports, and press releases, is available on SEDAR’s website at www.sedar.com. Forward looking statements This MD&A and, in particular, but without limitation, the sections of this MD&A entitled Outlook, Same Store Sales and Contingent Liabilities, contain forward-looking statements. These forward-looking statements include, but are not limited to, statements relating to certain aspects of the business outlook of the Company during the course of 2011. Forward-looking statements also include any other statements that do not refer to historical facts. A statement we make is forward-looking when it uses what we know and expect today to make a statement about the future. Forward-looking statements may include words such as aim, anticipate, assumption, believe, could, expect, goal, guidance, intend, may, objective, outlook, plan, project, seek, should, strategy, strive, target and will. All such forward-looking statements are made pursuant to the ‘safe harbour’ provisions of applicable Canadian securities laws.
Transcript of Interim Management’s Discussion and Analysis For the second quarter ended May 31,...

Page 1
Interim Management’s Discussion and Analysis For the second quarter ended May 31, 2011
General
Management's Discussion and Analysis of the financial position and results of operations ("MD&A") of MTY Food Group Inc. ("MTY”) is supplementary information and should be read in conjunction with the Company’s consolidated financial statements and accompanying notes and with the most recent annual report, for the fiscal year ended November 30, 2010. In the MD&A, MTY Food Group Inc., MTY, or the Company, designates, as the case may be, MTY Food Group Inc. and its Subsidiaries, or MTY Food Group Inc., or one of its subsidiaries. The consolidated financial statements contained in this interim report have not been reviewed by MTY’s external auditors. This MD&A was prepared as at July 1, 2011. Supplementary information about MTY, including its latest annual and quarterly reports, and press releases, is available on SEDAR’s website at www.sedar.com. Forward looking statements
This MD&A and, in particular, but without limitation, the sections of this MD&A entitled Outlook, Same Store Sales and Contingent Liabilities, contain forward-looking statements. These forward-looking statements include, but are not limited to, statements relating to certain aspects of the business outlook of the Company during the course of 2011. Forward-looking statements also include any other statements that do not refer to historical facts. A statement we make is forward-looking when it uses what we know and expect today to make a statement about the future. Forward-looking statements may include words such as aim, anticipate, assumption, believe, could, expect, goal, guidance, intend, may, objective, outlook, plan, project, seek, should, strategy, strive, target and will. All such forward-looking statements are made pursuant to the ‘safe harbour’ provisions of applicable Canadian securities laws.

Page 2
Unless otherwise indicated by us, forward-looking statements in this MD&A describe our expectations at July 1, 2011 and, accordingly, are subject to change after such date. Except as may be required by Canadian securities laws, we do not undertake any obligation to update or revise any forward-looking statements, whether as a result of new information, future events or otherwise. Forward-looking statements, by their very nature, are subject to inherent risks and uncertainties and are based on several assumptions which give rise to the possibility that actual results or events could differ materially from our expectations expressed in or implied by such forward-looking statements and that our business outlook, objectives, plans and strategic priorities may not be achieved. As a result, we cannot guarantee that any forward-looking statement will materialize and you are cautioned not to place undue reliance on these forward-looking statements. Forward-looking statements are provided in this MD&A for the purpose of giving information about management’s current strategic priorities, expectations and plans and allowing investors and others to get a better understanding of our business outlook and operating environment. Readers are cautioned, however, that such information may not be appropriate for other purposes. Forward-looking statements made in this MD&A are based on a number of assumptions that we believed were reasonable on July 1, 2011. Refer, in particular, to the section of this MD&A entitled Risks and Uncertainties for a description of certain key economic, market and operational assumptions we have used in making forward-looking statements contained in this MD&A. If our assumptions turn out to be inaccurate, our actual results could be materially different from what we expect. Unless otherwise indicated in this MD&A, the strategic priorities, business outlooks and assumptions described in the previous MD&A remain substantially unchanged. Important risk factors that could cause actual results or events to differ materially from those expressed in or implied by the above-mentioned forward-looking statements and other forward-looking statements included in this MD&A include, but are not limited to: the intensity of competitive activity, and the resulting impact on our ability to attract customers’ disposable income; our ability to secure advantageous locations and renew our existing leases at sustainable rates; the arrival of foreign concepts, our ability to attract new franchisees; changes in customer tastes, demographic trends and in the attractiveness of our concepts, traffic patterns, occupancy cost and occupancy level of malls and office towers; general economic and financial market conditions, the level of consumer confidence and spending, and the demand for, and prices of, our products; our ability to implement our strategies and plans in order to produce the expected benefits; events affecting the ability of third-party suppliers to provide to us essential products and services; labour availability and cost; stock market volatility; operational constraints the event of the occurrence of epidemics, pandemics and other health risks. These and other risk factors that could cause actual results or events to differ materially from our expectations expressed in or implied by our forward-looking statements are discussed in this MD&A.

Page 3
We caution readers that the risks described above are not the only ones that could impact us. Additional risks and uncertainties not currently known to us or that we currently deem to be immaterial may also have a material adverse effect on our business, financial condition or results of operations. Except as otherwise indicated by us, forward-looking statements do not reflect the potential impact of any non-recurring or other special items or of any dispositions, monetizations, mergers, acquisitions, other business combinations or other transactions that may be announced or that may occur after July 1, 2011. The financial impact of these transactions and non-recurring and other special items can be complex and depends on the facts particular to each of them. We therefore cannot describe the expected impact in a meaningful way or in the same way we present known risks affecting our business. Compliance with Generally Accepted Accounting Principles
Unless otherwise indicated, the financial information presented below, including tabular amounts, is expressed in Canadian dollars and prepared in accordance with Canadian generally accepted accounting principles (“GAAP”). MTY uses income before income taxes, interest on long-term debt, non-controlling interest and amortization (“EBITDA”) because this measure enables management to assess the Company’s operational performance. This measure is a widely accepted financial indicator but is not a measurement determined in accordance with GAAP and may not be comparable to the EBITDA presented by other companies. Highlights of significant events during the second quarter In April 2011, the Company announced it has reached a binding agreement to acquire Jugo Juice International Inc. The closing of the transaction is scheduled to take place in July 2011. In May 2011, MTY announced the cancellation of its agreement to acquire Groupe Sushi Taxi, which was previously announced in April 2011. During the second quarter of 2011, the Company has undertaken a restructuring of its Country Style team. MTY has reviewed opportunities to integrate some of its teams and brands together by centralizing some functions into shared services so that greater efficiency could be reached. As a result of this process, the Company incurred $396,579 in restructuring costs, which are mainly made of severance costs. This charge includes the costs related to the departure of Country Style’s president, whose duties will be absorbed by the existing team.

Page 4
Core business
MTY franchises and operates quick-service restaurants under the following banners: Tiki Ming, Sukiyaki, La Cremiere, Caferama, Au Vieux Duluth Express, Carrefour Oriental, Panini Pizza Pasta, Chick ‘N’ Chick, Franx Supreme, Croissant Plus, Villa Madina, Cultures, Thai Express, Mrs. Vanelli's, Kim Chi, “TCBY”, Yogen Früz, Sushi Shop, Koya Japan, Vie & Nam, Tandori, O’Burger, Tutti Frutti, Taco Time, Country Style, Bunsmaster and Valentine. As at May 31, 2011, MTY had 1736 locations in operation, of which 1707 were franchised and the remaining 29 locations were operated by MTY. MTY’s locations can be found in: i) food courts and shopping malls; ii) street front; and, iii) non-traditional format within petroleum retailers, convenience stores, cinemas, amusement parks and in other venues or retailers shared sites. The non-traditional locations are typically smaller in size, require a lower investment and generate lower revenues than the locations found in shopping malls, food courts or street front locations. The street front locations are mostly made up of the Country Style, La Cremiere, “TCBY”, Sushi Shop, Taco Time, Tutti Frutti and Valentine banners. La Cremiere and “TCBY” operate primarily from April to September and the others banners operate year round. MTY has developed several quick service restaurant concepts: Tiki Ming - Chinese cuisine, was its first banner, followed by Sukiyaki - A Japanese delight, Franx Supreme – hot dog/hamburger, Panini Pizza Pasta, Chick’n’Chick, Caferama, Carrefour Oriental, Villa Madina, Kim Chi, Vie & Nam, Tandori and O’Burger. Other banners added through acquisitions include: 18 locations from the Fontaine Sante/Veggirama chain in 1999, 74 locations from the La Cremiere ice cream chain in 2001, 20 locations from the Croissant Plus chain in 2002, 24 locations from the Cultures chain in 2003, 6 locations from the Thai Express chain in May 2004, 103 locations from the Mrs. Vanelli’s chain in June 2004, 91 locations of The Country’s Best Yogurt “TCBY” with the undertaking of the Canadian master franchise right in September 2005. On April 1, 2006, MTY acquired the exclusive master franchise rights to franchise Yogen FrüzTM throughout Canada with its network of 152 existing locations. On September 1, 2006, MTY acquired the Sushi Shop banner with its 42 franchise locations and 5 corporate owned locations and on October 19, 2006, the Company acquired the Koya Japan banner with its 24 franchise locations and one corporate owned location. On September 1, 2007 MTY purchased 15 existing Sushi Shop franchise locations from an investor group. On September 15, 2008, MTY acquired the Tutti Frutti banner with its 29 outlets. This banner caters to the breakfast and lunch crowd. On October 31, 2008, MTY acquired the Canadian franchising rights of Taco Time in Canada. As at the date of acquisition, there were 117 Taco Time restaurants operating in Western Canada. On May 1, 2009, the Company acquired the outstanding shares of Country Style Food Services Holdings Inc. with the 480 outlets operated by its subsidiaries. On September 16, 2010, the Company acquired the outstanding shares of Groupe Valentine inc. and of its network of 95 stores. MTY also has an exclusive area development agreement with Restaurant Au Vieux Duluth to develop and sub-franchise Au Vieux Duluth Express quick-service restaurants in the Provinces of Ontario and Quebec.

Page 5
Revenues from franchise locations are generated from royalty fees, franchise fees, sales of turn key projects, rent, sign rental and sales of other goods and services to franchisees. Revenues from corporate owned locations include sales generated from corporate owned locations. Operating expenses related to franchising include salaries, general and administrative costs associated with existing and new franchisees, expenses in the development of new markets, costs of setting up turn key projects, rent, supplies and equipment sold to franchisees. Corporate owned location expenses include the costs to operate corporate owned locations. MTY generates revenues from the food processing business discussed herein. The plant produces various products that range from ingredients and ready to eat food sold to restaurants or other food processing plants to microwavable meals sold in retail stores. The plant generates most of its revenues selling its products to distributors. The Company also generates revenues from its distribution center located on the south shore of Montreal. The distribution center mainly serves our Valentine and Franx franchises with a broad range of products required in the day-to-day operations of the restaurants. Description of recent acquisitions
On September 16, 2010, the Company completed the acquisition of all of the issued and outstanding shares of Groupe Valentine Inc., 9180-7420 Quebec Inc., as well as seven real estate properties owned by an affiliated corporation. At the date of the closing, there were 95 Valentine outlets, including 86 franchise outlets and 9 corporate-owned restaurants. On December 17, 2010, the Company acquired a 51% interest in a food processing plant. The total transaction value was estimated at approximately $3.5 million including land, building, equipment, inventories, existing workforce and certifications. The newly formed company contracted at $3.5 million bank loan to finance the acquisition. As part of the transaction, one of the shareholders in the newly formed company brought in existing activities from another operating plant, in exchange for mandatorily redeemable preferred shares. One third of the preferred shares will be redeemed annually, at a value contingent on the performance of the plant. The value of such shares was estimated at $300,000 at the inception of the shareholders’ agreement.

Page 6
Selected annual information Year ended
November 30,2008Year ended
November 30,2009 Year ended
November 30,2010
Total assets $60,087,474 $76,535,459 $96,554,108Total long-term liabilities* $2,217,748 $2,463,229 $3,544,590Revenue $34,239,041 $51,537,788 $66,886,441Income before income taxes and non-controlling interest $14,327,700
$17,927,708 $22,303,714
Net income and comprehensive income EPS basic EPS diluted
$9,911,506$0.52$0.52
$12,261,503
$0.64 $0.64
$15,446,794$0.81$0.81
Weighted daily average number of common shares Weighted average number of diluted common shares
19,120,567
19,120,567
19,120,567
19,120,567
19,120,567
19,120,567* Total long-term liabilities exclude non-controlling interest
Summary of quarterly financial information
Quarters ended
August 2009
November 2009
February 2010
May 2010
August2010
November 2010
February 2011
May2011
Revenue
$14,838,378
$15,487,424
$14,313,553
$17,287,393
$15,941,775
$19,343,720
$17,476,037
$18,355,608
Net income and comprehen-sive income Per share Per diluted share
$3,384,504
$0.18
$0.18
$3,775,712
$0.20
$0.20
$3,003,595
$0.16
$0.16
$3,809,139
$0.20
$0.20
$4,150,813
$0.22
$0.22
$4,483,247
$0.23
$0.23
$3,468,337
$0.18
$0.18
$3,554,583
$0.19
$0.19

Page 7
Results of operations for the second quarter ended May 31, 2011
Revenue During the first half of our 2011 fiscal year, the Company’s total revenue increased by 13% to reach $35.8 million. Revenues for the four segments of business are broken down as follows:
May 31, 2011 ($ million)
May 31, 2010 ($ million)
Variation
Franchise operation 25.7 27.5 -6% Corporate stores 4.9 4.1 19% Distribution 2.8 nil N/A Food processing Intercompany transactions
2.8 -0.4
nil nil
N/A N/A
Total operating revenues 35.8 31.6 13% As is shown in the table above, revenue from franchise locations regressed by 6%. Several factors contributed to the decline in revenues, as listed below:
$million
Revenues, first half of 2010 27.5 Increase attributable to Valentine 1.5 Increase in royalties* 0.6 Decrease in turn-key revenues* -2.6 Decrease in initial franchise fees* Decrease in sales of material to franchisees and rent revenues*
-0.5 -0.8
Other non-material variations* 0.0Revenues, first half of 2011 25.7 * excludes results of Valentine outlets
Turnkey revenues declined by half during the first six months of 2011, while initial franchise fees declined by approximately 30% for the same period. During the first half of 2011, the Company opened 58 new stores compared to 79 during the same period last year, hence generating lower initial franchise fees and turnkey revenues. The decrease in sales of material and rent revenues mostly comes from Country Style. Of the decline, $0.5 million was caused by a reduction in sales of materials to franchisees, which is in part due to a lower number of stores being renovated during in 2010 than in 2011. Another $0.2 million of the decline comes from rent revenues. Additional royalties generated by new stores opened during the last 12 months amounted to $0.6 million. The franchising operations of Valentine contributed a total of $1.5 million to franchising revenues for the first six months of 2011.
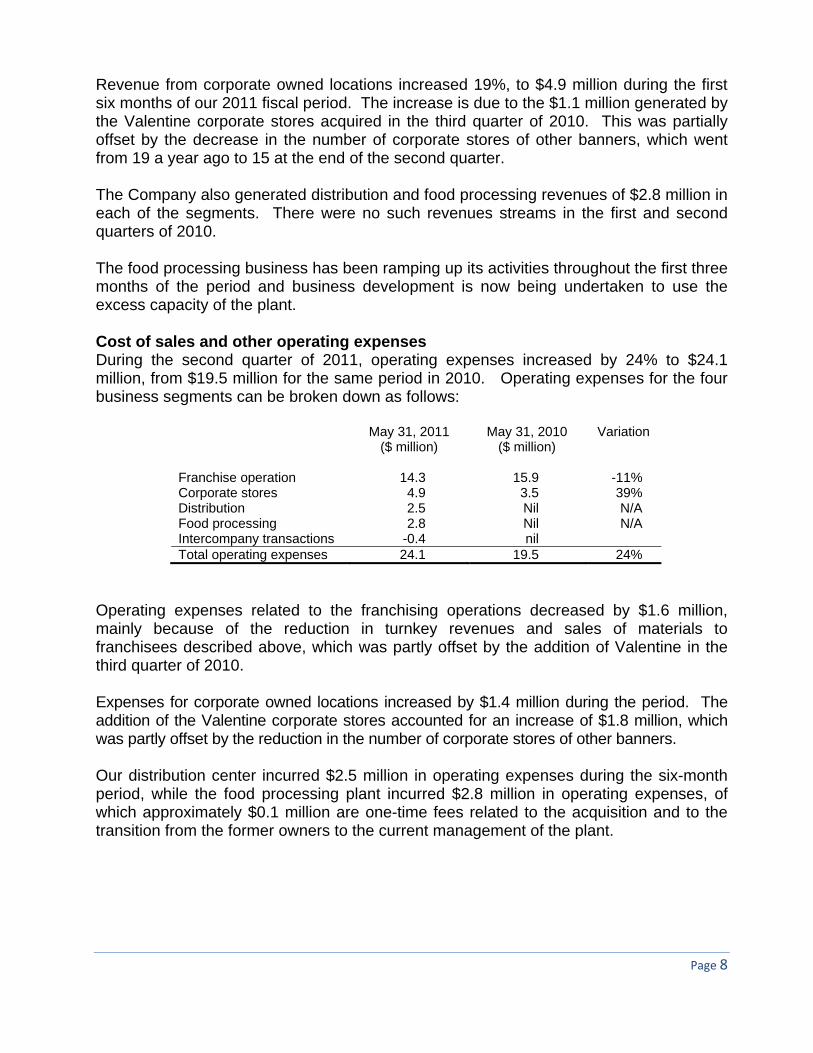
Page 8
Revenue from corporate owned locations increased 19%, to $4.9 million during the first six months of our 2011 fiscal period. The increase is due to the $1.1 million generated by the Valentine corporate stores acquired in the third quarter of 2010. This was partially offset by the decrease in the number of corporate stores of other banners, which went from 19 a year ago to 15 at the end of the second quarter. The Company also generated distribution and food processing revenues of $2.8 million in each of the segments. There were no such revenues streams in the first and second quarters of 2010. The food processing business has been ramping up its activities throughout the first three months of the period and business development is now being undertaken to use the excess capacity of the plant. Cost of sales and other operating expenses During the second quarter of 2011, operating expenses increased by 24% to $24.1 million, from $19.5 million for the same period in 2010. Operating expenses for the four business segments can be broken down as follows:
May 31, 2011 ($ million)
May 31, 2010 ($ million)
Variation
Franchise operation 14.3 15.9 -11% Corporate stores 4.9 3.5 39% Distribution 2.5 Nil N/A Food processing Intercompany transactions
2.8 -0.4
Nil nil
N/A
Total operating expenses 24.1 19.5 24% Operating expenses related to the franchising operations decreased by $1.6 million, mainly because of the reduction in turnkey revenues and sales of materials to franchisees described above, which was partly offset by the addition of Valentine in the third quarter of 2010. Expenses for corporate owned locations increased by $1.4 million during the period. The addition of the Valentine corporate stores accounted for an increase of $1.8 million, which was partly offset by the reduction in the number of corporate stores of other banners. Our distribution center incurred $2.5 million in operating expenses during the six-month period, while the food processing plant incurred $2.8 million in operating expenses, of which approximately $0.1 million are one-time fees related to the acquisition and to the transition from the former owners to the current management of the plant.

Page 9
Earnings before interest, taxes, depreciation and amortization (EBITDA)
Six months ended May 31, 2011
(In millions) Franchise Corporate Distribution Processing Consolidation Total Revenues (1) $26.56 $4.93 $2.77 $2.77 $-0.38 $36.65Expenses $14.67 $4.92 $2.48 $2.85 $-0.38 $24.54EBITDA $11.89 $0.00 $0.30 -$0.08 $0.00 $12.11EBITDAR $12.29 $0.00 $0.30 -$0.08 N/A $12.51EBITDAR as a % of Revenue (1)
46% 0% 11% -3% N/A 34%
Six months ended May 31, 2010
(In millions) Franchise Corporate Distribution Processing Consolidation Total Revenues (1) $27.33 $4.15 $nil $nil $nil $31.48Expenses $15.95 $3.54 $nil $nil $nil $19.49EBITDA/EBITDAR $11.38 $0.61 $nil $nil $nil $11.99EBITDAR as a % of Revenue (1)
42% 15% N/A N/A N/A 38%
EBITDA (income before income taxes, non-controlling interest and amortization) is not an earnings measure recognized by GAAP and therefore may not be comparable to similar measures presented by other companies. EBITDAR uses the same parameters as EBITDA but deducts restructuring charges from expenses. It is also not recognized by GAAP. (1)For purposes of the EBITDA analysis, interest income, gain/loss on disposal of assets and on foreign exchange have been included with Franchise revenue. See reconciliation to net income and comprehensive income on page 21. EBITDAR increased by 4%, from $12.0 million to $12.5 million for the six months ended May 31, 2011. During the period, the franchising operations generated $12.3 million in EBITDAR, an 8% increase over the results of the first half of 2010. Most of the increase is attributable to a gain on the sale of the assets of a subsidiary realized in the first quarter of 2011. EBITDAR as a percentage of revenue increased in part because of the gain described above and because of the lower deliveries of turnkeys and sales of materials to franchisees, which typically generate lower profit margins. EBITDA from corporate owned locations decreased from $0.6 million in the first half of 2010 to $0.0 million in 2011, mainly due to the recent acquisition of some relatively weaker stores while a highly profitable store has been disposed of at the end of the first quarter of 2011. For the same reason, EBITDA as a percentage of revenue from corporate owned locations decreased to 0% for the period, compared to 15% a year before. EBITDA from the Company’s distribution center was $0.3 million for the six-month period, which represents and EBITDA margin of 11%.

Page 10
The newly acquired food processing plant generated a negative EBITDA of $0.1 million. The loss is mainly attributable to one-time costs incurred to transition the business in the first quarter of 2011. Considerable efforts have been made in the second quarter and are still being made to generate higher sales and use the plant’s excess capacity. Net income For the six months ended May 31, 2011, MTY reported a net income of $7.0 million or $0.37 per share ($0.37 per diluted share) compared to a net income of $6.8 million or $0.36 per share ($0.36 per diluted share) for the same period last year, representing a net income increase of 3%. The increase in net income is mostly attributable to a reduction in the income tax burden on the income generated during 2011, as the generic growth in the business fundamentals has been offset by the reduction in the number of the new stores opened during the first half of 2011, the reduction in income from our corporate stores as well as from lagging performance by our Country Style operations. Amortization expense Because of the capital assets acquired with Valentine and the food processing plant, amortization of capital assets increased by $0.3 million during the first six months of 2011. Amortization of intangible assets was stable at $1.5 million for the period. Other income Interest income, which is generated from the Company’s investments in short-term notes and guaranteed investment certificates, increased by $0.1 million in the first half of 2011 compared to the same period a year earlier; the increase is attributable to the higher amount of excess cash invested. The gains on disposal of capital assets, which result from the sale of the assets of corporate stores, increased to $0.7 million in 2011 compared to a loss of $0.2 million during the first six months of 2010. This is mainly attributable to the sale of the assets of one of the Company’s subsidiaries in the first quarter of 2011, which resulted in a gain of $0.7 million. Income taxes The provision for income taxes as a percentage of income before taxes decreased by 5.2% in the first half of 2011 compared to the same period in 2010. Given the pre-tax income realized during the first six months of 2011, this represents a saving in income tax expense of $0.5 million. There were several factors driving this decrease, among which the most material were the decrease in the statutory tax rates, the advantageous tax treatment of capital gains and the shift in the proportion of income being taxed in provinces in which tax rates are lower.

Page 11
Results of operations for the second quarter ended May 31, 2011
Revenue During the three months ended May 31, 2011, the Company’s total revenue increased by 6%, to reach $18.4 million. Revenues for the four segments of business are broken down as follows:
May 31, 2011 ($ million)
May 31, 2010 ($ million)
Variation
Franchise operation 12.8 15.1 -15% Corporate stores 2.4 2.2 12% Distribution 1.6 nil N/A Food processing Intercompany transactions
1.7 -0.2
nil nil
N/A N/A
Total operating revenues 18.4 17.3 6% For the quarter, revenue from franchise locations decreased 15% compared to 2010, for factors described below:
$million
Revenues, second quarter of 2010 15.1 Increase attributable to Valentine 0.8 Increase in royalties* 0.3 Decrease in turn-key, rent and sales to franchisees* -3.0 Decrease in initial franchise fees* -0.3 Other non-material decreases* -0.1Revenues, second quarter of 2011 12.8 * excludes results of Valentine outlets
Of the $2.3 million decrease in revenues, $1.4 million is attributable to the decline experienced by our Country Style outlets, which experienced a decrease in all of its lines of revenues, including initial franchise fees, percentage rent, turnkeys, sales of material to franchisees, etc. The remainder of the variation is attributable to a decrease of 70% in revenues from turnkey during the second quarter of 2011. This decrease is explained by a lower proportion of new stores constructed by the Company as well as to the lower number of openings during the period, which went from 45 in the second quarter of 2010 to 30 in the second quarter of 2011. Revenue from Valentine’s franchise operations reached $0.8 million, while royalties generated by new stores opened during the last 12 months increased by $0.3 million, despite the decrease experience in Country Style. Revenue from corporate owned locations increased to 12% over last year, owing to the addition of the Valentine corporate stores in the fourth quarter of 2010.

Page 12
During the second quarter of 2011, the Company also generated distribution and food processing revenues of $1.6 million and $1.7 million respectively. There were no such revenues streams in the second quarter of 2010. The distribution center revenues are highly dependent on the performance of the Valentine and Franx restaurants, from which it derives 100% of its revenues. The second and third quarters are typically stronger for this type of restaurants, explaining the variance to the first quarter of 2011. As for the food processing plant, the second quarter revenues are 70% higher than they were during the first quarter of this year. Although revenues tend to be more volatile for this type of industry, the increase shows that the transition period is over and that the focus has shifted on business development. Cost of sales and other operating expenses During the second quarter of 2011, operating expenses increased by 13%. The increase is broken down as follows:
May 31, 2011 ($ million)
May 31, 2010 ($ million)
Variation
Franchise operation 6.8 9.0 -25% Corporate stores 2.4 1.7 43% Distribution 1.4 nil N/A Food processing Intercompany transactions
1.7 -0.2
nil nil
N/A N/A
Total operating expenses 12.1 10.7 13% Operating expenses related to the franchising operations decreased by $2.2 million despite the addition of Valentine. The main driver of the decrease is the reduction in the cost of delivering turnkeys, which decreased by $2.1 million during the three-month period as a result of lower sales. Expenses for corporate owned locations increased to $2.4 million in the second quarter of 2011 from $1.7 million during the second quarter of 2010, in large part due to the addition of the Valentine corporate stores. Our distribution center incurred $1.4 million in operating expenses during the quarter, while the food processing plant incurred $1.7 million, with no comparatives for the prior year.

Page 13
Earnings before interest, taxes, depreciation and amortization (EBITDA)
Three months ended May 31, 2011
(In millions) Franchise Corporate Distribution Processing Consolidation Total Revenues (1) $12.86 $2.43 $1.59 $1.74 $-0.22 $18.41Expenses $7.18 $2.44 $1.41 $1.68 $-0.22 $12.49EBITDA $5.68 -$0.01 $0.18 $0.06 $0.00 $5.91EBITDAR $6.08 -$0.01 $0.18 $0.06 N/A $6.31EBITDAR as a % of Revenue (1)
47% -1% 12% 3% N/A 34%
Three months ended May 31, 2010
(In millions) Franchise Corporate Distribution Processing Consolidation Total Revenues (1) $15.06 $2.16 $nil $nil $nil $17.22Expenses $8.99 $1.70 $nil $nil $nil $10.69EBITDA/EBITDAR $6.07 $0.46 $nil $nil $nil $6.53EBITDAR as a % of Revenue (1)
40% 21% N/A N/A N/A 38%
EBITDA (income before income taxes, non-controlling interest and amortization) is not an earnings measure recognized by GAAP and therefore may not be comparable to similar measures presented by other companies. EBITDAR uses the same parameters as EBITDA but deducts restructuring charges from expenses. It is also not recognized by GAAP. (1)For purposes of the EBITDA analysis, interest income and gain on disposal of capital assets and on foreign exchange have been included with Franchise revenue. See reconciliation to net income and comprehensive income on page 21. EBITDAR decreased by 3% during the quarter compared to the same period last year. The franchising operation’s EBITDAR remained relatively stable, with the decrease in revenues being offset by a reduction in the cost of sales. As a result of the reduction in sales of turnkeys, materials and rent, which typically generate low margins, EBITDAR as a percentage of revenues was at 47%, compared to 40% a year ago. During the quarter, the Company undertook a restructuring of its Country Style team in order to provide for opportunities to integrate its operations further. As part of the restructuring plan, $0.4 million were incurred in severance costs. EBITDA from corporate owned locations decreased from $0.5 million in 2010 to -$0.0 million in 2011, mainly due to some relatively weaker stores recently acquired and to the disposition of a highly profitable store at the end of the first quarter of 2011. EBITDA from the Company’s distribution center was $0.2 million for the three-month period, which represents and EBITDA margin of 12%. This performance is due to the strong sales during the second quarter for Valentine, which helped amortize fixed costs over a larger revenue base.

Page 14
The newly acquired food processing plant generated a $0.1 million EBITDA after suffering a loss in the first quarter. Net income For the quarter ended May 31, 2011, MTY reported a net income of $3.6 million or $0.19 per share ($0.19 per diluted share) compared to a net income of $3.8 million or $0.20 per share ($0.20 per diluted share) for the same period last year, representing a decrease in net income of 7%. Excluding the one-time restructuring charges incurred during the quarter, net income for the second quarter would be stable compared to the exceptional results of the second quarter of 2010. Amortization expense Amortization of capital assets increased by $0.2 million for during the quarter because of the additions of Valentine and of the food processing plant. Amortization of intangible assets was stable at $0.8 million for the period. Contractual obligations and long-term debt
The obligations pertaining to the long-term debt and the minimum rentals for the leases that are not subleased are as follows: For the period ending
Long term debt Net lease commitments
Total contractual obligations
12 months ending May 2012 $1,092,428 $1,607,284 $2,699,71212 months ending May 2013 $391,667 $1,520,666 $1,912,33312 months ending May 2014 $763,667 $1,331,885 $2,095,55212 months ending May 2015 $291,667 $1,117,365 $1,409,03212 months ending May 2016 $291,667 $935,668 $1,227,335
Balance of commitments $2,187,499 $2,891,144 $5,078,643 $5,018,595 $9,404,012 $14,422,607
Long-term debt includes non-interest bearing holdbacks on acquisitions, shareholder loans contracted by subsidiaries with the minority shareholders, a bank loan used to finance the acquisition of the food processing plant acquired in December 2010 as well as mandatorily redeemable preferred shares issued to a minority shareholder of a subsidiary. In addition to the above, the Company has entered into supplier agreements for purchases of coffee beans, wheat, sugar and shortening for delivery between July and September 2011. The total commitment amounts to $1.1 million.

Page 15
In relation to the items listed above, the Company has entered into a contract to minimize the impact of variations in foreign currencies. The total commitment on this contract amounts to approximately $0.5 million. Liquidity and capital resources
Cash and highly liquid temporary investments amounted to $32.1 million on May 31, 2011, an increase of $3.1 million compared to the $29.0 million balance at the end of the 2010 fiscal period. During the first half of 2011, cash flows generated by operating activities were $4.8 million, compared to $9.0 million during the same period last year. Excluding the variation in non-cash working capital items, our operations generated $10.4 million in cash flows, compared to $9.0 million in the first six months of 2010. The main driver of the $1.4 million increase in cash flows before non-cash working capital items is the utilization of the tax losses available to the Company following the amalgamation that took place on November 30, 2010. This was partially offset by the payment of an unusually large dividend to the non-controlling shareholders of a subsidiary following the disposition of its operating assets. The variation in working capital requirements is attributable to numerous factors, including the ramp up of the food processing plant acquired in December, tax instalments paid early during the period while tax losses are being used, and the timing of the collection and payment of the accounts receivable and payable of the Company. In the short-term, Management will continue to open new locations that will be funded by new franchisees. MTY will continue its efforts to sell some of its existing corporate owned locations and will seek new opportunities to acquire other food service operations. MTY has an available line of credit of $5.0 million that remained unused at May 31, 2011. The facility, when used, bears interest at the bank’s annual prime rate plus 1.00%. Balance sheet
Temporary investments increased to reach $29.5 million at the end of the second quarter, up from $23.4 million as at November 30, 2010. Cash flows generated by our operations are typically invested until they are needed to fund acquisitions. These temporary investments are comprised of highly liquid, short-term notes valued at fair value. They have maturity dates between June 2011 and April 2012 and have rates of return between 1.02% and 1.62% (0.82% to 1.45% in November 2010). Accounts receivable at the end of our second quarter of 2011 were at $8.9 million, an increase of $1.3 million compared to the balance at the end of our 2010 fiscal period.

Page 16
The increase is due to the ramp up in the business of the food processing plant ($0.7 million) as well as to the timing of the collection of some receivables in MTY. Loans receivable were stable at $1.2 million at the end of the quarter. During the period, one new loan was granted in relation to a newly franchised restaurant while one was extinguished. Capital assets increased to $9.8 million at the end of the quarter, an increase of $2.7 million compared to the balance at November 30, 2010. The acquisition of the food processing plant contributed $3.3 million to our capital assets, an addition that was partially offset by the disposal of some assets and the amortization recorded for the period. Goodwill increased by $1.8 million as a result of the adjustment in the purchase price of Country Style Food Services Holdings Inc. following the settlement of the litigation with the vendors and of the contribution of some existing business by one of the minority shareholders to the food processing plant, of which the value is recorded as goodwill. The valuation of this contribution has not yet been finalized. Accounts payable decreased from $12.5 million to $11.4 million between November 30, 2010 and May 31, 2011. The stage of completion and related payables of franchise locations under construction contributed the biggest share of this decrease. Deferred revenues consist of distribution rights which are earned on a consumption basis and include initial franchise fees to be earned once substantially all of the initial services have been performed. The balance at the end of the second quarter was $1.2 million, a decrease of $0.3 million compared to the balance six months earlier. The variation is due to decreases in both unearned distribution rights and franchise fee deposits. The long-term debt is composed of non-interest bearing holdbacks on acquisitions, of a bank loans contracted by a subsidiary to finance an acquisition, of loans payable by subsidiaries to their minority shareholders and of mandatorily redeemable preferred shares. Long-term debt increased by $2.2 million during the first two quarters. The acquisition of the food processing plant contributed $3.8 million to this variance, in the form of a bank loan of $3.5 million and of $0.3 million in mandatorily redeemable preferred shares. The settlement of the litigation with the vendors of Country Style Food Services Holdings Inc. included a settlement of the holdbacks, which reduced the long-term debt by $1.3 million. In addition, the bank loans contracted by two of Valentine’s subsidiaries were completely repaid during the year, and a portion of the holdbacks resulting from the Valentine acquisition was repaid. With the exception of those created in the Valentine transaction, the remaining holdbacks are expected to be repaid over the next year. The loans payable by a subsidiary to non-

Page 17
controlling shareholders carry no terms of repayment and will be repaid when this subsidiary generates sufficient cash flow to repay its debt without impairing its operations. One third of the preferred shares will be redeemed annually at a value that is contingent on the performance of a subsidiary. Further details on the above balance sheet items can be found in the notes to the May 31, 2011 consolidated financial statements. Capital stock
No shares were issues during the second quarter of the Company’s 2011 fiscal period. As at July 1, 2011 there were 19,120,567 common shares of MTY outstanding. Location information
Number of Number of locations locations six months six months May 2011 May 2010
Franchises, beginning of year 1,701 1,550 Corporate owned, beginning of year 26 20 Opened during the year 58 79 Closed during the year (49) (44) Total end of year 1,736 1,605 Franchises, end of year 1,707 1,586 Corporate owned, end of year 29 19 Total end of year 1,736 1,605 During the second quarter, Country Style lost 25 non-traditional locations as a result of the early termination of a contract. Although they represent a large number of locations, the impact of this loss on the Company’s revenues is expected to be insignificant given the average sales volume of the closed outlets. As a result, the Company realized a net loss of 4 stores during the second quarter of 2011, and a net addition of 9 locations for the first six months of 2011, compared to a net addition of 35 locations for the same period a year earlier. Other than the loss described above, the lower net addition for 2011 is mainly attributable to the exceptional performance realized in 2010. Of the 58 stores opened in 2011, 18 were in shopping malls and food courts (36 in 2010), 23 were street front (18 in 2010) and 17 were non-traditional (25 in 2010). During the same period, there were 34 non-traditional (27 in 2010), 10 street front (7 in 2010) and 5 shopping mall and food court locations (10 in 2010) closed.

Page 18
During the first six months of 2011, two corporate-owned locations were sold, six were added and one was closed. As at May 31, 2011, there were three test locations in operation, all of which were excluded from the numbers presented above. This is an increase of one since the end of our 2010 fiscal year, as the Company is testing some cross-banner concepts. MTY’s locations can be found in: i) food courts and shopping malls; ii) street front; and iii) non-traditional format within petroleum retailers, convenience stores, cinemas, amusement parks and in other venues or retailers shared sites. The non-traditional locations are typically smaller in size, require lower investment and generate lower revenue than the shopping malls, food courts and street front locations. The chart below provides the breakdown of MTY’s locations by type as at May 31, 2011:
Location type % of location count
May 31
% of system sales six months ended
May 31 2011 2010 2011 2010 Shopping mall & food court 39% 39% 52% 54% Street front 28% 24% 39% 37% Non-traditional format 33% 37% 9% 9%
The geographical breakdown of MTY’s locations at May, 2011 consists of:
Geographical location % of location count
May 31
% of system sales six months ended May
31, 2011 2011 2010 2011 2010 Ontario 44% 49% 32% 36% Quebec 34% 29% 40% 35% Western Canada 16% 17% 21% 22% Maritimes 2% 2% 1% 1% International 4% 3% 5% 6%
System wide sales
System wide sales grew 11%, reaching $242.6 million during the first six months of 2011, compared to $218.3 million for the same period last year. For the second quarter, system wide sales were $124.9 million, up 10% over the second quarter of 2010.

Page 19
System wide sales include sales for corporate and franchise locations, which are for the vast majority of them as reported by franchisees, but exclude sales realized by the distribution center or by the food processing plant. In both the three and six-month periods, approximately half of the increase in system wide sales is attributable to the acquisition of Valentine. The remainder is generated by new locations opened in the last twelve months. Same store sales
For the first semester of our 2011 fiscal period, same store sales decreased 0.27%. For the second quarter alone, same store sales decreased by 0.05%. The decrease is mainly attributable to the lagging performance of Country Style outlets during the first six months of the year. The colder than usual weather early this year combined with aggressive promotions launched by some players in the quick service industry have had an adverse impact on the sales of our coffee shops. Most other concepts fared better, with an overall positive same store sales growth both for the three and six-month periods ended May 31, 2011. There were no material variations between the various types of locations. Same store sales in international locations were down during the first six months of this year compared to stores opened during the same period last year, most likely because of the turmoil in the Middle East and Northern Africa that affected some of our locations. The following table shows quarterly information on same stores sales growth for fiscal periods 2007 to the second quarter of 2011:
4.5%3.9%
3.3%2.7%
1.5% 1.3%
2.4%
0.2%‐0.2%
‐3.6%‐3.0%
‐1.2% ‐1.1%
‐0.2%
2.0%
‐0.4%
‐0.1%
‐5.0%
‐4.0%
‐3.0%
‐2.0%
‐1.0%
0.0%
1.0%
2.0%
3.0%
4.0%
5.0%Q2'07
Q3'07
Q4'07
Q1'08
Q2'08
Q3'08
Q4'08
Q1'09
Q2'09
Q3'09
Q4'09
Q1'10
Q2'10
Q3'10
Q4'10
Q1'11
Q2'11
Quarterly Same Store Sales Growth

Page 20
Investors relations
On January 19, 2004, MTY appointed, for a 12 month-term, Mr. Jean-Francois Dube of Boxe Comm, as its investor relation's specialist. Mr. Dube is responsible for communicating to existing shareholders, potential investors and members of the brokerage community, for and on behalf of MTY. The Company further extends the contract with Boxe Comm on a monthly basis since May 2011, subject to terms and conditions contained in the Agreement. For the six-month period ended May 31, 2011, MTY has paid an amount of $24,000 to Boxe Comm. Stock options
During the year, no options were granted or exercised. As at May 31, 2011 there were no options outstanding. Seasonality
Results of operations for the interim period are not necessarily indicative of the results of operations for the full year. The Company expects that seasonality will not to be a material factor in the quarterly variation of its results. System sales fluctuate seasonally, during January and February sales are historically lower than average due to weather conditions. Sales are historically above average during May to August. This is generally as a result of higher traffic in the street front locations, higher sales from seasonal locations only operating during the summer months and higher sales from shopping centre locations. Sale for shopping malls locations are also higher than average in December during the Christmas shopping period. Use of estimates
The preparation of financial statements in conformity with Canadian generally accepted accounting principles (GAAP) requires management to make estimates and assumptions that affect the reported amounts of assets and liabilities and disclosure of contingent assets and liabilities at the date of the financial statements and revenue and expenses during the period reported. Significant areas requiring the use of management estimates relate to the carrying value of long lived assets, valuation of allowances for accounts receivable and inventories, liabilities for potential claims and settlements, income taxes, the useful life of assets used when calculating amortization, the determination of fair value of assets and liabilities in business acquisitions and impairment testing on goodwill and trademarks. Estimates and assumptions are reviewed periodically and the effects of revisions are reflected in the consolidated financial statements in the period they are determined to be necessary. Actual results could differ from those estimates.

Page 21
Contingent liabilities
The Company is involved in legal claims associated with its current business activities, the outcome of which is not determinable. Management believes that these legal claims will have no significant impact on the financial statements of the Company. Guarantee
The Company has provided a guarantee in the form of a letter of credit for an amount of $45,000. EBITDA reconciliation to net income and comprehensive income
The following table provides reconciliation of EBITDA to net income and comprehensive income disclosed in this MD&A. (In millions) 3 months
ended May 31, 2011
6 months ended
May 31, 2011
3 months ended
May 31, 2011
6 months ended
May 31, 2010 EBITDA
$
5.91
$
12.11
$
6.53
$ 11.99
Less: Amortization – capital assets 0.38 0.73 0.16 0.45 Amortization – intangible assets 0.76 1.52 0.74 1.53 Interest on long-term debt 0.04 0.06 - - Total income taxes 1.23 2.58 1.79 3.16 Non-controlling interest -0.04 0.19 0.03 0.04 Net income and comprehensive income
3.55
7.02 3.81 6.81
Risks and uncertainties
Despite the fact that the Company has a various number of concepts, diversified in type of locations and geographically across Canada, the performance of the Company is also influenced by changes in demographic trends, traffic patterns, occupancy level of malls and office towers and the type, number, and location of competing restaurants. In addition, factors such as innovation, increased food, labour and benefits costs, occupancy costs and the availability of experienced management and hourly employees may adversely affect the Company. Changing consumer preferences and discretionary spending patterns could oblige the Company to modify or discontinue concepts and/or menus and could result in a reduction of revenue and operating income. Even if the Company was able to compete successfully with other restaurant companies with similar concepts, it may be forced to make changes in one or more of its concepts in order to respond to changes in consumer tastes or dining patterns. If the Company changes a concept, it may lose additional customers who do not prefer the new concept and menu, and it may not be able to attract a sufficient new customer base to produce the revenue

Page 22
needed to make the concept profitable. Similarly, the Company may have different or additional competitors for its intended customers as a result of such a concept change and may not be able to successfully compete against such competitors. The Company's success also depends on numerous factors affecting discretionary consumer spending, including economic conditions, disposable consumer income and consumer confidence. Adverse changes in these factors could reduce customer traffic or impose practical limits on pricing, either of which could reduce revenue and operating income. The growth of MTY is dependant on maintaining the current franchise system which is subject to the renewal of existing leases at sustainable rates, MTY’s ability to continue to expand by obtaining acceptable store sites and lease terms, obtaining qualified franchisees, increasing comparable store sales and completing acquisitions. The time, energy and resources involved in the integration of the acquired businesses into the MTY system and culture could also have an impact on MTY’s results. Off-balance sheet arrangement MTY has no off-balance sheet arrangements Future accounting policies International Financial Reporting Standards In February 2008, Canada’s Accounting Standards Board (“AcSB”) confirmed that Canadian GAAP, as used by publicly accountable enterprises, will be superseded by International Financial Reporting Standards (“IFRS”) for fiscal years beginning on or after January 1, 2011. IFRS uses a conceptual framework similar to Canadian GAAP, but there are significant differences on recognition, measurement and disclosures. For the Company, the conversion to IFRS will be required for interim and annual financial statements for the year ending November 30, 2012. The following information is presented pursuant to the October 2008 recommendations of the Canadian Performance Reporting Board relating to pre-2011 communications about IFRS conversion and to comply with the guidance provided in Canadian Securities Administration Staff notice 52-320, Disclosure of Expected Changes in Accounting Policies Relating to Changeover to International Financial Reporting Standards. This information is provided to enable investors and others to gain a better understanding of the Company’s transition plan and the resulting impacts on financial statements and financial reporting. This information reflects the Company’s most recent assumptions and expectations; circumstances may arise which would change these assumptions and expectations. The change to IFRS will require restatements of the 2011 numbers used for comparative purposes so they are in accordance with IFRS for comparative purposes. In order to achieve a successful transition, the Company will be using two parallel sets of accounting records during its 2011 fiscal period.

Page 23
The Company’s transition plan is composed of the following phases: 1. Diagnostics and Scoping 2. Analysis and Evaluation 3. Design 4. Implementation and review
1- Diagnostics and Scoping Phase A preliminary overview of the major differences between GAAP and IFRS in the context of MTY was completed during the third quarter of our 2010 fiscal period and updated following the acquisition of Groupe Valentine Inc. The objective of this phase was to determine, at a high level, the financial reporting differences under IFRS and the key areas that will be impacted. This identification will in turn largely influence the efforts deployed during the next phases of the project. The areas which have been identified to have a potential impact are as follows:
• Presentation of Financial Statements (IAS 1), • Business Combinations (IFRS 3), • Property, Plant and Equipment (IAS 16), • Investment Property (IAS 40), • Impairment of assets (IAS 36), • Income Taxes (IAS 12), • Leases (IAS 17), • Revenues (IAS 18), • Provisions and Contingent Liabilities (IAS 37), • Customer Loyalty Programmes (IFRIC 13), • Investment in associates (IAS 28), • Consolidated and separate financial statements (IAS 27 & SIC 12).
This list is not all-inclusive and remains subject to change as the Company’s operations and accounting standards evolve. Furthermore, IFRS 1, First-Time Adoption of International Financial Reporting Standards, provides entities adopting IFRS for the first time with a number of optional exemptions and mandatory exceptions to the general requirement of full retrospective application of IFRS which may differ from the requirements of the sections listed above. The Company will be analyzing the various accounting policy choices available and will implement those determined to be most appropriate in the Company’s circumstances. The Company has not yet determined the aggregate financial impact of adopting IFRS 1 on its consolidated financial statements. As part of this phase, the Company also assessed the impact of the transition on its Internal Controls over Financial Reporting (ICFR); at the moment, given the Company’s structure, the organization of the work and the flow of the information, the Company’s ICFR are expected to be materially impacted during transition from Canadian GAAP to IFRS.

Page 24
2- Analysis and Evaluation Phase A more detailed evaluation is currently underway to assess the impact of the above mentioned sections on our financial reporting. Deliverables will include documentation of the rationale supporting accounting policy choices and where possible quantification of the impacts of the changeover. In cases in which quantification is not possible, an action plan will be established to ensure a timely resolution of any outstanding issues. As part of this phase, employees involved in accounting and financial reporting functions have been offered education and training to ensure that IFRS and the specific choices made by the Company are applied consistently and accurately. Furthermore, seminars will be offered throughout the transition period to members of the Audit Committee, management and finance and accounting staff. Given the recent changes in the composition of the Audit Committee, completion of this phase was deferred and is expected to be completed by the end of the third quarter of our 2011 fiscal period. Initial adoption of IFRS requires the application of IFRS 1, “First Time Adoption of IFRS”. This standard requires retrospective application of all IFRS effective at the reporting date. An important part of this phase involves producing a detailed evaluation of the choices that are available to the Company as part of IFRS 1. The Company has completed its analysis of the choices available under IFRS 1. This assessment was based on existing standards and economic context in place today and could change before the changeover date. Below are a discussion and a preliminary guidance regarding the relevant optional exemptions provided by IFRS 1: Relevant optional exemptions
Preliminary findings
Business combinations The Company may elect not to apply IFRS 3
retrospectively to all of the acquisitions that occurred prior to transition date or to choose a date after which to apply the standard. Other than the impact of the changeover on deferred income taxes, the Company’s past practices have been generally similar to the ones dictated by IFRS 3. The company will elect to apply IFRS 3 prospectively only, and as a result will not restate the acquisitions that have occurred prior to IFRS transition date.
Deemed cost On transition, the Company may elect to use fair value as
the deemed cost of its Property, Plant and Equipment, Investment Properties and Intangible Assets for which an active market exists.
Page 25
The Company does not intend to revalue its PP&E, Investment Properties or Intangible Assets at transition. Preliminary assessments suggest that the IRFS cost of the assets described above will be similar to the carrying amounts under Canadian GAAP at the date of transition.
Compound financial instruments
Some instruments contain both an equity and a liability component; under IAS 32, an entity is required to separate the two components. In cases in which the liability component is no longer outstanding, this exemption provides relief in that IAS 32 can be applied prospectively from the IFRS transition date and no retroactive restatement is required. The company intends to use this exemption and apply IAS 32 prospectively from the IFRS transition date.
Designation of previously recognized financial instruments
This exemption provides the opportunity to designate financial assets as either Available for Sale (AFS) or Fair Value through Profit or Loss (FVTPL). Gains or losses in fair value of financial assets designated as AFS flow through Other Comprehensive Income, whereas they would flow into the P&L under the FVTPL. The Company’s temporary investments do not meet the criteria to be classified as FVTPL. As a result, the exemption does not apply to MTY and temporary investments will be classified as AFS.
Share-based payments For equity-settled awards with non-employees, IFRS 2
requires that the transaction be measured at the fair value of the goods or services received rather than at the fair value of the equity instrument provided. As a result, some old share-based payments would have to be revisited. At year-end, no instruments issued as compensation to acquire assets were unvested. The company will elect to use this exemption and apply IFRS 2 prospectively after the IFRS transition date.

Page 26
In addition to its assessment of IFRS 1, the Company has undertaken a thorough review of the potential changes to accounting policies arising from the changeover. Information regarding the relevant sections and of the status of the process is presented below: Business combinations As mentioned previously, the Company’s past practices are generally similar to the requirements of IFRS 3; one area of difference is the measurement period which, under IFRS 3, is limited to twelve months following the business combination transaction, even in cases in which there remains unknown items. IFRS 3 also states that negative goodwill should be recorded into income rather than distributed to a certain set of assets. This could potentially have an impact on the purchase price allocation of certain recent acquisitions and will have an impact on any future acquisition for which the fair value of the assets exceeds the purchase price. The Company is still reviewing other potential impacts of the changeover. Consolidations (including IAS 27 and IAS 28) Under Canadian GAAP, Variable Interest Entitites (“VIEs”) are consolidated if the reporting entity is the primary beneficiary of the VIE’s earnings. There is no such concept under IFRS. Rather, entities are to be consolidated if the Company has control over the subject entity. Factors that need to be considered included:
• A majority share ownership; • Ability to control the board of directors; • Power to govern financial and operating policies; • Contracted arrangements conferring effective control.
The relationship with certain specific franchisees will be assessed individually to test whether or not it meets the control criteria listed above. The potential impact of this assessment is still under evaluation. Property, Plant and Equipment We have assessed IFRS against our current accounting policies and at this time we do not foresee a major impact to our financial statements outside of additional disclosure. The Company intends to use IFRS historical costs as its measurement basis. Certain of our fixed assets will have to be re-componentized as of the transition date, resulting in variations in net book value of fixed assets.

Page 27
Impairment will continue to be assessed annually if there is an indicator of impairment. Some assets currently categorized as Capital Assets on the Company’s balance sheet could be reclassified as Investment Property. Investment Property As part of the acquisition of Groupe Valentine Inc., the Company has acquired assets that generate rental income from third parties. The Company is evaluating whether some of these properties will qualify as investment properties. The Company will apply the cost model to account for Investment Properties, if any. In the event that some of the properties are classified as investment properties, additional disclosure will be required, including the fair value of the properties. Impairment of assets Under IAS 36, impairment tests are conducted using a one-step approach, in which the assets’ or cash generating units’ (“CGU”) carrying value is compared to the assets’ or CGU’s discounted cash flows. This method is different from Canadian GAAP, which includes as a first step an undiscounted cash flow screen. This increases the likelihood that an impairment would have to be recognized under IFRS. The Company is still in the process of identifying its cash generating units for impairment testing purposes. Once that is established, specific tests will be conducted to evaluate whether some assets are impaired or not. Income Taxes The conceptual approach under IFRS and Canadian GAAP with respect to accounting for deferred income taxes (referred to as future income taxes under Canadian GAAP) are consistent; both use the liability method in assessing the impact of temporary differences between the tax bases and carrying values for financial reporting purposes. The Company is currently assessing the impact of IAS 12 specifically on deferred income taxes arising from indefinite life intangible assets such as Goodwill and Trademarks. Leases Under IFRS, more judgment is required when classifying leases due to the lack of quantitative guidance; each asset must be assessed qualitatively to make the determination as to whether it is an operating or finance lease. The Company is currently assessing the impact of the transition on the existing leases.

Page 28
Revenues IAS 11 states that percentage of completion is required for construction contracts. The Company currently uses the completed contract method for revenues related to the delivery of turnkey restaurants. Early guidance obtained on the matter suggests that an accounting policy change with retroactive application and restatement of retained earnings will be required; more specifically, cost incurred on construction contracts will be recognized in the period in which they are incurred. Percentage of completion revenues will be recognized up to a maximum of the expensed costs and the profit will be recognized when the project is delivered. Provisions and contingent liabilities Provisions need to be recognized in the financial statements when there is a present obligation arising from a past event that is probable to require a cash outflow. Canadian GAAP requires recognition when the outflow was likely, whereas IFRS requires recognition when it is probable (defined as more likely than not); as a result, more provisions could be required under IFRS than under Canadian GAAP. Additionally, disclosure will be more detailed and provisions will need to be presented specifically on the face of the balance sheet rather than being aggregated with other trade payables. An analysis is currently being undertaken to quantify the impact of this requirement. Customer loyalty programmes IFRIC 13 is expected to have no significant impact on the Company’s financials. The MTY Rewards program is in effect owned by the Company’s clients; MTY collects the amounts that make up the amount payable for redemptions and recognizes a corresponding liability on its books. 3- Design Phase The objective of this phase of the transition project is to ensure that our accounting records reflect the choices made by the company and that the potential impacts on disclosure, financial reporting, information technology, internal controls over financial reporting and disclosure controls are assessed and addressed. The objective is to have this phase completed before the end of the third quarter of our 2011 fiscal period, with a final confirmation of the elections by the changeover date, December 1, 2011. As part of this phase, an external consultant was hired to provide direction and guidance on the construction of the 2012 financial statements of the Company.

Page 29
4- Implementation and Review Phase This phase will involve the implementation of the changes to accounting policies and financial reporting and the compilation of the comparative financial data. The culmination of the process is expected to be the board approval of the 2011 financial statements presented under IFRS as comparative figures for our 2012 fiscal period. The changes in accounting policies may impact the financial statements of the Company materially. The full impact of the change is not reasonably determinable at this time. Critical accounting policies
MTY’s significant accounting policies have not changed since the last annual report for the year ended November 30, 2010. Credit risk The Company’s credit risk is primarily attributable to its trade receivables. The amounts disclosed in the balance sheet are net of allowances for bad debts, estimated by the Company’s management based on prior experience and their assessment of the current economic environment. The Company believes that the credit risk of accounts receivable is limited for the following reasons:
‐ The Company’s broad client base is spread mostly across Canada. ‐ The Company accounts for a specific bad debt provision when management
considers that the expected recovery is less than the actual account receivable. The following table sets forth details of the age receivables that are not overdue as well as an analysis of overdue amounts and the related allowance for doubtful accounts:
May 31, 2011 November 30, 2010
$ $ Total accounts receivable 9,650,827 8,360,696 Less: Allowance for doubtful accounts 740,794 783,261 Total accounts receivable, net 8,910,033 7,577,435 Of which: Not past due 6,238,861 5,665,888 Past due for more than one day but for no more than 30 days 721,520 255,948 Past due for more than 31 days but for no more than 60 days 466,067 217,314 Past due for more than 61 days 1,483,585 1,438,285 Total accounts receivable, net 8,910,033 7,577,435 Allowance for doubtful accounts beginning of year 783,261 754,110 Additions 182,132 384,531 Write-off (224,599) (355,380) Allowance for doubtful accounts end of period 740,794 783,261

Page 30
The credit risk on cash and temporary investments is limited because the Company invests its excess liquidity in high quality financial instruments. The credit risk on the loans receivable is similar to that of accounts receivable. There is currently no allowance for doubtful accounts applicable to the loans receivable. Economic environment risk
The business of the Company is dependent upon numerous aspects of a healthy general economic environment, from strong consumer spending to provide sales revenue, to available credit to finance the franchisees and the Company. In light of recent upheaval in economic, credit and capital markets, the Company’s performance and market price may be adversely affected. The Company’s current planning assumptions forecast that the quick service restaurant industry will be impacted by the current economic recession in the provinces in which it operates. However, management is of the opinion that the current economic situation will not have a major impact on the Company due to the following reasons: 1) the Company has strong cash flows; 2) quick service restaurants represent an affordable dining out option for consumers in an economic slowdown. Outlook
It is Management’s opinion that the trend in the quick service restaurants industry will continue to grow in response to the demand from busy and on-the-go customers. Management will maintain its focus on producing innovative menus and revamping the store designs of its banners which should result in positive same store sales growth when renovations are completed. For 2011, management plans on of opening 85 new locations and remains committed in seeking potential acquisitions to further strengthen its market position. Controls and Procedures Disclosure controls and procedures Disclosure controls and procedures are designed to provide reasonable assurance that information required to be disclosed in reports filed with the securities regulatory authorities are recorded, processed, summarized and reported in a timely fashion. The disclosure controls and procedures are designed to ensure that information required to be disclosed by the Company in such reports is then accumulated and communicated to the Company’s management to ensure timely decisions regarding required disclosure. The Company's management, including the CEO and the CFO, does not expect that the Company's disclosure controls and procedures will prevent or detect all errors and all fraud. Because of the inherent limitations in all control systems, an evaluation of controls can provide only reasonable, not absolute, assurance that all control issues and instances of fraud or error, if any, within the Company have been detected.
Page 31
Based upon the evaluation of the disclosure controls and procedures, subject to the inherent limitations noted above, the Chief Executive Officer and Chief Financial Officer have concluded that the Company’s disclosure controls and procedures were effective as at May 31, 2011, in providing reasonable assurance that the material information relating to the Company is made known to the Company's management. Internal controls over financial reporting The Chief Executive Officer and the Chief Financial Officer are responsible for establishing and maintaining internal control over financial reporting. The Company’s internal control over financial reporting is designed to provide reasonable assurance regarding the reliability of financial reporting and the preparation of financial statements for external purposes in accordance with Canadian GAAP. The Chief Executive Officer and the Chief Financial Officer, together with Management, after evaluating the effectiveness of the Company’s internal control over financial reporting as at May 31, 2011, have concluded that the Company’s internal control over financial reporting was effective. The Chief Executive Officer and the Chief Financial Officer, together with Management, have concluded after having conducted an evaluation and to the best of their knowledge that, as at May 31, 2011, no change in the Company’s internal control over financial reporting occurred that could have materially affected or is reasonably likely to materially affect the Company’s internal control over financial reporting. “Stanley Ma” “Claude St-Pierre” __________________________ _________________________ Stanley Ma, Chief Executive Officer Claude St-Pierre, Chief Financial Officer “Eric Lefebvre” __________________________ Eric Lefebvre, CA, Vice President Finance