ENBRIDGE INCOME FUND MANAGEMENT’S DISCUSSION AND ANALYSIS June 30, 2011 · 2011-08-03 · This...
22
ENBRIDGE INCOME FUND MANAGEMENT’S DISCUSSION AND ANALYSIS June 30, 2011
Transcript of ENBRIDGE INCOME FUND MANAGEMENT’S DISCUSSION AND ANALYSIS June 30, 2011 · 2011-08-03 · This...

ENBRIDGE INCOME FUND
MANAGEMENT’S DISCUSSION AND ANALYSIS
June 30, 2011

2
MANAGEMENT’S DISCUSSION & ANALYSIS FOR THE THREE AND SIX MONTHS ENDED JUNE 30, 2011 This management’s discussion and analysis (MD&A) dated August 2, 2011 should be read in conjunction with the unaudited interim consolidated financial statements of Enbridge Income Fund (the Fund) as at and for the three and six months ended June 30, 2011, which are prepared in accordance with Part V – Pre-changeover Accounting Standards of the Canadian Institute of Chartered Accountants (CICA) Handbook (Canadian GAAP or Part V). It should be read in conjunction with the audited financial statements and MD&A contained in the Fund’s Annual Report for the year ended December 31, 2010. Unless otherwise noted, all financial information is presented in Canadian dollars and financial information pertaining to Alliance Canada and Green Power reflects the Fund’s proportionate share of the entities within these segments. Additional information related to the Fund, including the Fund’s Annual Information Form, is filed on SEDAR at www.sedar.com. FUND DESCRIPTION AND OBJECTIVE The Fund is an unincorporated open-ended trust established by a trust indenture under the laws of the Province of Alberta. Enbridge Management Services Inc. (EMSI or the Manager), a wholly owned subsidiary of Enbridge Inc. (Enbridge), administers the Fund. EMSI also serves as the manager of Enbridge Commercial Trust (ECT), a subsidiary of the Fund, and Enbridge Income Fund Holdings Inc. (ENF), a unit holder of the Fund. The Fund has investments in businesses that own and operate crude oil and natural gas pipelines as well as waste heat recovery and wind power facilities. The Fund owns the Saskatchewan System, a 50% interest in Alliance Pipeline Limited Partnership (Alliance Canada), 50% interest in NRGreen Power Limited Partnership (NRGreen) and interests in three wind power projects in Western Canada (collectively referred to as “Green Power”). The Fund’s objectives are to provide a predictable flow of distributable cash and to increase, where prudent, cash distributions per trust unit. During 2010, the Fund completed a restructuring whereby all of the publicly held trust units of the Fund, as well as 5,000,000 trust units then held by Enbridge, were exchanged on a one-for-one basis for shares of ENF. The restructuring has not altered the Fund’s objective to distribute a high proportion of available cash flow to its unit holders. FINANCIAL OVERVIEW Three months ended
June 30, Six months ended
June 30, 2011 2010 2011 2010 (millions of Canadian dollars) Earnings Alliance Canada 13.4 14.3 26.7 28.8 Saskatchewan System 10.4 5.1 20.3 10.0 Green Power 0.9 0.6 1.8 1.5 Corporate (13.6) (18.5) (25.2) (35.2) 11.1 1.5 23.6 5.1 Cash Available for Distribution
Alliance Canada 17.5 18.6 37.1 36.6 Saskatchewan System 18.0 10.5 36.9 19.5 Green Power 1.3 1.2 2.7 2.9 Corporate (11.5) (6.6) (19.7) (11.3) 25.3 23.7 57.0 47.7 Earnings for the three and six months ended June 30, 2011 were $11.1 million and $23.6 million, respectively, and included contributions from the Saskatchewan System Phase II expansion project which
3
was placed in service in December 2010. The Phase II Expansion Project increased crude oil capacity across the gathering systems by approximately 125,000 barrels per day (bpd), providing a competitive transportation solution for growing production volumes from the Bakken region in southeastern Saskatchewan. Partially offsetting earnings growth from the Saskatchewan System were increased interest and tax expenses in the Corporate segment, as well as a period-over-period decline in earnings from Alliance Canada. While performing as expected and delivering stable financial results, Alliance Canada earnings decreased in the first half of 2011 due to a reduced equity return on its depreciating investment base. The Fund’s cash available for distribution (CAFD) totaled $57.0 million for the six months ended June 30, 2011 compared with $47.7 million for the same period of 2010, an increase of 19.5%. CAFD for the second quarter of 2011 of $25.3 million increased 6.8% over the second quarter of 2010. The most significant contributor to the increase in cash flow was higher toll revenue on the Fund’s crude oil transportation system resulting from the Phase II Expansion project. Corporate costs included increased interest expense on higher debt balances used to finance the project and higher current taxes. Cash distributions from Alliance Canada were $0.5 million higher in the first six months of 2011 compared with the same period in 2010, mainly due to a one-time distribution paid in the first quarter of 2011 following a favourable legal claim settlement with a third-party vendor. Following a modification to the terms of the ECT preferred units in December 2010, distributions on ECT preferred units are charged to equity and are no longer reflected as a corporate cost. ECT preferred unit distributions of $10.9 million and $20.9 million, respectively, were included as an expense in the Corporate segment for the three and six months ended June 30, 2010. FORWARD-LOOKING INFORMATION In the interest of providing the Fund’s unit holders and potential investors with information about the Fund, its subsidiaries and joint ventures, including management’s assessment of the Fund, its subsidiaries’ and joint ventures’ future plans and operations, certain information provided in this MD&A constitutes forward-looking statements or information (collectively, “forward-looking statements”).This information may not be appropriate for other purposes. Forward-looking statements are typically identified by words such as "anticipate", "expect", "project", “estimate”, “forecast”, “plan”, “intend”, “target”, “believe” and similar words suggesting future outcomes or statements regarding an outlook. In particular, forward-looking statements included or incorporated by reference in this document include, but are not limited to, statements with respect to:
expected costs related to projects under construction; expected scope and in-service dates for projects under construction; expected timing and amount of recovery of capital costs of assets; expected capital expenditures; expected future levels of demand for the Fund’s services; expected future earnings and cash flows; expected future actions of regulators; expected future distributions to unit holders and the taxability thereof; and expected cash available for distribution.
Although the Fund believes that these forward-looking statements are reasonable based on the information available on the date such statements are made and processes used to prepare the information, such statements are not guarantees of future performance and readers are cautioned against placing undue reliance on forward-looking statements. By their nature, these statements involve a variety of assumptions, known and unknown risks and uncertainties and other factors, which may cause actual results, levels of activity and achievements to differ materially from those expressed or implied by such statements. Material assumptions include assumptions about: the expected supply and demand for crude oil, natural gas and natural gas liquids; prices of crude oil, natural gas and natural gas liquids; expected exchange rates; inflation; interest rates; the availability and price of labour and pipeline construction materials; operational reliability; customer project approvals; maintenance of support and regulatory approval for the Fund’s projects; anticipated in-service dates and weather. Assumptions regarding the expected supply and demand of crude oil, natural gas and natural gas liquids, and the prices of these commodities, are material to and underlay all forward-looking statements. These factors are relevant to all forward-looking statements as they may impact current and future levels of demand for the Fund’s services. Similarly, exchange rates, inflation and interest rates impact the economies and business environments in which the Fund operates, may impact levels of demand for the Fund’s services and cost of inputs, and are therefore inherent in all forward-looking statements. Due to the

4
interdependencies and correlation of these macroeconomic factors, the impact of any one assumption on a forward-looking statement cannot be determined with certainty, particularly with respect to expected earnings and associated per unit amounts, or estimated future distributions. The most relevant assumptions associated with forward-looking statements on projects under construction, including estimated in-service dates, and expected capital expenditures include: the availability and price of labour and pipeline construction materials; the effects of inflation on labour and material costs; the effects of interest rates on borrowing costs; and the impact of weather and customer and regulatory approvals on construction schedules. The Fund’s forward-looking statements are subject to risks and uncertainties pertaining to operating performance, regulatory parameters, project approval and support, weather, economic and competitive conditions, exchange rates, interest rates, commodity prices and supply and demand for commodities, including but not limited to those risks and uncertainties discussed in this MD&A and in the Fund’s other filings with Canadian securities regulators. The impact of any one risk, uncertainty or factor on a particular forward-looking statement is not determinable with certainty as these are interdependent and the Fund’s future course of action depends on management’s assessment of all information available at the relevant time. Except to the extent required by law, the Fund assumes no obligation to publicly update or revise any forward-looking statements made in this MD&A or otherwise, whether as a result of new information, future events or otherwise. All subsequent forward-looking statements, whether written or oral, attributable to the Fund or persons acting on the Fund’s behalf, are expressly qualified in their entirety by these cautionary statements. NON-GAAP MEASURES This MD&A contains references to cash available for distribution. Cash available for distribution represents cash available to fund distributions on trust units and ECT preferred units, as well as for debt repayments and reserves. This measure is important to unit holders as the Fund’s objective is to provide a predictable flow of distributable cash to unit holders. Please refer to the Cash Available for Distribution reconciliation on page 8. Cash available for distribution is not a measure that has standardized meaning prescribed by Canadian GAAP and is not considered a GAAP measure. Therefore, this measure may not be comparable with similar measures presented by other issuers. ALLIANCE CANADA Three months ended
June 30,Six months ended
June 30, 2011 2010 2011 2010(millions of Canadian dollars) Revenues 54.3 56.8 107.8 112.9Earnings 13.4 14.3 26.7 28.8 The Alliance System is a 3,000 kilometre (km) pipeline system designed to transport 1,325 million cubic feet per day (mmcf/d) of natural gas from Northeastern British Columbia and Northwestern Alberta to the Chicago, Illinois area. The Fund owns 50% of Alliance Canada, which is the Canadian portion of the Alliance System and consists of approximately 1,560 km of the Alliance System’s mainline beginning near Gordondale, Alberta and connecting to Alliance US at the Canada/United States border at Carnduff, Saskatchewan. Alliance Canada also includes the Alliance System’s lateral pipelines in Alberta and British Columbia and related facilities. Alliance Canada has transportation service agreements (TSAs) with its shippers for nearly 100% of its available firm transportation capacity. Alliance Canada’s TSAs are designed to provide toll revenues sufficient to recover prudently incurred costs of service, including operating and maintenance, depreciation, an allowance for income tax, costs of indebtedness and an allowed return on equity of 11.26% after tax, based on a deemed 70/30 debt/equity ratio. The initial term of these agreements expires in 2015, except for 1.5% of capacity which has been re-contracted on a short-term basis. In December 2010, shippers representing approximately 8% of the original firm transportation capacity elected to extend their existing contracts to December 1, 2016 and also retained the option to continue to extend their capacity commitments on an annual basis. Remaining shippers, representing the balance of originally contracted capacity, elected not to extend their commitments beyond 2015 under the terms of the original contracts. Alliance Canada expects to continue to be competitive with other export pipelines beyond 2015 given its geographic positioning and high pressure operating capability to move liquids-rich gas to market, and is seeking to secure new long-term contracts for capacity for periods beyond 2016.

5
Alliance Canada revenues for the first half of 2011 reflected an increase in transportation tolls from $0.894 per million cubic feet (mcf) to $0.914/mcf effective January 1, 2011. For the three and six months ended June 30, 2011, increased revenues were more than offset by a decline in investment base compared with the same periods of 2010. Alliance Canada earnings for the six months ended June 30, 2011 decreased $2.1 million to $26.7 million compared with the same period of 2010. Second quarter 2011 earnings decreased $0.9 million to $13.4 million compared with the second quarter of 2010. These decreases result from a decline in Alliance Canada’s depreciating investment base. The rate used to calculate the equity return is not expected to change; however, the investment base upon which the return is calculated will change over time with depreciation and capital enhancements. SASKATCHEWAN SYSTEM Three months ended
June 30,Six months ended
June 30, 2011 2010 2011 2010(millions of Canadian dollars) Revenues 29.4 21.0 58.9 39.6Earnings 10.4 5.1 20.3 10.0 The Saskatchewan System is comprised of the Saskatchewan Gathering, Westspur, Weyburn and Virden pipeline systems. Collectively referred to as the Saskatchewan System, these crude oil and liquids pipeline systems include approximately 388 kilometres of trunk line, 1,941 kilometres of gathering pipeline and related terminals and tankage facilities. The capacity of each of the Saskatchewan Gathering and the Westspur Systems is 255,000 barrels per day (bpd) and the capacity of the Weyburn and Virden Systems is approximately 47,000 bpd and 37,000 bpd, respectively. The Saskatchewan System Phase II expansion, which included three separate projects and served to reduce capacity constraints at a variety of locations, was substantially completed and declared in-service in December 2010. Collectively, the expansion increased capacity across the gathering systems by approximately 125,000 bpd. The Saskatchewan Gathering System and the Westspur System tolling agreements are designed to provide toll revenues sufficient to recover operating costs, depreciation, deemed interest expense, deemed income tax, a return on rate base and an administrative expense allowance. The rate base upon which the equity return is calculated will change over time due to depreciation as well as maintenance and enhancement capital additions and expansions. Tolls on the Weyburn and Virden systems are based on historical precedent and agreements with customers, and are updated to reflect changes in market conditions when warranted. As a result, earnings from the Weyburn and Virden systems reflect toll revenue less costs incurred. Revenue for the six months ended June 30, 2011 increased $19.3 million compared with the same period in 2010 and increased $8.4 million in the three months ended June 30, 2011 over the second quarter of 2010. Higher revenues were primarily the result of the Phase II expansion that was completed in December 2010. As well, the period-over-period increase in revenue reflected toll increases on the Weyburn and Virden Systems which took effect in June 2010 and April 2010, respectively. Saskatchewan System earnings for the six months ended June 30, 2011 of $20.3 million increased $10.3 million compared with the same period of 2010. Earnings for the second quarter of 2011 of $10.4 million increased $5.3 million compared with the second quarter of 2010. The earnings growth was attributable to the Saskatchewan Gathering and Westspur pipeline systems, both of which have a higher rate base compared with the prior period as a result of the Phase II Expansion Project.

6
GREEN POWER Three months ended
June 30,Six months ended
June 30, 2011 2010 2011 2010(millions of Canadian dollars) Revenues 2.5 2.5 5.3 5.1Earnings 0.9 0.6 1.8 1.5 Green Power includes the Fund’s interest in three wind power projects including a 50% interest in the Sunbridge project at Gull Lake, Saskatchewan and a 33% interest in each of the Magrath and Chin Chute projects in southern Alberta. Collectively referred to as Wind Power, the Sunbridge, Magrath and Chin Chute wind power projects have a combined power generation capacity of 71 megawatts (MW). Green Power also includes the Fund’s 50% interest in NRGreen, which operates four non-regulated waste heat recovery facilities along the Alliance Pipeline. These facilities harness waste heat produced by gas turbines at Alliance Canada’s compressor stations that is converted to electrical energy and sold under long-term power purchase arrangements. Improved earnings in the Green Power segment in the first half of 2011 were attributable to slightly higher wind power production and the receipt of insurance proceeds relating to equipment performance issues of NRGreen in prior years, offset by increased interest expense resulting from higher interest rates on NRGreen debt. CORPORATE Three months ended
June 30,Six months ended
June 30, 2011 2010 2011 2010(millions of Canadian dollars) Corporate costs (13.6) (18.5) (25.2) (35.2) Corporate costs include corporate financing costs, incentive fees, current and future income taxes and management and administrative costs. Corporate costs for the three and six months ended June 30, 2011 reflected higher interest expense due to a greater proportion of debt outstanding at higher term rates when compared with the first and second quarters of 2010. The Fund issued $200.0 million fixed-rate unsecured medium-term notes in separate issuances of $100.0 million each in June and November of 2010, the proceeds of which were used primarily to refinance floating rate bank debt incurred to fund the expansion of the Saskatchewan System. In addition, tax expense increased for the three and six months ended June 30, 2011 compared with the comparable periods of 2010. Following a modification to the terms of the ECT preferred units in December 2010, distributions on such units are now recorded as a charge to equity whereas previously ECT preferred unit distributions were presented as interest expense. For the first half of 2011, ECT preferred unit distributions declared and charged to equity totaled $26.3 million, or $0.346 per unit, compared with interest expense of $21.9 million, or $0.288 per unit, in the comparable period of 2010. The liability component of the ECT preferred units is accreted over time to its ultimate redemption value. Accretion for the three and six months ended June 30, 2011 totaled $1.4 million and $2.6 million, respectively, and was included as interest expense within Corporate costs, compared with nil in the prior period. LIQUIDITY AND CAPITAL RESOURCES At June 30, 2011, the Fund had $131.0 million of available standby credit capacity. The Fund maintains a current shelf prospectus with the Canadian securities regulator, which enables ready access to Canadian public capital markets, subject to market conditions. Cash from operations in combination with available committed standby credit facilities is expected to be sufficient to meet currently forecast liquidity and capital resource requirements of the Fund. The Fund has been presented with a proposal to acquire
7
additional renewable assets from Enbridge. Should the proposal receive all necessary approvals, the Fund expects to finance the acquisition through a combination of trust and ECT preferred unit issuances and long-term debt. During the second quarter of 2011, the Fund amended its existing $300.0 million unsecured revolving standby credit facility with a syndicate of commercial banks extending the term of the revolving period of this facility to June 7, 2012. The Fund has the option to extend the maturity date of the outstanding amounts drawn under the facility by an additional year from the end of the applicable revolving term. Consistent with previous credit facilities, the Fund’s new credit facility includes covenants that limit outstanding debt to a multiple of EBITDA (earnings before interest, taxes, depreciation and amortization). In July 2011, the Fund further amended this credit facility to increase the working capital portion of the overall facility to $30.0 million from $10.0 million, and to include a feature under which up to $200.0 million of additional standby credit may, at the lender’s option, be provided on the same terms and conditions as the existing facility to fund designated expansion projects. The Fund’s current liabilities routinely exceed current assets; however, the Fund maintains sufficient short-term credit facilities to meet its obligations as they come due. The Fund’s cash balance at June 30, 2011 of $26.8 million included $17.2 million held in trust by Alliance Canada, pursuant to finance arrangements within Alliance Canada. OPERATING ACTIVITIES Cash provided by operating activities was $81.9 million for the six months ended June 30, 2011, an increase of $46.7 million from the same period of 2010. For the three months ended June 30, 2011, cash provided by operating activities of $34.6 million represented a $23.0 million increase from the prior year comparable period. Of these increases, $10.9 million and $21.9 million, respectively, related to the modification to the ECT preferred units which resulted in distributions being recorded as a charge to equity and presented within financing activities in 2011, whereas distributions were previously recorded as an expense and included within operating activities. The remaining increase in cash provided by operating activities was due to higher earnings from the Saskatchewan System and contributions from expansion assets declared in service in the fourth quarter of 2010, net of variations in working capital requirements. INVESTING ACTIVITIES Cash used in investing activities of $67.9 million for the six months ended June 30, 2011 increased $36.5 million over the first six months of 2010. Cash used in investing activities of $30.8 million for the second quarter of 2011 increased $12.9 million over the second quarter of 2010. Year to date capital expenditures were primarily directed to the completion of remaining seasonal and restorative work on the Saskatchewan System Phase II expansion, and development costs in connection with the Bakken Expansion Program. Investing activities for both the three and six months ended June 30, 2011 also includes maintenance capital expenditures in Saskatchewan and a net reduction in outstanding construction payables. FINANCING ACTIVITIES Financing activities for the three and six months ended June 30, 2011 included an increase in outstanding indebtedness under credit facilities, payments on non-recourse credit facilities and payment of distributions on the ECT preferred units and the trust units. In each of the first and second quarters of 2011, the Fund declared a quarterly distribution of $0.346 per unit to ECT preferred unit and trust unit holders and paid such distribution on July 15, 2011. In May 2011, the Fund announced the amendment of its distribution payment frequency from quarterly to monthly. The monthly payment frequency took effect with the July 2011 monthly distribution, which will be paid on August 15, 2011.

8
CASH AVAILABLE FOR DISTRIBUTION1 Three months ended
June 30, Six months ended
June 30, 2011 2010 2011 2010
(millions of Canadian dollars) Cash provided by operating activities 34.6 11.6 81.9 35.2
Add/(deduct): ECT preferred unit distributions2 - 10.9 - 21.9
Alliance Canada maintenance capital expenditures3 (0.1) (1.2) (0.5) (1.8)
Alliance Canada debt repayments4 (18.1) (17.0) (18.1) (17.0)
Alliance Canada other cash distributed/(retained)5 7.3 7.3 (1.4) (3.4)
Green Power cash retained4 (0.6) (0.5) (1.0) (0.8)Saskatchewan System maintenance capital
expenditures3 (1.3) (0.4) (2.0) (1.4)
Change in operating assets and liabilities in the period6 3.5 13.0 (1.9) 15.0Cash available for distribution 25.3 23.7 57.0 47.7
Cash available for distribution is comprised of the following:
Alliance Canada distributions 17.5 18.6 37.1 36.6Saskatchewan System operating income before
depreciation and amortization 19.3 10.9 38.9 20.9Saskatchewan System maintenance capital expenditures (1.3) (0.4) (2.0) (1.4)Green Power distributions 1.3 1.2 2.7 2.9Corporate management and administrative expense (4.1) (3.8) (6.4) (6.1)Corporate interest expense (4.8) (2.0) (9.7) (4.5)Corporate current income taxes (2.6) (0.8) (3.6) (0.7)
Cash available for distribution 25.3 23.7 57.0 47.7
ECT preferred unit distributions declared 13.15 10.95 26.31 21.90Trust unit distributions declared 11.98 9.97 23.96 19.94Cash distributions declared 25.13 20.92 50.27 41.841 See Non-GAAP measures on page 4. 2 The cash available for distribution above is compared with total distributions, including the ECT preferred unit distributions. Since ECT preferred units were previously treated as debt in 2010 under Canadian GAAP, with distributions deducted from earnings, the ECT preferred unit distributions have been added back to cash provided from operating activities for the three and six months ended June 30, 2010. 3 Maintenance capital expenditures reduce cash available for distribution since these expenditures are funded through cash from operations. 4 Debt repayments in Alliance Canada are deducted from cash from operations in deriving cash available for distribution because they are funded from cash from Alliance Canada's operations. 5 The cash retained or distributed by Alliance Canada and Green Power reflects the cash from operations of these segments that has not been distributed to the Fund or distributions in excess of cash earnings in the period. While this cash from operations is proportionately consolidated and included in the Fund’s cash provided by operating activities, it is not available for distribution by the Fund until it has been received from Alliance Canada and the Green Power segment. Cash retained by Alliance Canada and Green Power includes debt service reserves, capital expenditures and other cash needed to fund working capital or other requirements of these segments. 6 Change in operating assets and liabilities in the period reflect changes in non-cash working capital related to operating activities. The change has been added back to cash available for distribution since fluctuations in working capital are expected each period and are not indicative of changes in cash available to be distributed.

9
As set out in the above table, cash available for distribution consists of operating cash flow from the Fund’s underlying businesses less deductions for maintenance capital expenditures, the Fund’s administrative and operating expenses, corporate segment interest expense, applicable taxes and other reserves determined by the Manager. CAFD represents cash available to fund distributions on trust units and ECT preferred units, as well as for debt repayments and reserves. For the three and six months ended June 30, 2011, cash distributions declared represented 99.3% and 88.2%, respectively, of cash available for distribution compared with 88.3% and 87.7% for the three and six months ended June 30, 2010, respectively. During the second quarter of 2011, increased contributions from the Saskatchewan expansion were offset by increased interest expense incurred to fund the expansion, taxes paid on the incremental earnings and administrative fees related to the evaluation of the renewable energy proposal. The Fund, on average, expects to maintain a payout ratio between 90% and 95% of CAFD. ANALYSIS OF CASH DISTRIBUTIONS DECLARED Three months ended
June 30,Six months ended
June 30, 2011 2010 2011 2010(millions of Canadian dollars) Cash provided by operating activities 34.6 11.6 81.9 35.2Earnings 11.1 1.5 23.6 5.1Cash distributions declared1 25.1 9.9 50.3 19.9Excess of cash provided by operating activities over cash distributions declared 9.5 1.7 31.6 15.3Shortfall of earnings over cash distributions declared (14.0) (8.4) (26.7) (14.8)1 In 2010, ECT preferred unit distributions were excluded from this reconciliation since these distributions were reductions in determining earnings and cash provided by operating activities. For the six months ended June 30, 2011, cash provided by operating activities in the period exceeded cash distributions declared by $31.6 million (2010: $15.3 million). Cash provided by operating activities for the three months ended June 30, 2011 was $9.5 higher than cash distributions of $25.1 million for the three months ended June 30, 2010. This excess represented cash reserved for debt repayments, working capital requirements and maintenance capital expenditures, as well as cash retained by joint ventures. Earnings were $14.0 million and $26.7 million lower than cash distributions for the three and six months ended June 30, 2011 (2010: $8.4 million and $14.8 million, respectively). Earnings reflect non-cash items such as amortization of deferred financing costs, depreciation and future income taxes, all of which do not impact cash flow. Depreciation does not necessarily represent the cost of maintaining productive capacity; therefore, cash required for maintenance is generally lower than depreciation expense. RECENT DEVELOPMENTS AND OUTLOOK Renewable Energy Proposal In April 2011, the Fund and ENF received a proposal from Enbridge, pursuant to which Enbridge would transfer three renewable energy assets to the Fund. The proposal contemplates that the Ontario Wind, Sarnia Solar and Talbot Wind energy projects would be transferred for an aggregate value of $1.3 billion, to be paid in part by the issuance of additional ordinary trust units of the Fund to both ENF and Enbridge on a pro rata basis in accordance with their present holdings in the Fund. Under the proposal, Enbridge would provide bridge debt financing to the Fund for the balance of the price. Enbridge would also grant an option to ENF to acquire some or all of the units to which Enbridge would be entitled to subscribe. The proposal contemplates that ENF would undertake a public equity offering to fund its subscription of units and that Enbridge will concurrently subscribe for equity of ENF in order to maintain its current

10
interest in ENF. The proposed transfer is subject to all necessary approvals, including approval by the Boards of the Fund and ENF, minority ENF shareholders, and regulatory approval. The Fund and ENF have formed a joint special committee comprised of independent trustees and directors, to review the proposal and make recommendations to the respective Boards of the Fund and ENF. Bakken Expansion Program A joint project to further expand crude oil pipeline capacity to accommodate growing production from the Bakken and Three Forks formations located in Montana, North Dakota, Saskatchewan and Manitoba is being undertaken by the Fund and Enbridge Energy Partners L.P. (EEP), a party related to the Fund. The Bakken Expansion Program will increase takeaway capacity from the Bakken area by an initial 145,000 bpd, which can be readily expanded to 325,000 bpd. The Bakken Expansion Program will involve construction of facilities in the United States undertaken by EEP at a cost of approximately US$0.4 billion and construction of facilities in Canada undertaken by the Fund at a cost of approximately $0.2 billion. Regulatory approval has been received and construction commenced in July 2011 on the United States portion of the project. In Canada, NEB hearings are scheduled for October 2011. As a first step to providing immediate capacity to growing Bakken production, the Fund completed, during the second quarter of 2011, the reactivation and reversal of Line Ex-02, which will provide capacity to deliver an initial 25,000 bpd of North Dakota production, pending completion of the Bakken Expansion Program. The Bakken Expansion Program is expected to be completed in the first quarter of 2013. Regulatory Matters On December 17, 2010, the Saskatchewan System filed amended Westspur tariffs with the NEB with an effective date of February 1, 2011. In January 2011, a shipper on the Westspur system requested the NEB make the tolls “interim” effective February 1, 2011 pending discussions between the shipper and the Saskatchewan System on information requests put forward by the shipper. Subsequently, the shipper filed a complaint with the NEB on the basis that the information provided by the Fund was not adequate to allow an assessment to be made of the reasonableness of the tolls. Six parties have filed letters with the NEB supporting the shipper’s complaint. The NEB directed additional discussion among the parties and, as of August 2, the Fund continues to discuss with shippers the reasonableness of its Westspur tolls. CRITICAL ACCOUNTING ESTIMATES Asset Retirement Obligations In May 2009, the NEB released a report on the financial issues associated with pipeline abandonment and established a goal for pipelines regulated under the NEB Act to begin setting aside funds for abandonment no later than January 1, 2015. Since then, the NEB has issued several revised “base case assumptions” based on feedback from member companies. Companies have the option to follow the base case assumptions or to submit pipeline specific applications. The NEB is requiring both Group 1 and Group 2 companies to file for approval estimates of abandonment costs by November 30, 2011. The NEB is also requiring large pipeline companies to file a proposed process for collecting and setting aside the funds for abandonment by November 30, 2012 for Group 1 companies (including Alliance Canada). Both of the required submissions will require NEB approval and will result in increases to transportation tolls, the amount of which is uncertain at this time. Currently, for certain of the Company’s assets, it is not practical to make a reasonable estimate of asset retirement obligations for accounting purposes due to the indeterminate timing and the scope of the asset retirements.

11
CHANGE IN ACCOUNTING POLICIES Business Combinations Effective January 1, 2011, the Fund adopted Part V Section 1582, Business Combinations, which replaces Section 1581. The new standard requires assets and liabilities acquired in a business combination to be measured at fair value at the acquisition date and if applicable, any original equity interest in the investee to be re-measured to fair value through earnings on the date control is obtained. The standard also requires that acquisition-related costs, such as advisory or legal fees, incurred to effect a business combination be expensed in the period in which they are incurred. In accordance with the transitional provisions of this standard, Section 1582 was adopted prospectively and accordingly, assets and liabilities that arose from business combinations occurring before January 1, 2011 were not restated. The adoption of this standard has not impacted the Fund’s earnings or cash flows for the three and six month periods ended June 30, 2011. Future Accounting Policies First-time adoption of Part I – International Financial Reporting Standards (Part I) of the CICA Handbook is mandatory for Canadian publicly accountable enterprises on January 1, 2011, with the exception of certain qualifying entities. Part I applies to qualifying entities, including those with operations subject to rate regulation, for periods beginning on or after January 1, 2012. The Fund is a qualifying entity for purposes of this deferral and will continue to present its financial statements in accordance with pre-changeover accounting standards, Part V of the CICA Handbook, during the 2011 deferral period. There continues to be uncertainty with respect to the application of IFRS to the rate regulated operations of the Fund, which are pervasive and central to its business model and performance measurement. The Fund does not expect a rate regulated accounting standard to be finalized by the International Accounting Standards Board in advance of 2012. The Fund is permitted to prepare its financial statements in accordance with U.S. GAAP for purposes of meeting its Canadian continuous disclosure obligations under a three-year exemption granted by securities regulators in Canada and will adopt U.S. GAAP for interim and annual financial statements beginning on January 1, 2012. Alliance Canada, a significant investee of the Fund, is also permitted to prepare its financial statements in accordance with U.S. GAAP under a similar order and will adopt U.S. GAAP effective January 1, 2012. In preparation for the U.S. GAAP conversion, Enbridge, whose U.S. GAAP conversion project includes the Fund, has formed a U.S. GAAP project team and developed a transition plan and governance structure to monitor the progress of the transition. Enbridge has engaged a public accounting firm to assist with the project and to provide technical accounting advice on the interpretation and application of U.S. GAAP. Management will report regularly to the Audit Committee of the Board of Trustees on the progress of the conversion to U.S. GAAP. Accounting and Reporting The Fund has commenced identifying known U.S. GAAP differences. The most significant differences identified to date are expected to impact the following areas: Equity accounting treatment of joint ventures; Measurement and presentation of ECT preferred units and trust units; Accounting for transfers of assets between entities under common control; Hedge accounting as it applies to hedged risks within joint ventures; and Presentation of deferred financing costs. The Fund has also substantially completed the preparation of model U.S. GAAP financial statements to identify the type of information and level of detail required to be disclosed under U.S. GAAP. Training The owner of the Fund’s manager, Enbridge, has experience reporting under U.S. GAAP and has reconciled its financial statements to U.S. GAAP for many years as a SEC registrant. Enbridge has a detailed plan to provide supplemental U.S. GAAP training to internal personnel impacted by the conversion. Training initiatives have commenced and will continue throughout 2011.
12
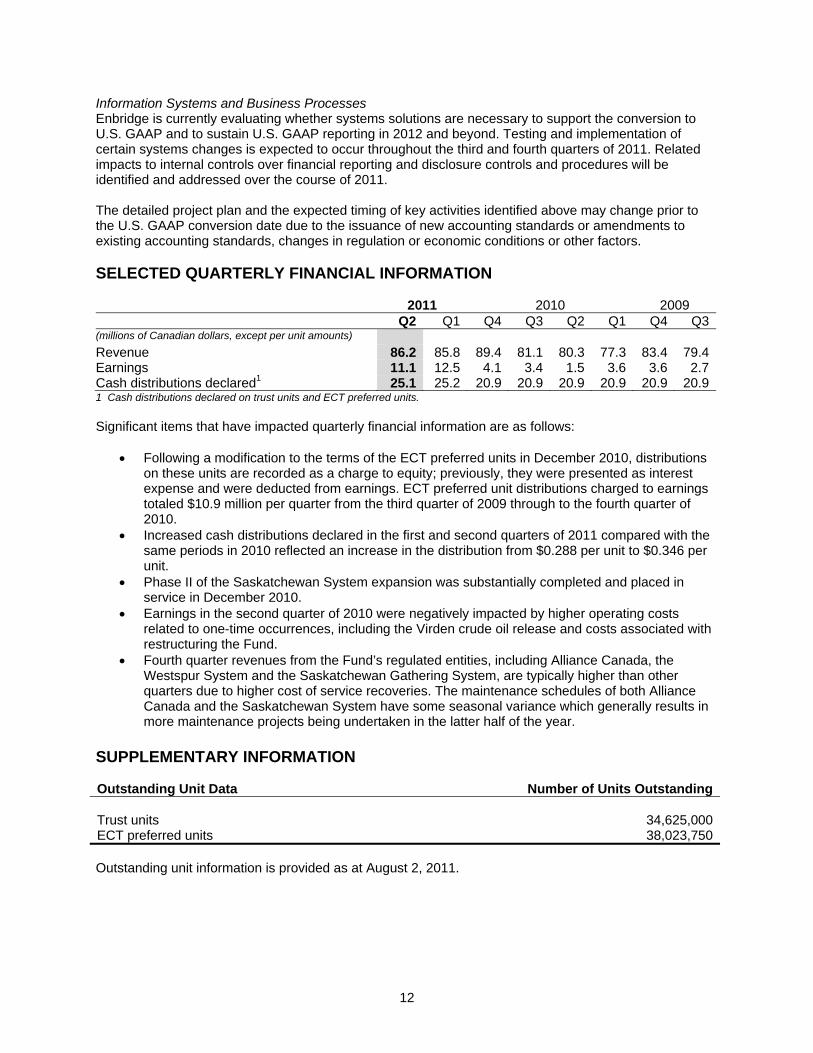
Information Systems and Business Processes Enbridge is currently evaluating whether systems solutions are necessary to support the conversion to U.S. GAAP and to sustain U.S. GAAP reporting in 2012 and beyond. Testing and implementation of certain systems changes is expected to occur throughout the third and fourth quarters of 2011. Related impacts to internal controls over financial reporting and disclosure controls and procedures will be identified and addressed over the course of 2011. The detailed project plan and the expected timing of key activities identified above may change prior to the U.S. GAAP conversion date due to the issuance of new accounting standards or amendments to existing accounting standards, changes in regulation or economic conditions or other factors. SELECTED QUARTERLY FINANCIAL INFORMATION 2011 2010 2009 Q2 Q1 Q4 Q3 Q2 Q1 Q4 Q3(millions of Canadian dollars, except per unit amounts) Revenue 86.2 85.8 89.4 81.1 80.3 77.3 83.4 79.4Earnings 11.1 12.5 4.1 3.4 1.5 3.6 3.6 2.7Cash distributions declared1 25.1 25.2 20.9 20.9 20.9 20.9 20.9 20.91 Cash distributions declared on trust units and ECT preferred units. Significant items that have impacted quarterly financial information are as follows:
Following a modification to the terms of the ECT preferred units in December 2010, distributions on these units are recorded as a charge to equity; previously, they were presented as interest expense and were deducted from earnings. ECT preferred unit distributions charged to earnings totaled $10.9 million per quarter from the third quarter of 2009 through to the fourth quarter of 2010.
Increased cash distributions declared in the first and second quarters of 2011 compared with the same periods in 2010 reflected an increase in the distribution from $0.288 per unit to $0.346 per unit.
Phase II of the Saskatchewan System expansion was substantially completed and placed in service in December 2010.
Earnings in the second quarter of 2010 were negatively impacted by higher operating costs related to one-time occurrences, including the Virden crude oil release and costs associated with restructuring the Fund.
Fourth quarter revenues from the Fund’s regulated entities, including Alliance Canada, the Westspur System and the Saskatchewan Gathering System, are typically higher than other quarters due to higher cost of service recoveries. The maintenance schedules of both Alliance Canada and the Saskatchewan System have some seasonal variance which generally results in more maintenance projects being undertaken in the latter half of the year.
SUPPLEMENTARY INFORMATION Outstanding Unit Data Number of Units Outstanding Trust units 34,625,000ECT preferred units 38,023,750 Outstanding unit information is provided as at August 2, 2011.

13
SELECTED OPERATING AND FINANCIAL HIGHLIGHTS1 Three months ended Six months ended
June 30, June 30, 2011 2010 2011 2010
(millions of Canadian dollars, except where otherwise noted)
Average daily throughput volume Alliance Canada2 (millions of cubic feet per day) 1,519.0 1,582.0 1,601.0 1,631.0
Saskatchewan System3 (thousands of barrels per day)
Westspur System 172.7 199.2 186.6 196.2Saskatchewan Gathering System 122.2 135.0 131.0 133.8Weyburn System 29.6 34.7 30.6 34.9Virden System 19.9 14.4 17.9 16.8
Green Power2 (thousands of megawatt hours produced) 91.4 90.1 196.2 185.9
Earnings Alliance Canada 13.4 14.3 26.7 28.8Saskatchewan System 10.4 5.1 20.3 10.0Green Power 0.9 0.6 1.8 1.5Corporate (13.6) (18.5) (25.2) (35.2)
11.1 1.5 23.6 5.1
Cash provided by operating activities 34.6 11.6 81.9 35.2Cash distributions declared 25.1 20.9 50.3 41.8
Cash available for distribution4 Alliance Canada 17.5 18.6 37.1 36.6Saskatchewan System 18.0 10.5 36.9 19.5Green Power 1.3 1.2 2.7 2.9Corporate (11.5) (6.6) (19.7) (11.3)
25.3 23.7 57.0 47.7
Cash distributions declared per unit (dollars per unit) Trust units 0.346 0.288 0.692 0.576ECT preferred units 0.346 0.288 0.692 0.576
ECT preferred units (number of units) 38,023,750 38,023,750Trust units (number of units) 34,625,000 34,625,0001 Financial Highlights have been extracted from financial statements prepared in accordance with GAAP. 2 Reflects 100% of the respective entities production volumes, not the Fund's proportionate share. 3 Totals are not presented as the same volumes can be transported through a combination of the pipelines comprising the Saskatchewan System. 4 See Non-GAAP Measures.

Cons
ENBRIDGE INCOME FUND
CONSOLIDATED FINANCIAL STATEMENTS
June 30, 2011
2
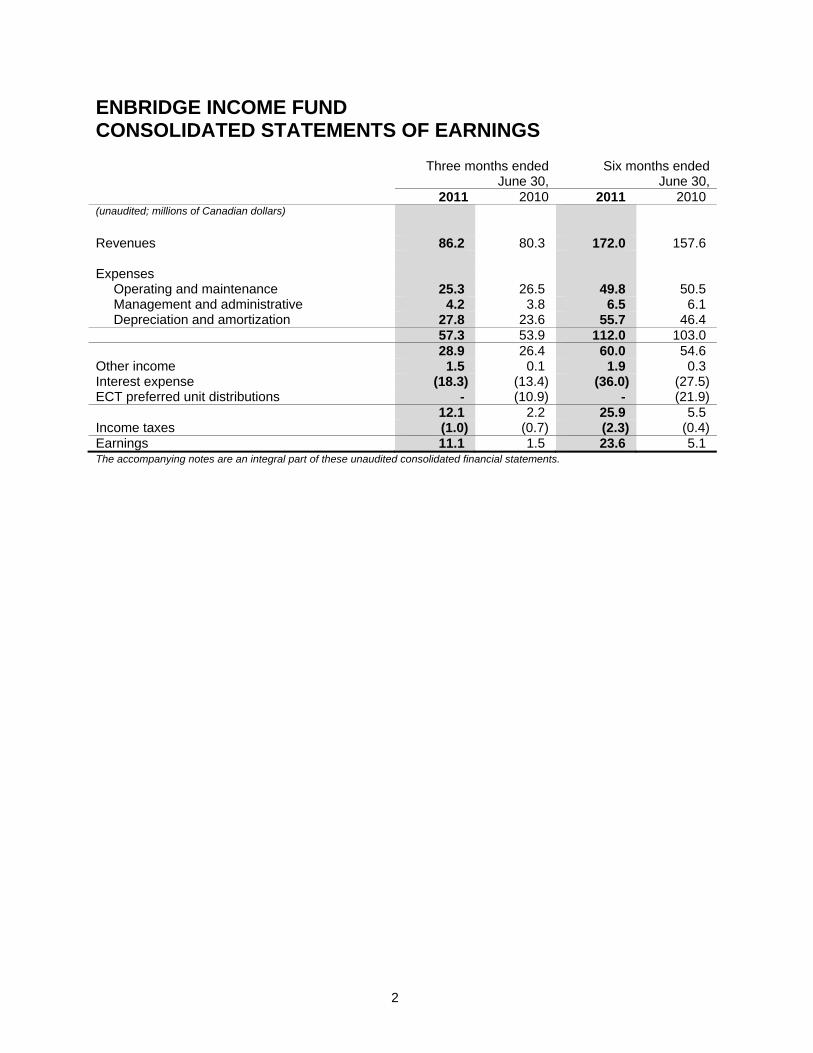
ENBRIDGE INCOME FUND CONSOLIDATED STATEMENTS OF EARNINGS Three months ended
June 30,Six months ended
June 30, 2011 2010 2011 2010 (unaudited; millions of Canadian dollars) Revenues 86.2 80.3 172.0 157.6 Expenses Operating and maintenance 25.3 26.5 49.8 50.5 Management and administrative 4.2 3.8 6.5 6.1 Depreciation and amortization 27.8 23.6 55.7 46.4 57.3 53.9 112.0 103.0 28.9 26.4 60.0 54.6 Other income 1.5 0.1 1.9 0.3 Interest expense (18.3) (13.4) (36.0) (27.5)ECT preferred unit distributions - (10.9) - (21.9) 12.1 2.2 25.9 5.5 Income taxes (1.0) (0.7) (2.3) (0.4)Earnings 11.1 1.5 23.6 5.1 The accompanying notes are an integral part of these unaudited consolidated financial statements.
3
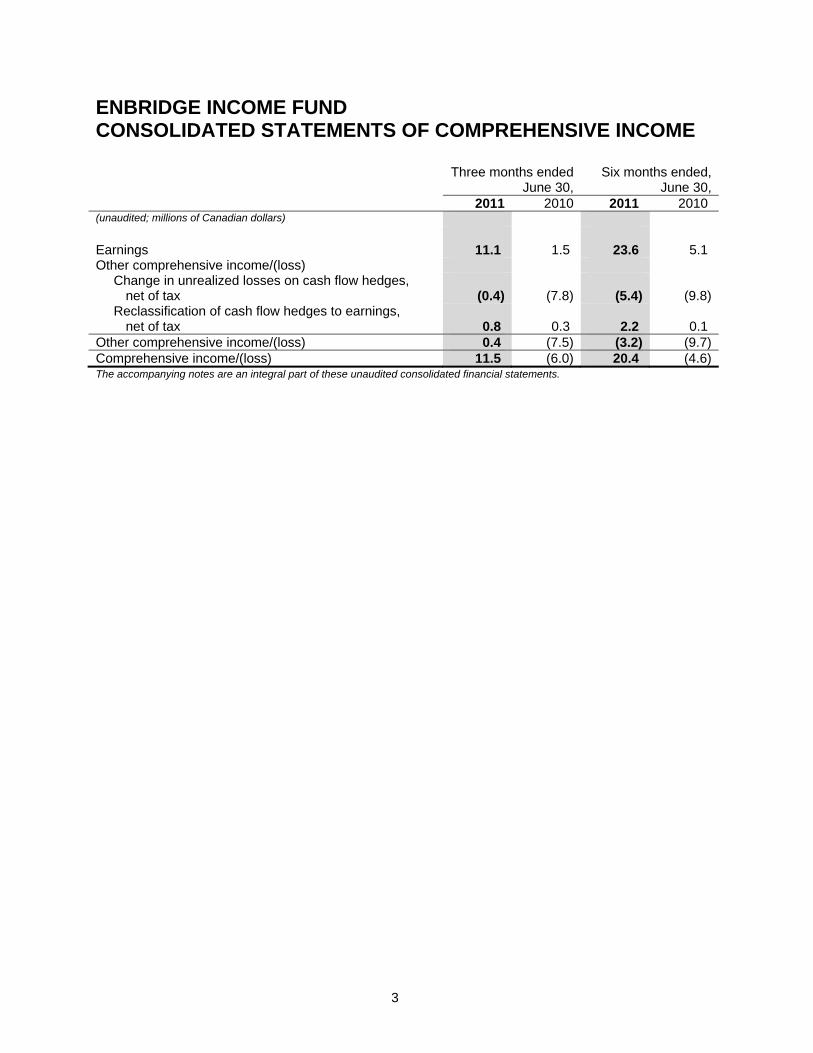
ENBRIDGE INCOME FUND CONSOLIDATED STATEMENTS OF COMPREHENSIVE INCOME Three months ended
June 30, Six months ended,
June 30, 2011 2010 2011 2010 (unaudited; millions of Canadian dollars) Earnings 11.1 1.5 23.6 5.1 Other comprehensive income/(loss) Change in unrealized losses on cash flow hedges,
net of tax (0.4) (7.8) (5.4) (9.8) Reclassification of cash flow hedges to earnings,
net of tax 0.8 0.3 2.2 0.1 Other comprehensive income/(loss) 0.4 (7.5) (3.2) (9.7)Comprehensive income/(loss) 11.5 (6.0) 20.4 (4.6)The accompanying notes are an integral part of these unaudited consolidated financial statements.

4
ENBRIDGE INCOME FUND CONSOLIDATED STATEMENTS OF UNITHOLDERS’ EQUITY Six months ended
June 30, 2011 2010 (unaudited; millions of Canadian dollars) Trust units 333.4 333.4 ECT preferred units 583.7 - Deficit, beginning of period (407.4) (88.8) Earnings 23.6 5.1 Distributions to unit holders (24.0) (19.9) ECT preferred unit distributions (26.3) - Deficit, end of period (434.1) (103.6)Accumulated other comprehensive loss, beginning of period (20.3) (4.1) Other comprehensive loss, net of tax (3.2) (9.7)Accumulated other comprehensive loss, end of period (23.5) (13.8)Total unitholders’ equity 459.5 216.0 The accompanying notes are an integral part of these unaudited consolidated financial statements.
5
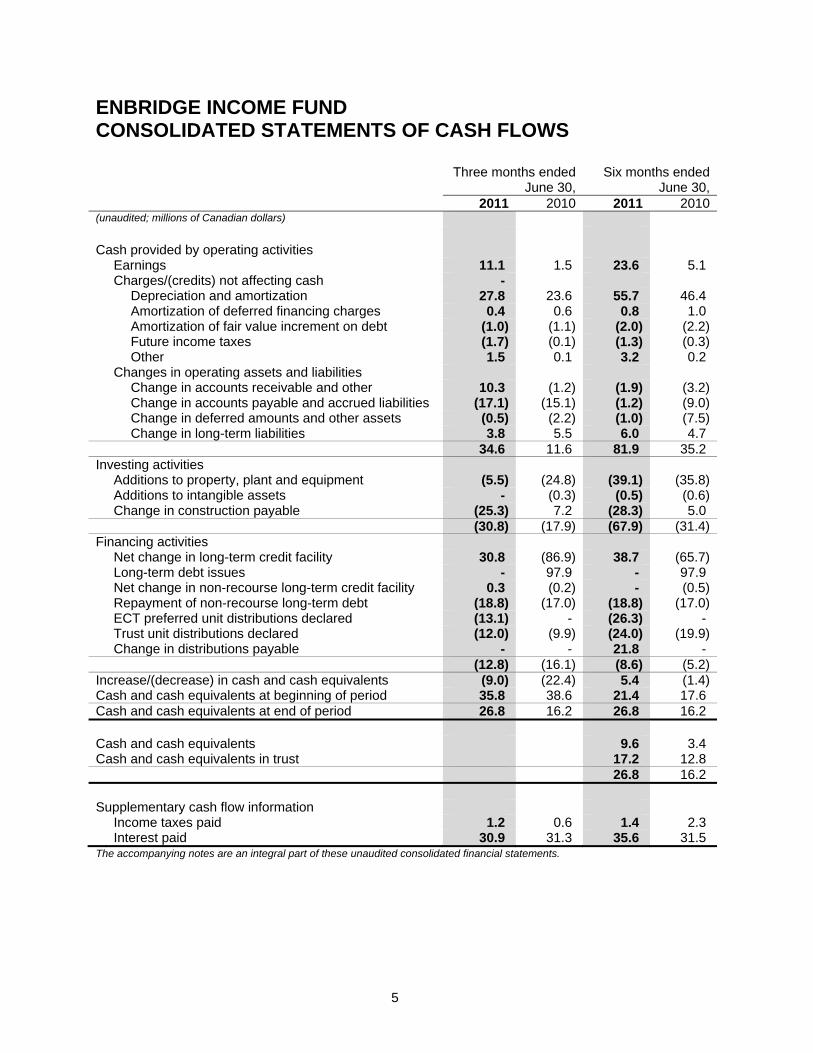
ENBRIDGE INCOME FUND CONSOLIDATED STATEMENTS OF CASH FLOWS Three months ended
June 30, Six months ended
June 30, 2011 2010 2011 2010(unaudited; millions of Canadian dollars) Cash provided by operating activities Earnings 11.1 1.5 23.6 5.1 Charges/(credits) not affecting cash - Depreciation and amortization 27.8 23.6 55.7 46.4 Amortization of deferred financing charges 0.4 0.6 0.8 1.0 Amortization of fair value increment on debt (1.0) (1.1) (2.0) (2.2) Future income taxes (1.7) (0.1) (1.3) (0.3) Other 1.5 0.1 3.2 0.2 Changes in operating assets and liabilities Change in accounts receivable and other 10.3 (1.2) (1.9) (3.2) Change in accounts payable and accrued liabilities (17.1) (15.1) (1.2) (9.0) Change in deferred amounts and other assets (0.5) (2.2) (1.0) (7.5) Change in long-term liabilities 3.8 5.5 6.0 4.7 34.6 11.6 81.9 35.2 Investing activities Additions to property, plant and equipment (5.5) (24.8) (39.1) (35.8) Additions to intangible assets - (0.3) (0.5) (0.6) Change in construction payable (25.3) 7.2 (28.3) 5.0 (30.8) (17.9) (67.9) (31.4)Financing activities Net change in long-term credit facility 30.8 (86.9) 38.7 (65.7) Long-term debt issues - 97.9 - 97.9 Net change in non-recourse long-term credit facility 0.3 (0.2) - (0.5) Repayment of non-recourse long-term debt (18.8) (17.0) (18.8) (17.0) ECT preferred unit distributions declared (13.1) - (26.3) - Trust unit distributions declared (12.0) (9.9) (24.0) (19.9) Change in distributions payable - - 21.8 - (12.8) (16.1) (8.6) (5.2)Increase/(decrease) in cash and cash equivalents (9.0) (22.4) 5.4 (1.4)Cash and cash equivalents at beginning of period 35.8 38.6 21.4 17.6 Cash and cash equivalents at end of period 26.8 16.2 26.8 16.2 Cash and cash equivalents 9.6 3.4 Cash and cash equivalents in trust 17.2 12.8 26.8 16.2 Supplementary cash flow information Income taxes paid 1.2 0.6 1.4 2.3 Interest paid 30.9 31.3 35.6 31.5 The accompanying notes are an integral part of these unaudited consolidated financial statements.

6
ENBRIDGE INCOME FUND CONSOLIDATED STATEMENTS OF FINANCIAL POSITION June 30,
2011 December 31,
2010 (unaudited; millions of Canadian dollars) Assets Current assets Cash and cash equivalents 26.8 21.4 Accounts receivable and other 56.8 55.0 83.6 76.4 Property, plant and equipment, net 1,294.9 1,305.1 Intangible assets 80.3 83.4 Goodwill 308.1 308.1 Deferred amounts and other assets 194.0 198.4 Future income taxes 4.1 4.1 1,965.0 1,975.5 Liabilities and unitholders’ equity Current liabilities Accounts payable and accrued liabilities 43.8 72.9 Distributions payable 25.1 3.3 Current portion of non-recourse long-term debt 37.6 36.3 106.5 112.5 Long-term debt 455.0 415.7 Non-recourse long-term debt 666.0 687.9 ECT preferred units 90.7 88.1 Long-term liabilities 22.1 10.4 Asset retirement obligations 14.5 15.1 Future income taxes 150.7 156.4 1,505.5 1,486.1 Unitholders’ equity Trust units 333.4 333.4 ECT preferred units 583.7 583.7 Deficit (434.1) (407.4) Accumulated other comprehensive loss (23.5) (20.3) 459.5 489.4 1,965.0 1,975.5 The accompanying notes are an integral part of these unaudited consolidated financial statements.

7
ENBRIDGE INCOME FUND NOTES TO THE UNAUDITED CONSOLIDATED FINANCIAL STATEMENTS The accompanying unaudited interim consolidated financial statements of Enbridge Income Fund (the Fund) have been prepared in accordance with Part V – Pre-changeover Accounting Standards of the Canadian Institute of Chartered Accountants (CICA) Handbook (Canadian GAAP or Part V). These interim consolidated financial statements do not include all disclosures required for annual financial statements and therefore should be read in conjunction with the consolidated financial statements and notes thereto included in the Fund’s 2010 Annual Report. Earnings for interim periods may not be indicative of results for the fiscal year due to the seasonal nature of Alliance Canada and the Saskatchewan System maintenance schedules and the Green Power segment’s operations.
1. CHANGE IN ACCOUNTING POLICIES
Business Combinations Effective January 1, 2011, the Fund adopted Part V Section 1582, Business Combinations, which replaces Section 1581. The new standard requires assets and liabilities acquired in a business combination to be measured at fair value at the acquisition date and if applicable, any original equity interest in the investee to be re-measured to fair value through earnings on the date control is obtained. The standard also requires that acquisition-related costs, such as advisory or legal fees, incurred to effect a business combination be expensed in the period in which they are incurred. In accordance with the transitional provisions of this standard, Section 1582 was adopted prospectively and accordingly, assets and liabilities that arose from business combinations occurring before January 1, 2011 were not restated. The adoption of this standard has not impacted the Fund’s earnings or cash flows for the three or six month periods ended June 30, 2011. Future Accounting Policy Changes International Financial Reporting Standards First-time adoption of Part I – International Financial Reporting Standards (Part I) of the CICA Handbook is mandatory for Canadian publicly accountable enterprises on January 1, 2011, with the exception of certain qualifying entities. Part I is mandatory for qualifying entities, including those with operations subject to rate regulation, for periods beginning on or after January 1, 2012. The Fund is a qualifying entity for purposes of this deferral and will continue to present its financial statements in accordance with pre-changeover accounting standards, Part V during the 2011 deferral period.
2. SEGMENTED INFORMATION
Three months ended June 30, 2011 Alliance Canada
Saskatchewan System
Green Power Corporate Consolidated
(unaudited; millions of Canadian dollars) Revenues 54.3 29.4 2.5 - 86.2Operating and maintenance (14.3) (10.1) (0.9) - (25.3)Management and administrative - - - (4.2) (4.2)Depreciation and amortization (16.3) (10.4) (1.1) - (27.8) 23.7 8.9 0.5 (4.2) 28.9Other income 0.2 0.8 0.5 - 1.5Interest expense (10.5) - (0.1) (7.7) (18.3)Income tax recovery/(expense) - 0.7 - (1.7) (1.0)Earnings 13.4 10.4 0.9 (13.6) 11.1 Additions to property, plant and equipment 0.5 5.0 - - 5.5Total assets 1,460.4 426.1 71.5 7.0 1,965.0

8
Three months ended June 30, 2010 Alliance Canada
Saskatchewan System
Green Power Corporate Consolidated
(unaudited; millions of Canadian dollars) Revenues 56.8 21.0 2.5 - 80.3 Operating and maintenance (15.6) (10.1) (0.8) - (26.5) Management and administrative - - - (3.8) (3.8) Depreciation and amortization (16.1) (6.5) (1.0) - (23.6) 25.1 4.4 0.7 (3.8) 26.4 Other income/(expense) 0.1 - - - 0.1 Interest expense (10.9) - (0.1) (2.4) (13.4) ECT preferred unit distributions - - - (10.9) (10.9) Income tax recovery/(expense) - 0.7 - (1.4) (0.7) Earnings/(loss) 14.3 5.1 0.6 (18.5) 1.5 Additions to property, plant and equipment 1.6 23.0 0.2 - 24.8 Total assets 1,520.7 313.1 74.0 6.2 1,914.0
Six months ended June 30, 2011 Alliance Canada
Saskatchewan System
Green Power Corporate Consolidated
(unaudited; millions of Canadian dollars) Revenues 107.8 58.9 5.3 - 172.0Operating and maintenance (28.0) (20.0) (1.8) - (49.8)Management and administrative - - - (6.5) (6.5)Depreciation and amortization (32.7) (21.0) (2.0) - (55.7) 47.1 17.9 1.5 (6.5) 60.0Other income 0.3 1.0 0.6 - 1.9Interest expense (20.8) - (0.3) (14.9) (36.0)Income tax recovery/(expense) 0.1 1.4 - (3.8) (2.3)Earnings 26.7 20.3 1.8 (25.2) 23.6 Additions to property, plant and equipment 1.2 37.9 - - 39.1Total assets 1,460.4 426.1 71.5 7.0 1,965.0
Six months ended June 30, 2010 Alliance Canada
Saskatchewan System
Green Power Corporate Consolidated
(unaudited; millions of Canadian dollars) Revenues 112.9 39.6 5.1 - 157.6 Operating and maintenance (30.3) (18.7) (1.5) - (50.5) Management and administrative - - - (6.1) (6.1) Depreciation and amortization (32.0) (12.3) (2.1) - (46.4) 50.6 8.6 1.5 (6.1) 54.6 Other income/(expense) 0.1 - 0.2 - 0.3 Interest expense (22.0) - (0.2) (5.3) (27.5) ECT preferred unit distributions - - - (21.9) (21.9) Income tax recovery/(expense) 0.1 1.4 - (1.9) (0.4) Earnings/(loss) 28.8 10.0 1.5 (35.2) 5.1 Additions to property, plant and equipment 2.8 32.7 0.3 - 35.8 Total assets 1,520.7 313.1 74.0 6.2 1,914.0

9
3. LONG TERM DEBT During the second quarter of 2011, the Fund amended its existing $300.0 million unsecured revolving standby credit facility with a syndicate of commercial banks extending the term of the revolving period of this facility to June 7, 2012. The Fund has the option to extend the maturity date of the outstanding amounts drawn under the facility by an additional year from the end of the applicable revolving term. Consistent with previous credit facilities, the Fund’s new credit facility includes covenants that limit outstanding debt to a multiple of EBITDA (earnings before interest, taxes, depreciation and amortization). In July 2011, the Fund further amended this credit facility to increase the working capital portion of the overall facility to $30.0 million from $10.0 million, and to include a feature under which up to $200.0 million of additional standby credit may, at the lender’s option, be provided on the same terms and conditions as the existing facility to fund designated expansion projects.