2015 ManaGeMent’s DisCussion anD anaLysis AR 2015 MDA Final.pdf · CanWel Building Materials...
21
CanWel Building Materials Group Ltd. 2015 MANAGEMENT’S DISCUSSION AND ANALYSIS
Transcript of 2015 ManaGeMent’s DisCussion anD anaLysis AR 2015 MDA Final.pdf · CanWel Building Materials...

CanWel Building Materials Group Ltd.
2015 ManaGeMent’s DisCussion anD anaLysis

CanWel Building Materials Group Ltd. | 2015 AnnuAL RepoRt
ManageMent’s Discussion anD analysis
1
CanWel Building Materials Group Ltd. Management’s Discussion and Analysis March 2, 2016 This Management’s Discussion and Analysis (“MD&A”) provides a review of the significant developments that have impacted CanWel Building Materials Group Ltd. (the “Company”) in the quarter and year ended December 31, 2015 relative to 2014. This discussion of the financial condition and results of operations of the Company should be read in conjunction with the Company’s audited consolidated financial statements and notes thereto for the year ended December 31, 2015 (the “2015 Consolidated Financial Statements”). The financial information in this MD&A has been prepared in accordance with International Financial Reporting Standards (“IFRS”), applicable to the preparation of financial statements.
This MD&A, the associated 2015 Consolidated Financial Statements and the 2015 Letter to Shareholders (the “2015 Reporting Documents”) contain historical information, descriptions of current circumstances and statements about potential future developments and anticipated financial results, performance or achievements of the Company and its subsidiaries. The latter statements, which are forward-looking statements, are presented to provide guidance to the reader but their accuracy depends on a number of assumptions and are subject to various known and unknown risks and uncertainties. Forward-looking statements are included under the headings “Business Overview”, “Outlook”, “Commitments and Contingencies”, “Sales and Gross Margin”, “Dividend Policy” and “Liquidity and Capital Resources”. When used in this MD&A, such statements may contain such words as “may,” “will,” “intend,” “should,” “expect,” “believe,” “outlook,” “predict,” “remain,” “anticipate,” “estimate,” “potential,” “continue,” “plan,” “could,” “might,” “project,” “targeting” or the negative of these terms or other similar terminology. Forward-looking information in the 2015 Reporting Documents includes, without limitation, statements regarding funding requirements. These statements are based on management’s current expectations regarding future events and operating performance, are based on information currently available to management, speak only as of the date of the 2015 Reporting Documents and are subject to risks which are described in the Company’s current Annual Information Form dated March 25, 2015 (“AIF”) and the Company’s public filings on the Canadian Securities Administrators’ website at www.sedar.com (“SEDAR”) and as updated from time to time, and would include, but are not limited to, dependence on market economic conditions, sales and margin risk, acquisition and integration risks, competition, information system risks, availability of supply of products, risks associated with the introduction of new product lines, product design risk, environmental risks, volatility of commodity prices, inventory risks, customer and vendor risks, availability of credit, credit risks, currency risks, interest rate risks, tax risks, risks of legislative changes, key executive risk and litigation risks. In addition, there are numerous risks associated with an investment in common shares or the Company’s convertible debentures, which are also further described in the “Risks and Uncertainties” section in this MD&A and in the “Risk Factors” section of the Company’s AIF, and as updated from time to time, and the Company’s other public filings on SEDAR. These risks and uncertainties may cause actual results to differ materially from those contained in the statements. Such statements reflect management’s current views and are based on certain assumptions. Some of the key assumptions include, but are not limited to, assumptions regarding the performance of the Canadian economy, the state and performance of the United States economy, interest rates, exchange rates, capital and loan availability, commodity pricing, the Canadian and US housing and building materials markets; post acquisition operation of a business; the amount of the Company’s cash flow from operations; tax laws; and the extent of the Company’s future acquisitions and capital spending requirements or planning in respect thereto, including but not limited to the performance of any such business and its operation. They are, by necessity, only estimates of future developments and actual developments may differ materially from these statements due to a number of known and unknown factors. Investors are cautioned not to place undue reliance on these forward-looking statements. All forward-looking information in the 2015 Reporting Documents is qualified by these cautionary statements. Although the forward-looking information contained these 2015 Reporting Documents is based on upon what management believes are reasonable assumptions, there can be no assurance that actual results will be consistent with these forward-looking statements. Certain statements included in the 2015 Reporting Documents may be considered “financial outlook” for purposes of applicable securities laws, and such financial outlook may not be appropriate for purposes other than these 2015 Reporting Documents.
The forward-looking statements contained in the 2015 Reporting Documents are made as of the date of this report, and should not be relied upon as representing management’s views as of any date subsequent to the date of this report. Except as required by applicable law, the Company undertakes no obligation to publicly update or otherwise revise any forward-looking statement, whether as a result of new information, future events, or otherwise.

CanWel Building Materials Group Ltd. | 2015 AnnuAL RepoRt
ManageMent’s Discussion anD analysis
2 3
The information in this report is as at March 2, 2016, unless otherwise indicated. All amounts are reported in Canadian dollars.
1. In the discussion, reference is made to EBITDA, which represents earnings from continuing operations before interest, provision for income taxes, depreciation and amortization, goodwill impairment loss and share-based compensation. This is not a generally accepted earnings measure under IFRS and does not have a standardized meaning under IFRS, and therefore the measure as calculated by the Company may not be comparable to similarly-titled measures reported by other companies. EBITDA is presented as we believe it is a useful indicator of a Company’s ability to meet debt service and capital expenditure requirements and because we interpret trends in EBITDA as an indicator of relative operating performance. EBITDA should not be considered by an investor as an alternative to net earnings or cash flows as determined in accordance with IFRS. For a reconciliation of EBITDA to the most directly comparable measures calculated in accordance with IFRS refer to “Reconciliation of Net Earnings (Loss) to Earnings before Interest, Tax, Depreciation and Amortization (EBITDA)”.
2. In the discussion, reference is made to Adjusted EBITDA, which is EBITDA as defined above, before certain non-recurring or
unusual items. This is not a generally accepted earnings measure under IFRS and does not have a standardized meaning under IFRS, The measure as calculated by the Company may not be comparable to similarly-titled measures reported by other companies. Adjusted EBITDA is presented as we believe it is a useful indicator of the Company’s ability to meet debt service and capital expenditure requirements from its regular business, before non-recurring items. Adjusted EBITDA should not be considered by an investor as an alternative to net earnings or cash flows as determined in accordance with IFRS. For a reconciliation from Adjusted EBITDA to the most directly comparable measures calculated in accordance with IFRS refer to “Reconciliation of Net Earnings to Earnings before Interest, Tax, Depreciation and Amortization (EBITDA)”.
3. Reference is also made to free cash flow of the Company. This is a non-IFRS measure generally used by Canadian companies as
an indicator of financial performance. The measure as calculated by the Company might not be comparable to similarly-titled measures reported by other companies. Management believes that this measure provides investors with an indication of the cash available for distribution to shareholders of the Company. We define free cash flow as cash flow from operating activities before changes in non-cash working capital and after maintenance of business capital expenditures.
Business Overview The Company is a leading wholesale distributor of building materials and home renovation products and provider of wood pressure treating services in Canada and the Western United States. The Company services the new home construction, home renovation and industrial markets by supplying the retail and wholesale lumber and building materials industry, hardware stores, industrial and furniture manufacturers and similar concerns.
Business Acquisition On July 2, 2015, the Company completed the acquisition of certain assets and liabilities of California Cascade Industries (now doing business as California Cascade Building Materials “CCBM”) (the “Acquisition”), a California-based building products distribution and treating business. The Acquisition is expected to provide the Company with substantive entry into the United States building products distribution and treating markets, and an incumbent position in California, currently one of the strongest economies and housing markets in the United States. The consideration transferred to the vendors was satisfied through:
a) US$30.0 million cash; and
b) The issuance of 3,224,087 common shares of the Company to the sellers of California Cascade Industries.
The foreign exchange rate used to translate cash purchase consideration and fair value of assets acquired and liabilities assumed was based on the exchange rate published by the Bank of Canada as at the date of the Acquisition.
The fair value of the common shares issued as consideration was determined with reference to the quoted price of shares of the Company as at the date of the Acquisition.
Further information regarding the purchase price allocation is contained in Note 7 of the 2015 Consolidated Financial Statements.
CanWel Building Materials Group Ltd. | 2015 AnnuAL RepoRt
ManageMent’s Discussion anD analysis
3
Private Placement Concurrent with the Acquisition, the Company completed a private placement of 8,050,000 subscription receipts at a price of $5 each, resulting in gross proceeds of $40.3 million. The private placement was pursuant to a bought deal underwritten by a syndicate of underwriters led by GMP Securities L.P., and including Raymond James Ltd., Canaccord Genuity Corp., Haywood Securities Inc., and Cormark Securities Inc. (the “Underwriters”). The Company also completed a non-brokered concurrent private placement of 2,385,000 subscription receipts to certain related parties for proceeds of $11.9 million, under the same terms. Upon the closing of the Acquisition, the subscription receipts issued were converted into a total of 10,435,000 common shares of the Company in accordance with their terms. Cash proceeds raised from these private placements, net of issuance costs, were used as consideration for the Acquisition (as described above), for reducing the Company’s revolving loan facility outstanding balance and for general corporate purposes.
Foreign Exchange Forward Contract In order to reduce exposure to fluctuations in the United States - Canada dollar exchange rate prior to the Acquisition, the Company entered into a foreign exchange contract to purchase US$30.0 million at an exchange rate of 1.2319. Upon the closing of the Acquisition, the purchased funds of US$30.0 million were used as partial consideration for the Acquisition.
Renewal of Revolving Loan Facility The Company’s revolving loan facility with Wells Fargo Capital Finance Corporation Canada was renewed on July 10, 2015. Pursuant to such amendment:
a) the maturity date was extended from January 31, 2018 to July 10, 2021; and
b) the facility was made available to CCBM.
Further information regarding the terms under the revolving loan facility is contained in Note 14 of the 2015 Consolidated Financial Statements.
Implementation of New Enterprise Resource Planning (“ERP”) System On June 23, 2015, the Company successfully completed the implementation of its new ERP system, including several new modules, replacing its legacy ERP system. With the implementation completed, management’s focus has shifted to continuing training, process optimization, and reporting improvements to add value, realize efficiencies and enhance visibility. Seasonality The Company’s sales are subject to seasonal variances that fluctuate in accordance with the normal home building season, particularly in the Canadian market. The Company generally experiences higher sales in the second and third quarters compared to the first and fourth quarters. This creates a timing difference between free cash flow earned and dividends paid. While the Company has leveled dividends to provide a regular income stream to shareholders over the course of a year, the second and third quarters have historically been the Company’s most profitable.
CanWel Building Materials Group Ltd. | 2015 AnnuAL RepoRt
ManageMent’s Discussion anD analysis
4 5
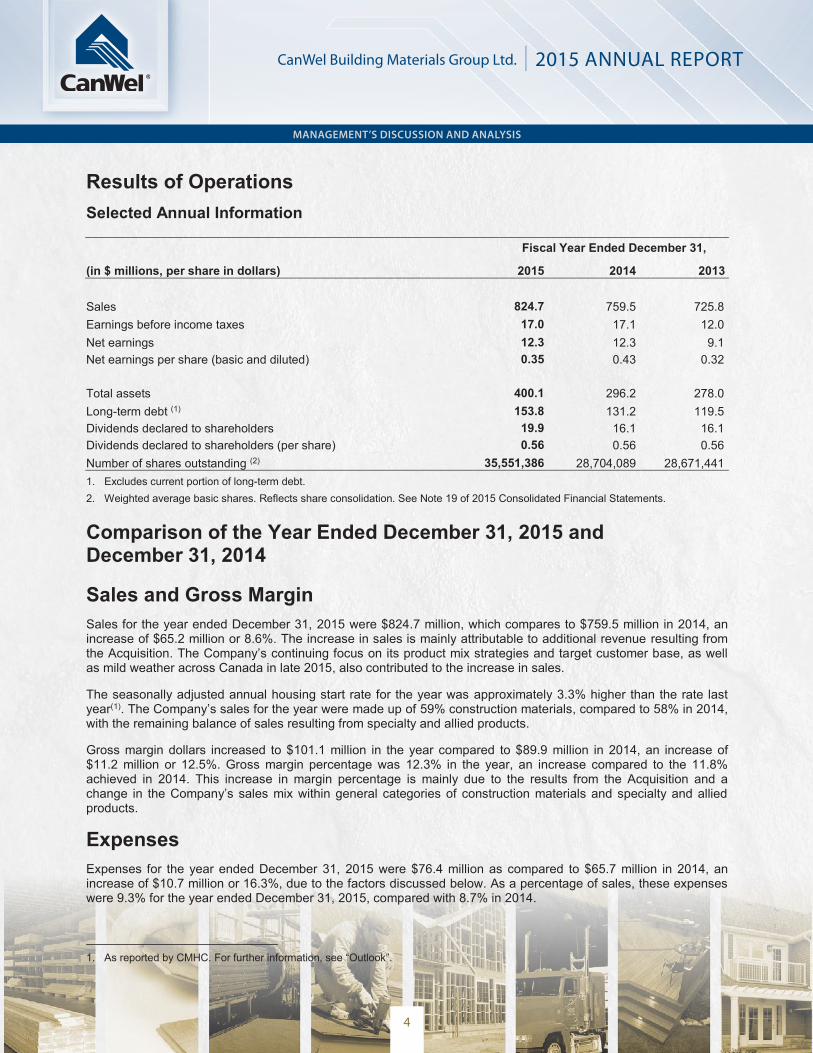
Results of Operations Selected Annual Information
Fiscal Year Ended December 31,
(in $ millions, per share in dollars) 2015 2014 2013
Sales 824.7 759.5 725.8 Earnings before income taxes 17.0 17.1 12.0 Net earnings 12.3 12.3 9.1 Net earnings per share (basic and diluted) 0.35 0.43 0.32
Total assets 400.1 296.2 278.0 Long-term debt (1) 153.8 131.2 119.5 Dividends declared to shareholders 19.9 16.1 16.1 Dividends declared to shareholders (per share) 0.56 0.56 0.56 Number of shares outstanding (2) 35,551,386 28,704,089 28,671,441 1. Excludes current portion of long-term debt. 2. Weighted average basic shares. Reflects share consolidation. See Note 19 of 2015 Consolidated Financial Statements.
Comparison of the Year Ended December 31, 2015 and December 31, 2014
Sales and Gross Margin Sales for the year ended December 31, 2015 were $824.7 million, which compares to $759.5 million in 2014, an increase of $65.2 million or 8.6%. The increase in sales is mainly attributable to additional revenue resulting from the Acquisition. The Company’s continuing focus on its product mix strategies and target customer base, as well as mild weather across Canada in late 2015, also contributed to the increase in sales.
The seasonally adjusted annual housing start rate for the year was approximately 3.3% higher than the rate last year(1). The Company’s sales for the year were made up of 59% construction materials, compared to 58% in 2014, with the remaining balance of sales resulting from specialty and allied products.
Gross margin dollars increased to $101.1 million in the year compared to $89.9 million in 2014, an increase of $11.2 million or 12.5%. Gross margin percentage was 12.3% in the year, an increase compared to the 11.8% achieved in 2014. This increase in margin percentage is mainly due to the results from the Acquisition and a change in the Company’s sales mix within general categories of construction materials and specialty and allied products.
Expenses Expenses for the year ended December 31, 2015 were $76.4 million as compared to $65.7 million in 2014, an increase of $10.7 million or 16.3%, due to the factors discussed below. As a percentage of sales, these expenses were 9.3% for the year ended December 31, 2015, compared with 8.7% in 2014.
1. As reported by CMHC. For further information, see “Outlook”.

CanWel Building Materials Group Ltd. | 2015 AnnuAL RepoRt
ManageMent’s Discussion anD analysis
5
Distribution, selling and administration expense increased by $8.0 million, or 13.1%, to $68.9 million from $60.9 million in 2014. The increase is mainly due to the results from the Acquisition. As a percentage of sales, these expenses were 8.4% in the year, compared to 8.0% in 2014.
Share-based compensation cost in 2015 was $79,000 compared to $70,000 in 2014. Depreciation and amortization expense increased by $2.7 million, or 57.4%, from $4.7 million in 2014 to $7.4 million in 2015, mainly due to the new ERP system, which was implemented and placed in use in June 2015, and the amortization and depreciation taken on intangible assets and property, plant and equipment as a result of the Acquisition.
Operating Earnings For the year ended December 31, 2015, operating earnings were $24.7 million compared to $24.2 million in 2014, an increase of $494,000 or 2.0%, due to the foregoing factors.
Finance Costs Finance costs for the year increased to $7.0 million from $6.7 million in 2014, an increase of $224,000 or 3.3%. Higher average borrowings on the Company’s revolving loan facility were partially offset by lower prime-rate based interest rates compared to 2014.
Acquisition Costs Directly attributable Acquisition related costs were $1.3 million compared to $nil in 2014.
Other Income (Loss) Other income for the year ended December 31, 2015 was $527,000, compared to a loss of $376,000 in 2014. Other income during 2015 included a realized gain on a foreign exchange forward contract, arranged in connection with the Acquisition.
Earnings before Income Taxes For the year ended December 31, 2015 earnings before income taxes were $17.0 million, compared to $17.1 million in 2014, a small decrease of $140,000 or 0.8%, due to the foregoing factors.
Provision for Income Taxes For the year, income tax expense was $4.7 million, compared to $4.8 million in 2014, a decrease of $119,000 or 2.5%. This amount is largely a function of earnings before income taxes for the year. Included in the provision, current income tax expense was $5.3 million, compared to $2.6 million in 2014. During 2014, the Company deducted all non-capital losses available for deduction during the year against its taxable income, and consequently began to accrue current income taxes.
Net Earnings Net earnings for the year ended December 31, 2015 were $12.3 million, consistent with 2014, due to the foregoing factors impacting the overall financial performance of the Company.
CanWel Building Materials Group Ltd. | 2015 AnnuAL RepoRt
ManageMent’s Discussion anD analysis
6 7
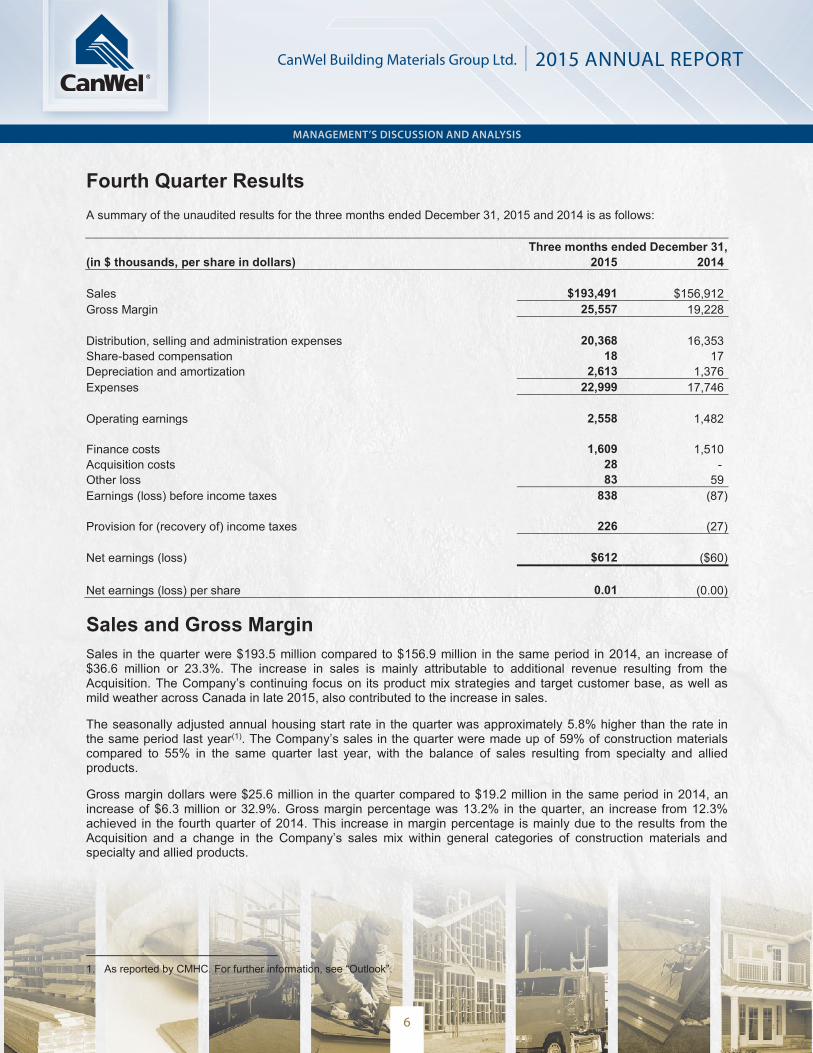
Fourth Quarter Results A summary of the unaudited results for the three months ended December 31, 2015 and 2014 is as follows:
Three months ended December 31, (in $ thousands, per share in dollars) 2015 2014 Sales $193,491 $156,912 Gross Margin 25,557 19,228 Distribution, selling and administration expenses 20,368 16,353 Share-based compensation 18 17 Depreciation and amortization 2,613 1,376 Expenses 22,999 17,746 Operating earnings 2,558 1,482 Finance costs 1,609 1,510 Acquisition costs 28 - Other loss 83 59 Earnings (loss) before income taxes 838 (87) Provision for (recovery of) income taxes 226 (27) Net earnings (loss) $612 ($60) Net earnings (loss) per share 0.01 (0.00) Sales and Gross Margin
Sales in the quarter were $193.5 million compared to $156.9 million in the same period in 2014, an increase of $36.6 million or 23.3%. The increase in sales is mainly attributable to additional revenue resulting from the Acquisition. The Company’s continuing focus on its product mix strategies and target customer base, as well as mild weather across Canada in late 2015, also contributed to the increase in sales.
The seasonally adjusted annual housing start rate in the quarter was approximately 5.8% higher than the rate in the same period last year(1). The Company’s sales in the quarter were made up of 59% of construction materials compared to 55% in the same quarter last year, with the balance of sales resulting from specialty and allied products.
Gross margin dollars were $25.6 million in the quarter compared to $19.2 million in the same period in 2014, an increase of $6.3 million or 32.9%. Gross margin percentage was 13.2% in the quarter, an increase from 12.3% achieved in the fourth quarter of 2014. This increase in margin percentage is mainly due to the results from the Acquisition and a change in the Company’s sales mix within general categories of construction materials and specialty and allied products.
1. As reported by CMHC. For further information, see “Outlook”.

CanWel Building Materials Group Ltd. | 2015 AnnuAL RepoRt
ManageMent’s Discussion anD analysis
7
Expenses Expenses for the fourth quarter were $23.0 million as compared to $17.7 million for the same period in 2014, an increase of $5.3 million or 29.6%, due to the factors discussed below.
Distribution, selling and administration expenses increased by $4.0 million, or 24.6%, to $20.4 million from $16.4 million in the same period in 2014. The increase is mainly due to the results from the Acquisition. As a percentage of sales, these expenses were 10.5% in the quarter, compared to 10.4% in the same quarter in 2014.
Share-based compensation cost in the fourth quarter of 2015 was $18,000, compared to $17,000 in the same period in 2014. Depreciation and amortization expense was $2.6 million, compared to $1.4 million in the same period in 2014, an increase of $1.2 million or 89.9%, mainly due to the new ERP system, which was implemented and placed in use in June 2015, and the amortization and depreciation taken on intangible assets and property, plant and equipment as a result of the Acquisition.
Operating Earnings For the fourth quarter of 2015, operating earnings were $2.6 million compared to $1.5 million for the same period in 2014, an increase of $1.1 million or 72.6%, due to the foregoing factors.
Finance Costs Finance costs for the quarter increased to $1.6 million from $1.5 million in 2014, an increase of $99,000 or 6.6%. Higher average borrowings on the Company’s revolving loan facility were largely offset by lower prime-rate based interest rates compared to the same quarter in 2014.
Earnings (Loss) before Income Taxes For the fourth quarter of 2015, earnings before income taxes were $838,000, compared to a loss of $87,000 in the same period in 2014, an increase in earnings of $925,000, due to the foregoing factors.
Provision for (Recovery of) Income Taxes For the fourth quarter of 2015, the provision for income taxes was $226,000 compared to a recovery of $27,000 in the same quarter of 2014. This amount is a function of earnings before income taxes.
Net Earnings (Loss) Net earnings for the fourth quarter were $612,000, compared to a loss of $60,000 in the fourth quarter of 2014, an increase in net earnings of $672,000, due to the foregoing factors impacting the overall financial performance of the Company.

CanWel Building Materials Group Ltd. | 2015 AnnuAL RepoRt
ManageMent’s Discussion anD analysis
8 9
Summary of Quarterly Results For the Quarters ended:
2015 2014 ($ millions, per share in dollars) 31 - Dec 30 - Sep 30 - Jun 31 - Mar 31 - Dec 30 - Sep 30 - Jun 31 - Mar Sales 193.5 247.4 224.5 159.4 156.9 227.0 225.9 149.6 EBITDA 5.1 12.6 12.2 1.5 2.8 12.0 12.6 1.2 Adjusted EBITDA (1) 5.1 13.9 12.2 1.5 2.8 12.0 12.6 1.2 Earnings (loss) before income taxes 0.8 8.9 8.8 (1.6) (0.1) 9.2 9.6 (1.6) Net earnings (loss) 0.6 6.7 6.2 (1.2) (0.1) 6.7 6.9 (1.1) Net earnings (loss) per share (2) (3) 0.01 0.16 0.21 (0.04) (0.00) 0.23 0.24 (0.04) Dividends declared per share (3) 0.14 0.14 0.14 0.14 0.14 0.14 0.14 0.14
1. Adjusted EBITDA refers to EBITDA before directly attributable Acquisition related costs. 2. Weighted average basic shares outstanding in period. 3. Effective May 16, 2014 the Company consolidated its common shares on a basis of one new common share in exchange for every
two common shares previously outstanding. Per share amounts have been restated to retroactively reflect this consolidation. The Company operates in a seasonal industry that fluctuates in accordance with the normal home building season. It generally experiences higher sales in the second and third quarters compared to sales in the first and fourth quarters.
EBITDA and Adjusted EBITDA EBITDA and Adjusted EBITDA for the three months ended December 31, 2015 was $5.1 million compared to $2.8 million in the same quarter of 2014, an increase of $2.3 million or 79.9%. The increase in EBITDA and Adjusted EBITDA relates primarily to the results from the Acquisition, as well as the aforementioned improvements in the quarter.
EBITDA for the year ended December 31, 2015 was $31.4 million compared to $28.7 million in 2014, an increase of $2.7 million or 9.4%. EBITDA for 2015 was impacted by one-time directly attributable Acquisition related costs of $1.3 million. Adjusted EBITDA before these one-time expenses was $32.7 million, an increase of $4.0 million or 14.0% compared to the same period in 2014. The increase in Adjusted EBITDA relates primarily to the results of the Acquisition for the six month period commencing July 2, 2015.
CanWel Building Materials Group Ltd. | 2015 AnnuAL RepoRt
ManageMent’s Discussion anD analysis
9
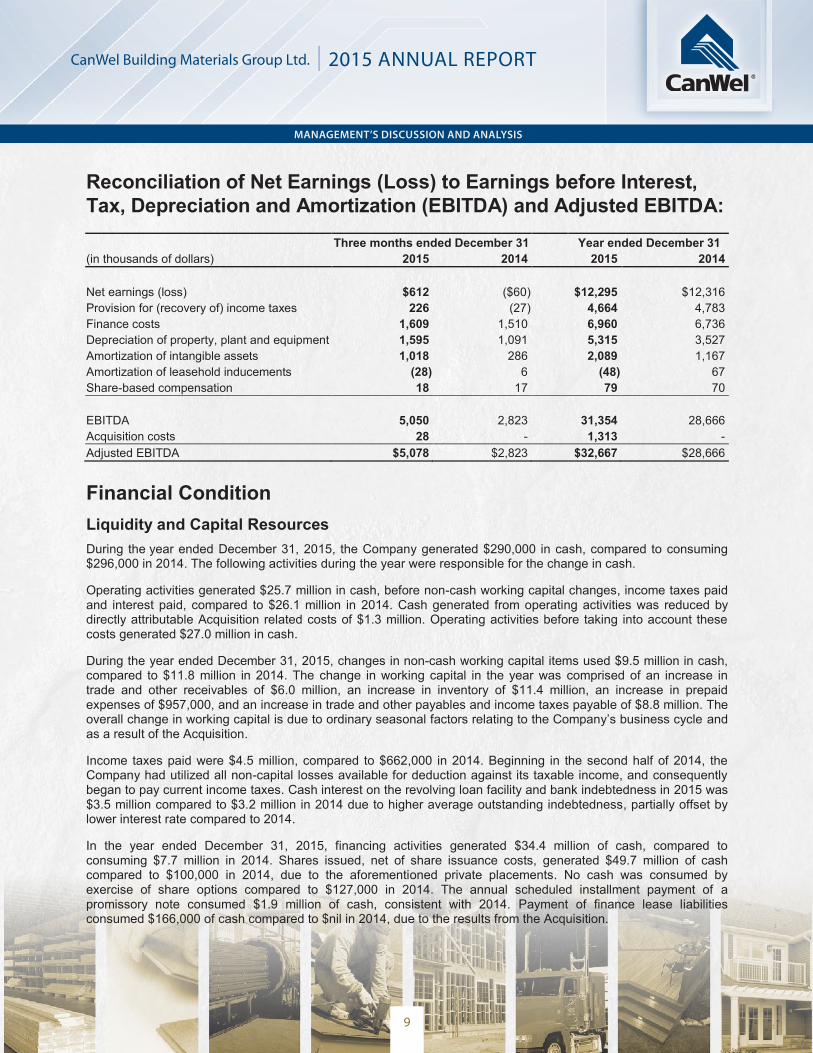
Reconciliation of Net Earnings (Loss) to Earnings before Interest, Tax, Depreciation and Amortization (EBITDA) and Adjusted EBITDA: Three months ended December 31 Year ended December 31 (in thousands of dollars) 2015 2014 2015 2014 Net earnings (loss) $612 ($60) $12,295 $12,316 Provision for (recovery of) income taxes 226 (27) 4,664 4,783 Finance costs 1,609 1,510 6,960 6,736 Depreciation of property, plant and equipment 1,595 1,091 5,315 3,527 Amortization of intangible assets 1,018 286 2,089 1,167 Amortization of leasehold inducements (28) 6 (48) 67 Share-based compensation 18 17 79 70 EBITDA 5,050 2,823 31,354 28,666 Acquisition costs 28 - 1,313 - Adjusted EBITDA $5,078 $2,823 $32,667 $28,666
Financial Condition Liquidity and Capital Resources During the year ended December 31, 2015, the Company generated $290,000 in cash, compared to consuming $296,000 in 2014. The following activities during the year were responsible for the change in cash.
Operating activities generated $25.7 million in cash, before non-cash working capital changes, income taxes paid and interest paid, compared to $26.1 million in 2014. Cash generated from operating activities was reduced by directly attributable Acquisition related costs of $1.3 million. Operating activities before taking into account these costs generated $27.0 million in cash.
During the year ended December 31, 2015, changes in non-cash working capital items used $9.5 million in cash, compared to $11.8 million in 2014. The change in working capital in the year was comprised of an increase in trade and other receivables of $6.0 million, an increase in inventory of $11.4 million, an increase in prepaid expenses of $957,000, and an increase in trade and other payables and income taxes payable of $8.8 million. The overall change in working capital is due to ordinary seasonal factors relating to the Company’s business cycle and as a result of the Acquisition.
Income taxes paid were $4.5 million, compared to $662,000 in 2014. Beginning in the second half of 2014, the Company had utilized all non-capital losses available for deduction against its taxable income, and consequently began to pay current income taxes. Cash interest on the revolving loan facility and bank indebtedness in 2015 was $3.5 million compared to $3.2 million in 2014 due to higher average outstanding indebtedness, partially offset by lower interest rate compared to 2014.
In the year ended December 31, 2015, financing activities generated $34.4 million of cash, compared to consuming $7.7 million in 2014. Shares issued, net of share issuance costs, generated $49.7 million of cash compared to $100,000 in 2014, due to the aforementioned private placements. No cash was consumed by exercise of share options compared to $127,000 in 2014. The annual scheduled installment payment of a promissory note consumed $1.9 million of cash, consistent with 2014. Payment of finance lease liabilities consumed $166,000 of cash compared to $nil in 2014, due to the results from the Acquisition.

CanWel Building Materials Group Ltd. | 2015 AnnuAL RepoRt
ManageMent’s Discussion anD analysis
10 11
Dividends paid to shareholders amounted to $18.0 million, compared to $16.1 million in 2014. The increase in dividends paid was due to the aforementioned private placements resulting in a higher weighted average number of shares. Interest paid on convertible debentures in 2015 was $2.6 million, consistent with 2014. Financing costs on borrowings consumed $987,000, compared to $nil in 2014, relating to the aforementioned renewal of the revolving loan facility. The revolving loan facility increased by $8.3 million, compared to $12.9 million in 2014.
The Company’s revolving loan facility was renewed on July 10, 2015, as discussed above. Under the facility, up to $275.0 million, with an additional $50.0 million accordion facility, may be borrowed for operating requirements in Canadian and US currency. The Company was not in breach of any of its covenants during the year ended December 31, 2015.
Investing activities in the year consumed $42.4 million of cash for capital expenditures, compared to $2.9 million in 2014, the increase being a result of the Acquisition and the implementation of the new ERP system.
The Company’s cash flow from operations and credit facilities are expected to be sufficient to meet operating requirements, debenture interest, capital expenditures and anticipated dividends. The Company’s lease obligations require monthly installments and these payments are all current.
Total Assets Total assets of the Company were $400.1 million at December 31, 2015, versus $296.2 million at December 31, 2014, an increase of $103.9 million. Current assets increased by $51.1 million, mainly due to the additional receivables and inventory as a result of the Acquisition. In addition, increased sales activity in December 2015 compared to December 2014 due to this year’s mild weather conditions across Canada resulted in higher receivables and inventory levels as at December 31, 2015. Property, plant and equipment increased by $6.0 million, intangible assets increased by $16.9 million and goodwill increased by $29.5 million due to the Acquisition.
Total Liabilities Total liabilities were $231.2 million at December 31, 2015, versus $194.8 million at December 31, 2014, an increase of $36.4 million. This increase was mainly due to an increase in current liabilities of $13.5 million, primarily as a result of additional trade and other payables from the Acquisition, and an increase in the revolving loan facility of $22.9 million in order to finance the working capital requirements commensurate with the business activities of the Company.
Outstanding Share Data As at March 2, 2016, there were 42,440,941 Common Shares issued and outstanding.
Effective May 16, 2014, the Company consolidated its common shares on a basis of one new common share in exchange for every two common shares previously outstanding. All common shares and per common share amounts pre-dating this share consolidation have been restated to retroactively reflect this consolidation.
Dividends During the year ended December 31, 2015, the Company declared quarterly dividends to shareholders of $0.14 per share, resulting in aggregate dividends of $19.9 million. A dividend was declared on December 15, 2015, to shareholders of record on December 31, 2015, and was paid on January 15, 2016.
Record date
Amount $
Per share $
March 31, 2015 4,022 0.14 June 30, 2015 4,024 0.14 September 30, 2015 5,936 0.14 December 31, 2015 5,938 0.14
19,920 0.56
CanWel Building Materials Group Ltd. | 2015 AnnuAL RepoRt
ManageMent’s Discussion anD analysis
11
Dividend Policy The Board of Directors reviews the Company’s dividend policy periodically in the context of the Company’s overall profitability, free cash flow, capital requirements and other business needs.
Looking forward (see Forward-Looking Statements), the Company is continually assessing its dividend policy based on the considerations outlined above as well as other possible factors that may become relevant in the future and, accordingly, there can be no assurance that the current quarterly dividend of $0.14 per share will be maintained. Furthermore, the Company may not use future growth in its profitability or free cash flow, if any, to increase its dividend in the near or medium term, but may focus on reducing the ratio of its dividends paid to its net earnings or free cash flow and using any additional cash to pay down debt, fund business acquisitions, capital projects or other uses as determined by the board of directors.
Hedging The Company undertakes sale and purchase transactions in foreign currency as part of its Canadian operations and therefore, is subject to gains and losses due to fluctuations in foreign exchange rates.
The Company at times uses derivative financial instruments for economic hedging purposes in managing lumber price risk and foreign currency risk through the use of futures contracts and options. These derivative financial instruments are designated as held for trading with changes in fair value being recorded in Other income (loss) in Net earnings.
When held by the Company, these derivative instruments are traded through a well-established financial services firm with a long history of providing trading, exchange and clearing services for commodities and currencies. As trading activities are closely monitored by senior management, the risk of credit loss on these financial instruments is considered low.
At December 31, 2015 the Company had no outstanding lumber futures contracts and no lumber options. A small gain of $3,000 was recognized during 2015, compared to a loss of $19,000 in 2014.
During the year ended December 31, 2015 the Company entered into a foreign exchange contract to purchase US$30.0 million at an exchange rate of 1.2319, which was used as partial consideration for the Acquisition. A realized gain of $805,000 was recognized on this contract and was recorded in Other income.
Related Party Transactions The Company has transactions with related parties in the normal course of operations at agreed amounts between the related parties.
Certain distribution facilities used by the Company to store and process inventory are leased from a company in which Amar Doman, a director and officer, and Rob Doman, an officer of the Company, have a minority interest and the land and buildings of certain of the treatment plants are leased from entities solely controlled by Amar Doman. All lease rates were market tested in advance of the signing of the lease agreements and were determined to be at market rates. Lease payments to such related parties were $3.1 million in the year ended December 31, 2015, compared to $3.0 million in 2014. The minimum payments under the terms of these leases are as follows: $3.2 million in 2016, $3.2 million in 2017, $3.2 million in 2018, $2.9 million in 2019, $1.5 million in 2020 and $1.9 million thereafter.
CanWel Building Materials Group Ltd. | 2015 AnnuAL RepoRt
ManageMent’s Discussion anD analysis
12 13
During the year ended December 31, 2015, the Company was charged professional fees in relation to regulatory, corporate finance and compliance consulting services of $633,000 (2014 - $595,000) by a company owned by Rob Doman. As at December 31, 2015, payables to this related party were $132,000 (2014 - $187,000). Additionally, fees of $1.1 million (2014 - $955,000) were paid for services related to strategic and financial advice to a company solely controlled by Amar Doman. As at December 31, 2015, payables to this related party were $54,000 (2014 - $76,000).
During the year the Company purchased $3.2 million (2014 - $3.1 million) of product from a public company in which Amar Doman has an ownership interest and is also a director and officer. These purchases are in the normal course of operations and are recorded at exchange amounts. As at December 31, 2015, payables to this related party were $33,000 (2014 - $124,000).
During the year the Company sold $47,000 (2014 - $45,000) of product to a company controlled by Siegfried Thoma, a director of the Company. These sales were made in the normal course of operations and are recorded at exchange amounts.
As at December 31, 2015, subscriptions received from certain insiders of the Company for proceeds of $11.9 million (2014 - $nil), as discussed above, including $3.0 million in subscription receipts from Amar Doman, and $635,000 from several members of key management personnel, directors and officers of the Company. The balance of subscriptions were received from other non-management insiders.
As at December 31, 2015, other receivables from Amar Doman in respect of advances for expenses totaled $nil (2014 - $8,000).
Additional information regarding these related party transactions is contained in Note 24 of the 2015 Consolidated Financial Statements.
In addition to the aforementioned related party transactions, certain subsidiaries of the Company have entered into leases for distribution and treating facilities with entities affiliated with individuals who are directors and officers of such subsidiaries, in connection with the Acquisition. During the year ended December 31, 2015, such lease payments totaled $495,000 (2014 - $nil).
Commitments and Contingencies Future and Contractual Obligations In addition to its revolving loan facility, convertible debentures, promissory note and finance leases covering certain transportation equipment, the Company has operating lease commitments for the rental of most of its distribution centres and treatment plant properties in Canada and the United States, and for vehicles, warehouse equipment, and a computer hosting contract.

CanWel Building Materials Group Ltd. | 2015 AnnuAL RepoRt
ManageMent’s Discussion anD analysis
13
The following table shows, as at December 31, 2015, the Company’s contractual obligations within the periods indicated: Contractual Obligations (in thousands of dollars) Total 2016 2017-2018 2019-2020 Thereafter Revolving loan facility(1) $124,113 $ 3,247 $ 6,495 $ 6,495 $107,876 Convertible debentures(2) 47,523 2,556 44,967 - - Promissory note(3) 6,698 1,900 4,798 - - Finance leases(4) 1,259 365 702 192 - Operating leases(4) 75,508 13,749 24,681 18,022 19,056 Total contractual obligations $255,101 $21,817 $81,643 $24,709 $126,932
1. Interest has been calculated based on the average borrowing under the facility for the year ended December 31, 2015 utilizing the interest rate payable under the terms of the facility at December 31, 2015. This facility matures on July 10, 2021.
2. Under the indenture governing its convertible debentures the Company is required to make semi-annual interest payments at a rate of 5.85% on October 31 and April 30. The debentures mature on April 30, 2017.
3. Annual principal payments are $1.9 million on July 2, with simple interest payable as a lump sum on the maturity date. The promissory note matures on July 2, 2018.
4. Additional information is contained in Note 25 of the 2015 Consolidated Financial Statements.
Claims During the normal course of business, certain product liability and other claims have been brought against the Company and, where applicable, its suppliers. While there is inherent difficulty in predicting the outcome of such matters, management has vigorously contested the validity of these claims, where applicable, and, based on current knowledge, believes that they are without merit and does not expect that the outcome of any of these matters, in consideration of insurance coverage maintained, or the nature of the claims, individually or in the aggregate, would have a material adverse effect on the consolidated financial position, results of operations or future earnings of the Company.
Guarantees The Company has issued letters of credit totaling $1.6 million (2014 - $1.5 million) in respect of historical obligations, pre-dating 1999, for a non-registered executive pension plan for former executives.
Significant Accounting Judgments and Estimates The preparation of these financial statements requires management to make judgments and estimates and form assumptions that affect the reported amounts of assets and liabilities at the date of the financial statements and reported amounts of revenues and expenses during the reporting period. On an ongoing basis, management evaluates its judgments and estimates in relation to assets, liabilities, revenue and expenses. Management uses historical experience and various other factors it believes to be reasonable under the given circumstances as the basis for its judgments and estimates. Actual outcomes may differ from these estimates under different assumptions and conditions. Significant areas requiring estimates are goodwill and related impairment testing, inventory valuation and obsolescence, deferred tax assets and liabilities valuation, recoverability of trade and other receivables, certain actuarial and economic assumptions used in the determination for the cost and accrued benefit obligations of employee future benefits, classification of lease agreements and judgments regarding aggregation of reportable segments.
CanWel Building Materials Group Ltd. | 2015 AnnuAL RepoRt
ManageMent’s Discussion anD analysis
14 15
Goodwill Management uses judgment in determining the fair value of the acquired net identifiable tangible and intangible assets at the date of a business combination. Any resulting goodwill is an asset representing the future economic benefits arising from other assets acquired in a business combination that are not individually identified and separately recognized. Goodwill at December 31, 2015 relates to the Company’s acquisitions of various businesses. Goodwill is not amortized, but is tested for impairment annually or more frequently if changes in circumstances indicate a potential impairment. Goodwill impairment is assessed based on a comparison of the fair value of a cash-generating unit to the underlying carrying value of that cash-generating unit’s net assets, including goodwill. Significant estimates are required in determining the fair value of each cash-generating unit, including a discount rate, a growth rate and revenue projections. When the carrying amount of the cash-generating unit exceeds its fair value, the fair value of goodwill related to the cash-generating unit is reduced by the excess of this carrying value and recognized as an impairment loss.
Employee Future Benefits The cost of defined benefit pension plans and other post-employment medical benefits and the present value of the pension obligation are determined using actuarial valuations. An actuarial valuation involves making various assumptions that may differ from actual developments in the future.
Discount rate
The present value of the defined benefit obligation is determined by discounting the estimated future cash outflows using interest rates of high-quality corporate bonds that are denominated in the currency in which the benefits will be paid and that have maturity profiles that are similar to the underlying cash flows of the defined benefit obligation.
Other assumptions
The mortality rate is based on publicly available mortality tables. Future salary increases are based on expected future inflation rates.
Inventory Valuation Under IFRS, inventories must be recognized at the lower of cost or their Net Realizable Value (“NRV”), which is the estimated selling price in the ordinary course of business less the estimated costs of completion and estimated costs necessary to make the sale. IFRS requires that the estimated NRV be based on the most reliable evidence available at the time the estimates are made of the amounts that inventories are expected to realize. The measurement of an inventory write-down to NRV is based on the Company’s best estimate of the NRV and of the Company’s expected future sale or consumption of the Company’s inventories. Due to the economic environment and continued volatility in the homebuilding market, there is uncertainty as to whether the NRV of the inventories will remain consistent with those used in the Company’s assessment of NRV at period end. As a result there is the risk that a write-down of on hand and unconsumed inventories could occur in future periods. Also, a certain portion of inventory may become damaged or obsolete. A slow moving reserve is recorded, as required, based on an analysis of the length of time product has been in inventory and historical rates of damage and obsolescence.
Allowance for Doubtful Accounts It is possible that certain trade receivables may become uncollectible, and as such an allowance for these doubtful accounts is maintained. The allowance is based on the estimated recovery of trade receivables and incorporates current and expected collection trends. These estimates will change, as necessary, to reflect market or specific industry risks, as well as known or expected changes in the customers’ financial position.

CanWel Building Materials Group Ltd. | 2015 AnnuAL RepoRt
ManageMent’s Discussion anD analysis
15
Income Taxes At each balance sheet date, a deferred income tax asset may be recognized for all tax deductible temporary differences, unused tax losses and income tax reductions, to the extent that their realization is probable. The determination of this requires significant judgment. This evaluation includes review of the ability to carry-back operating losses to offset taxes paid in prior years; the carry-forward periods of the losses; and an assessment of the excess of fair value over the tax basis of the Company’s net assets. If based on this review, it is not probable such assets will be realized then no deferred income tax asset is recognized.
Management believes the estimates utilized in preparing its financial statements are reasonable and prudent. Actual results may differ from these estimates.
Leases When assessing the classification of a lease agreement between finance and operating, certain estimates and assumptions need to be made and applied, which include, but are not limited to, the determination of the expected lease term and minimum lease payments, the assessment of the likelihood of exercising options and estimation of the fair value of the lease property.
Segment Reporting Operating segments are reported in a manner consistent with the internal reporting provided to the chief operating decision maker. The chief operating decision maker, who is responsible for allocating resources and assessing performance of operations, has been identified as the Chief Executive Officer. The Company is managed as one operating segment based on how financial information is produced internally for the purposes of making operating decisions.
Changes in Accounting Policies The Company has retrospectively adopted amendments to IFRS 2, Share-based Payment, IFRS 3, Business Combinations, IFRS 8, Operating Segments, IAS 19, Employee Benefits, and IAS 24, Related Party Disclosures effective January 1, 2015, in accordance with the applicable transactional provisions.
IFRS 2 amendments clarify the definition of share-based payment vesting conditions. IFRS 3 amendments address accounting for contingent consideration in business combinations. IFRS 8 addresses additional disclosure requirements for the aggregation of operating segments and clarifies the recognition of total reportable segments’ assets to the entity’s assets. IAS 19 provides additional guidance on contributions from employees in respect of defined benefit plans. IAS 24 amends the definition of a related party, with additional disclosures required when key management personnel services are provided by a management entity.
The adoption of these amendments did not result in any adjustments.
New Accounting Pronouncements Issued but not yet Applied The International Accounting Standards Board (“IASB”) periodically issues new standards and amendments or interpretations to existing standards. The new pronouncements listed below are those that we consider the most significant. They are not intended to be a complete list of new pronouncements that may affect the Company’s financial statements.

CanWel Building Materials Group Ltd. | 2015 AnnuAL RepoRt
ManageMent’s Discussion anD analysis
16 17
IFRS 9 – Financial Instruments IFRS 9 introduces new requirements for the classification and measurement of financial assets. IFRS 9 requires all recognized financial assets that are within the scope of IAS 39, Financial Instruments: Recognition and Measurement, to be subsequently measured at amortized cost or fair value. Specifically, financial assets that are held with a business model whose objective is to collect the contractual cash flows, and that have contractual cash flows that are solely payment of principal and interest on the principal outstanding, are generally measured at amortized cost at the end of subsequent accounting periods. All other financial assets including equity investments are measured at their fair values at the end of subsequent accounting periods.
Requirements for classification and measurement of financial liabilities were added in October 2010 and they largely carried forward existing requirements in IAS 39, except that fair value changes due to credit risk for liabilities designated at fair value through profit and loss would generally be recorded in other comprehensive income.
The IASB issued a new impairment model for financial assets based on expected credit losses in July 2015. The new standard requires entities to account for expected credit losses from when financial instruments are first recognized and it lowers the threshold for recognition of full lifetime expected losses.
IFRS 9 is effective for annual periods beginning on or after January 1, 2018, with earlier application permitted. The Company will not adopt this standard before the effective date. The Company will continue to evaluate the impact of this standard on its audited annual consolidated financial statements.
IFRS 15 – Revenue from Contracts with Customers In May 2015, the IASB issued IFRS 15, Revenue from Contracts with Customers, which is a replacement of IAS 18, Revenue, IAS 11, Construction Contracts, and related interpretations. IFRS 15 provides a single, principles-based five-step model that will apply to all contracts with customers with limited exceptions. In addition to the five-step model, the standard specifies how to account for the incremental costs of obtaining a contract and the costs directly related to fulfilling a contract. The incremental costs of obtaining a contract must be recognized as an asset if the entity expects to recover these costs. IFRS 15 requirements will also apply to the recognition and measurement of gains and losses on the sale of some non-financial assets that are not an output of the entity’s ordinary activities.
IFRS 15 will be applied to fiscal years beginning on or after January 1, 2018. Earlier application is permitted. The Company will not adopt this standard before the effective date. The Company will continue to evaluate the impact of this standard on its audited annual consolidated financial statements.
IFRS 16 - Leases In January 2016, the IASB issued IFRS 16, Leases, replacing IAS 17, Leases, and related interpretations. IFRS 16 sets out principles of recognition, measurement, presentation and disclosure of leases for both parties to a contract, the lessee and the lessor.
IFRS 16 will be applied to fiscal years beginning on or after January 1, 2019. Earlier application is permitted. The Company will not adopt this standard before the effective date. The Company will continue to evaluate the impact of this standard on its audited annual consolidated financial statements.
Amendments to Other Standards In addition, there have been amendments to existing standards under IAS 16, Property, Plant and Equipment, and IAS 38, Intangible Assets, which clarify acceptable methods of depreciation and amortization, prohibiting the use of revenue based depreciation.
These amendments are effective for fiscal years beginning on or after January 1, 2016, with earlier application permitted. The Company will not adopt any of these standards before their effective dates. The Company will continue to evaluate the impact of these standards on its audited annual consolidated financial statements.

CanWel Building Materials Group Ltd. | 2015 AnnuAL RepoRt
ManageMent’s Discussion anD analysis
17
Disclosure Controls and Internal Controls over Financial Reporting Disclosure Controls and Procedures Disclosure controls and procedures are controls and other procedures that are designed to: (a) provide reasonable assurance that material information required to be disclosed by us is accumulated and communicated to management to allow timely decisions regarding required disclosure; and (b) ensure that information required to be disclosed by us is recorded, processed, summarized, and reported within the time periods specified in applicable securities legislation. The Company’s management, with the participation of the Chief Executive Officer and the Chief Financial Officer, has evaluated the effectiveness of the Company’s disclosure controls and procedures as of December 31, 2015. Based upon this evaluation, the Chief Executive Officer and Chief Financial Officer have concluded that these disclosure controls and procedures, as defined by National Instrument 52-109, Certification of Disclosure in the Issuer’s Annual and Interim Filings, with the exception of the following limitation of scope, are effective for the purposes set out above.
Limitations on Scope of Design The scope of design over disclosure controls and internal controls over financial reporting has been limited to exclude control, policies and procedures of CCBM, which was acquired effective July 2, 2015. The summary financial information of CCBM is presented below.
(in thousands of dollars) 2015 Revenue 56,641 Net earnings 1,711 (in thousands of dollars) 2015 Current assets 28,733 Non-current assets 49,968 Current liabilities 6,632 Non-current liabilities 8,968 The scope limitation is in accordance with section 3.3(1)(b) of National Instrument 52-109, which allows an issuer to limit the design of disclosure and control procedures and internal control over financial reporting to exclude controls, policies and procedures of a business that the issuer acquired not more than 365 days prior to December 31, 2015, the end of fiscal period.
Internal Control over Financial Reporting Management is responsible for designing, establishing and maintaining an adequate system of internal control over financial reporting. The Company’s internal control system was designed to provide reasonable assurance regarding the reliability of financial reporting and the preparation of financial statements for external purposes, in accordance with IFRS.
Management, with the participation of the Chief Executive Officer and the Chief Financial Officer, has conducted an evaluation of the effectiveness of the Company’s internal control over financial reporting as of December 31, 2015 based on the provisions of Internal Control – Integrated Framework issued by the Committee of Sponsoring Organizations of the Treadway Commission (“COSO”). Based on that evaluation, management concluded that its internal control over financial reporting, as defined by National Instrument 52-109, with the exception of the aforementioned limitation of scope, is effective and provides reasonable assurance regarding the reliability of financial reporting and the preparation of financial statements in accordance with IFRS.

CanWel Building Materials Group Ltd. | 2015 AnnuAL RepoRt
ManageMent’s Discussion anD analysis
18 19
Changes in Internal Control over Financial Reporting During 2015, the Company successfully completed the implementation of its new ERP system, including general ledger, sales distribution, supply chain and transportation modules, replacing its legacy ERP system. As a result of the new ERP system, the Company reviewed policies and procedures materially impacted by the new ERP implementation, resulting in improvements in the design of system access rights, therefore increasing the Company’s ability to rely on automated controls.
There were no other material changes in design of the Company’s internal controls over financial reporting for the quarter and year ended December 31, 2015 that have affected, or are reasonably likely to affect, the Company’s internal control over financial reporting.
Risks and Uncertainties The Company is subject to normal business risks associated with similar firms operating within the building materials industry in Canada, which are described in greater detail in the Company’s AIF dated March 25, 2015, and the Company’s public filings on www.sedar.com, which the reader is encouraged to review, and which are, or may be, updated from time to time, after the date therein. Outlook The Canadian economy is expected to grow by 1.4% in 2016 and 2.4% in 2017, according to the most recent estimates published by the Bank of Canada (“BoC”). This is down from previous forecasts of 2.0% growth in 2016 and 2.5% growth in 2017. The BoC, continues to express concern over high levels of consumer debt in Canada, and the potential negative impact that could have on the housing market, when interest rates eventually begin to rise. The Company’s focus in the near term remains to improve sales with its target customer base while continuing to optimize gross margins and maintain tight controls over expenses. The Company is committed to enhancing its offering of specialty and allied products to the Canadian and Unites States markets. Management’s focus on cash flow, primarily consisting of the management of inventory and trade receivables, remains paramount.
According to the Canada Mortgage and Housing Corporation (the “CMHC”), the seasonally adjusted annualized rate for Canadian housing starts was 195,535 in 2015, compared to 189,329 in 2014. CMHC forecasts similar housing starts for the year 2016, in the range from 153,000 units to 203,000 units. The Canadian Real Estate Association reports 506,000 existing homes changed hands in Canada in 2015, and further reports an expected decrease to 498,600 in 2016. The results of the 2015 Federal Election, changes to investor-class immigration programs in the 2014 Federal Budget, the 2016 Federal Budget (yet to be released), foreign exchange fluctuations and overall affordability issues, as well as recent legislative policy changes to address these issues, may affect the housing market, although any potential impact is not predictable.
The BoC has expressed concerns about the potential impact of a decrease in petroleum and related commodity prices on the Canadian economy, and consequently lowered its key interest rate during the first quarter of 2015, and again in July 2015. The BoC’s more sober outlook on the Canadian economy could delay eventual interest rate hikes, just as the US Federal Reserve initiated interest rate increases in December 2015. The resulting decrease in the value of the Canadian dollar and decreased economic activity could potentially negatively impact the Company’s operations in Canada and accordingly its overall financial performance.
CanWel Building Materials Group Ltd. | 2015 AnnuAL RepoRt
ManageMent’s Discussion anD analysis
19
According to the US Census Bureau, US housing starts have been growing steadily over the past four years, reaching 1,111,200 units in 2015, and, according to the Federal Home Mortgage Corporation (Freddie Mac) Economic & Housing Research Group, are estimated to continue the current trend and reach 1,310,000 units in 2016. Housing construction in the US remains subdued by historical standards even though other indications suggest the housing market is strong.
Management will continue to keep a close eye on the Company’s customers and continue to carefully manage the Company’s costs in line with their activity so that the Company can be appropriately positioned to participate in an economic recovery and be ready to work hard to translate revenue gains into higher earnings.
DirectorsIan M. Baskerville Toronto, Ontario
Amar S. Doman West Vancouver, British Columbia
Tom Donaldson Saint John, New Brunswick
Kelvin Dushnisky Toronto, Ontario
Sam Fleiser Toronto, Ontario
Jacob Kotzubei Los Angeles, California
Stephen W. Marshall Vancouver, British Columbia
Martin R. Melone Los Angeles, California
Marc Seguin Vancouver, British Columbia
Siegfried J. Thoma Portland, Oregon
AuditorsErnst & Young LLP Vancouver, British Columbia
SolicitorsGoodmans LLP Toronto, Ontario
DLA Piper (Canada) LLP. Vancouver, British Columbia
OfficersAmar S. Doman Chairman and CEO
James Code Chief Financial Officer
R.S. (Rob) Doman Corporate Secretary
CanWel Building MaterialsNational Office Suite 1100 – 1055 West Georgia Street Vancouver, British Columbia Canada V6E 3P3
Contact Phone: (604) 432-1400 Internet: www.canwel.com
Transfer AgentCST Trust Company Vancouver, British Columbia Toronto, Ontario
Investor RelationsContact Ali Mahdavi Phone: (416) 962-3300
Stock ExchangeToronto Stock Exchange
Trading Symbols:
CWX; CWX.DB
Corporate InformatIon