Intergenerational Income Mobility in Spain ... - ruc.udc.es
41
Author: Isabel Cornes Herrero Tutor: Fernando Bruna Quintas Intergenerational Income Mobility in Spain Territorial breakdown Faculty of Economics and Business Administration Bachelor’s Degree in Economics Year 2021 Bachelor’s dissertation presented at the Faculty of Economics and Business Administration of the University of A Coruña for obtaining the Bachelor’s degree in Economics Bachelor’s Dissertation
Transcript of Intergenerational Income Mobility in Spain ... - ruc.udc.es
Author: Isabel Cornes Herrero
Tutor: Fernando Bruna Quintas
Intergenerational
Income Mobility in
Spain
Territorial breakdown
Faculty of Economics and Business Administration
Bachelor’s Degree in Economics
Year 2021
Bachelor’s dissertation presented at the Faculty of Economics and Business Administration of the
University of A Coruña for obtaining the Bachelor’s degree in Economics
Bachelor’s
Dissertation
2 Isabel Cornes Herrero
Intergenerational Income Mobility in Spain
Abstract
This paper has the objective to analyse the intergenerational mobility of income
in Spain and its different regions. For this, the Atlas of Opportunities 2020 database has
been used, which links the tax returns of two generations, and provides information on
intergenerational mobility in Spain based on income data from the State Tax
Administration Agency. The real incomes compared are those of the years 1998 for
parents and those of 2016 for the sons and daughters.
The results confirm that Spain is a society with upward intergenerational income
mobility for individuals who file the personal income tax. The expected percentile of
children born to parents with incomes below the median is around 47. Upward mobility
is greater for sons than for daughters in the lowest incomes, but the gap decreases as
income increases. There are substantial geographic differences in income mobility
between generations. The Spanish northwest shows a greater and more uniform mobility
than the southern provinces of Spain.
The Great Gatsby Curve shows the position of the regions considering the
intergenerational mobility of income and the inequality of each region. Canarias is the
one that shows the most disadvantageous situation.
Keywords: intergenerational income mobility, Great Gatsby Curve, equal
opportunities.
Number of words: 10759
3 Isabel Cornes Herrero
Intergenerational Income Mobility in Spain
Resumen
Este trabajo tiene como objetivo analizar la movilidad intergeneracional de la
renta en España y sus diferentes regiones. Para ello se ha utilizado la base de datos
Atlas de Oportunidades 2020, que enlaza las declaraciones de impuestos de dos
generaciones, y proporciona información de la movilidad intergeneracional en España
en base a datos de ingresos de la Agencia Estatal de Administración Tributaria. Los
ingresos reales comparados son los de los años 1998 para los padres y los de 2016
para los hijos e hijas.
Los resultados confirman que España es una sociedad con movilidad
intergeneracional de la renta ascendente para los individuos que presenta declaración
de la renta. El percentil esperado de hijos nacidos de padres con ingresos por debajo
de la mediana es alrededor del 47. La movilidad ascendente es mayor para los hijos que
para las hijas en los ingresos más bajos, pero la brecha disminuye a medida que
aumenta la renta. Existen diferencias geográficas sustanciales en la movilidad de
ingresos entre generaciones. El noroeste español muestra una movilidad mayor y más
uniforme que las provincias del sur de España.
Curva del Gran Gatsby muestra la posición de las regiones considerando la
movilidad intergeneracional de la renta y la desigualdad de cada región. Canarias es la
que muestra la situación más desventajosa
Palabras clave: movilidad intergeneracional de la renta, Curva del Gran Gatsby,
igualdad de oportunidades.
Número de palabras: 10759
4 Isabel Cornes Herrero
Intergenerational Income Mobility in Spain
Resumo
Este traballo ten como obxectivo analizar a mobilidade interxeracional de
ingresos en España e as súas diferentes rexións. Para iso, utilizouse a base de datos
Atlas de Oportunidades 2020, que vincula as declaracións de dúas xeracións e ofrece
información sobre a mobilidade interxeracional en España a partir dos datos de ingresos
da Axencia Estatal de Administración Tributaria. Os ingresos reais comparados son os
dos anos 1998 para os pais e os de 2016 para os fillos e fillas.
Os resultados confirman que España é unha sociedade con mobilidade
interxeracional de ingresos á alza para os mozos que presentan declaracións da renda.
O percentil esperado de nenos nados de pais con ingresos inferiores á mediana rolda
os 47. A mobilidade ascendente é maior para os fillos que para as fillas con ingresos
máis baixos, pero a brecha diminúe a medida que aumenta a renda. Hai diferenzas
xeográficas substanciais na mobilidade de ingresos entre xeracións. O noroeste español
presenta unha mobilidade maior e máis uniforme que as provincias do sur de España.
A Curva do Gran Gatsby mostra a posición das rexións considerando a
mobilidade interxeracional de ingresos e a desigualdade de cada rexión. Canarias é a
que presenta a situación máis desfavorable.
Palabras clave: mobilidade interxeracional de ingresos Curva do Gran Gatsby,
igualdade de oportunidades.
Número de palabras: 10759
5 Isabel Cornes Herrero
Intergenerational Income Mobility in Spain
Table of Contents
Acknowledgment .......................................................................................................... 8
Introduction ................................................................................................................... 9
1 Theoretical framework and literature .................................................................... 12
1.1 Theory and concepts. ................................................................................... 12
1.2 Literature review ........................................................................................... 14
2 Measures of intergenerational mobility ................................................................. 17
2.1 Relative mobility ........................................................................................... 17
2.2 Absolute mobility .......................................................................................... 19
2.3 Indicators for within-country comparisons across regions ............................. 19
3 Data and Methodology ......................................................................................... 21
3.1 Description and methodology of the dataset ................................................. 21
3.2 Limitations of the dataset .............................................................................. 22
3.3 Dataset management ................................................................................... 24
4 Overview of Intergenerational mobility in Spain ................................................... 25
4.1 Intergenerational mobility of income at national level .................................... 25
4.2 Intergenerational mobility of income and gender ........................................... 26
4.3 Intergenerational income elasticity. ............................................................... 27
5 Geographical variation ......................................................................................... 29
5.1 Intergenerational mobility of income at regional level .................................... 29
5.2 The Great Gatsby Curve ............................................................................... 33
6 Conclusions ......................................................................................................... 36
References ................................................................................................................. 38
6 Isabel Cornes Herrero
Intergenerational Income Mobility in Spain
List of Figures
Figure 1 Mean Child Rank vs. Parental Rank.............................................................. 25
Figure 2 Mean Child Rank vs. Parental Rank by Gender ............................................ 26
Figure 3 Mean Child Rank (25th Parental Rank) .......................................................... 30
Figure 4 Mean Child Rank (75th Parental Rank) .......................................................... 30
Figure 5 Mean Child Rank vs. Parental Rank ............................................................. 32
Figure 6 Great Gatsby Curve ...................................................................................... 34

7 Isabel Cornes Herrero
Intergenerational Income Mobility in Spain
List of Tables
Table 1 Top and Bottom 10 provinces by Absolute Upward Mobility ........................... 32

8 Isabel Cornes Herrero
Intergenerational Income Mobility in Spain
Acknowledgment
This investigation became a reality with the support and help of many individuals.
First and foremost, I would like to express my gratitude to my dissertation tutor Prof. Dr.
Fernando Bruna for guiding me, providing me with academic support and constant
supervision, and also for his patience which enabled the completion of this endeavour.
I want to thank Prof. María Alló Pazos and Carlota María Balsa Sánchez for their
help in preparing this dissertation.
Also, I would like to express my heartfelt gratitude to my mother and father Isabel
Herrero and Juan Carlos Cornes and the rest of my family, for all the support and the
encouragement received during the university degree.
Last but not least, I am deeply indebted with Fernando Añón for him support and
patience during this investigation.
9 Isabel Cornes Herrero
Intergenerational Income Mobility in Spain
Introduction
In recent years, economists have become interested in knowing and explaining
the persistence of family wealth through generations, this is known as intergenerational
social mobility. Economic mobility across generations, also known as intergenerational
mobility of income (IGM) is a key socio-economic indicator. Despite its centrality in
academic and political debate, the body of empirical evidence on intergenerational
mobility that economists have compiled over the years is not very widespread. The
reason is the difficulty to access to data that link the income of parents and children since
these data are separated by several years. Very few publicly available datasets around
the world have information to link parents and children and, at the same time, build
reliable measures of income for both cohorts (Acciari et al., 2019).
Spain is no exception in this case. Over the last decade, the empirical literature
on mobility across generations has been increased due to the fact that economists and
sociologists can access large administrative data in a different countries for example
United States, Canada, Australia, Denmark, Sweden, Italy... thanks to these huge
datasets the researchers have been possible to calculate estimates of mobility indexes
and have opened the possibility to analyse upward mobility patterns, within countries, at
a very disaggregated geographical level. From this, it has been possible to know that
socio-economic factors such as employment, education level, family size or religion are
correlated with upward mobility between regions (Acciari et al., 2019).
The interest of the study of intergenerational mobility is that income inequality is
transmitted between generations, affecting equal opportunities between individuals.
"The degree of intergenerational mobility is an important indicator of the health and
success of a society" (Berhrman & Taubman, 1990). Equality of opportunity is a desirable
characteristic for a society. By equal opportunities we mean that individuals from families
of different income levels maintain the same options regarding their income and training
(Sánchez, 2003).
The main objective of this paper is to analyse the intergenerational income mobility in
Spain, for this we will use the database of the Atlas of Opportunities 2020. This set of
data allows us to analyse national and regional mobility measures for the Spanish
10 Isabel Cornes Herrero
Intergenerational Income Mobility in Spain
population born between 1984 and 1990. The Opportunity Atlas is a useful database due
to the degree of detail it offers. It provides data by gender, by autonomous community,
city and neighbourhood. But it has certain limitations. In the dataset, only young people
who presented personal income tax are present, therefore the part of the population with
the lowest income is not considered. Moreover, a part of the Spanish population is left
out since the communities of the País Vasco and Navarra are not part of the dataset
since they have their own Treasury. Furthermore, the age of the children in 2016 is
between 26 and 32 years old, therefore young people are at the beginning of their
working careers. Comparing young professionals who have just started their working
careers with less qualified workers of the same age we will find very few differences in
income between them (Polavieja, 2020). Therefore, we are going to measure the
intergenerational mobility of income of the people who present the personal income tax
return and they are between 26 and 32 years old.
We calculate national and regional measures of intergenerational income mobility
based on income ranges. These measures are based on the denominated rank-rank
slope, which is calculated by a regression of the position (expressed in percentile ranks)
of each member of the infant generation in the position of the parents in their income
distribution. (Heidrich, 2017).
The measures of intergenerational mobility of income that we calculate in this paper are
based on the study carried out by Chetty et al. (2014). Also, the dataset we use is based
on another of the Chetty project, "The Opportunity Atlas: Mapping the Childhood Roots
of Social Mobility" (Chetty et al., 2018). To calculate the indices and organize the data,
we have used R programming software.
We calculate relative mobility, which is obtained by increasing the estimated rank-rank
slope by a factor of 100. "Relative mobility shows the strength of the association between
the income range of parents and children" (Heidrich, 2017). The income data provided
by the Opportunity Atlas 2020 is expressed over 100 percentiles, therefore relative
mobility measures the difference in the median income range between children with
parents at the top and children with parents at the bottom of parents' income distribution.
Taking this into account, relative mobility provides us with information about the average
income gap between children born to high-income families and those born to low-income
families (Heidrich, 2017). Another way to measure the relative mobility is
intergenerational income elasticity (IGE) that is “the elasticity of the expectation of the
children’s income or earnings with respect to their fathers’ earnings or their parental
income” (Mitnik & Grusky, 2020). Therefore, the closer the IGE is to zero, the more
mobile the sample will be.
11 Isabel Cornes Herrero
Intergenerational Income Mobility in Spain
We also calculate absolute mobility measures that "informs us about the average
income rank a child who grew up in a certain region attains as an adult, given that her
parents are located at a specific point in the parent income distribution" (Heidrich, 2017).
Absolute mobility can be calculated for any percentile, in this case we will use the 25th
percentile since in this way we will be able to know where the children who come from
households with lower income are located.
This paper is based on the work carried out by Acciari et al (2019) and Erisen &
Munk (2020). These authors analyse the regional intergenerational mobility of income in
Italy and Denmark respectively based on the estimators of Chetty et al. (2014).
The income of young people cannot depend only on their personal characteristics
and the income of their parents, but should also be related to the environment in which
they develop. To verify this, we analyze the relationship that exists between
intergenerational mobility of income and inequality. We represent the Great Gatsby curve
for the different Spanish autonomous communities. Great Gatsby curve shows a
negative relation between income inequality and intergenerational mobility (Narayan et
al., 2018).
The rest of the paper is organized as follows: Section 1 reviews the basics and
literature about social mobility. Section 2 defines the measures of intergenerational
mobility used in the analysis. Section 3 describes the dataset, explains the sample
selection procedure, and discusses the limitation of the Atlas. Section 4 presents the
results of the calculation and interprets the indicators on IGM at the national level.
Section 5 documents the patterns of geographical variation in upward mobility across
autonomous communities and provinces in Spain and it explains the Great Gatsby
Curve. Section 7 concludes.
12 Isabel Cornes Herrero
Intergenerational Income Mobility in Spain
1 Theoretical framework and
literature
1.1 Theory and concepts
"Social mobility refers to the changes experienced by members of a society in their
position in the socioeconomic distribution" (Vélez et al., 2015). To achieve a mobile
society, it is necessary to guarantee equality in the conditions of competition. Therefore,
it is necessary to provide individuals with the basic tools and conditions such as
education and health and guarantee equal conditions of competition in the labour market
too. If the above is fulfilled, the evolution in the lives of individuals will depend to a greater
extent on their own talent and effort. There is a lower probability the evolution of life is
predetermined by your personal or physical characteristics hence, the evolution of the
life of individuals depends less on personal, physical, or home characteristics and more
on the talent and effort of the people, it will be an indicator of the right performance of
the redistributive policies implemented by the State (Vélez et al., 2015).
There are multiple reasons to promote social mobility. Serrano and Torche (2010)
consider that the most relevant can be classified by three criteria: regulations, efficiency,
and social integration. With regulations, the authors refer to the rules that ensure that
individuals get the benefits they deserve for their effort. Efficiency is understood as not
wasting resources that could contribute to development and social integration, it is based
on the fact that the social system would separate to a minor degree if individuals could
exchange positions on the socioeconomic scale.
There are different levels and types of social mobility. Intergenerational mobility
focuses on the change that an individual experiences in relation to the home of origin.
On the other hand, intragenerational mobility is the changes throughout the life cycle. In
addition, there is horizontal mobility, which analyzes the “changes in the position of an
individual within the same socioeconomic stratum” (Vélez et al., 2015) and vertical
mobility measures the upward or downward change of an individual.
Social mobility can be measured in absolute and relative terms. Absolute mobility
refers to the transformations of the class structure, because of exogenous factors such
13 Isabel Cornes Herrero
Intergenerational Income Mobility in Spain
as technological advances, economic and demographic changes, among others while
relative mobility is the change in an individual's position on the socioeconomic scale with
respect to her home of origin (Vélez et al., 2015). Relative mobility measures the degree
of association between parents and children.
Social mobility can be measured in different ways The principal are: income,
education, wealth and subjective social mobility.
Income mobility "is about how much income each recipient receives at two or more
points in time" (Fields, 2008). The author considers the income as all its possible
sources. Other authors such as Mazumder (2005) use only labour income since it cannot
be transferred from parents to children as an inheritance or an asset. According to this
author, the use of labour income exposes in a better way the opportunities that an
individual has according to its effort and abilities. This author also considers that the use
of total income provides a broader measure due to it consider other income apart from
labour. On the other hand, to get the data from only labour income presents certain
complications and challenges.
Education has a fundamental role in socioeconomic mobility due to the formation of
human capital can increase the chances of rise in intergenerational mobility, but there
are access restrictions for the poorest households, therefore education can also
generate intergenerational inequality permanent in general, the analysis of educational
mobility focuses on the association between the educational level of parents and
children. (Vélez et al., 2015). Free access to education allows equalizing or balancing
opportunities because access to education is independent of the individual's social origin
(De Hoyos, et al., 2010).
Wealth is a means to increase consumption in the long term and safeguards
households from unexpected situations. In addition, family wealth can influence the level
of education that child can achieve. Therefore, parents can interfere in the well-being of
their children by investing in their education, or through the direct transfer of resources
in the form of financial support and inheritance. The analysis of the intergenerational
influence of wealth makes it possible to assess its relevance in the process of social
stratification. (Torche & Spilerman 2010)
Subjective social mobility shows the perception that a person has of her current
situation with respect to her parents' home. Perceived social mobility matters, since it is
psychological and not economic factors that influence people's welfare state (Huerta-
Wong, 2010). The perception of positive intergenerational mobility can constitute a
mechanism for social integration.
There are several dimensions of social mobility, therefore the policies that will be
applied will be different depending on the type of mobility. To increase intergenerational
14 Isabel Cornes Herrero
Intergenerational Income Mobility in Spain
educational mobility, the policies that will be affected will be those related to education,
it is a more direct action, therefore it is expected to achieve results with more certainty.
On the other hand, the policies applied for the. intergenerational mobility of income will
be more varied and should be he resorted to a mixture of economic and social policies.
Taking this into account, intergenerational income and educational mobility is related,
since educational mobility has an important role in positively expected permanent income
mobility, it is expected that the higher the educational level, the higher the expected
income of the individual (Sánchez, 2003).
The study of intergenerational mobility complements studies of income inequality and
intragenerational mobility. While the study of income inequality of individuals can tell us
about how unequal income is distributed in a state or region. The study of
intergenerational mobility tells us who and how much economic level has changed
(Sánchez, 2003).
1.2 Literature review
The different studies in the literature on intergenerational income mobility have the
aim, usually, to determine the degree of mobility in a certain country or region. However,
there are studies that compare income mobility between countries. Empirical studies on
intergenerational mobility have been using intergenerational elasticity, or statistical
correlation, between income, education or occupation of parents and children, as an
indicator of mobility. A high elasticity implies that people born in disadvantaged families
are less likely to occupy high socioeconomic positions than those born in privileged
families, while a low elasticity implies a greater degree of mobility. The literature on
intergenerational income mobility has been mainly concentrated in the United States,
Canada and some European countries such as the United Kingdom or Germany.
There are fewer empirical studies of intergenerational mobility in southern European
countries, probably due to the lack of sufficiently long panels (Cervini-Plá & Ramos,
2013) However, nowadays it is easier to access this type of data, therefore the studies
in these countries have increased but based on the methodology of authors from
countries such as the USA.
The principal researcher of mobility in the USA is Raj Chetty, a professor of
economics at Harvard University, in recent years he has published several papers
analysing Intergenerational Mobility and Inequality in the United States. One of his main
works “Where is the Land of Opportunity? The Geography of Intergenerational Mobility
in the United States” (Chetty et al., 2014) where he analyzes mobility analyzes the
income of children and their parents to discover characteristics of intergenerational
15 Isabel Cornes Herrero
Intergenerational Income Mobility in Spain
mobility in the United States. First, the conditional expectation of children's income given
parental income is linear in percentile ranges. Second, intergenerational mobility varies
substantially between areas within the US Many other authors took this test as a
reference to produce one from their own country, as is the case for Accaiari et al (2019)
that does an analysis of the IGM for Italy. The databases we use for this paper are based
on one of his most relevant projects "The Opportunity Atlas: Mapping the Childhood
Roots of Social Mobility" (Chetty et al., 2018).
Acciari et al. (2019) create a dataset that link tax returns across two generations to
provide one of the first estimate of intergenerational mobility in Italy based on
administrative income data. The authors find differences in intergenerational mobility
from a geographical point of view, the northern part of the country shows higher levels
of mobility than the south. This variation is correlated with the quality of school life and
labour market conditions. Eriksen & Munk, (2020) estimate intergenerational income
rank mobility within Denmark. They find that there is greater intergenerational income
mobility in middle-income rural municipalities and less intergenerational income mobility
within poor urban and rural municipalities. In addition, they also study the correlation that
exists between intergenerational mobility with inhabitants who are married and employed
of working age, this correlation is positive. On the other hand, Danish international
mobility has a negative correlation with single parents, teenage children, non-Western
immigrants, and inhabitants outside the labour force.
Both documents are based on Chetty et al. (2014) to estimate intergenerational mobility
within countries and uses pre-tax income data.
Narayan et al (2018) compares economic mobility across generation around the
world. It analyzes the different pathways to intergenerational mobility in education and
income of different countries, equal opportunities for children to achieve fair progress
and the promotion of intergenerational mobility through the role of factor markets and
policies.
Intergenerational mobility in Spain in the early 2000s has been studied mainly by
sociologists as Sánchez-Hugalde (2004) analyzes the intergenerational transmission of
income and mobility in education using the Family Budget Survey for the years 1980 and
1990. In his work, he finds that income mobility increases, going from an elasticity of 0.64
in 1980 to an elasticity of 0.44 in 1990, while the interdependence between the education
of parents and children is low. However, this work only estimates the elasticity for parents
and children who live together, therefore there is a problem of bias.
Nowadays economists also research on intergenerational mobility, María Cervini-
Plá (2015) estimates the earnings and income elasticity for Spain. She finds that the
elasticity for sons is around 0.42, she compares this result with other countries such as
16 Isabel Cornes Herrero
Intergenerational Income Mobility in Spain
France, United Kingdom, Nordic countries. “Compared to other developed countries,
Spain is relatively immobile, but it is more mobile than Italy, the only other southern
European country for which we have evidence.” (Cervini-Plá, 2015.). According to the
author, there are several reasons that explain this persistence in income between
parents and children. First, Spanish children leave the parental home at a late age, which
increases the influence of parents over their children. On the other hand, there is a strong
persistence in occupations and many jobs are filled through social referral. The last factor
is related to the educational system and its expansion in recent years that encourages
intergenerational mobility, may be the reason why there is greater mobility in Spain than
Italy.
Bruna et al (2021) analyzes intergenerational mobility in Spain. They conclude that
the place where you grow up is also related to the opportunities you will have in the future
using data from municipalities, it concludes that “The higher the average income of the
municipality in which boys and girls are raised, the more income opportunities they have
as adults, even when they are young” (Bruna et al, 2021).
17 Isabel Cornes Herrero
Intergenerational Income Mobility in Spain
2 Measures of intergenerational
mobility
In this section, we explain the measures of intergenerational mobility we use in the
paper. No single measure is perfect. Each one has advantages and deficiencies over
the others, and each one tries to answer a specific question.
2.1 Relative mobility
Relative mobility shows the strength of the association between child and parent
income rank. Furthermore, the income from the Atlas of Opportunities is expressed over
100 percentiles, relative mobility measures the difference in mean income rank between
children with (Heidrich, 2017).
Parents in the top, an children in the bottom of the parent income distribution (Heidrich,
2017).
A measure of relative mobility is the correlation between child and parent income ranks,
in other words an index of positional mobility (Acciari et al., 2019).
𝑅𝑖 = 𝛼 + 𝛽𝑅𝑖𝑃 + 𝜀𝑖 Equation 1
Where 𝑅𝑖 is the child ⅈ’s percentile rank in the income distribution of children (from
0 to 99) and 𝑅𝑖𝑃 is the percentile rank of ⅈ’s parents in the income distribution of parents.
The constant 𝛼 measures the expected rank of child born from parents at the bottom of
the income distribution (𝑅𝑖𝑃 = 0), and the rank-rank slope (RRS) or rank-rank persistence
coefficient) and β measures the strength of the correlation between a child’s position and
her parents’ position (Acciari et al., 2019).
This regression with national data has only one free parameter being, therefore,
it must be true, by taking averages of both sides, that 50 ⋅ (1 − 𝛽) = 𝛼. If the values of β
are close to zero, this means a very mobile society where the expected rank of children
is always around the median independently of parental rank. However, if the values are
close to one denote a society with high persistence in relative positions across
18 Isabel Cornes Herrero
Intergenerational Income Mobility in Spain
generation, meaning high relative mobility corresponds to a low value of β (Acciari et al.,
2019).
The difference in expected rank between two children with parents who are 𝛥
percentiles apart in the national income distribution can be calculated by 𝛥 ⋅ 𝛽. Therefore,
we can know by simple iteration how many generations it would take, on average, for
descendants of families originally 𝛥 percentiles apart to belong to the same percentile of
the income distribution that is the value of 𝑁 that solves 𝛽𝑁𝛥 = 1 (Acciari et al., 2019).
It is interest to know who the mobility differs from the top from the rest of the
distribution. To know if by being born in the upper part of the society there is more
opportunities to maintain the social status Acciari et al (2019) created the top mobility
ratio (TMR). First it is necessary to calculate the RRS by running the rank-rank regression
on the top decile of the parental distribution ( 𝛽91−100), then it run it on the bottom 90 pct
and calculate 𝛽1−90.
𝑇𝑀𝑅 ≡𝛽91−100
𝛽1−90
Equation 2
The higher the ratio, the greater the permanence of the ranks among the
generations with higher incomes compared to the rest of the distribution (Acciari et al.,
2019).
The intergenerational income elasticity (IGE) is the most common index used to
measure the relative mobility. The IGE is “the slope parameter of a regression of log
lifetime income of generation 𝑡 on log lifetime income of generation 𝑡 − 1. The closer the
IGE is to zero, the more mobile the sample under consideration is said to be” (Heidrich,
2017). Usually, IGE is estimated using the following benchmark equation:
𝑦𝑓𝑐 = 𝛼 + 𝛽𝑦𝑓
𝑃 + 𝜀𝑓𝑐 Equation 3
Where 𝛽 is the elasticity between parent and child income, 𝑦𝑓𝑃 and 𝑦𝑓
𝑐are the log
of parent and child lifetime earning in family 𝑓, respectively, and 𝜀𝑓𝑐 is an independent
and identically distributed error term representing all other influences on child income
nor correlated with parental income.
The higher the value of 𝛽, the more it tells us where we can expect the child's place
to be by knowing a parent's place in the income distribution, the lower the value, the less
stickiness, so that a parent's relative income is a weak predictor of where their child will
be on the next-generation income scale (Corak, 2013).
19 Isabel Cornes Herrero
Intergenerational Income Mobility in Spain
2.2 Absolute mobility
“Absolute mobility is defined as the mean adult rank of children with parents located
at a certain percentile 𝑝 in the parent distribution.” (Heidrich, 2017).
Following Chetty et al. (2014), the average absolute mobility for children from
families with below-median parent income in the national distribution is called absolute
upward mobility (AUM):
𝑅50 = 𝐸[𝑅𝑖|𝑅𝑖𝑃 ≤ 50] Equation 4
Due to, “the rank-rank relationship is linear, the average rank of children with below-
median parental income equals the average rank of children with parents at the 25th
percentile of the national income distribution” (Chetty et al., 2014), that can be calculates
from (Equation 1) as 𝛼 + 25 ⋅ 𝛽 = 50 − 25 ⋅ 𝛽.
2.3 Indicators for within-country comparisons across
regions
Apart from analysing intergenerational mobility at the national level, we are also
interested in analysing the geographical heterogeneity in intergenerational mobility within
Spain. 𝑅𝑖𝑟 denote the rank in the national income distribution of children for a child ⅈ who
grew up in the region 𝑟. 𝑅𝑖𝑃 is the rank of the parents in the national distribution of parental
income.
𝑅𝑖𝑟 = 𝛼𝑟 + 𝛽𝑟 ⋅ 𝑅𝑖𝑃 + 𝜀𝑖𝑟 Equation 5
We continue to rank both children and parents based on their positions in the
national income distribution (rather than the distribution within their region), we obtain
estimates of the region-specific indicators of relative (𝛽𝑟) mobility.
It is important to clarify that, in the linear national rank-rank relation (Equation 1)
there is only one free parameter, and a one-to-one mapping between absolute upward
mobility (AUM) and rank-rank slope (RR), this does not happen for the regional
regressions, since the average national rank of residents of a specific region needs not
be the median. (Acciari et al., 2019).
To compare the autonomous communities and provinces of Spain in terms of
absolute mobility we choose the percentile 25th to learn about the situation for children
20 Isabel Cornes Herrero
Intergenerational Income Mobility in Spain
from low-income families.Absolute mobility at p = 25 is calculated according to the
following formula:
�̅�25,𝑟 = 𝛼𝑟 + 𝛽𝑟 ⋅ 25 Equation 6
Where �̅�25,𝑟 is the average child rank at percentile 25 in region 𝑟 and 𝛽𝑟 is the RRS
parameter from region 𝑟 .
21 Isabel Cornes Herrero
Intergenerational Income Mobility in Spain
3 Data and Methodology
In this section, we describe our dataset and outline the sample selection procedure.
Our data source is the electronic database named Atlas of Opportunities 2020 created
by Felipe Gonzalez Foundation with the collaboration of COTEC Foundation.
3.1 Description and methodology of the dataset
The Atlas of Opportunities is an individualized and anonymized database that relates
the income of parents and children. It also includes information of location, gender, and
different incomes (individual and household). The objective of the Atlas of Opportunities
2020 project is to collect the data and display it. The database compares the gross
income (before taxes) children in 2016 with the income of their parents’ household in
1998 these data are provided by Spanish State Tax Administration Agency.
The Atlas of Opportunities 2020 was one of the 14 projects selected as the winner of
the COTEC Open Innovation Program, to which 734 applications were submitted.
The data have been obtained through an individualized database that is not public. To
generate this database, three steps have been followed:
Firstly, it is identified the children in the 2003 declarations (Model 100) born
between 1980 and 1990, which are 2.7 million. Children born between 1984 and 1990
(they were between 13 and 19 years old in 2003) are selected as they are more likely to
still live with their parents. There are 1.6 million children out of the 3 million registered.
Secondly, the income statements of the parents for the year 1998 are searched.
For each household, the location and the zip code are considered, in addition the gross
income the parents there is only access to household income, not individually.
Thirdly, the gross income of the children in 2016(and their household) is sought.
Different from the parents, in this case children’s data it has access to the net and gross
income. of each individual separately and by household. Gross income is used for the
analysis, with results at household level.
The methodology that was used to build the dataset was divided into different
parts:
22 Isabel Cornes Herrero
Intergenerational Income Mobility in Spain
First, a cleaning of the household data for 1998 and 2016 is carried out, removing
households without information, and adding auxiliary data. Households from 1998
(2.011.825) include identifiers, income data, geographic data (postal code, municipal
code, finance delegation, among others) and income data (individual or joint). Household
in 2016 (2.712.065) include household identifiers, individual and household income,
marital status, sex, and geographic information and information on the income statement
as the model used.
The data for 1998 and 2016 (parents and children) are joined from the household
identifier. And the data of the children born between 1984 and 1990 are selected. At this
time, the centiles of income are calculated following the methodology of Chetty et al.
(2018). For each child they calculate their income percentile in 2016, relative to the rest
of the children of that age. The same is done with parents (Llaneras et al., 2020).
The rents are expressed in centiles. Centiles are used to compare incomes
regardless of age, since we have data on children born between 1984-1990 who in 2016
are between 26 and 32 years old. In Chetty et al. (2014) show that measuring income
using centiles produces more robust estimates, because it reduces the influence of
anomalous data and mitigates lifecycle bias.
Tables are created where the average centile of the child appears from both the
mean and the median for each percentile of the parents' income, the sample size is also
included. These data are available by sex (total, male, and female) and income
(individual and household). The data are available at four different levels: national,
autonomous community, province, and large cities (any municipality in the database that
has more than 5000 children born between 1984 and 1990).
A dataset is created with estimates by municipality and postal code following the
methodology of Chetty et al (2018). Although in this work we will only use data at the
national level, autonomous communities, and provinces.
Data on the distribution of income by quintiles are also available.
In addition, there is a centile to euro converter, to be able to convert the data from income
centiles to euros. Three tables are generated for the percentiles of parents, for the
percentiles of children (divided by age) and at the regional level.
3.2 Limitations of the dataset
The Opportunity Atlas only includes the communities covered by the general scheme,
which is why the communities of Pais Vasco and Navarra are not included since they
have their own Treasury There are also no data for Ceuta and Melilla due to data sample
limitations.
23 Isabel Cornes Herrero
Intergenerational Income Mobility in Spain
Moreover, removals are not considered since the address and income of
household in 1998 is taken, there is no way to know if they have moved or are staying
there.
Older children are missing; therefore, it cannot be made comparisons between
siblings. They have a coverage of 60% for children of 13 or 14 years (in 2003) and 65%
for those of 15 to 18. But then it worsens and is only 32% for children of 23 years since
they surely leave home. For this reason, the analysis is limited to those born between
1984 and 1990 (who were between 13 and 19 in 2003). The percentage of girls should
be 48.7% and it is 48.4%, but above all there is a bias due to the age and income: there
is a lack of young girls and older boys especially in the poorest families (Llaneras et al.,
2020).
Young people whose parents did not file income tax returns in 1998 are not found.
It is a serious limitation because it excludes from the analysis precisely the decentralized
of the poorest household (Polavieja, 2020). They have 2.7 millon children, but according
to the INE in 2003 there were 5.2 million people of those ages. In 1998, people who
obtained an income of more than 550,000 pesetas per year (LIRPF 40/1998, December
9) it must present the tax return.
In addition, the children's income tax returns are used to calculate income in
2016, therefore the Atlas of Opportunities would leave out those young people who do
not accumulate enough income to make the income tax returns. In 2016 they were
required to file income tax return for full income from work, generally those who obtained
an income of more than 22000 euros (sole payer) or 12,000 (more than one payer) (O.
HFP/255/2017, March 21). Therefore, many young people between 26 and 32 years old
whose parents filed the personal income tax return in 1998 would be exempt from filing
in 2016. Young Spanish people are seriously affected by unemployed and job insecurity.
The average youth unemployment rate in 2016 was approximately 40% and the
temporary rate was around 60% (Felgueroso, 2018).
Furthermore, if we compare the data from Llanaras et al. (2020) with other
sources of income we find discrepancies. The average income of young people in the
Atlas is about 19,000 euros per year, while according to the 2016 Salary Structure
Survey, the average salary of workers between 25 and 34 years old is around 1,700, on
the other hand, the Survey of life conditions shows that the average net annual income
per person for young people of that age would be around 11,000 euros. Therefore, we
can conclude that the young people that appear in the Atlas are richer on average than
the Spanish youth really are, since the young people with lower incomes have been left
out (Polavieja, 2020). When we interpret the results, we cannot forget that a part of the
24 Isabel Cornes Herrero
Intergenerational Income Mobility in Spain
population is not considered, specifically the one with the lowest income, to interpret the
results correctly.
As we know the age of the children in 2016 is between 26 and 32 years old,
therefore young people are at the beginning of their working careers, this is a problem
for the Atlas since the age-income profiles of the most qualified workers are positive
(older leads to higher income), while the profiles of the less skilled workers are
fundamentally flat and much more sensitive to the economic cycle. Comparing young
professionals who have just started their working careers with less qualified workers of
the same age we will find very few differences in income between them (Polavieja, 2020).
These biases in the Atlas data inevitably lead to an overestimation of the degree of
income mobility that exists in Spain, so if we do not make an adequate interpretation of
the results, we could end up committing errors of bulk in our conclusions conclusions.
3.3 Dataset management
To offer a quality quantitative study, we have used the software R which is a free
software environment for statistical computing and graphics.
The Opportunity Atlas is made up of a large data set that is difficult to handle if you do
not have some basic programming concepts. We opted for the R software since it is a
language quite suitable for statistics since it allows us to manipulate the data quickly and
precisely.
Using R, we have divided the dataset to obtain the information in which we were
interested and thus proceed to the analysis of the data. In addition, R has advanced
graphics capabilities, so it allows us to make graphics that we can present the results in
a showy way. On the other hand, many times it is necessary to perform the same process
repeatedly but, it can easily automate, thanks to the creation of scripts that automate
processes, for example, reading data or doing operations with data, and always doing it
automatically. Furthermore, it can read practically any type of data. and the Atlas files
are in .csv format.
25 Isabel Cornes Herrero
Intergenerational Income Mobility in Spain
4 Overview of Intergenerational
mobility in Spain
4.1 Intergenerational mobility of income at national level
We begin the empirical analysis at the national level, studying the relationship
between child and parental income. Remember that the database uses gross income,
parental and child income is the sum of total pre-tax income.
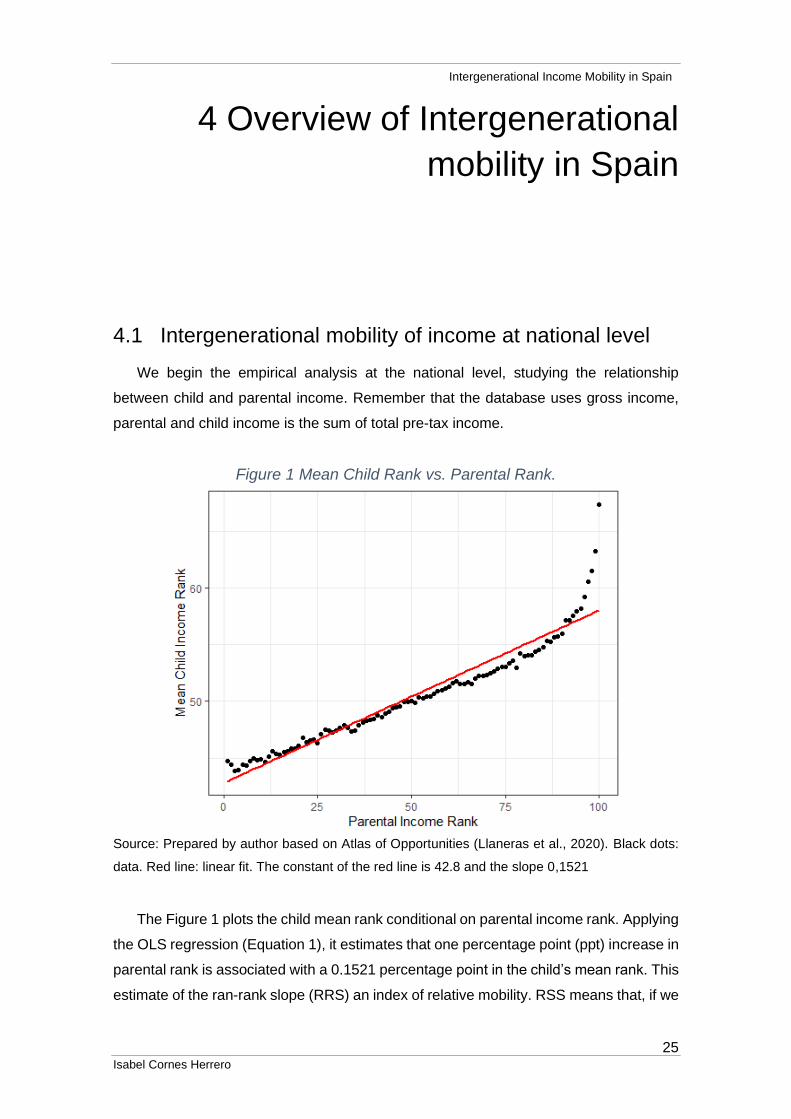
Figure 1 Mean Child Rank vs. Parental Rank.
Source: Prepared by author based on Atlas of Opportunities (Llaneras et al., 2020). Black dots:
data. Red line: linear fit. The constant of the red line is 42.8 and the slope 0,1521
The Figure 1 plots the child mean rank conditional on parental income rank. Applying
the OLS regression (Equation 1), it estimates that one percentage point (ppt) increase in
parental rank is associated with a 0.1521 percentage point in the child’s mean rank. This
estimate of the ran-rank slope (RRS) an index of relative mobility. RSS means that, if we
26 Isabel Cornes Herrero
Intergenerational Income Mobility in Spain
have two families one in the top decile of the income distribution and one in the first
decile, the next generation of children from the last decile is expected to be still,
approximately, two deciles above the child from the child of the first decile. For these two
families to belong to the same percentile, it will take at least two generations.
As can be appreciated in the Figure 1 in the last decile the dots are adopting a more
vertical shape, the slope if we only consider those percentiles (90-100) are 0.99.
Therefore, two children from the top decile but who belong to families that are at the
extremes a generation later will remain separated.
The top mobility ratio (TMR) is 7,62. Consequently, there is a great persistence of
the ranges between generations in the upper part of the income distribution in relation to
the rest of the distribution, it is more difficult to move to another centile among the families
with higher incomes.
Absolute upward mobility (AUM) index is 46,6 meaning that a child of parents with
incomes below the median is expected to finish in the 47th percentile of their income
distribution.
4.2 Intergenerational mobility of income and gender
The Atlas of Opportunities 2020 has data separated by gender, therefore we will
analyse the differences between men and women at the national level to be able to check
if there is a gap between the two genders.
Figure 2 Mean Child Rank vs. Parental Rank by Gender
Source: Prepared by author based on Atlas of Opportunities (Llaneras et al., 2020).
27 Isabel Cornes Herrero
Intergenerational Income Mobility in Spain
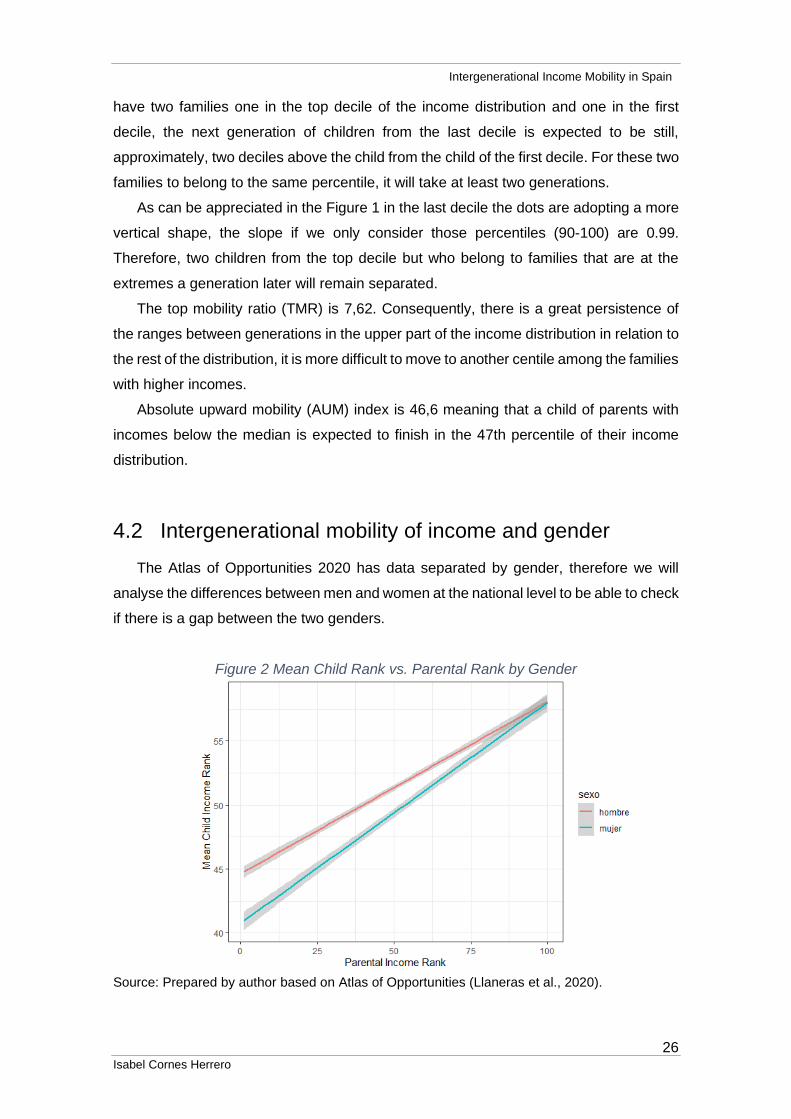
Studying the difference by gender (Figure 2), a clear difference is observed,
especially in the lower centiles, but as income increases, the two curves tend to
converge. Therefore, there is a gender difference in intergenerational income mobility
among poor families. The male gender shows greater mobility than the female gender.
OLS regression (Equation 1) for male it estimates that one percentage point increase in
parental rank is associated with a 0.134233 percentage point in the child’s mean rank
while female for a one percentage point increase in parental rank is associated with a
0.17216 percentage point in the child’s mean rank. the relevance of the parents' income
rank is much higher daughters than for sons.
The male absolute upward mobility (AUM) index is 47.99 meaning that a son of
parents with incomes below the median is expected to finish in the 48th percentile of their
income distribution while the female AUM index is 45.07, daughters of parents with
incomes below the median is expected to finish in the 45th percentile of their income
distribution.
4.3 Intergenerational income elasticity.
The intergenerational income elasticity (IGE) is the most common index used to
measure the relative mobility.
The dataset used in this work, as we have explained previously, are expressed in
percentiles or quintiles (we have worked with percentiles), therefore we do not have the
income that is necessary to calculate the IGE (Equation 3). The atlas of opportunities
has a converter to be able to calculate the income from the national centiles.
Using the Equation 3 we calculate that the Spanish IGE is 0.8714. Therefore, if the
parents' income is increased by 1%, it is estimated that the children's income will
increase by 0.871%. This means that in Spain almost a ninth of the observed individual
income would be determined by the parental income. This result draws us a lot of
attention because it differs from the calculated in other studies and is also very far from
that of other countries that have characteristics similar to Spain as the Mediterranean
countries. Narayan et al. (2018) estimated that the IGE of Spain is approximately 0.3,
this result is far from the one we have obtained with our calculations. Moreover, if we
compare the IGE of Spain, for example, with Italy there is also a big difference, and we
suppose that this should not happen since both are countries that share certain
characteristics. Corak (2013) calculates that the Italian IGE is 0.25, therefore this does
not give another indication that something is wrong. Our initial hypothesis based on these

28 Isabel Cornes Herrero
Intergenerational Income Mobility in Spain
results, it is to assume that there is some type of error in the converter. On the other
hand, to calculate the elasticities, individual data are but in the Atlas of Opportunities the
data is grouped, so we must assume that this also affects the calculation of the
intergenerational income elasticity.
29 Isabel Cornes Herrero
Intergenerational Income Mobility in Spain
5 Geographical variation
5.1 Intergenerational mobility of income at regional level
To study the geographical variation in intergenerational mobility within the country,
we focus on autonomous communities and provinces. An autonomous community is
made up of different provinces with specific territorial limits within Spain, which is
endowed with legislative autonomy and executive powers in everything that is not
common with the rest of the State. The Atlas of Opportunities (Llaneras et al., 2020) has
data for fifteen autonomous communities of the seventeen that exist and data for forty-
six provinces of the fifty that are. The largest autonomous community, Castilla and Leon,
has over 2,454 million residents. The smallest region, Balearic Islands, has less than
1,136 million.
To analyse the variation at the autonomic level in the mobility measures, each child
is assigned the province that their parents indicated as the province of residence in their
own 1998 tax return, therefore, removals are not considered. This community is
interpreted as the area where the children grew up, therefore it does not mean that they
continue to live in the same place.
We will begin with community-level analysis to find out how the children with parents
who are in the 25th and 75th centiles are. We have chosen these centiles because 25th
is the families with the lowest income and 75th is those with the highest income.
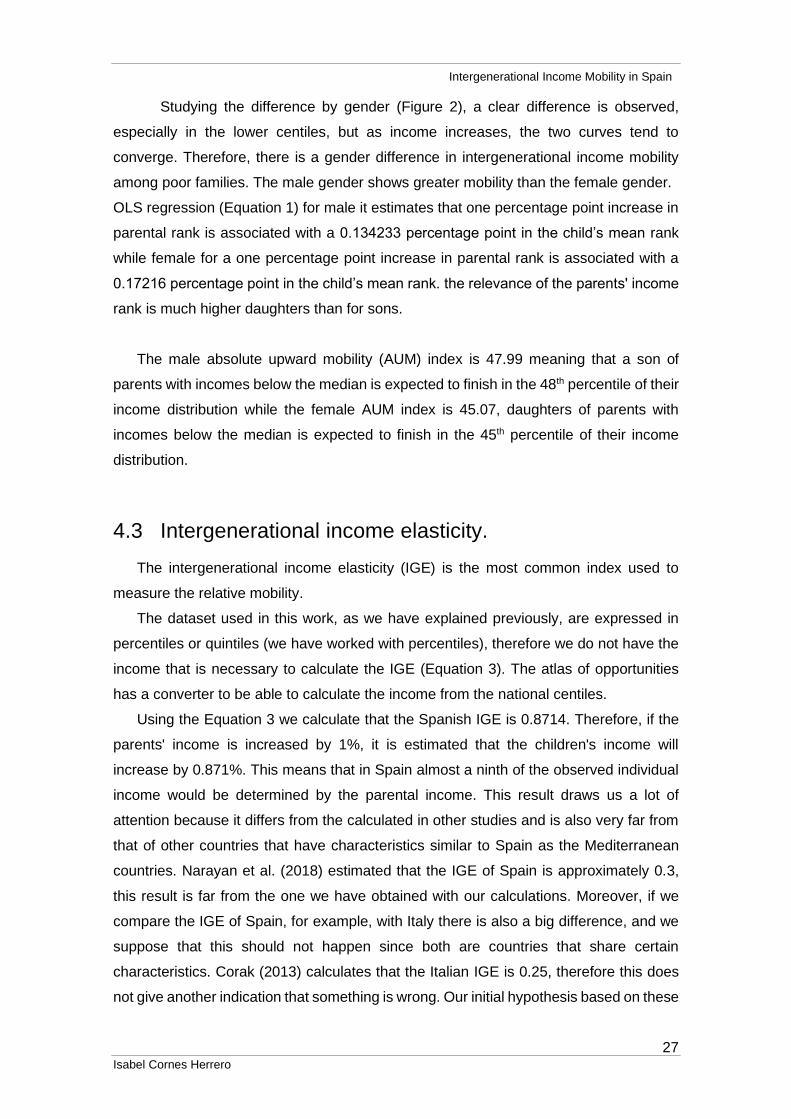
The Figure 3 shows the mean child rank when the parental rank is 25th. There is
upward mobility in this case since in all autonomous communities the children are above
the parents' centile (25th). Catalonia, Aragon, or La Rioja are the ones with the greatest
mobility they are the communities where the children of parents located in the poorest
25% of the income bracket are the furthest away. On the contrary, the Canary Islands,
Andalusia and Extremadura would be those with the least intergenerational income
mobility. Canary Islands are the one with the least mobility, children are in the 41,54
centil, Catalonia is the one with the highest mobility, children are in the 53,62.
30 Isabel Cornes Herrero
Intergenerational Income Mobility in Spain
Figure 3 Mean Child Rank (25th Parental Rank)
Source: Prepared by author based on Atlas of Opportunities (Llaneras et al., 2020). The
redline represents the nacional mean child rank (25th parental rank).
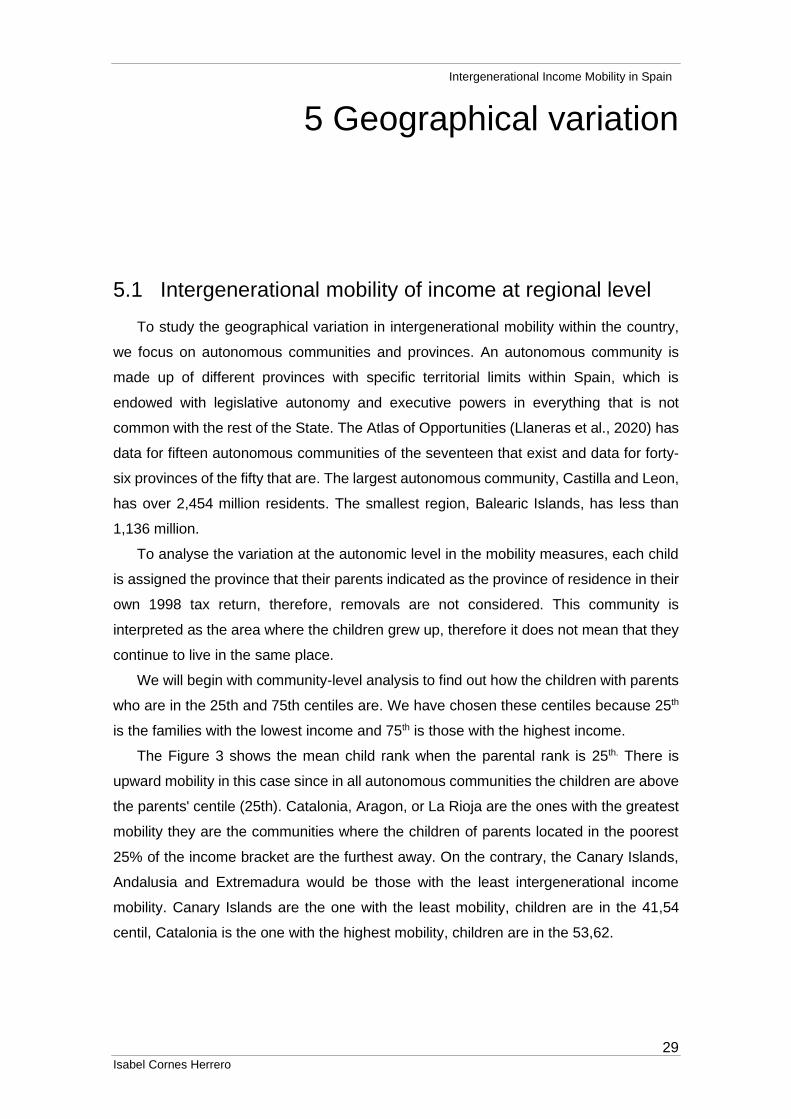
On the other hand, the Figure 4 shows the mean child rank when the parental
rank is 75th. In this case, the mean child rank of all the autonomous communities is below
the 75th centile of the parents, there is no upward mobility. The children in 2016 have a
lower income than their parents in 1998. Canary Islands are once again in the position
with less mobility, children are in the and 45,24. Balearic Islands are the ones that are
closest to reaching the parents since the children are in the centile 57,61.
Figure 4 Mean Child Rank (75th Parental Rank)
Source: Prepared by author based on Atlas of Opportunities (Llaneras et al., 2020). The redline
represents the national mean child rank (75th parental rank).
31 Isabel Cornes Herrero
Intergenerational Income Mobility in Spain
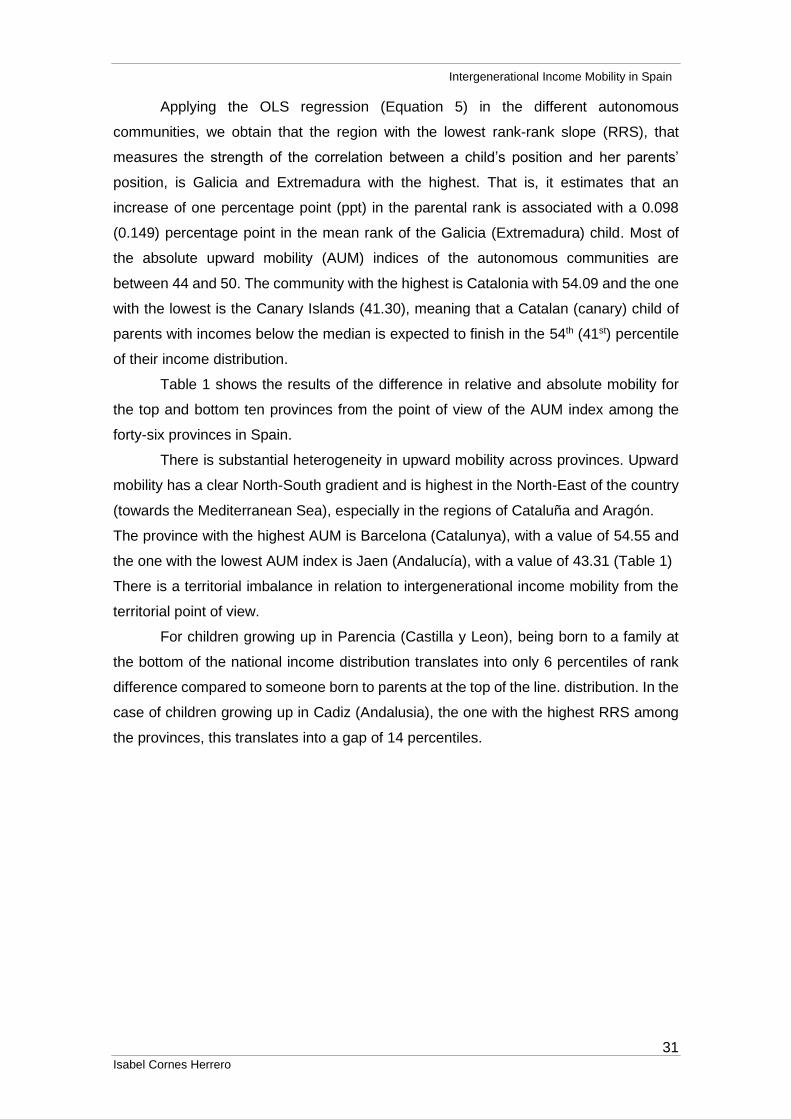
Applying the OLS regression (Equation 5) in the different autonomous
communities, we obtain that the region with the lowest rank-rank slope (RRS), that
measures the strength of the correlation between a child’s position and her parents’
position, is Galicia and Extremadura with the highest. That is, it estimates that an
increase of one percentage point (ppt) in the parental rank is associated with a 0.098
(0.149) percentage point in the mean rank of the Galicia (Extremadura) child. Most of
the absolute upward mobility (AUM) indices of the autonomous communities are
between 44 and 50. The community with the highest is Catalonia with 54.09 and the one
with the lowest is the Canary Islands (41.30), meaning that a Catalan (canary) child of
parents with incomes below the median is expected to finish in the 54th (41st) percentile
of their income distribution.
Table 1 shows the results of the difference in relative and absolute mobility for
the top and bottom ten provinces from the point of view of the AUM index among the
forty-six provinces in Spain.
There is substantial heterogeneity in upward mobility across provinces. Upward
mobility has a clear North-South gradient and is highest in the North-East of the country
(towards the Mediterranean Sea), especially in the regions of Cataluña and Aragón.
The province with the highest AUM is Barcelona (Catalunya), with a value of 54.55 and
the one with the lowest AUM index is Jaen (Andalucía), with a value of 43.31 (Table 1)
There is a territorial imbalance in relation to intergenerational income mobility from the
territorial point of view.
For children growing up in Parencia (Castilla y Leon), being born to a family at
the bottom of the national income distribution translates into only 6 percentiles of rank
difference compared to someone born to parents at the top of the line. distribution. In the
case of children growing up in Cadiz (Andalusia), the one with the highest RRS among
the provinces, this translates into a gap of 14 percentiles.
32 Isabel Cornes Herrero
Intergenerational Income Mobility in Spain
Table 1 Top and Bottom 10 provinces by Absolute Upward Mobility
Source: Prepared by author based on Atlas of Opportunities (Llaneras et al., 2020).
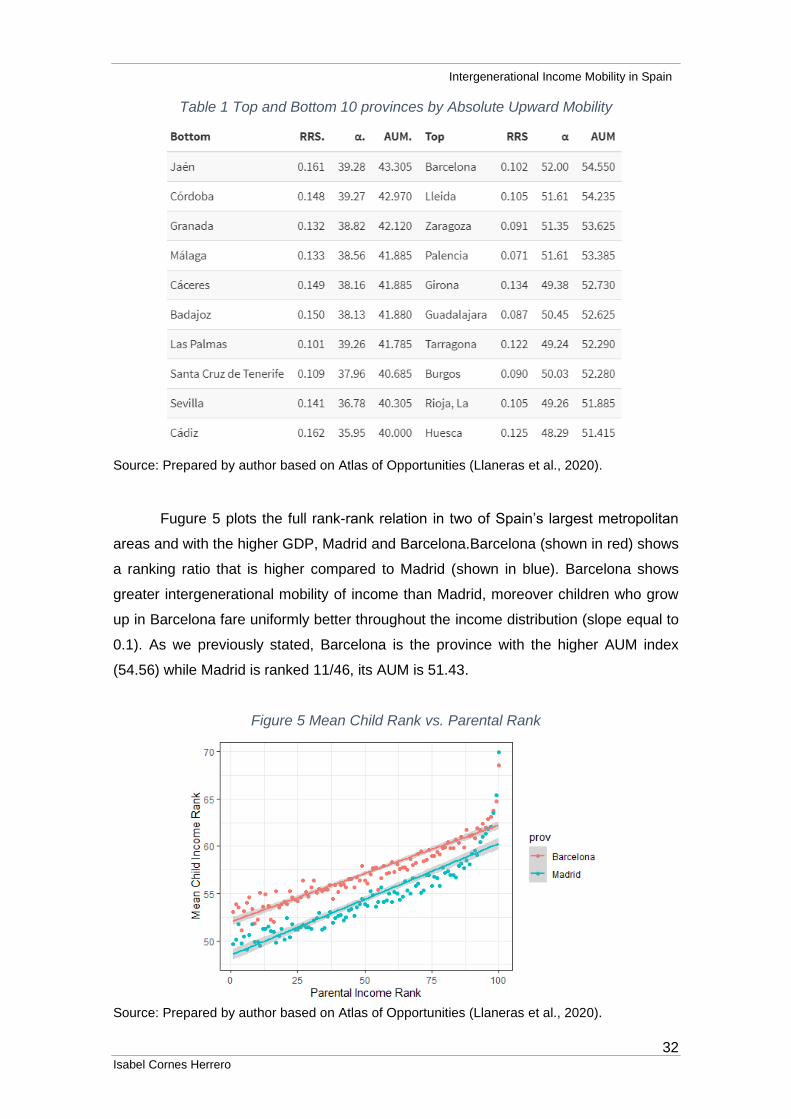
Fugure 5 plots the full rank-rank relation in two of Spain’s largest metropolitan
areas and with the higher GDP, Madrid and Barcelona.Barcelona (shown in red) shows
a ranking ratio that is higher compared to Madrid (shown in blue). Barcelona shows
greater intergenerational mobility of income than Madrid, moreover children who grow
up in Barcelona fare uniformly better throughout the income distribution (slope equal to
0.1). As we previously stated, Barcelona is the province with the higher AUM index
(54.56) while Madrid is ranked 11/46, its AUM is 51.43.
Figure 5 Mean Child Rank vs. Parental Rank
Source: Prepared by author based on Atlas of Opportunities (Llaneras et al., 2020).
33 Isabel Cornes Herrero
Intergenerational Income Mobility in Spain
5.2 The Great Gatsby Curve
Countries with greater inequality of incomes also tend to be countries in which a
greater fraction of economic advantage and disadvantage is passed on between parents
and their children. Alan Krueger has referred to this relationship as The Great Gatsby
Curve1.
The IGM has a mutual reinforcing relationship with income inequality. Lower IGM is
associated with greater income inequality, as depicted by the Great Gatsby curve
(Narayan et al., 2018), a relationship that has been noted by numerous studies using
cross-country variation and often interpreted as the outcome of different institutions.
Therefore, the curve shows a negative relation between income inequality and
intergenerational mobility.
The original Great Gatsby curve compared different countries. However, some
authors have questioned the results due to the poor comparability of the data between
countries (Leone, 2020; Chetty et al. 2014). The Great Gatsby illustrated in this paper
would not have this problem as we analysed the correlation between income inequality
and intergenerational mobility in different regions within a single country, using
observations recorded and consolidated in a single database. To create our Great
Gatsby Curve, we are going to use the different Spanish autonomous communities, in
this way we can see if more inequality is associated with less mobility across
generations, it is also true among the Spanish regions.
As a measure of income inequality, we are going to use the Gini coefficient of
each autonomous community calculated by Herrero et al (2013). Although there are
other inequality indices, we have opted for this one since it is one of the best known
today, because it is the main inequality indicator used in the empirical literature. To
understand Gini coefficient, we must first explain the Lorenz curve, which is a graphic
representation of the income distribution, on the horizontal axis is the percentage of the
population and the vertical axis shows the portion of total income accumulated by the
total population. therefore, total equality would correspond to a 45º curve. From the
Lorenz curve, the Gini coefficient is the ratio of the area between the 45º line of perfect
equality and the resulting Lorenz curve for the distribution in analysis, and the area of
the triangle below the 45º. It is ease to interpretate since it takes values between 0
(perfect equality) and 1 (perfect inequality) (Fellman, 2012.)
1 The curve's name refers to Jay Gatsby, F. Scott Fitzgerald's character from his novel The Great Gatsby since Jay shows a high degree of mobility throughout the book starting as a smuggler and ending as the leader of the Long Island North Shore Society (Lenzner, 2012.)
34 Isabel Cornes Herrero
Intergenerational Income Mobility in Spain
As a measure of IGM choose the percentile of the children when their parents are
at the 25th percentile since we are interested in studying the relationship with the lowest
income families within the dataset.
The Figure 6 ranks autonomous communities along two dimensions. The
horizontal axis shows income inequality in a country as measured by the Gini coefficient
in 2011and in the vertical axis there is an index of intergenerational economic mobility.
As can appreciate, the slope of the regression is negative, thus fulfilling the principle on
which the curve is based, more inequality is associated with less mobility across
generations.
Figure 6 Great Gatsby Curve
Source: Prepared by author based on Atlas of Opportunities (Llaneras et al., 2020) and (Herrero
et al., 2013.)
Most of the regions have a Gini coefficient very close to 0.3 and their IGM index
also has close values, for example Madrid, Catalonia, Valencia Community. But what we
are concerned about are the regions that are in the middle of the graph. In the lower
right-hand corner are the regions with the lowest IGM and the most unequal, such as the
Canary Islands. On the other hand, in the upper right corner are the communities with
the lowest inequality and the highest IGM (Aragon).
35 Isabel Cornes Herrero
Intergenerational Income Mobility in Spain
The Figure 6 shows us of the position of each region in order to apply socio-economic
measures that help the regions in a less advantaged situation to be closer to the other
regions and thus end the differences within the country.
The Great Gatsby Curve has been studying from different perspectives. One of
them focuses on the heritability of traits between parents and their children.
Therefore, if these characteristics are strongly transmitted across generations, and
assuming they are valued by labour markets over time, then there will also be an
intergenerational association of incomes that would affect the IGM and inequality.
Another perspective would be the one studied by Solon (2004) that suggests that
public policy can either accentuate or dampen the influence of labour market inequality.
Therefore, intergenerational mobility is promoted by "progressive" public programs so
families with the lowest income are the most benefited (Corak, 2013).
36 Isabel Cornes Herrero
Intergenerational Income Mobility in Spain
6 Conclusions
The objective of this paper is to study the intergenerational mobility of income in
Spain using the data provided by the Atlas of Opportunities, a database based on the
analysis of the income of ascendants and their descendants declared to the Spanish
State Tax Administration Agency.
As rich as they are, the data are not perfect and thus our analysis is not without
caveats. The most relevant may be that a proportion of the population with the lowest
incomes is not included since this leads to the average income of the Atlas youth
(19,000€) being higher than those calculated by other surveys as such as the survey on
living conditions (11,000€) Therefore, the indicators obtained will be biased in favour of
upward mobility due to it is the children born in the poorest households who have the
greatest difficulties in social advancement.
We must interpret the results keeping in mind the population that has been used
to calculate them. We cannot extrapolate these results for the entire Spanish population,
but we can for a large part of it, as is the case of those who file personal income tax. A
part of the Spanish population is left out since the communities of the País Vasco and
Navarra are not part of the dataset. Furthermore, the age of the children in 2016 is
between 26 and 32 years old, therefore young people are at the beginning of their
working careers. Comparing young professionals who have just started their working
careers with less qualified workers of the same age we will find very few differences in
income between them. Therefore, we have measured the intergenerational mobility of
income of the people who present the personal income tax return and they are between
26 and 32.
Faced with this, international comparison is ruled out since the lack of poorer
households increases mobility indices, showing that Spain's position is better, since
studies on other countries take these households into account when presenting their
indicators. The Spanish absolute upward mobility (AUM) is 0.466 while that of countries
like Italy is 0.44 (Acciari et al., 2019), Denmark has AUM index of 0.46 (Boserup et al.,
2017). Deutscher and Mazumder (2019) measures that AUM index for Australia is 0.45.
Corak (2017) calculated the AUM index of Canada is 0.44. The United States has an
37 Isabel Cornes Herrero
Intergenerational Income Mobility in Spain
AUM index of 0.41 (Chetty et al., 2014). That Spain has the highest AUM index is
surprising, therefore it makes us think that something is happening with the data used
and this can lead us to make misinterpretations. Therefore, if we use the results of this
paper to compare the Spanish intergenerational income mobility (IGM)with the rest of
the world, we would be committing an important error because these results cannot be
extrapolated for the entire population and Spain would be classified as a country with
great intergenerational income mobility. On the other hand, although we have ruled out
international comparison, at the national level it is possible to compare the different
Spanish regions without falling into overvaluation problems, always remembering that
we are analysing the results of the families that declare personal income tax.
Our findings contain both good and bad news. From a national point of view,
Spain presents an upwards IGM, a child of parents with incomes below the median is
expected to finish in the 47th percentile of their income distribution. Moreover, there is
also a difference by gender of the child that as the amount of income increases, this gap
decreases. On the other hand, they reveal acute inequality in the degree of upward
mobility within the country: the northeast shows greater and more uniform mobility than
the southern provinces where the ranks of society last from generation to generation.
Great Gatsby Curve helps us to know which are the regions that are in the best
(Aragon) and worst (Canary Islands) situations considering the IGM and inequality,
hence the living conditions of young people not only depend on their personal attributes
and family characteristics, also of the environment in which they develop and which, it
should be the object of attention of policies aimed at equal opportunities.
This paper analyzes the intergenerational mobility of income in Spain at a national
and regional level. In future works it would be interesting to study this mobility but at a
more disaggregated level such as neighbourhoods and the relationship between
intergenerational income mobility and other indicators such as unemployment,
education, religion, family size…
38 Isabel Cornes Herrero
Intergenerational Income Mobility in Spain
References
Acciari, P., Polo, A., & Violante, G. (2019). «And Yet It Moves»: Intergenerational Mobility
in Italy (N.o w25732; p. w25732). National Bureau of Economic Research.
https://doi.org/10.3386/w25732
Behrman, Jare R & Taubman, P. (1990). The Intergenerational correlation between
Children’s Adult earnings and their Parents’s Income: Results from the Michigan
Survey of Income Dynamich. Review of Income and Wealth, 36(2), 115-127.
Bruna, F., Rungo, P., & Alló, M. (2021). Movilidad Social Intergeneracional y Territorio
en España. Observatorio Social de La Caixa. https://n9.cl/vfm8
Boserup, S. H., W. Kopczuk, & C. T. Kreiner (2017). IntergenerationalWealth Mobility:
Evidence from Danish Wealth, Discussion paper, University of Copenhagen
Cervini-Plá, M. (2015). Intergenerational Earnings and Income Mobility in Spain. Review
of Income and Wealth, 61(4), 812-828. https://doi.org/10.1111/roiw.12130
Chetty, R., Friedman, J., Hendren, N., Jones, M., & Porter, S. (2018). The Opportunity
Atlas: Mapping the Childhood Roots of Social Mobility (N.o w25147; p. w25147).
National Bureau of Economic Research. https://doi.org/10.3386/w25147
Chetty, R., Hendren, N., Kline, P., & Saez, E. (2014). Where is the land of Opportunity?
The Geography of Intergenerational Mobility in the United States. The Quarterly
Journal of Economics, 129(4), 1553-1623. https://doi.org/10.1093/qje/qju022
Corak, M. (2013). Income Inequality, Equality of Opportunity, and Intergenerational
Mobility. Journal of Economic Perspectives, 27(3), 79-102. https
39 Isabel Cornes Herrero
Intergenerational Income Mobility in Spain
Corak, M. (2017). The Canadian Geography of Intergenerational Income Mobility. The
Economic Journal, 130(631), 2134-2174.
https://doi.org/10.1093/ej/uez019://doi.org/10.1257/jep.27.3.79 ´
De Hoyos, R., J. M. Martínez de la Calle & M. Székely (2010). Educación y movilidad
social”. En J. Serrano & F. Torche (eds.) Movilidad social en México. Población,
desarrollo y crecimiento. (pp.135-164) Centro de Estudios Espinosa Yglesias
Deutscher, N., & Mazumder, B. (2019). Intergenerational mobility across Australia and
the stability of regional estimates. Labour Economics, 66, 101861.
https://doi.org/10.1016/j.labeco.2020.101861
Eriksen, J., & Munk, M. D. (2020). The geography of intergenerational mobility—Danish
evidence. Economics Letters, 189, 109024.
https://doi.org/10.1016/j.econlet.2020.109024
Felgueroso, F. (2018). PoblaciónEspecialmente Vulnerable ante el Empleo en España
en el año 2018. Estudios sobre la Economía Española, eee2018-11 | Fedea.
http://documentos.fedea.net/pubs/eee/eee2018-11.pdf
Fellman, J. (2012.). Estimation of Gini coefficients using Lorenz curves. 8. Journal of
Statistical and Econometric Methods, 1(2), 31-38.
Fields, G. S. (2008). Income Mobility. https://ecommons.cornell.edu/handle/1813/75680
Heidrich, S. (2017). Intergenerational mobility in Sweden: A regional perspective. Journal
of Population Economics, 30(4), 1241-1280. https://doi.org/10.1007/s00148-017-
0648-x
Herrero, C., Soler, Á., & Villar, A. (2013). Desarrollo Y Pobreza En España Y Sus
Comunidades Autónomas: El Impacto De La Crisis. Papeles de Economía
Española, (38), 98-113.
Huerta Wong, J. E. (2010). El rol de la migración y las redes sociales en el bienestar
económico y la movilidad social percibida. En J. Serrano & F. Torche (eds.)
Movilidad social en México. Población, desarrollo y crecimiento. (pp.303-328)
Centro de Estudios Espinosa Yglesias
40 Isabel Cornes Herrero
Intergenerational Income Mobility in Spain
Lenzner, R. (2012). Income Inequality From Generation To Generation. Forbes.
https://www.forbes.com/sites/robertlenzner/2012/03/26/the-great-gatsby-curve-
is-a-threat-to-the-american-dream/
Leone, T. (2020). The Geography of Intergenerational Mobility: German Institute of
Global and Area Studies 51 : http://www.jstor.com/stable/resrep21215
Ley 40/1998, de 9 de diciembre, del Impuesto sobre la Renta de las Personas Físicas
y otras Normas Tributarias. https://www.boe.es/eli/es/l/1998/12/09/40
Llaneras, Kiko, Octavio Medina, y Elena Costas. 2020. «Atlas de Oportunidades».
Fundación Felipe Gonzalez-Fundación Cotec.
https://www.cotec.es/fundacionfelipegonzalez/oportunidades (3 de octubre de
2020).
Mazumder, B. (2005). “Fortunate Sons: New Estimates of Intergenerational Mobility in
the United States Using Social Security Earnings Data”. The Review of
Economics and Statistics.
https://www.jstor.org/stable/40042900?seq=1#metadata_info_tab_contents
Mitnik, P. A., & Grusky, D. B. (2020). The Intergenerational Elasticity of What? The Case
for Redefining the Workhorse Measure of Economic Mobility. Sociological
Methodology, 50(1), 47-95. https://doi.org/10.1177/0081175019886613
Narayan, A., Van der Weide, R., Cojocaru, A., Lakner, C., Redaelli, S., Mahler, D. G.,
Ramasubbaiah, R. G. N., & Thewissen, S. (2018). Fair Progress: Economic
Mobility across Generations around the World. World Bank.
https://doi.org/10.1596/978-1-4648-1210-1
Orden HFP/255/2017, de 21 de marzo, por la que se aprueban los modelos de
declaración del Impuesto sobre la Renta de las Personas Físicas y del Impuesto
sobre el Patrimonio, ejercicio 2016.
https://www.boe.es/eli/es/o/2017/03/21/hfp255
41 Isabel Cornes Herrero
Intergenerational Income Mobility in Spain
Polavieja, J. G. (2020). Grandes Datos, Grandes Sesgos, Grandes Errores: Sobre el
Atlas de Oportunidades. Revista Internacional de Sociología, 78(3), 166.
https://doi.org/10.3989/ris.2020.78.3.20.003
Sanchez-Hugalde, A. (2004). Movilidad intergeneracional de ingresos y educativa en
España (1980–90), Discuss Paper. Institut d’Economia de Barcelona (IEB).
Serrano, J. & F. Torche (eds.) (2010). Movilidad social en México. Población, desarrollo
y crecimiento. Centro de Estudios Espinosa Yglesias.
Solon, Gary. (2004). A Model of Intergenerational Mobility Variation over Time and Place.
http://www-personal.umich.edu/~gsolon/workingpapers/ottawa.pdf
Torche, F. & S. Spilerman (2010). Influencias intergeneracionales de la riqueza en
México. En J. Serrano & F. Torche (eds.) Movilidad social en México. Población,
desarrollo y crecimiento (faltan las páginas del capítulo). Centro de Estudios
Espinosa Yglesias
Vélez, R. G., Campos, R. M. V., & Fonseca, C. E. (2015). El concepto de movilidad
social: Dimensiones, medidas y estudios en México. 19. https://ceey.org.mx/wp-
content/uploads/2018/06/01-Vélez-Campos-Fonseca-2015-1.pdf