INSTITUTIONAL EQUITY RESEARCH Dabur India Ltd (DABUR IN...
9
INSTITUTIONAL EQUITY RESEARCH Page | 1 | PHILLIPCAPITAL INDIA RESEARCH Dabur India Ltd (DABUR IN) Extremely encouraging performance INDIA | FMCG | Quarterly Update 2 August 2018 Top takeaways from 1QFY19 Results beat our estimates by a huge margin due to broad-based good performance across its product portfolio. We find the two-year volume CAGR of 7.6% (21% volume growth in 1QFY19) to be extremely encouraging, despite rural areas (50% of overall sales) growing at a similar run-rate to urban areas. We are happy to see competitive intensity abating in categories where sales were impacted by Patanjali’s pricing strategy and high-decibel ad campaigns. In fact, the ‘Patanjali effect’ seems to be waning, as the company faces supply-chain complications, quality-related issues, and as it focuses on multiple categories. Health supplements (Chyawanprash and Honey) delivered the third consecutive quarter of c.15% revenue growth. EBITDA growth of 25% yoy was way ahead of our estimates, despite substantial A&P spends (up 33% yoy) due to a tight lid on operating costs (staff cost / other expenses were up only 10%/5%). International business (30% of sales) continued to recover in Q1FY19 (second consecutive quarter of +10% growth) driven by strong growth in the MENA region (appointment of standalone distributor in Saudi Arabia is aiding growth). Best play on rural recovery: We believe the worst of the headwinds (8% EBITDA CAGR over FY14-18) – the lingering effect of demonetisation, and GST-related disruption given high dependence on the wholesale channel – are behind us. Competitive intensity should moderate now, with Patanjali facing challenges (mentioned above). We expect consumer demand in rural areas to be much stronger in FY19, because of MSP hikes (at least 1.5x of production cost for all crops), the forecast of a normal monsoon, farm- loan waiver in key states, and higher fiscal spending towards creation of social/physical infrastructure ahead of General Elections in 2019. We see Dabur as a key beneficiary of the improving rural economy (50% of overall sales) with the right product-portfolio mix for this audience. We increase our target multiple to 45x (September 2020 EPS) from 40x earlier (June 2020 EPS), as Dabur is poised for 15%/14% EBITDA/PAT CAGR over FY18-21. Reasons: (1) Management gives preference to volume driven growth over margins. (2) Focus on new product launches (which was muted for a while). (3) Increasing distribution reach. (4) Improving distribution productivity under project Buniyaad. (5) Stability in international operations (Namaste profitability to see sharp improvement). We largely maintain our EPS estimates. It is still our top-pick within the mid-cap FMCG space. We hike our target to Rs 490 vs. Rs 425 earlier. Key risks to our call: (1) Discount-led competition by juice players (ITC etc.) to gain market share, and (2) any factor that hurts the rural economy. Buy (Maintain) CMP RS 430 / TARGET RS 490 (14%) COMPANY DATA O/S SHARES (MN) : 1766 MARKET CAP (RSBN) : 694 MARKET CAP (USDBN) : 10.1 52 - WK HI/LO (RS) : 396 / 293 LIQUIDITY 3M (USDMN) : 10.5 PAR VALUE (RS) : 1 SHARE HOLDING PATTERN, % Jun 18 Mar 18 Dec 17 PROMOTERS : 67.9 68.1 68.1 FII / NRI : 17.7 17.2 17.7 FI / MF : 8.0 8.5 8.5 NON PRO : 1.7 1.6 1.5 PUBLIC & OTHERS : 4.7 4.6 4.3 Key Financials Rs mn FY19 FY20E FY21E Net Sales 89,332 100,121 112,242 EBIDTA 18,799 21,532 24,364 Net Profit 15,675 17,983 20,382 EPS, Rs 8.9 10.2 11.6 PER, x 48.5 42.3 37.3 EV/EBIDTA, x 39.8 34.3 29.7 PBV, X 8.4 7.4 6.4 ROE, % 29.3 27.9 26.5 Debt/Equity (%) 15.5 12.8 10.8 CHANGE IN ESTIMATES __Revised Est. __ __% Revision__ Rs bn FY19E FY20E FY19E FY20E Revenue 89,332 100,121 1 1 EBITDA 18,799 21,532 (2) (1) Core PAT 15,675 17,983 (0) 2 EPS (Rs) 8.9 10.2 (0) 2 Vishal Gutka Naveen Kulkarni Preeyam Tolia (Rs mn) Q1FY19 Q4FY18 qoq growth % Q1FY18 yoy growth % PC yoy growth estimates % Comments Volume growth (% yoy) 21 8 (4) Strong volume growth led by strong growth across segments Net Sales 20,807 20,329 2 17,901 16 11 Gross Profits 10,321 10,305 0 8,755 18 10 Gross Margin (%) 49.6 50.7 -109 bps 48.9 69 bps -40 bps Improved product mix, low cost input inventory drive improvement in profitability Staff costs 2,241 1,807 24 2,035 10 7 Ad spends 1,990 1,256 58 1,500 33 8 Other operating expenses 2,229 2,390 (7) 2,131 5 12 EBITDA 3,861 4,852 (20) 3,089 25 11 Operating leverage drives profitability EBITDA margin (%) 18.6 23.9 -531 bps 17.3 130 bps 6 bps PBT 4,022 5,026 (20) 3,378 19 9 Tax rate (%) 18.0 20.9 17.4 57 bps 357 bps PAT 3,300 3,972 (17) 2,649 25 10
Transcript of INSTITUTIONAL EQUITY RESEARCH Dabur India Ltd (DABUR IN...
INSTITUTIONAL EQUITY RESEARCH
Page | 1 | PHILLIPCAPITAL INDIA RESEARCH
Dabur India Ltd (DABUR IN)
Extremely encouraging performance
INDIA | FMCG | Quarterly Update
2 August 2018
Top takeaways from 1QFY19 Results beat our estimates by a huge margin due to broad-based good performance
across its product portfolio. We find the two-year volume CAGR of 7.6% (21% volume growth in 1QFY19) to be extremely encouraging, despite rural areas (50% of overall sales) growing at a similar run-rate to urban areas.
We are happy to see competitive intensity abating in categories where sales were impacted by Patanjali’s pricing strategy and high-decibel ad campaigns. In fact, the ‘Patanjali effect’ seems to be waning, as the company faces supply-chain complications, quality-related issues, and as it focuses on multiple categories.
Health supplements (Chyawanprash and Honey) delivered the third consecutive quarter of c.15% revenue growth.
EBITDA growth of 25% yoy was way ahead of our estimates, despite substantial A&P spends (up 33% yoy) due to a tight lid on operating costs (staff cost / other expenses were up only 10%/5%).
International business (30% of sales) continued to recover in Q1FY19 (second consecutive quarter of +10% growth) driven by strong growth in the MENA region (appointment of standalone distributor in Saudi Arabia is aiding growth).
Best play on rural recovery: We believe the worst of the headwinds (8% EBITDA CAGR over FY14-18) – the lingering effect of demonetisation, and GST-related disruption given high dependence on the wholesale channel – are behind us. Competitive intensity should moderate now, with Patanjali facing challenges (mentioned above).
We expect consumer demand in rural areas to be much stronger in FY19, because of MSP hikes (at least 1.5x of production cost for all crops), the forecast of a normal monsoon, farm-loan waiver in key states, and higher fiscal spending towards creation of social/physical infrastructure ahead of General Elections in 2019. We see Dabur as a key beneficiary of the improving rural economy (50% of overall sales) with the right product-portfolio mix for this audience. We increase our target multiple to 45x (September 2020 EPS) from 40x earlier (June 2020 EPS), as Dabur is poised for 15%/14% EBITDA/PAT CAGR over FY18-21. Reasons: (1) Management gives preference to volume driven growth over margins. (2) Focus on new product launches (which was muted for a while). (3) Increasing distribution reach. (4) Improving distribution productivity under project Buniyaad. (5) Stability in international operations (Namaste profitability to see sharp improvement). We largely maintain our EPS estimates. It is still our top-pick within the mid-cap FMCG space. We hike our target to Rs 490 vs. Rs 425 earlier. Key risks to our call: (1) Discount-led competition by juice players (ITC etc.) to gain market share, and (2) any factor that hurts the rural economy.
Buy (Maintain) CMP RS 430 / TARGET RS 490 (14%)
COMPANY DATA
O/S SHARES (MN) : 1766
MARKET CAP (RSBN) : 694
MARKET CAP (USDBN) : 10.1
52 - WK HI/LO (RS) : 396 / 293
LIQUIDITY 3M (USDMN) : 10.5
PAR VALUE (RS) : 1
SHARE HOLDING PATTERN, %
Jun 18 Mar 18 Dec 17
PROMOTERS : 67.9 68.1 68.1
FII / NRI : 17.7 17.2 17.7
FI / MF : 8.0 8.5 8.5
NON PRO : 1.7 1.6 1.5
PUBLIC & OTHERS : 4.7 4.6 4.3
Key Financials
Rs mn FY19 FY20E FY21E
Net Sales 89,332 100,121 112,242
EBIDTA 18,799 21,532 24,364
Net Profit 15,675 17,983 20,382
EPS, Rs 8.9 10.2 11.6
PER, x 48.5 42.3 37.3
EV/EBIDTA, x 39.8 34.3 29.7
PBV, X 8.4 7.4 6.4
ROE, % 29.3 27.9 26.5
Debt/Equity (%) 15.5 12.8 10.8
CHANGE IN ESTIMATES
__Revised Est. __ __% Revision__
Rs bn FY19E FY20E FY19E FY20E
Revenue 89,332 100,121 1 1
EBITDA 18,799 21,532 (2) (1)
Core PAT 15,675 17,983 (0) 2
EPS (Rs) 8.9 10.2 (0) 2 Vishal Gutka Naveen Kulkarni Preeyam Tolia
(Rs mn) Q1FY19 Q4FY18 qoq
growth %
Q1FY18 yoy
growth %
PC yoy growth
estimates %
Comments
Volume growth (% yoy)
21 8 (4)
Strong volume growth led by strong growth across
segments
Net Sales 20,807 20,329 2 17,901 16 11
Gross Profits 10,321 10,305 0 8,755 18 10
Gross Margin (%)
49.6 50.7 -109 bps 48.9 69 bps -40 bps
Improved product mix, low cost input inventory drive
improvement in profitability
Staff costs 2,241 1,807 24 2,035 10 7
Ad spends 1,990 1,256 58 1,500 33 8
Other operating expenses 2,229 2,390 (7) 2,131 5 12
EBITDA 3,861 4,852 (20) 3,089 25 11 Operating leverage drives profitability
EBITDA margin (%) 18.6 23.9 -531 bps 17.3 130 bps 6 bps
PBT 4,022 5,026 (20) 3,378 19 9
Tax rate (%) 18.0 20.9 17.4 57 bps 357 bps
PAT 3,300 3,972 (17) 2,649 25 10
Page | 2 | PHILLIPCAPITAL INDIA RESEARCH
DABUR INDIA LTD QUARTERLY UPDATE
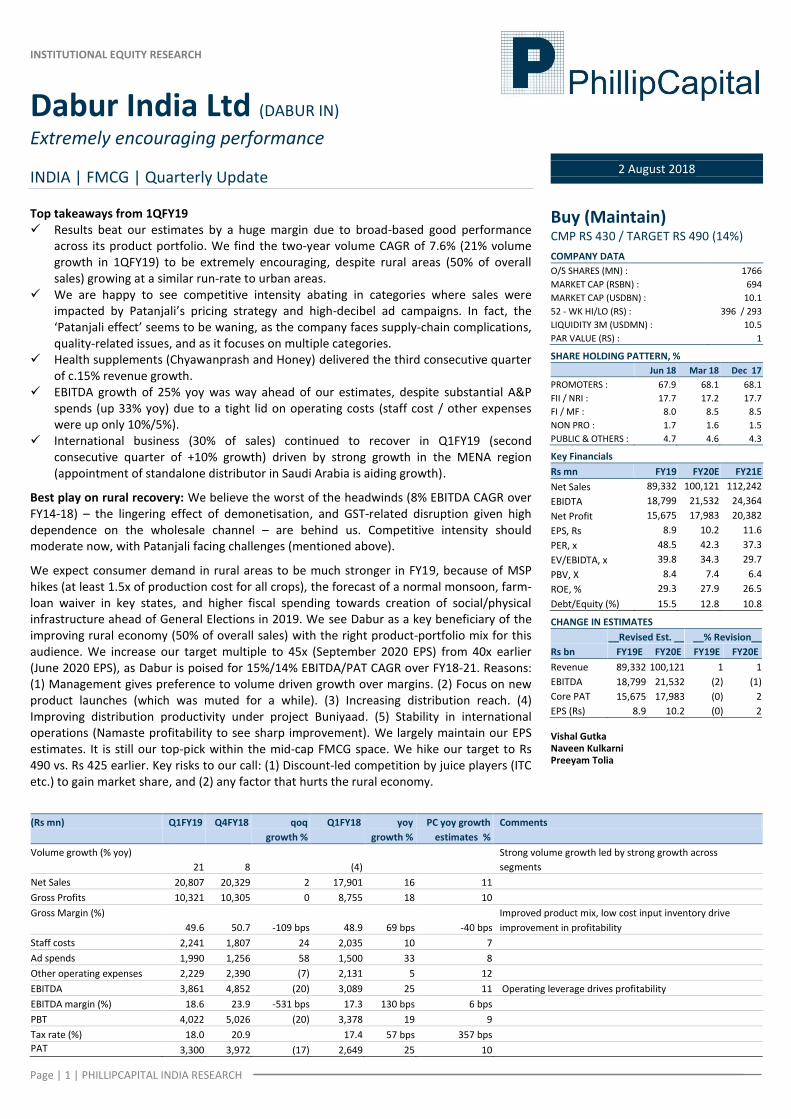
Volume growth picking up
Source: Company
Category growth rate
Q2FY16 Q3FY16 Q4FY16 Q1FY17 Q2FY17 Q3FY17 Q4FY17 Q1FY18 Q2FY18 Q3FY18 Q4FY18 Q1FY19
Growth rates Markets Domestic 8.8 (2.5) 8.5 0.5 2.4 (6.8) 0.7 (5.5) 10.7 17.7 10.0 24.7
International (reported currency) 8.8 14.8 15.7 6.0 (2.3) 6.0 - - - - - -
International (constant currency) 6.4 13.3 10.4 - - - (4.5) (2.2) 3.9 5.0 16.8 10.5
Categories
Health Supplements 9.0 (7.1) 5.0 - - (14.0) 5.0 (7.0) 3.0 19.5 14.0 27.5
Digestives 1.6 (2.4) 6.5 - - (10.0) (5.0) 4.0 11.7 19.3 7.2 21.6
OTC & Ethicals 10.8 7.5 7.1 - 11.3 (11.0) (4.0) 6.6 5.5 8.7 7.8 13.3
Hair Care 9.4 2.0 8.2 (3.0) (6.0) (20.0) (4.0) (11.0) 2.3 24.0 13.0 20.0
Home Care 12.4 8.4 19.3 2.0 20.0 (5.0) 6.5 6.2 10.1 36.0 - 17.4
Oral Care 18.7 10.5 18.3 11.6 - (5.0) 9.0 1.5 22.8 23.0 11.0 17.3
Skin Care 2.2 9.5 - - 7.0 (11.0) - 4.0 15.8 14.5 8.5 27.1
Foods 2.4 (23.7) 11.7 4.3 15.2 52.0 10.0 - 11.7 - 2.0 26.0
Contribution to domestic turnover Categories Health Supplements 16.0 25.0 16.0 12.0 15.0 23.0 17.0 12.0 15.0 24.0 17.0 12.3
Digestives 6.0 6.0 7.0 6.0 5.0 5.0 6.0 6.0 6.0 5.0 6.0 5.9
OTC & Ethicals 10.0 11.0 9.0 7.0 9.0 10.0 9.0 7.0 9.0 10.0 9.0 7.3
Hair Care 23.0 21.0 23.0 24.0 21.0 18.0 22.0 23.0 20.0 18.0 23.0 23.0
Home Care 7.0 6.0 6.0 6.0 8.0 6.0 6.0 7.0 8.0 7.0 5.0 6.8
Oral Care 16.0 14.0 15.0 16.0 16.0 15.0 16.0 18.0 19.0 16.0 17.0 17.0
Skin Care 4.0 6.0 5.0 5.0 5.0 6.0 5.0 5.0 5.0 6.0 5.0 5.4
Foods 18.0 11.0 19.0 24.0 21.0 17.0 19.0 22.0 19.0 14.0 18.0 22.3
Source: Company PhillipCapital India Research
8%
5% 7% 8% 7%
5% 4%
7%
4% 5%
-5%
2%
-4%
7%
13%
8%
21%
-10%
-5%
0%
5%
10%
15%
20%
25% Domestic volume growth (%)

Page | 3 | PHILLIPCAPITAL INDIA RESEARCH
DABUR INDIA LTD QUARTERLY UPDATE
Conference Call takeaways Rural areas grew at similar rate (24%) as urban; however, management
expects rural growth to outpace urban growth by 2-3% in the rest of FY19, driven by increase in government spending, good monsoon, and higher MSP.
Expect raw material inflation to inch-up in 2QFY19
Domestic business Health care (32% of FY18 domestic sales)
Health supplements (17% of FY18 domestic sales) grew by 28%, led by strong double-digit growth in honey (c. 42% yoy) and Chyawanprash. It has regained lost market share in honey from Patanjali through price cuts, improving product quality, and effective marketing strategy.
Disgestive (6% of FY18 domestic sales) grew by 22% driven by strong performance in Hajmola. It launched Dabur Hajmola Chat Cola in Q1FY19 along with Dabur Hajmola Amrud in FY18, which saw good traction, leading to market-share gains.
OTC and Ethicals (6% of FY18 domestic sales) grew by 13% and 23% led by
Honitus and others. Dabur Honitus Hot Sip (Kaadha) which was launched in FY18 has seen a strong response from customers, which further boosted growth in OTC.
Home and personal care (50% FY18 domestic sales)
Home care (7% of FY18 domestic sales) grew by 17%, mainly led by Odonil and Sanifresh.
Hair care (21% of FY18 domestic sales) saw strong growth double-digit in hair oils (c.19%) and shampoo (c.30%). Focused marketing initiatives and improved bottle saliency led shampoo growth; Dabur gained 70bps market share on price-warrior brands (Sarson and Brahmi hair oil), traction in the coconut hair oil segment, and A&P support for Dabur Amla.
Oral care (17% of FY18 domestic sales) grew by 17% led by Dabur Red toothpaste, while Dabur Red Gel (launched in FY18) grew reasonably. Babool declined marginally because of competitive intensity in the category, but to bring back growth, it will re-launch Babool with a new formulation in FY19. Colgate (which has been aggressive in terms of pricing on the herbal side) is putting pressure on economy brands, but Dabur plans to mitigate the impact through higher ad-spends and product activation.
Foods (18% of FY18 domestic sales)
Beverages grew by 27% driven by strong double-digit growth in Real and Activ; higher ad-spends, new product offerings, and discounts, led to regained lost market share from discount players (Paper Boat). It launched Real Ethnic Range – Masala Guava, Masala Pomegranate, and Alphonso Mango in Q1.
International business:
MENA saw healthy traction due to appointment of Separate distributor in Saudi Arabia and higher crude oil price support recovery in the region. Egypt/Saudi Arabia grew 31%/54% respectively.
Namaste reported low single-digit growth, reversing the declining trend of last year, but the company expects Namaste to turnaround, both in terms of revenue and profitability in FY19, due to localized manufacturing, launch of Curls Unleashed (natural product), tie-up with Wal-Mart, and increased geographical salience from the high-margin Africa region.
Page | 4 | PHILLIPCAPITAL INDIA RESEARCH
DABUR INDIA LTD QUARTERLY UPDATE
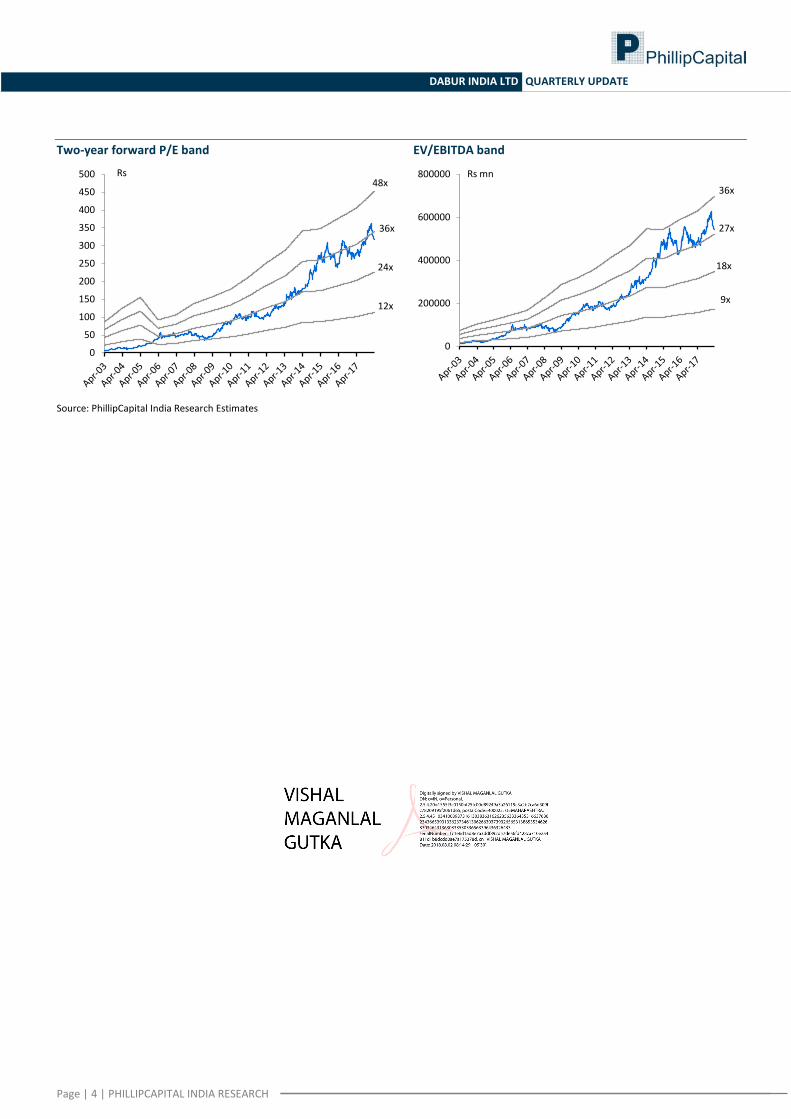
Two-year forward P/E band EV/EBITDA band
Source: PhillipCapital India Research Estimates
12x
24x
36x
48x
0
50
100
150
200
250
300
350
400
450
500 Rs
9x
18x
27x
36x
0
200000
400000
600000
800000 Rs mn
Page | 5 | PHILLIPCAPITAL INDIA RESEARCH
DABUR INDIA LTD QUARTERLY UPDATE
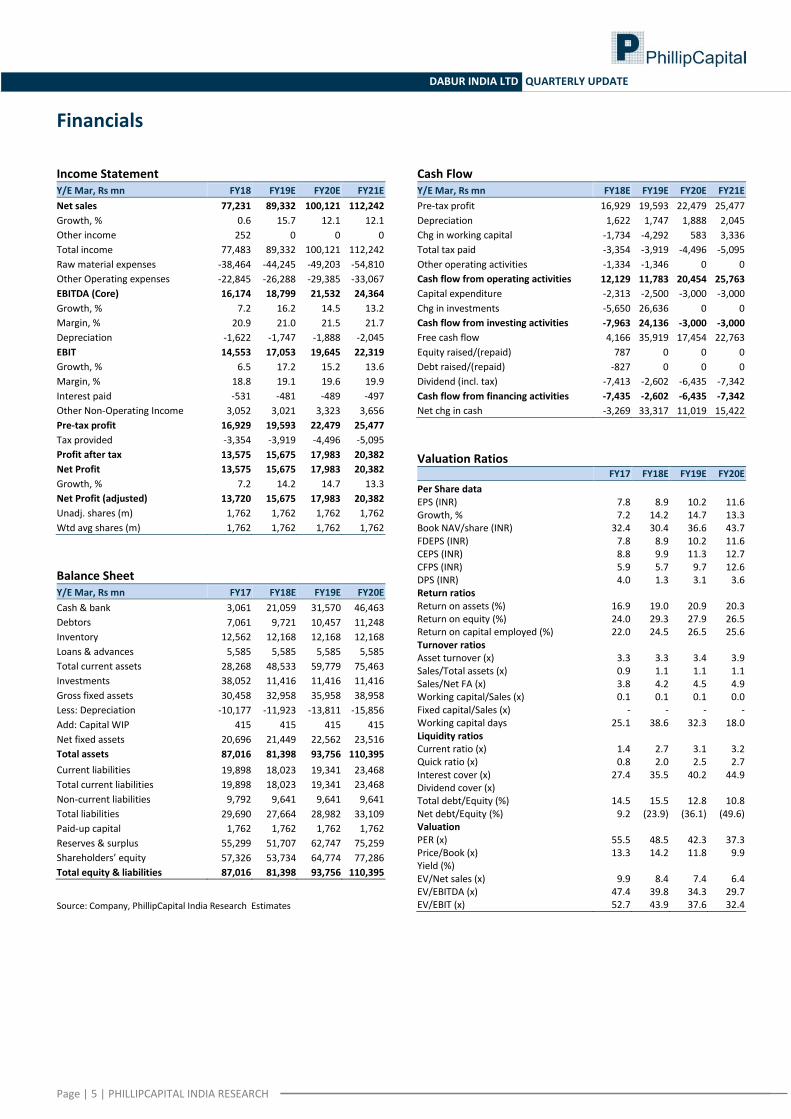
Financials
Income Statement Y/E Mar, Rs mn FY18 FY19E FY20E FY21E
Net sales 77,231 89,332 100,121 112,242
Growth, % 0.6 15.7 12.1 12.1
Other income 252 0 0 0
Total income 77,483 89,332 100,121 112,242
Raw material expenses -38,464 -44,245 -49,203 -54,810
Other Operating expenses -22,845 -26,288 -29,385 -33,067
EBITDA (Core) 16,174 18,799 21,532 24,364
Growth, % 7.2 16.2 14.5 13.2
Margin, % 20.9 21.0 21.5 21.7
Depreciation -1,622 -1,747 -1,888 -2,045
EBIT 14,553 17,053 19,645 22,319
Growth, % 6.5 17.2 15.2 13.6
Margin, % 18.8 19.1 19.6 19.9
Interest paid -531 -481 -489 -497
Other Non-Operating Income 3,052 3,021 3,323 3,656
Pre-tax profit 16,929 19,593 22,479 25,477
Tax provided -3,354 -3,919 -4,496 -5,095
Profit after tax 13,575 15,675 17,983 20,382
Net Profit 13,575 15,675 17,983 20,382
Growth, % 7.2 14.2 14.7 13.3
Net Profit (adjusted) 13,720 15,675 17,983 20,382
Unadj. shares (m) 1,762 1,762 1,762 1,762
Wtd avg shares (m) 1,762 1,762 1,762 1,762
Balance Sheet Y/E Mar, Rs mn FY17 FY18E FY19E FY20E
Cash & bank 3,061 21,059 31,570 46,463
Debtors 7,061 9,721 10,457 11,248
Inventory 12,562 12,168 12,168 12,168
Loans & advances 5,585 5,585 5,585 5,585
Total current assets 28,268 48,533 59,779 75,463
Investments 38,052 11,416 11,416 11,416
Gross fixed assets 30,458 32,958 35,958 38,958
Less: Depreciation -10,177 -11,923 -13,811 -15,856
Add: Capital WIP 415 415 415 415
Net fixed assets 20,696 21,449 22,562 23,516
Total assets 87,016 81,398 93,756 110,395
Current liabilities 19,898 18,023 19,341 23,468
Total current liabilities 19,898 18,023 19,341 23,468
Non-current liabilities 9,792 9,641 9,641 9,641
Total liabilities 29,690 27,664 28,982 33,109
Paid-up capital 1,762 1,762 1,762 1,762
Reserves & surplus 55,299 51,707 62,747 75,259
Shareholders’ equity 57,326 53,734 64,774 77,286
Total equity & liabilities 87,016 81,398 93,756 110,395
Source: Company, PhillipCapital India Research Estimates
Cash Flow Y/E Mar, Rs mn FY18E FY19E FY20E FY21E
Pre-tax profit 16,929 19,593 22,479 25,477
Depreciation 1,622 1,747 1,888 2,045
Chg in working capital -1,734 -4,292 583 3,336
Total tax paid -3,354 -3,919 -4,496 -5,095
Other operating activities -1,334 -1,346 0 0
Cash flow from operating activities 12,129 11,783 20,454 25,763
Capital expenditure -2,313 -2,500 -3,000 -3,000
Chg in investments -5,650 26,636 0 0
Cash flow from investing activities -7,963 24,136 -3,000 -3,000
Free cash flow 4,166 35,919 17,454 22,763
Equity raised/(repaid) 787 0 0 0
Debt raised/(repaid) -827 0 0 0
Dividend (incl. tax) -7,413 -2,602 -6,435 -7,342
Cash flow from financing activities -7,435 -2,602 -6,435 -7,342
Net chg in cash -3,269 33,317 11,019 15,422
Valuation Ratios
FY17 FY18E FY19E FY20E
Per Share data EPS (INR) 7.8 8.9 10.2 11.6
Growth, % 7.2 14.2 14.7 13.3 Book NAV/share (INR) 32.4 30.4 36.6 43.7 FDEPS (INR) 7.8 8.9 10.2 11.6 CEPS (INR) 8.8 9.9 11.3 12.7 CFPS (INR) 5.9 5.7 9.7 12.6 DPS (INR) 4.0 1.3 3.1 3.6 Return ratios
Return on assets (%) 16.9 19.0 20.9 20.3 Return on equity (%) 24.0 29.3 27.9 26.5 Return on capital employed (%) 22.0 24.5 26.5 25.6 Turnover ratios
Asset turnover (x) 3.3 3.3 3.4 3.9 Sales/Total assets (x) 0.9 1.1 1.1 1.1 Sales/Net FA (x) 3.8 4.2 4.5 4.9 Working capital/Sales (x) 0.1 0.1 0.1 0.0 Fixed capital/Sales (x) - - - - Working capital days 25.1 38.6 32.3 18.0 Liquidity ratios Current ratio (x) 1.4 2.7 3.1 3.2 Quick ratio (x) 0.8 2.0 2.5 2.7 Interest cover (x) 27.4 35.5 40.2 44.9 Dividend cover (x) Total debt/Equity (%) 14.5 15.5 12.8 10.8 Net debt/Equity (%) 9.2 (23.9) (36.1) (49.6) Valuation PER (x) 55.5 48.5 42.3 37.3 Price/Book (x) 13.3 14.2 11.8 9.9 Yield (%) EV/Net sales (x) 9.9 8.4 7.4 6.4 EV/EBITDA (x) 47.4 39.8 34.3 29.7 EV/EBIT (x) 52.7 43.9 37.6 32.4
Page | 6 | PHILLIPCAPITAL INDIA RESEARCH
DABUR INDIA LTD QUARTERLY UPDATE
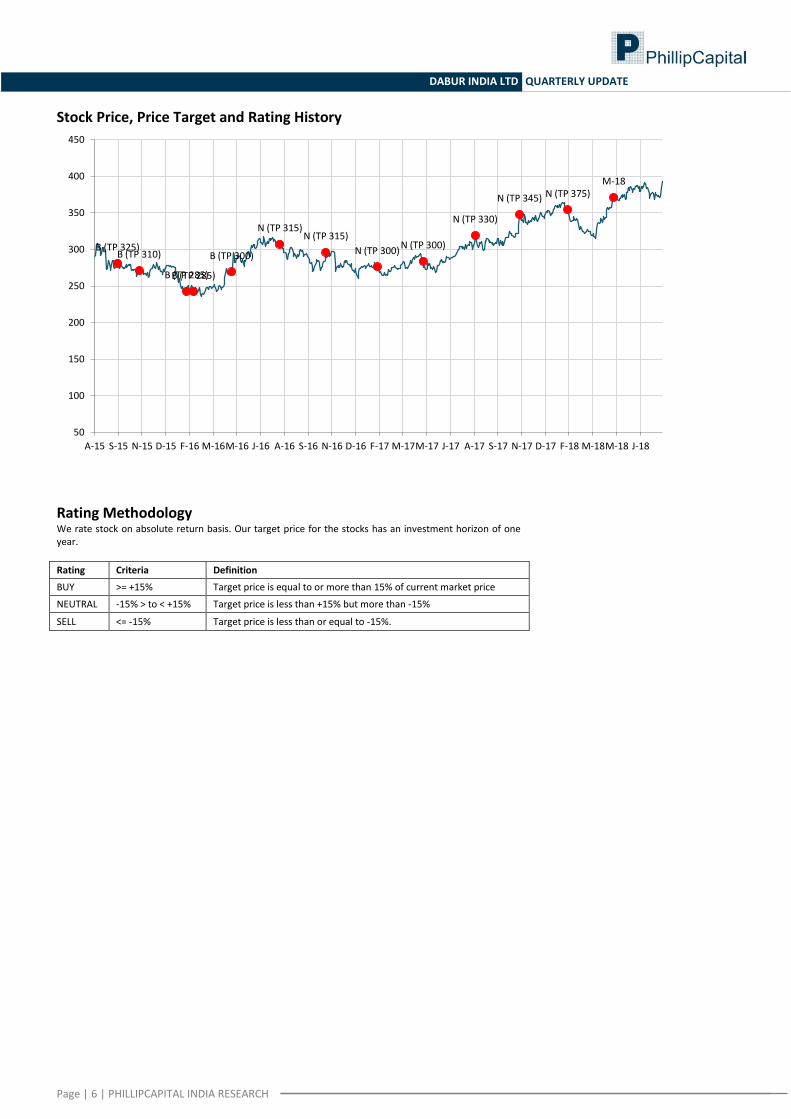
Stock Price, Price Target and Rating History
Rating Methodology We rate stock on absolute return basis. Our target price for the stocks has an investment horizon of one year.
Rating Criteria Definition
BUY >= +15% Target price is equal to or more than 15% of current market price
NEUTRAL -15% > to < +15% Target price is less than +15% but more than -15%
SELL <= -15% Target price is less than or equal to -15%.
B (TP 325) B (TP 310)
B (TP 285) B (TP 285)
B (TP 300)
N (TP 315) N (TP 315)
N (TP 300) N (TP 300)
N (TP 330)
N (TP 345) N (TP 375) M-18
50
100
150
200
250
300
350
400
450
A-15 S-15 N-15 D-15 F-16 M-16 M-16 J-16 A-16 S-16 N-16 D-16 F-17 M-17 M-17 J-17 A-17 S-17 N-17 D-17 F-18 M-18 M-18 J-18
Page | 7 | PHILLIPCAPITAL INDIA RESEARCH
DABUR INDIA LTD QUARTERLY UPDATE
MANAGEMENT
Vineet Bhatnagar (Managing Director)
Kinshuk Bharti Tiwari (Head – Institutional Equity)
Jignesh Shah (Head – Equity Derivatives)
REGIONAL MEMBER COMPANIES
INDIA
PhillipCapital (India) Private Limited
www.phillipcapital.in
SINGAPORE
Phillip Securities Pte Ltd
www.phillip.com.sg
JAPAN
Phillip Securities Japan, Ltd
www.phillip.co.jp
THAILAND
Phillip Securities (Thailand) Public Co. Ltd.
www.phillip.co.th
UNITED STATES
Phillip Futures Inc.
MALAYSIA
Phillip Capital Management Sdn Bhd
www.poems.com.my
INDONESIA
PT Phillip Securities Indonesia
www.phillip.co.id
FRANCE
King & Shaxson Capital Ltd.
www.kingandshaxson.com
AUSTRALIA
PhillipCapital Australia
www.phillipcapital.com.au
HONG KONG
Phillip Securities (HK) Ltd
www.phillip.com.hk
CHINA
Phillip Financial Advisory (Shanghai) Co. Ltd.
www.phillip.com.cn
UNITED KINGDOM
King & Shaxson Ltd.
www.kingandshaxson.com
SRI LANKA
Asha Phillip Securities Limited
www.ashaphillip.net/home.htm
RESEARCH
Automobiles
Dhawal Doshi
Nitesh Sharma, CFA
Agro Chemicals
Varun Vijayan
Banking, NBFCs
Manish Agarwalla
Pradeep Agrawal, Sujal Kumar
Consumer
Naveen Kulkarni, CFA, FRM
Preeyam Tolia, Vishal Gutka
Cement
Vaibhav Agarwal
Engineering, Capital Goods
Jonas Bhutta
Vikram Rawat
Economics
Anjali Verma
Raag Haria
IT Services
Vibhor Singhal
Shyamal Dhruve
Infrastructure
Vibhor Singhal
Deepika Bhandari
Logistics, Transportation & Midcap
Vikram Suryavanshi
Media
Naveen Kulkarni, CFA, FRM
Vishal Gutka
Metals
Dhawal Doshi
Vipul Agrawal
Midcaps
Deepak Agarwal
Akshay Mokashe
Pharma & Specialty Chem
Surya Patra
Mehul Sheth, Rishita Raja
Retail & Real Estate
Vishal Gutka
Dhaval Somaiya
Strategy
Naveen Kulkarni, CFA, FRM
Neeraj Chadawar
Telecom
Naveen Kulkarni, CFA, FRM
Technicals
Subodh Gupta, CMT
Production Manager
Ganesh Deorukhkar
Editor
Roshan Sony
Sr. Manager – Equities Support
Rosie Ferns
SALES & DISTRIBUTION
Kishor Binwal
Bhavin Shah
Ashka Gulati
Archan Vyas
Sales Trader
Dilesh Doshi
Execution
Mayur Shah
CORPORATE COMMUNICATIONS
Zarine Damania
Page | 8 | PHILLIPCAPITAL INDIA RESEARCH
DABUR INDIA LTD QUARTERLY UPDATE
Disclosures and Disclaimers PhillipCapital (India) Pvt. Ltd. has three independent equity research groups: Institutional Equities, Institutional Equity Derivatives, and Private Client Group. This report has been prepared by Institutional Equities Group. The views and opinions expressed in this document may, may not match, or may be contrary at times with the views, estimates, rating, and target price of the other equity research groups of PhillipCapital (India) Pvt. Ltd.
This report is issued by PhillipCapital (India) Pvt. Ltd., which is regulated by the SEBI. PhillipCapital (India) Pvt. Ltd. is a subsidiary of Phillip (Mauritius) Pvt. Ltd. References to "PCIPL" in this report shall mean PhillipCapital (India) Pvt. Ltd unless otherwise stated. This report is prepared and distributed by PCIPL for information purposes only, and neither the information contained herein, nor any opinion expressed should be construed or deemed to be construed as solicitation or as offering advice for the purposes of the purchase or sale of any security, investment, or derivatives. The information and opinions contained in the report were considered by PCIPL to be valid when published. The report also contains information provided to PCIPL by third parties. The source of such information will usually be disclosed in the report. Whilst PCIPL has taken all reasonable steps to ensure that this information is correct, PCIPL does not offer any warranty as to the accuracy or completeness of such information. Any person placing reliance on the report to undertake trading does so entirely at his or her own risk and PCIPL does not accept any liability as a result. Securities and Derivatives markets may be subject to rapid and unexpected price movements and past performance is not necessarily an indication of future performance.
This report does not regard the specific investment objectives, financial situation, and the particular needs of any specific person who may receive this report. Investors must undertake independent analysis with their own legal, tax, and financial advisors and reach their own conclusions regarding the appropriateness of investing in any securities or investment strategies discussed or recommended in this report and should understand that statements regarding future prospects may not be realised. Under no circumstances can it be used or considered as an offer to sell or as a solicitation of any offer to buy or sell the securities mentioned within it. The information contained in the research reports may have been taken from trade and statistical services and other sources, which PCIL believe is reliable. PhillipCapital (India) Pvt. Ltd. or any of its group/associate/affiliate companies do not guarantee that such information is accurate or complete and it should not be relied upon as such. Any opinions expressed reflect judgments at this date and are subject to change without notice.
Important: These disclosures and disclaimers must be read in conjunction with the research report of which it forms part. Receipt and use of the research report is subject to all aspects of these disclosures and disclaimers. Additional information about the issuers and securities discussed in this research report is available on request.
Certifications: The research analyst(s) who prepared this research report hereby certifies that the views expressed in this research report accurately reflect the research analyst’s personal views about all of the subject issuers and/or securities, that the analyst(s) have no known conflict of interest and no part of the research analyst’s compensation was, is, or will be, directly or indirectly, related to the specific views or recommendations contained in this research report.
Additional Disclosures of Interest: Unless specifically mentioned in Point No. 9 below: 1. The Research Analyst(s), PCIL, or its associates or relatives of the Research Analyst does not have any financial interest in the company(ies) covered in
this report. 2. The Research Analyst, PCIL or its associates or relatives of the Research Analyst affiliates collectively do not hold more than 1% of the securities of the
company (ies)covered in this report as of the end of the month immediately preceding the distribution of the research report. 3. The Research Analyst, his/her associate, his/her relative, and PCIL, do not have any other material conflict of interest at the time of publication of this
research report. 4. The Research Analyst, PCIL, and its associates have not received compensation for investment banking or merchant banking or brokerage services or for
any other products or services from the company(ies) covered in this report, in the past twelve months. 5. The Research Analyst, PCIL or its associates have not managed or co-managed in the previous twelve months, a private or public offering of securities for
the company (ies) covered in this report. 6. PCIL or its associates have not received compensation or other benefits from the company(ies) covered in this report or from any third party, in
connection with the research report. 7. The Research Analyst has not served as an Officer, Director, or employee of the company (ies) covered in the Research report. 8. The Research Analyst and PCIL has not been engaged in market making activity for the company(ies) covered in the Research report. 9. Details of PCIL, Research Analyst and its associates pertaining to the companies covered in the Research report:
Sr. no. Particulars Yes/No
1 Whether compensation has been received from the company(ies) covered in the Research report in the past 12 months for investment banking transaction by PCIL
No
2 Whether Research Analyst, PCIL or its associates or relatives of the Research Analyst affiliates collectively hold more than 1% of the company(ies) covered in the Research report
No
3 Whether compensation has been received by PCIL or its associates from the company(ies) covered in the Research report No
4 PCIL or its affiliates have managed or co-managed in the previous twelve months a private or public offering of securities for the company(ies) covered in the Research report
No
5 Research Analyst, his associate, PCIL or its associates have received compensation for investment banking or merchant banking or brokerage services or for any other products or services from the company(ies) covered in the Research report, in the last twelve months
No
Independence: PhillipCapital (India) Pvt. Ltd. has not had an investment banking relationship with, and has not received any compensation for investment banking services from, the subject issuers in the past twelve (12) months, and PhillipCapital (India) Pvt. Ltd does not anticipate receiving or intend to seek compensation for investment banking services from the subject issuers in the next three (3) months. PhillipCapital (India) Pvt. Ltd is not a market maker in the securities mentioned in this research report, although it, or its affiliates/employees, may have positions in, purchase or sell, or be materially interested in any of the securities covered in the report.
Suitability and Risks: This research report is for informational purposes only and is not tailored to the specific investment objectives, financial situation or particular requirements of any individual recipient hereof. Certain securities may give rise to substantial risks and may not be suitable for certain investors. Each investor must make its own determination as to the appropriateness of any securities referred to in this research report based upon the legal, tax and accounting considerations applicable to such investor and its own investment objectives or strategy, its financial situation and its investing experience. The value of any security may be positively or adversely affected by changes in foreign exchange or interest rates, as well as by other financial, economic, or political factors. Past performance is not necessarily indicative of future performance or results.
Page | 9 | PHILLIPCAPITAL INDIA RESEARCH
DABUR INDIA LTD QUARTERLY UPDATE
Sources, Completeness and Accuracy: The material herein is based upon information obtained from sources that PCIPL and the research analyst believe to be reliable, but neither PCIPL nor the research analyst represents or guarantees that the information contained herein is accurate or complete and it should not be relied upon as such. Opinions expressed herein are current opinions as of the date appearing on this material, and are subject to change without notice. Furthermore, PCIPL is under no obligation to update or keep the information current. Without limiting any of the foregoing, in no event shall PCIL, any of its affiliates/employees or any third party involved in, or related to computing or compiling the information have any liability for any damages of any kind including but not limited to any direct or consequential loss or damage, however arising, from the use of this document.
Copyright: The copyright in this research report belongs exclusively to PCIPL. All rights are reserved. Any unauthorised use or disclosure is prohibited. No reprinting or reproduction, in whole or in part, is permitted without the PCIPL’s prior consent, except that a recipient may reprint it for internal circulation only and only if it is reprinted in its entirety.
Caution: Risk of loss in trading/investment can be substantial and even more than the amount / margin given by you. Investment in securities market are subject to market risks, you are requested to read all the related documents carefully before investing. You should carefully consider whether trading/investment is appropriate for you in light of your experience, objectives, financial resources and other relevant circumstances. PhillipCapital and any of its employees, directors, associates, group entities, or affiliates shall not be liable for losses, if any, incurred by you. You are further cautioned that trading/investments in financial markets are subject to market risks and are advised to seek independent third party trading/investment advice outside PhillipCapital/group/associates/affiliates/directors/employees before and during your trading/investment. There is no guarantee/assurance as to returns or profits or capital protection or appreciation. PhillipCapital and any of its employees, directors, associates, and/or employees, directors, associates of PhillipCapital’s group entities or affiliates is not inducing you for trading/investing in the financial market(s). Trading/Investment decision is your sole responsibility. You must also read the Risk Disclosure Document and Do’s and Don’ts before investing.
Kindly note that past performance is not necessarily a guide to future performance.
For Detailed Disclaimer: Please visit our website www.phillipcapital.in
For U.S. persons only: This research report is a product of PhillipCapital (India) Pvt Ltd., which is the employer of the research analyst(s) who has prepared the research report. The research analyst(s) preparing the research report is/are resident outside the United States (U.S.) and are not associated persons of any U.S.-regulated broker-dealer and therefore the analyst(s) is/are not subject to supervision by a U.S. broker-dealer, and is/are not required to satisfy the regulatory licensing requirements of FINRA or required to otherwise comply with U.S. rules or regulations regarding, among other things, communications with a subject company, public appearances, and trading securities held by a research analyst account.
This report is intended for distribution by PhillipCapital (India) Pvt Ltd. only to "Major Institutional Investors" as defined by Rule 15a-6(b)(4) of the U.S. Securities and Exchange Act, 1934 (the Exchange Act) and interpretations thereof by the U.S. Securities and Exchange Commission (SEC) in reliance on Rule 15a 6(a)(2). If the recipient of this report is not a Major Institutional Investor as specified above, then it should not act upon this report and return the same to the sender. Further, this report may not be copied, duplicated, and/or transmitted onward to any U.S. person, which is not a Major Institutional Investor. In reliance on the exemption from registration provided by Rule 15a-6 of the Exchange Act and interpretations thereof by the SEC in order to conduct certain
business with Major Institutional Investors, PhillipCapital (India) Pvt Ltd. has entered into an agreement with a U.S. registered broker-dealer, Decker & Co, LLC. Transactions in securities discussed in this research report should be effected through Decker & Co, LLC or another U.S. registered broker dealer.
If Distribution is to Australian Investors This report is produced by PhillipCapital (India) Pvt Ltd and is being distributed in Australia by Phillip Capital Limited (Australian Financial Services Licence No. 246827).
This report contains general securities advice and does not take into account your personal objectives, situation and needs. Please read the Disclosures and Disclaimers set out above. By receiving or reading this report, you agree to be bound by the terms and limitations set out above. Any failure to comply with
these terms and limitations may constitute a violation of law. This report has been provided to you for personal use only and shall not be reproduced, distributed or published by you in whole or in part, for any purpose. If you have received this report by mistake, please delete or destroy it, and notify the sender immediately.
PhillipCapital (India) Pvt. Ltd. Registered office: No. 1, 18th Floor, Urmi Estate, 95 Ganpatrao Kadam Marg, Lower Parel West, Mumbai 400013