Dabur India Limited · 2019-07-19 · Dabur India Limited Investor Communication ... Vatika Menz...
22
Dabur India Limited Investor Communication Quarter ended 30 th June 2019 1
Transcript of Dabur India Limited · 2019-07-19 · Dabur India Limited Investor Communication ... Vatika Menz...
Dabur India Limited
Investor Communication
Quarter ended 30th June 2019
1
2
Contents
1. Q1 FY20 – Overview
4. Product Launches
2. Category Highlights – Q1 FY20
5. International Business
3. Consumer/ Marketing Initiatives
6. Profit & Loss Statements
3
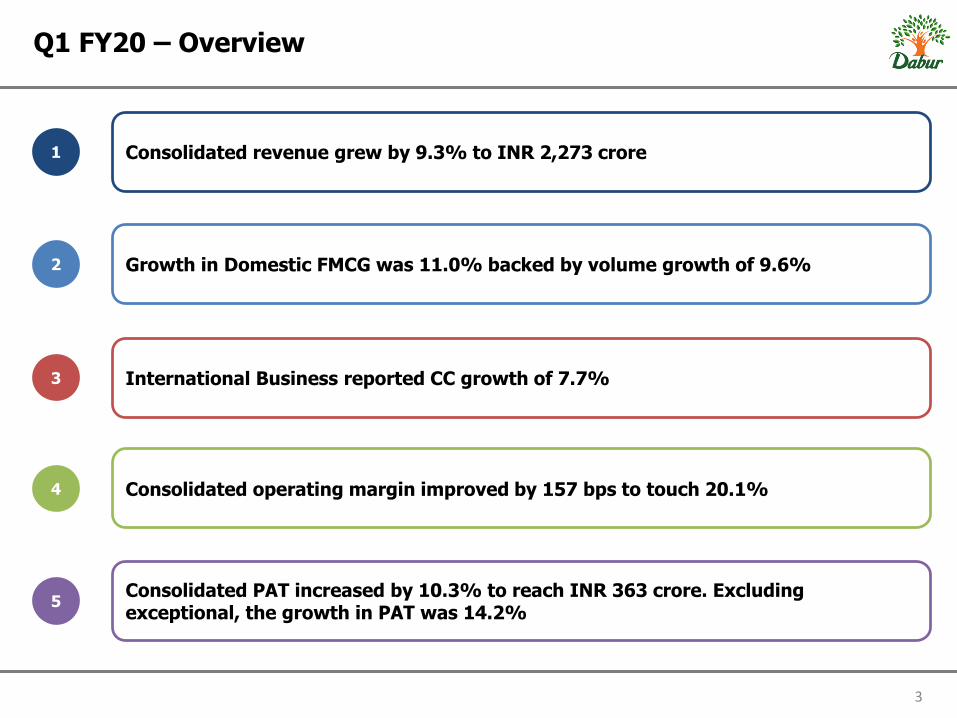
Q1 FY20 – Overview
1 Consolidated revenue grew by 9.3% to INR 2,273 crore
2 Growth in Domestic FMCG was 11.0% backed by volume growth of 9.6%
3 International Business reported CC growth of 7.7%
Consolidated operating margin improved by 157 bps to touch 20.1%4
Consolidated PAT increased by 10.3% to reach INR 363 crore. Excluding exceptional, the growth in PAT was 14.2%
5
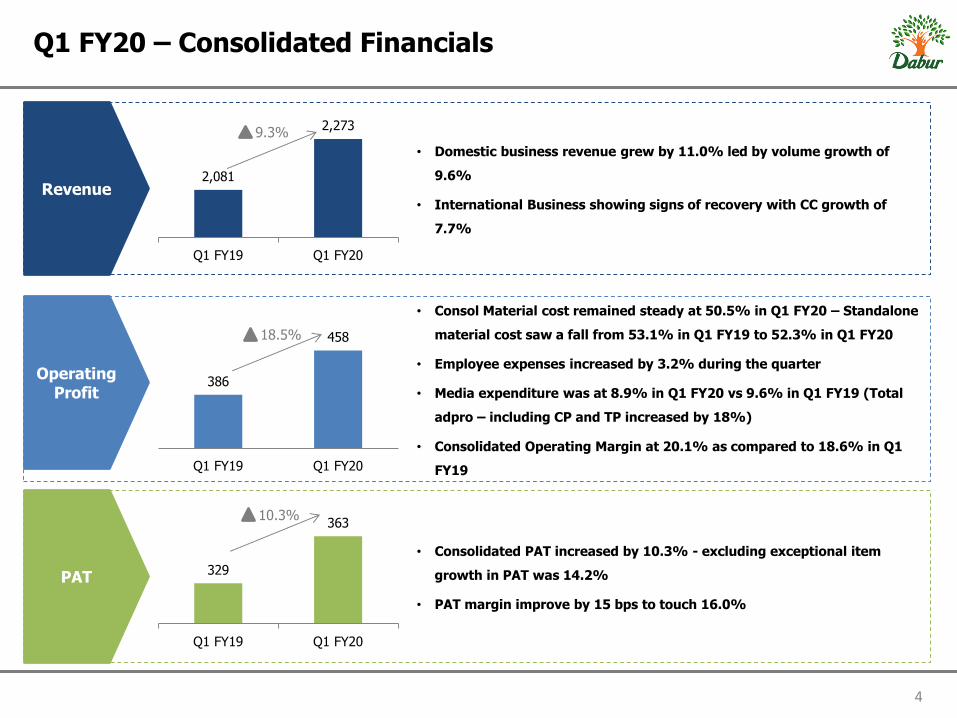
• Consolidated PAT increased by 10.3% - excluding exceptional item
growth in PAT was 14.2%
• PAT margin improve by 15 bps to touch 16.0%
• Consol Material cost remained steady at 50.5% in Q1 FY20 – Standalone
material cost saw a fall from 53.1% in Q1 FY19 to 52.3% in Q1 FY20
• Employee expenses increased by 3.2% during the quarter
• Media expenditure was at 8.9% in Q1 FY20 vs 9.6% in Q1 FY19 (Total
adpro – including CP and TP increased by 18%)
• Consolidated Operating Margin at 20.1% as compared to 18.6% in Q1
FY19
• Domestic business revenue grew by 11.0% led by volume growth of
9.6%
• International Business showing signs of recovery with CC growth of
7.7%
386
458
Q1 FY19 Q1 FY20
329
363
Q1 FY19 Q1 FY20
2,081
2,273
Q1 FY19 Q1 FY20
4
Q1 FY20 – Consolidated Financials
Revenue
Operating Profit
PAT
9.3%
18.5%
10.3%
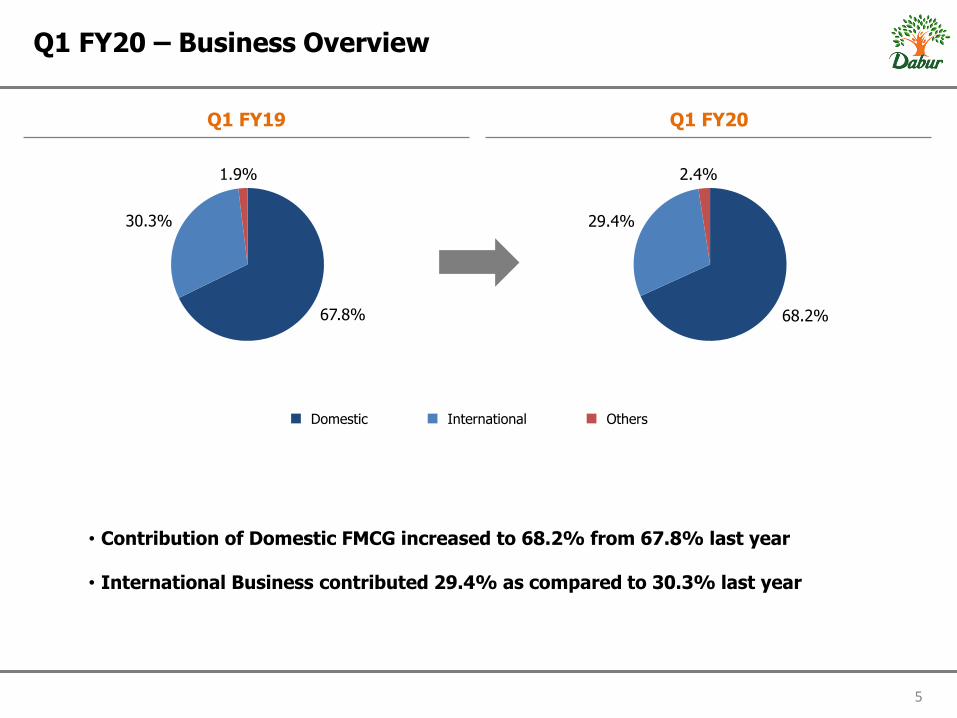
68.2%
29.4%
2.4%
67.8%
30.3%
1.9%
5
Q1 FY20 – Business Overview
Q1 FY19 Q1 FY20
Domestic International Others
• Contribution of Domestic FMCG increased to 68.2% from 67.8% last year
• International Business contributed 29.4% as compared to 30.3% last year
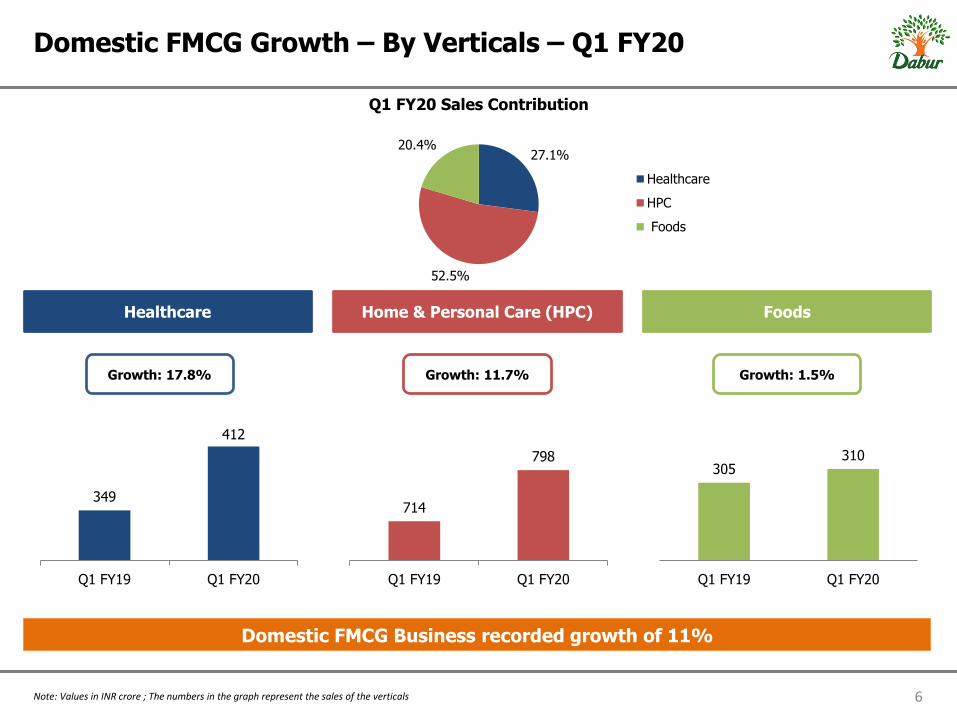
27.1%
52.5%
20.4%
Q1 FY20 Sales Contribution
Healthcare
HPC
Foods
305 310
Q1 FY19 Q1 FY20
714
798
Q1 FY19 Q1 FY20
349
412
Q1 FY19 Q1 FY20
6Note: Values in INR crore ; The numbers in the graph represent the sales of the verticals
Domestic FMCG Growth – By Verticals – Q1 FY20
Healthcare Home & Personal Care (HPC) Foods
Growth: 17.8% Growth: 11.7% Growth: 1.5%
Domestic FMCG Business recorded growth of 11%
7
Contents
1. Q1 FY20 – Overview
4. Product Launches
2. Category Highlights – Q1 FY20
5. International Business
3. Consumer/ Marketing Initiatives
6. Profit & Loss Statements
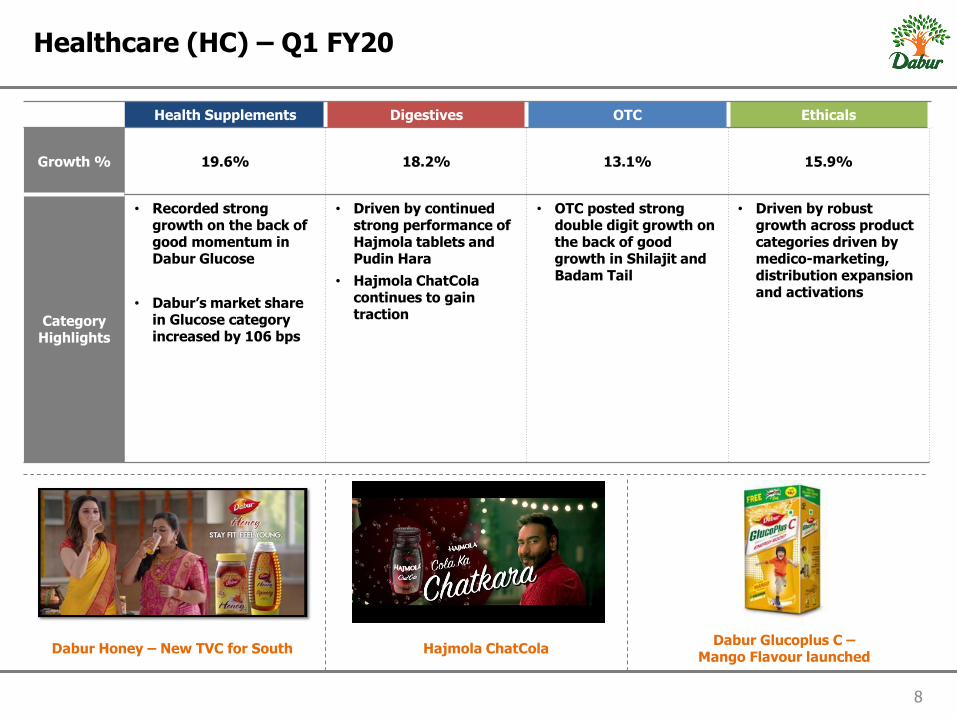
Health Supplements Digestives OTC Ethicals
Growth % 19.6% 18.2% 13.1% 15.9%
CategoryHighlights
• Recorded strong growth on the back of good momentum in Dabur Glucose
• Dabur’s market share in Glucose category increased by 106 bps
• Driven by continued strong performance of Hajmola tablets and Pudin Hara
• Hajmola ChatColacontinues to gain traction
• OTC posted strong double digit growth on the back of good growth in Shilajit and Badam Tail
• Driven by robust growth across product categories driven by medico-marketing, distribution expansion and activations
8
Healthcare (HC) – Q1 FY20
Hajmola ChatColaDabur Glucoplus C –
Mango Flavour launchedDabur Honey – New TVC for South
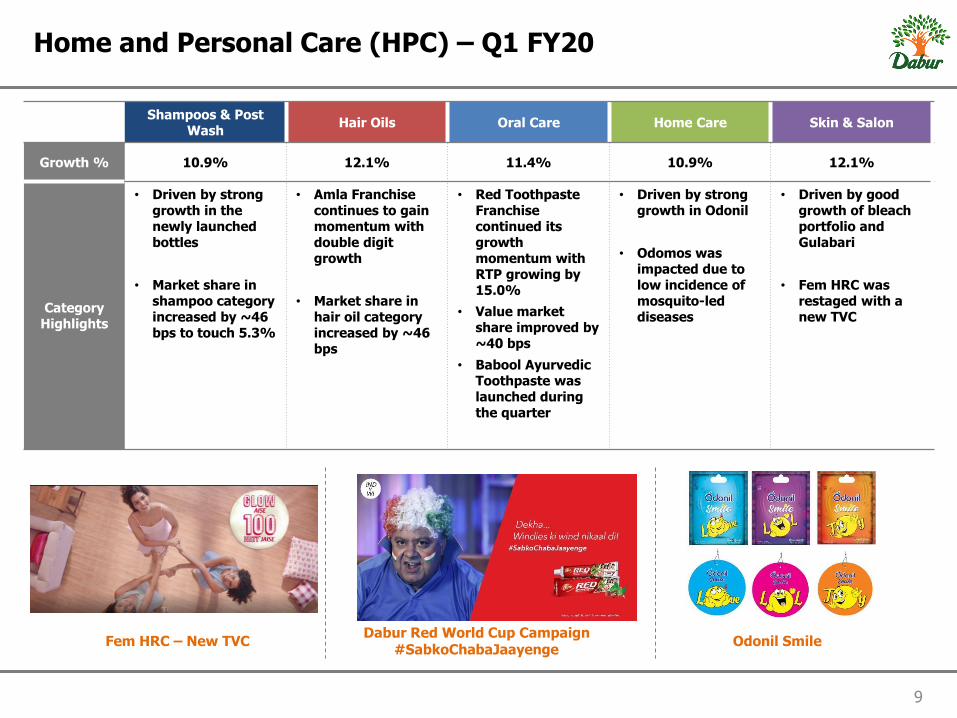
Shampoos & Post Wash
Hair Oils Oral Care Home Care Skin & Salon
Growth % 10.9% 12.1% 11.4% 10.9% 12.1%
Category Highlights
• Driven by strong growth in the newly launched bottles
• Market share in shampoo category increased by ~46 bps to touch 5.3%
• Amla Franchise continues to gain momentum with double digit growth
• Market share in hair oil category increased by ~46 bps
• Red Toothpaste Franchise continued its growth momentum with RTP growing by 15.0%
• Value market share improved by ~40 bps
• Babool Ayurvedic Toothpaste was launched during the quarter
• Driven by strong growth in Odonil
• Odomos was impacted due to low incidence of mosquito-led diseases
• Driven by good growth of bleach portfolio and Gulabari
• Fem HRC was restaged with a new TVC
9
Home and Personal Care (HPC) – Q1 FY20
Dabur Red World Cup Campaign #SabkoChabaJaayenge
Odonil SmileFem HRC – New TVC
10
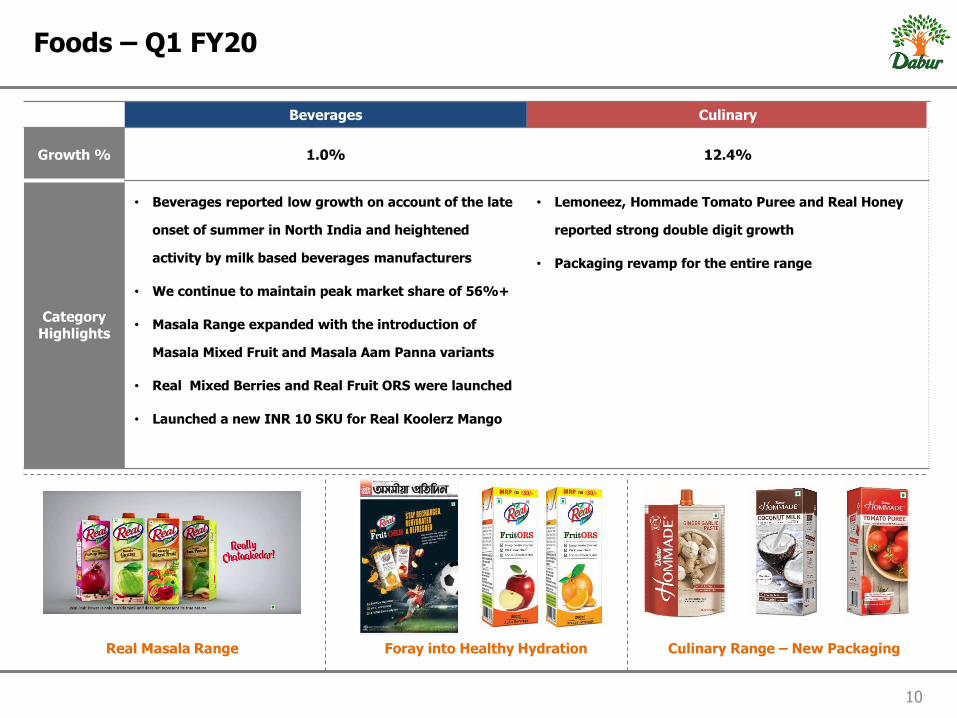
Foods – Q1 FY20
Foray into Healthy Hydration Culinary Range – New PackagingReal Masala Range
Beverages Culinary
Growth % 1.0% 12.4%
Category Highlights
• Beverages reported low growth on account of the late
onset of summer in North India and heightened
activity by milk based beverages manufacturers
• We continue to maintain peak market share of 56%+
• Masala Range expanded with the introduction of
Masala Mixed Fruit and Masala Aam Panna variants
• Real Mixed Berries and Real Fruit ORS were launched
• Launched a new INR 10 SKU for Real Koolerz Mango
• Lemoneez, Hommade Tomato Puree and Real Honey
reported strong double digit growth
• Packaging revamp for the entire range
11
Contents
1. Q1 FY20 – Overview
4. Product Launches
2. Category Highlights – Q1 FY20
5. International Business
3. Consumer/ Marketing Initiatives
6. Profit & Loss Statements
12
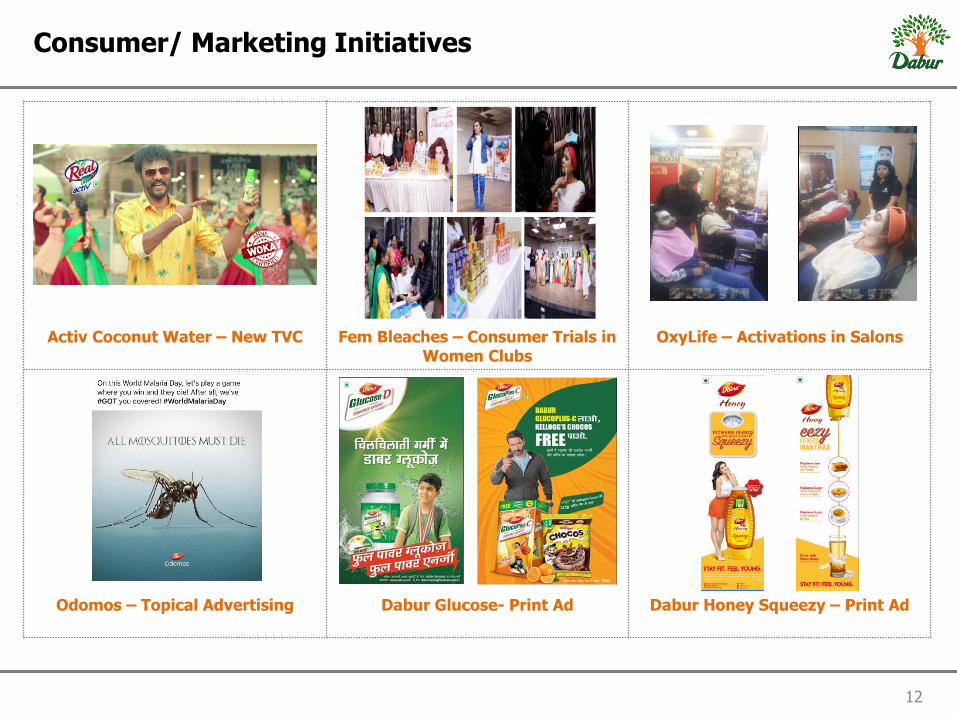
Consumer/ Marketing Initiatives
Activ Coconut Water – New TVC Fem Bleaches – Consumer Trials in Women Clubs
OxyLife – Activations in Salons
Odomos – Topical Advertising Dabur Glucose- Print Ad Dabur Honey Squeezy – Print Ad
13
Contents
1. Q1 FY20 – Overview
4. Product Launches
2. Category Highlights – Q1 FY20
5. International Business
3. Consumer/ Marketing Initiatives
6. Profit & Loss Statements
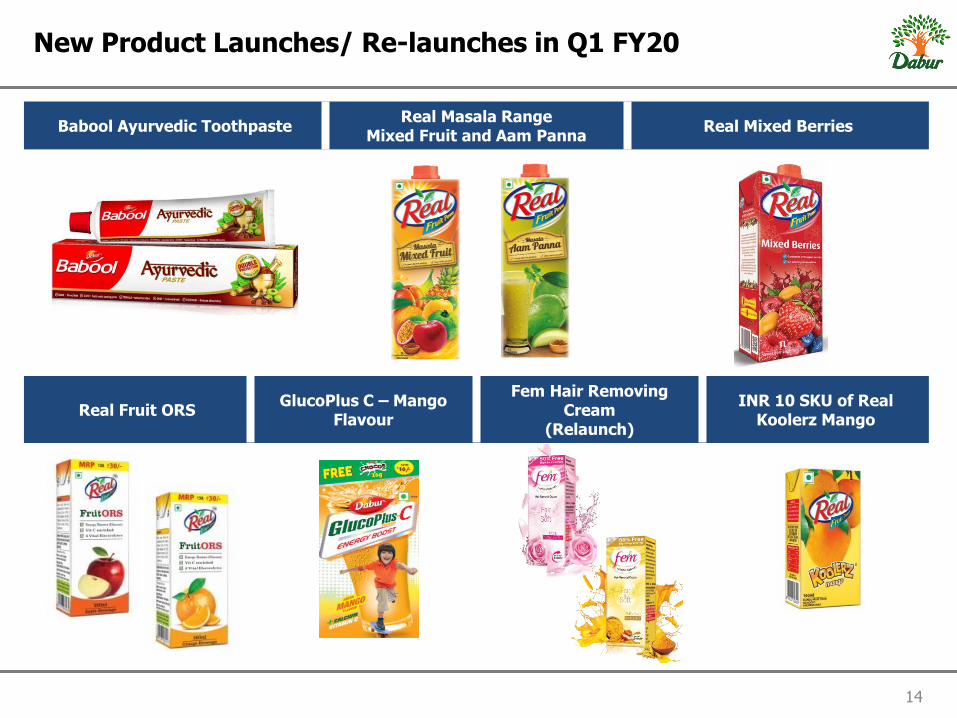
Real Fruit ORSGlucoPlus C – Mango
Flavour
Fem Hair Removing Cream
(Relaunch)
INR 10 SKU of Real Koolerz Mango
14
New Product Launches/ Re-launches in Q1 FY20
Babool Ayurvedic ToothpasteReal Masala Range
Mixed Fruit and Aam PannaReal Mixed Berries
15
Contents
1. Q1 FY20 – Overview
4. Product Launches
2. Category Highlights – Q1 FY20
5. International Business
3. Consumer/ Marketing Initiatives
6. Profit & Loss Statements
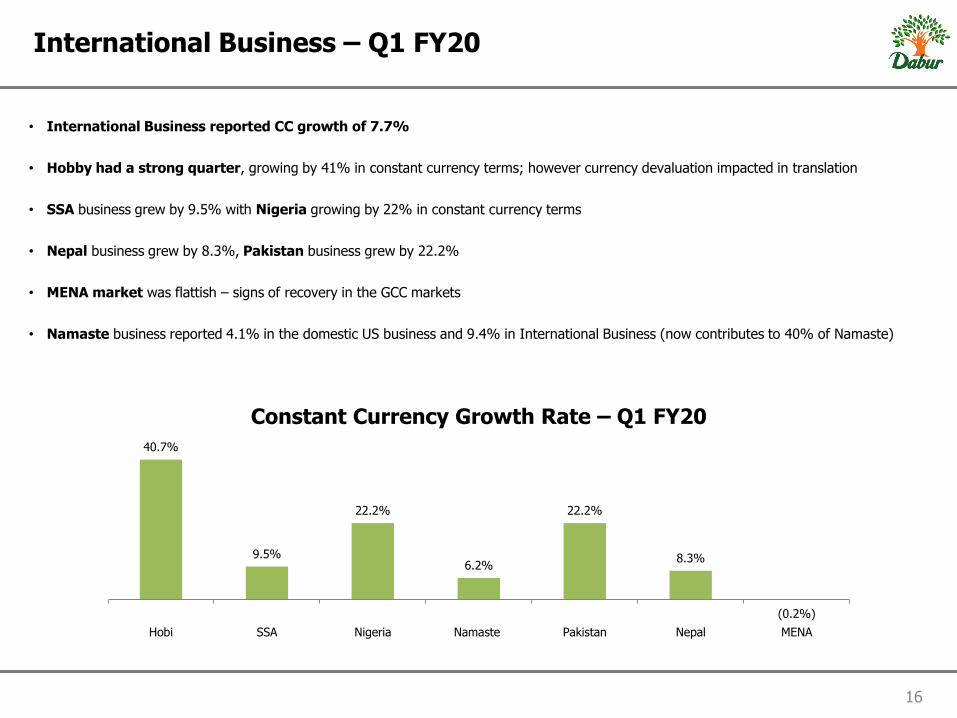
40.7%
9.5%
22.2%
6.2%
22.2%
8.3%
(0.2%)
Hobi SSA Nigeria Namaste Pakistan Nepal MENA
Constant Currency Growth Rate – Q1 FY20
16
International Business – Q1 FY20
• International Business reported CC growth of 7.7%
• Hobby had a strong quarter, growing by 41% in constant currency terms; however currency devaluation impacted in translation
• SSA business grew by 9.5% with Nigeria growing by 22% in constant currency terms
• Nepal business grew by 8.3%, Pakistan business grew by 22.2%
• MENA market was flattish – signs of recovery in the GCC markets
• Namaste business reported 4.1% in the domestic US business and 9.4% in International Business (now contributes to 40% of Namaste)
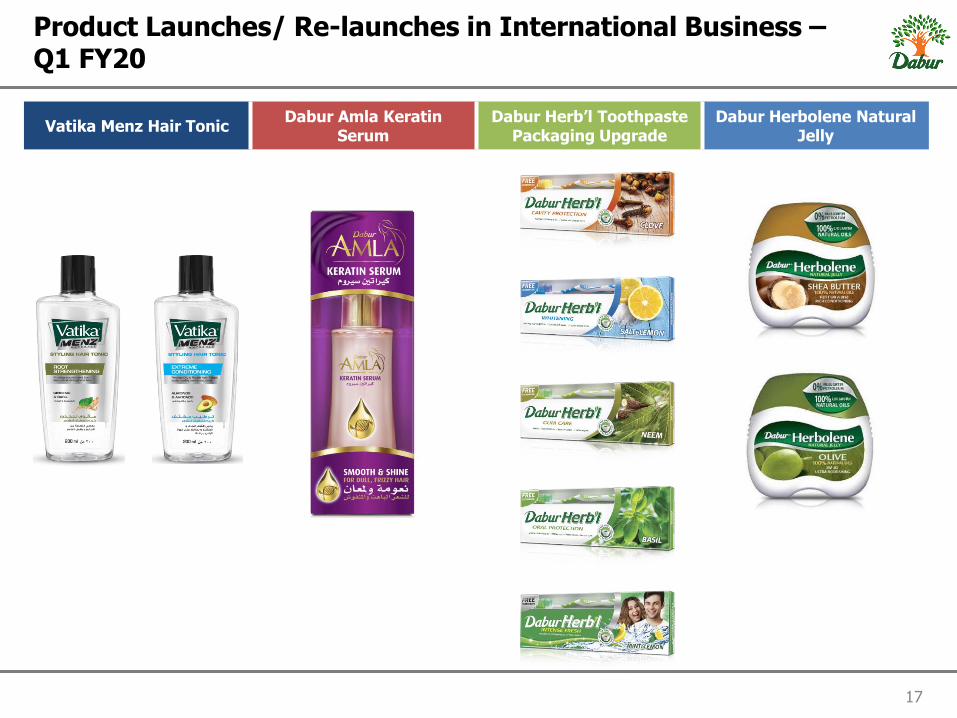
Vatika Menz Hair TonicDabur Amla Keratin
SerumDabur Herb’l Toothpaste
Packaging UpgradeDabur Herbolene Natural
Jelly
17
Product Launches/ Re-launches in International Business –Q1 FY20
18
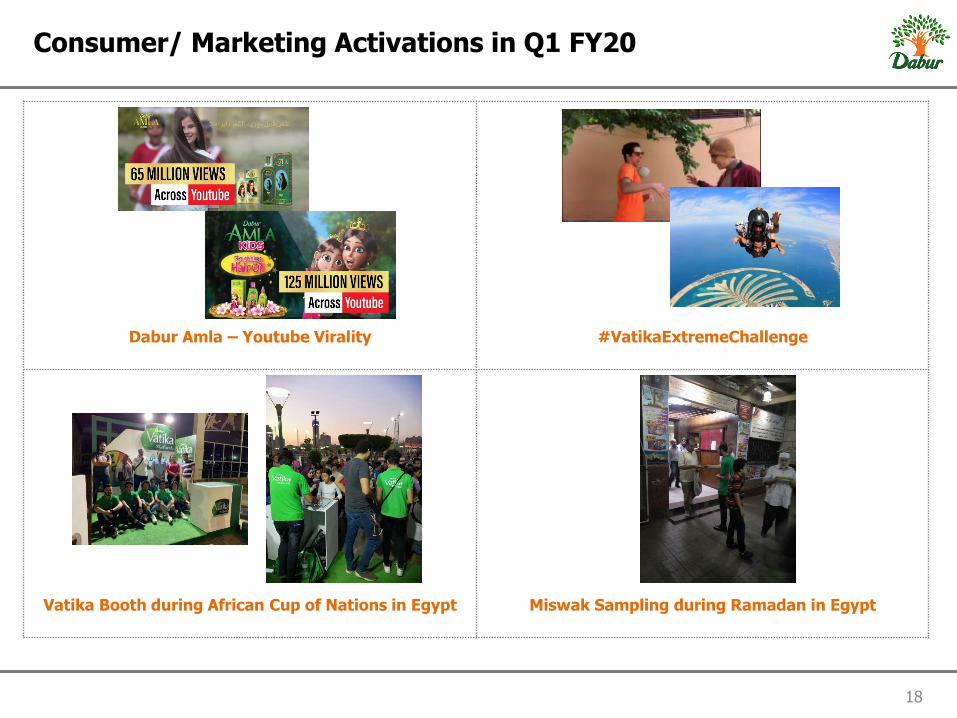
Consumer/ Marketing Activations in Q1 FY20
Dabur Amla – Youtube Virality #VatikaExtremeChallenge
Vatika Booth during African Cup of Nations in Egypt Miswak Sampling during Ramadan in Egypt
19
Contents
1. Q1 FY20 – Overview
4. Product Launches
2. Category Highlights – Q1 FY20
5. International Business
3. Consumer/ Marketing Initiatives
6. Profit & Loss Statements
20Note: All figures are in INR crores, unless otherwise stated
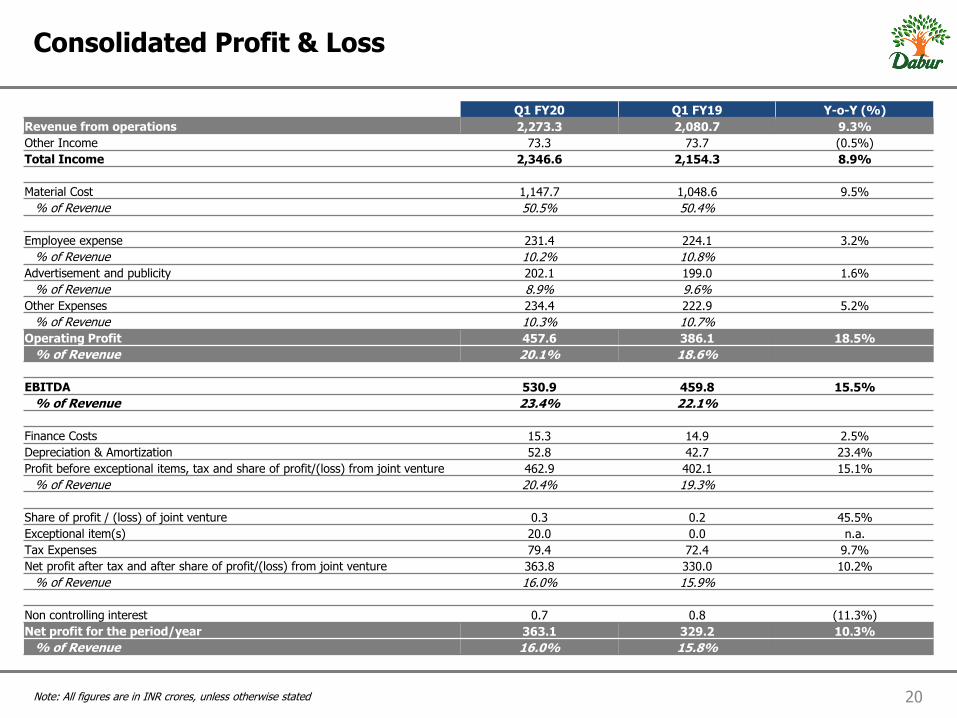
Consolidated Profit & Loss
Q1 FY20 Q1 FY19 Y-o-Y (%)
Revenue from operations 2,273.3 2,080.7 9.3%
Other Income 73.3 73.7 (0.5%)
Total Income 2,346.6 2,154.3 8.9%
Material Cost 1,147.7 1,048.6 9.5%
% of Revenue 50.5% 50.4%
Employee expense 231.4 224.1 3.2%
% of Revenue 10.2% 10.8%
Advertisement and publicity 202.1 199.0 1.6%
% of Revenue 8.9% 9.6%
Other Expenses 234.4 222.9 5.2%
% of Revenue 10.3% 10.7%
Operating Profit 457.6 386.1 18.5%
% of Revenue 20.1% 18.6%
EBITDA 530.9 459.8 15.5%
% of Revenue 23.4% 22.1%
Finance Costs 15.3 14.9 2.5%
Depreciation & Amortization 52.8 42.7 23.4%
Profit before exceptional items, tax and share of profit/(loss) from joint venture 462.9 402.1 15.1%
% of Revenue 20.4% 19.3%
Share of profit / (loss) of joint venture 0.3 0.2 45.5%
Exceptional item(s) 20.0 0.0 n.a.
Tax Expenses 79.4 72.4 9.7%
Net profit after tax and after share of profit/(loss) from joint venture 363.8 330.0 10.2%
% of Revenue 16.0% 15.9%
Non controlling interest 0.7 0.8 (11.3%)
Net profit for the period/year 363.1 329.2 10.3%
% of Revenue 16.0% 15.8%
21Note: All figures are in INR crores, unless otherwise stated
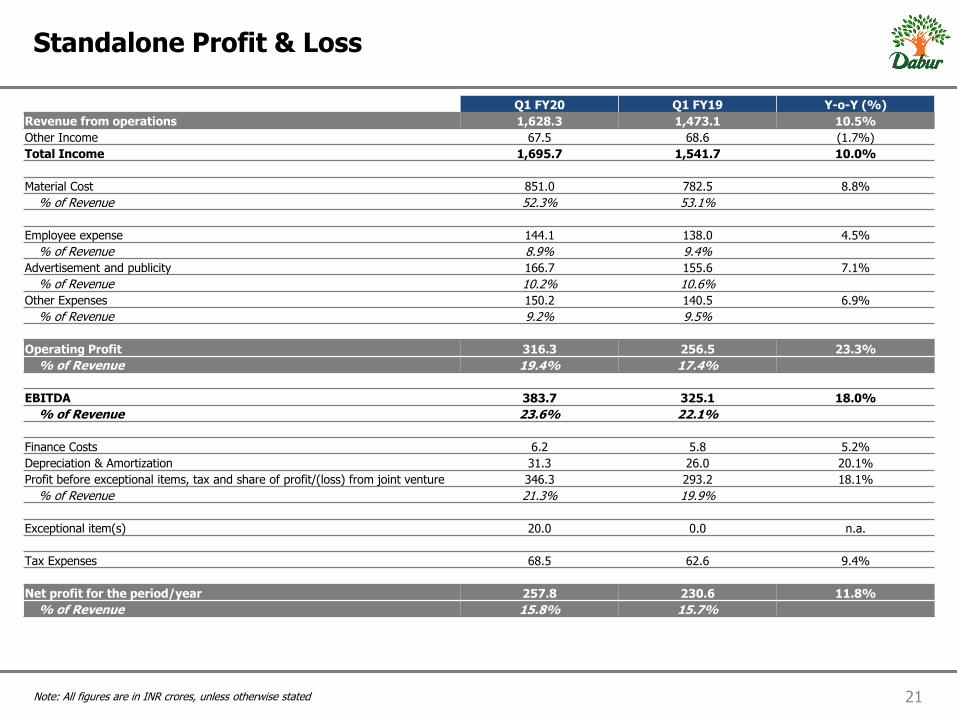
Standalone Profit & Loss
Q1 FY20 Q1 FY19 Y-o-Y (%)
Revenue from operations 1,628.3 1,473.1 10.5%
Other Income 67.5 68.6 (1.7%)
Total Income 1,695.7 1,541.7 10.0%
Material Cost 851.0 782.5 8.8%
% of Revenue 52.3% 53.1%
Employee expense 144.1 138.0 4.5%
% of Revenue 8.9% 9.4%
Advertisement and publicity 166.7 155.6 7.1%
% of Revenue 10.2% 10.6%
Other Expenses 150.2 140.5 6.9%
% of Revenue 9.2% 9.5%
Operating Profit 316.3 256.5 23.3%
% of Revenue 19.4% 17.4%
EBITDA 383.7 325.1 18.0%
% of Revenue 23.6% 22.1%
Finance Costs 6.2 5.8 5.2%
Depreciation & Amortization 31.3 26.0 20.1%
Profit before exceptional items, tax and share of profit/(loss) from joint venture 346.3 293.2 18.1%
% of Revenue 21.3% 19.9%
Exceptional item(s) 20.0 0.0 n.a.
Tax Expenses 68.5 62.6 9.4%
Net profit for the period/year 257.8 230.6 11.8%
% of Revenue 15.8% 15.7%

For more information & updates, visit : http://www.dabur.com/in/en-us/investor