Inside the pond: an analysis of Northeast Asia's long-term ...
16
HAL Id: halshs-01338116 https://halshs.archives-ouvertes.fr/halshs-01338116 Submitted on 27 Jun 2016 HAL is a multi-disciplinary open access archive for the deposit and dissemination of sci- entific research documents, whether they are pub- lished or not. The documents may come from teaching and research institutions in France or abroad, or from public or private research centers. L’archive ouverte pluridisciplinaire HAL, est destinée au dépôt et à la diffusion de documents scientifiques de niveau recherche, publiés ou non, émanant des établissements d’enseignement et de recherche français ou étrangers, des laboratoires publics ou privés. Inside the pond : an analysis of Northeast Asia’s long-term maritime dynamics César Ducruet To cite this version: César Ducruet. Inside the pond : an analysis of Northeast Asia’s long-term maritime dynamics. International Journal of Maritime Affairs and Fisheries, Korea Maritime Institute, 2015, 7 (2), pp.25- 40. halshs-01338116
Transcript of Inside the pond: an analysis of Northeast Asia's long-term ...

HAL Id: halshs-01338116https://halshs.archives-ouvertes.fr/halshs-01338116
Submitted on 27 Jun 2016
HAL is a multi-disciplinary open accessarchive for the deposit and dissemination of sci-entific research documents, whether they are pub-lished or not. The documents may come fromteaching and research institutions in France orabroad, or from public or private research centers.
L’archive ouverte pluridisciplinaire HAL, estdestinée au dépôt et à la diffusion de documentsscientifiques de niveau recherche, publiés ou non,émanant des établissements d’enseignement et derecherche français ou étrangers, des laboratoirespublics ou privés.
Inside the pond : an analysis of Northeast Asia’slong-term maritime dynamics
César Ducruet
To cite this version:César Ducruet. Inside the pond : an analysis of Northeast Asia’s long-term maritime dynamics.International Journal of Maritime Affairs and Fisheries, Korea Maritime Institute, 2015, 7 (2), pp.25-40. �halshs-01338116�

Inside the pond: an analysis of Northeast Asia’s long-term
maritime dynamics
Published in: International Journal of Maritime Affairs and Fisheries, Korea Maritime
Institute, Vol. 7, No. 2, pp. 25-40.
César DUCRUET
French National Centre for Scientific Research (CNRS)
Abstract
The analysis of historical vessel movements is proposed in this paper to compare recent
Northeast Asian port and maritime dynamics with previous development stages back to the
late nineteenth century. The changing distribution of vessel calls at and between Northeast
Asian ports reveals important shifts of maritime connectivity over time, from the emergence
of Japan as the dominant player in the region to a present-day more complex pattern with
Hong Kong, Busan, and Shanghai as the major hubs. The analysis also underlines the uneven
importance of domestic, intraregional, and extraregional flows as well as the existence of
localized, peripheral subnetworks including small and medium-sized ports.
Keywords: historical geography; maritime network; Northeast Asia; port system; vessel
movements
1. Introduction
Despite its potential role as a gateway for the Europe-Asia land bridge, Northeast Asia1
remains, more than ever, a maritime region where sea transport is the principal mean of cargo
distribution domestically and internationally. While the region’s history is well-known and
subject to numerous scholarly works, especially in the field of trade, logistics, and
transportation (see Gipouloux, 2011; Rimmer, 2007, 2014), the precise evolution of its port
system and maritime network is less (Ducruet, 2015a). Scholars proposing a long-term
perspective on port development put much emphasis on one specific port or country, such as
China (see a review by Wang and Ducruet, 2013), while region-wide analyses mainly focused
on container flows in the recent period only (Ducruet et al., 2010). The network approach
combined with a historical perspective can provide new answers to fundamental questions
about network growth dynamics in general and port system evolution in particular, as well as
novel views about the uneven impacts of technological change and diffusion. Such an
approach proved particularly helpful to understand regional integration processes in light of
changing maritime connectivity patterns, for instance in North Africa (Mohamed-Chérif and
Ducruet, 2014) and Southern Africa (Fraser et al., 2014).
It is the goal of this paper to go back in time and investigate what has been the form and
mechanism of transformation of the maritime network in Northeast Asia. One possibility is to
verify how much geography and technology have mattered in the centrality shifts among
Northeast Asian ports. Centrality in this paper is understood from the perspective of graph
theory, or network science, where ports are defined as nodes in a network made of inter-port
vessel movements. Thus, port centrality refers to various local, port-level measures such as
1 In this paper, Northeast Asia is referred to as a region including China, Japan, Taiwan, Far-East Russia, and the
Korean Peninsula.

the number of links of each port (i.e. degree centrality) or the number of shortest paths on
which each port is situated (i.e. betweenness centrality). Another originality of this paper is to
make use of a largely untapped source of information, namely the vessel movement historical
database published by Lloyd’s List called the Shipping Index, to map and analyse maritime
flows and networks. One publication was extracted in table format every five years or so
between 1890 and 2008, which details the last known inter-port movement of each vessel at
the time of the publication around March-April. As the time coverage is very partial, such a
source may not fully reflect yearly port dynamics, but rather, provide a rough picture of past
trends. Further efforts are being done to extract more systematically this source with the goal
of constituting more complete time series of traffic data (Ducruet, 2015b). An originality of
the study is that it encompasses the whole fleet of vessels whereas most former works on
Asian ports focused on container traffics in the recent period.
The remainders of this paper are organized as follows. The second section examines the
results of data extraction from the statistical source and explores the long-term evolution of
maritime traffics to highlight main fluctuations. In a third section, we particularly focus on the
topological and geographic structure of the network to shed more light on which ports
increased their roles in the Northeast Asian maritime network at the expense of others. Lastly
we discuss the main results and their implication for current and future Northeast Asian port
development.
2. Traffic evolution and distribution
Counting the number of vessel calls for the whole of Northeast Asia is a fruitful exercise to
estimate the region’s changing importance in world trade (Figure 1). Until the 1950s, total
Northeast Asian maritime traffic had increased within reasonable limits, oscillating around 4-
5% share of world traffic on average. The trend has been marked by certain shocks such as
the sudden increase of 1905, probably caused by trade support to the Russo-Japanese War, the
decline due to the First World War (1915) and following the Second World War (1951), the
rise of the 1930s and 1940s being explained by the effects of Japan’s colonial rule in East
Asia and the European presence in China (Gipouloux, 2011).
Subsequently, the share of Northeast Asia in world maritime traffic rapidly increased from
7.7% in 1960 to 17.5% in 2008. Such an evolution can illustrate only partly the overall shift
of economic and maritime activity from the Atlantic to the Pacific (Ducruet, 2015b), backed
by the independence of formerly colonial countries and the transformation of Hong Kong,
Taiwan, and South Korea into newly industrialized countries from the 1960s onwards, with an
export-led development strategy. The period 1980-1995 is marked by the effects of China’s
Open Door Policy following a similar economic model.
[Insert Figure 1 about here]
Another aspect of changing traffic dynamics is obtained by looking at the distribution of
vessel calls per country in absolute and relative values (Figure 2). Japan has always been the
region’s dominant traffic concentration, except in 1890-1895, in 1910, and in 2008 when it
ranked second after China. Although Japan’s evolution is in line with the Northeast Asian
trend, it underwent stabilization and slowdown since the 1980s, compared with the much
faster growth of Taiwan, South Korea, China, and Hong Kong. Far East Russia went through
wide traffic fluctuations along the period, with also a slowdown since the 1980s but
compensated by a recent revival. North Korea, which traffic is recorded since the 1930s only

(at that time being part of a unified yet occupied Korea), experienced rapid growth up to the
1980s and rapid decline since then, as explore more specifically in previous research (Ducruet
et al., 2009a), such a trend being caused by combined geopolitical and economic factors.
[Insert Figure 2 about here]
Such evolutions clearly confirm the influence of historical changes on traffic evolution and
distribution among Northeast Asian countries. In addition, such countries have been more or
less focusing on Northeast Asia itself as the origin or destination of their maritime linkages.
Measuring the share of intraregional flows (Figure 3) provides interesting information on the
region’s importance by country; it corresponds to the share of intraregional vessel movements
in the total excluding domestic movements. For most countries, intraregional traffic increased
rapidly in the second half of the period, i.e. following the Second World War and alongside
new industrial developments. Such a trend may suggest a dynamic of regional integration. As
the region’s oldest industrial country, Japan had long been the most outward-looking
economy through its long-distance connexions with North America, Oceania, and Europe.
Due to the technological gaps with world shipping standards, Chinese ports connected
principally the world network via Hong Kong in the early days of the 1978 reform, while
Hong Kong itself became more and more a hub and gateway for Mainland China (Wang,
1998). From manufacturing centres serving external (global) interests, South Korea and
Taiwan became increasingly embedded in regional economic networks (Lee and Rodrigue,
2006), but still with a higher proportion of long-distance linkages in their total maritime
activity. Comparatively, North Korea and Far East Russia had become more local since the
1990s already, suffering from the difficult restructuring of their trade networks following the
collapse of the Soviet Union.
[Insert Figure 3 about here]
A zoom on China and Japan is provided to better understand their particularities (Figure 4). In
both cases, the amount of extraregional maritime flows always surpassed intraregional and
domestic flows. Both countries went through drastic decline around 1950 for different
reasons: a major political change in China with the proclamation of the People’s Republic
(1949) and the war effects on Japan’s economy in general. Nevertheless, long-distance
maritime trade resumed rather rapidly in both cases, but while China continued to grow up to
2008, Japan went through drastic decline since 1990. This latter trend can be explained by the
fact that our analysis considers vessel calls instead of vessel tonnage. Fewer vessel calls may
hide increasing vessel size and therefore growing trade, especially in a context of growing
ship sizes in container shipping. Such a bias was compensated for China due to the continued
growth of vessel calls, notwithstanding a drop in 2000 for similar reasons. Another interesting
difference between the two countries is the much higher importance of domestic (coastal)
shipping for Japan than for China, as it always surpassed intraregional flows.
[Insert Figure 4 about here]
Last but not least, it is possible to measure the respective traffic of sailing and steamer vessels
by country and on the level of the whole region compared with world average (Table 1). The
share of steamer vessels in total traffic is a good indicator of the successful technological
transition in port and shipping operations. As such, Northeast Asia as a whole had always
been more advanced than world average, with a 20-30% higher share of steamer vessel traffic
all over the period 1890-1925; subsequently sailing vessels became almost non-existent

except in Europe and the West Indies. Japan and Russia had been faster to adopt innovations
due to their earlier industrialisation (Japan) and strong focus on heavy industries and
shipbuilding (Russia). Analyzing the extent to which steamer traffic has also varied among
Northeast Asian ports would go beyond the aim and scope of this study. Therefore, next
section concentrates on total traffic to measure network dynamics and port evolutions.
[Insert Table 1 about here]
3. Network structure and port hierarchy
3.1 Overall topology
The Northeast Asian maritime network is made of all inter-port vessel movements for each
year under study. The overlap of these movements provided a port-to-port matrix, weighted
by the number of movements. Appendix 1 is provided as a benchmark upon which network
analysis results can be confronted as it simply represents the port hierarchy based on the
number of vessel calls, but without the representation of their linkages.
In terms of network size (Figure 5), the observed evolution confirms the aforementioned
traffic evolution based on vessel calls. Yet, the number of links increased faster than the
number of nodes (ports) in the network, especially since 1960. This confirms our earlier
finding that intraregional flows gained in importance during that second half of the study
period. More links imply increased regional connectivity and hence, more probability for
regional ports to permit smooth cargo distribution within the area. However, while the
concentration ratio of vessel calls among ports did not witness any substantial change over
time (Gini coefficient), the clustering coefficient went through rapid decline since 1960. This
measure is one key indicator of network structure (Ducruet and Lugo, 2012) as it tells us how
much nodes’ neighbours are also connected to each other. Higher values indicate harmonious
or homogenous connectivity among ports, while lower values and especially decreasing
values suggest the emergence of a hub-and-spokes structure, i.e. a rather heterogeneous
connectivity with few large ports and many small ports, and a centralization of links at hub
locations.
Thus, what had appeared as a possible sign of regional integration (i.e. growing intraregional
flows) might in fact be explained by growing transhipment and transit trade among
neighbouring country ports. Economic development since the 1960s not only created more
opportunities for freight distribution, but also it exacerbated competition and specialisation
among Northeast Asian ports.
[Insert Figure 5 about here]
3.2 Hub ports and subcomponents
A look at the evolution of inter-port flows reveals interesting trends which were not visible
only by looking at the volume of port calls. Table 2 provides the ranking of the top five ports
by year, and the discussion is based on the evolving shape of the network and its principal
hubs and components that emerge over time, but which were not all visualized for the sake of
space (see Figure 6 for a look at four key years between 1960 and 2008). In 1890, Hong Kong
and Xiamen are the two main hubs of the region, with the first centralizing Japanese flows
and the second mostly Chinese and Taiwanese flows. But these two hubs centralize two

unconnected components. It can be suggested that the fragmented network echoes earlier
findings on the dominant core-periphery pattern, which lowers the probability for local,
intraregional linkages to exist.
[Insert Table 2 about here]
[Insert Figure 6 about here]
In 1895 however, there is only one tightly connected system with Hong Kong as the main hub
followed by Kobe and Shanghai. Transversal linkages occur among Chinese ports (domestic,
coastal shipping) but their majority remains at the periphery of the system, as terminal nodes
(spokes). In 1900, the pattern is similar but Shanghai became the dominant hub (16 links)
before Hong Kong (8) and Kobe (4), with its links equally distributed towards Japanese and
Chinese ports. Due to the Russo-Japanese War (1904-1905), Dalian disappeared from the
network in 1905, causing high growth at Yantai, another Chinese port situated just across the
Bohai Rim in Shandong province. Interestingly, Busan and Incheon emerge in the network
but mostly connected to Japanese ports, probably as a reflection of Japan’s presence in Korea
at the time (naval bases). High growth is also felt at Vladivostok in such context, connected
with the main hubs (Shanghai, Hong Kong), as the main connexion port for the Russian Baltic
fleet coming for the Battle of Tsushima. Military operations have without any doubt altered
commercial routes and ports.
The situation had resumed by 1910, going back to the one in 1900 with Shanghai as the main
hub (11 links) followed by Kobe (10), Yokohama (9), Vladivostok (6), and Hong Kong (6).
The system remains stable in 1915 with a polycentric structure centred upon Shanghai, Hong
Kong, Yokohama, and Vladivostok with comparable degree centrality. These hubs have no
particular geographic specialization as they all connect a balanced number of Chinese and
Japanese ports. In 1920 however, major hub ports connect each other while being bound to a
specific country: Shanghai and China, Hong Kong and Taiwan, South China, Japan, and
Yokohama and Kobe with mostly Japan. Vladivostok, a second-order hub port, connected all
countries except Hong Kong. To be noted is Incheon, Korea’s only port in the network at the
time, with only one link to Moji in Japan. Indeed since 1910 officially, Korea belongs to the
Japanese Empire and Incheon served as a major gateway port towards Seoul and the rest of
the peninsula. No major change affected the network in 1925. In 1930, Yokohama became a
much bigger hub with 30 links, followed by Hong Kong (17) and Shanghai (13). This reflects
Japan’s growth based on industrialisation, trade, and conquest. Interestingly, Busan and
Incheon only connect Shanghai. The overwhelming dominance of Yokohama and other
Japanese ports continues in 1935, especially given the occupation of parts of China by Japan,
until 1945. This dominance is well reflected in the geographic homogeneity of the network
where important hubs are fully connected with Japan and do not exhibit anymore
specialization on a proximate range. It is still the case in 1940, with the notable difference that
Japan is represented by three major hubs (Yokohama, Kobe, Osaka) instead of only one and
still dominate Shanghai and Hong Kong, which rank far below. Incheon connects only
Shanghai, but Busan connects only Niigata (Japan).
A major change occurred by 1946, after the Second World War, as seen with the reduced
centrality of Japanese ports. Yokohama, despite its decline, still occupies a strong position
with 12 links, just after Shanghai (14) and even before Hong Kong (11), but it connects
mostly smaller ports, while Kobe and Osaka had vanished. The network goes back to previous
stages where Shanghai and Hong Kong primarily connected Chinese and Taiwanese ports. In

1951 however, Shanghai’s decline illustrates the effects of China’s major political change a
few years earlier (1949) to such an extent that it connects only Chinese ports in the region as
well as Hong Kong, which is the dominant hub (22 links) followed by Yokohama (20) and
Kobe (13), while Incheon and Busan connect only Japan. The decline of Japanese ports had
been nothing but temporary, as their dominance resumed as early as in 1960. Shanghai and
Dalian connect mostly Chinese ports and stand apart of the system, while Incheon and Busan
show contrasted behaviour: as the main gateway to Seoul, the first connects the large Japanese
hubs while the second only connects secondary East Sea ports such as Nakhodka, Fushiki,
Otaru, and Muroran. A subaltern network of peripheral ports emerges, composed of Niigata,
Fushiki, Vanino, and Tsuruga, to which are added Chongjin (North Korea), Akita,
Vladivostok, and Naoetsu in 1965, still standing apart from the core system centralized by
Yokohama, which has maintained its dominance in similar ways than in 1960. It is a rather
monocentric network polarized by one highly dominant node (Yokohama) and a few second-
order hubs. In 1970, the peripheral subnetwork centred upon Vladivostok and Niigata had
gained more importance with the inclusion of 13 ports of which Tokyo, Shimonoseki, and
other Japanese ports. This subnetwork became integrated in the main system in 1975, with
Nakhodka as the main secondary hub connected to Yokohama, still the dominant node.
A major break occurs in 1980 with an evolution towards a bipolar network structure based on
the high centrality of Hong Kong and Yokohama in relatively equal terms. Although Japanese
ports continue to dominate the port hierarchy, Hong Kong attracted a wide number of ports
under its dominance, mostly Chinese, Taiwanese, Korean, but also Russian, thereby
completely transforming the regional pattern. Incheon stands apart with a small subnetwork
including only Korean ports (Gunsan, Mokpo, Yosu) and Nagasaki. The high centrality of
Yokohama and its secondary hubs (Nagoya, Osaka, and Kobe) is in fact dominantly a
domestic shipping system organised around major urban concentrations, with the exception of
Nakhodka, a Russian port but centralizing only smaller and relatively peripheral Japanese
ports. This trend continues in 1985 as Hong Kong and Yokohama dominate two distinct
networks. The one with Hong Kong includes most Chinese ports but a growing number of
Japanese ports. A new feature is the role of Shanghai as a subordinate hub of Hong Kong, as
well as Kaohsiung (Taiwan) and Tokyo. Incheon still stands apart from the system and
includes mainly Korean ports in its small subnetwork (Yosu, Samchok, Ulsan, Gunsan,
Donghae) and Naoshima in Japan. The Japanese hubs remain mostly of domestic influence,
alongside Nakhodka and a few Chinese ports.
As the Chinese economy grows and Japan stabilizes, the subcomponent of Hong Kong had
become even larger than the one of Yokohama by 1990 in terms of the number of included
ports. As in the previous years, Busan emerges as a secondary hub and connects Kobe, while
Incheon still stands apart in a small subnetwork composed of Ulsan, Gwangyang,
Qinhuangdao, and Shimonoseki. The large component of Yokohama now only possesses
Kobe, Nagoya, and Osaka as second-order hubs, reflecting upon Japan’s shrinking influence
in the network. In 1995 this evolution reaches a peak with Hong Kong as the main hub of the
whole integrated system. Yokohama now appears as a secondary hub with only Nagoya and
Kobe under its direct influence. All other secondary hub primarily connect Hong Kong, such
as Tokyo, Nakhodka, Kaohsiung, but also Incheon, Busan, and Shanghai to a lesser extent.
Incheon appears more as a local, domestic hub while Busan is more specialized on Japanese
and Russian transhipment.
A major change occurred in 2000 with Busan becoming the major hub of the whole system.
However, the latter system had split amongst two main components: one with Busan and

Hong Kong as main nodes (with Osaka and Shanghai as secondary hubs) and the second
dominantly Japanese with Chiba, Nagoya, Yokohama, and Kobe as central nodes. Nakhodka
stands apart at the centre of a Far-East subgroup. In the last year under study (2008), the
aforementioned dynamics are prolonged as seen with a huge component centred upon Busan
and Hong Kong including several Korean (Onsan, Yosu), Chinese (Shanghai, Tianjin), and
Russian (Vladivostok) secondary hubs. Comparatively, a much smaller component including
Yokohama, Nagoya, and Chiba lies at the periphery, as well as another small group centred
upon Incheon and mostly dominating Chinese Yellow Sea ports.
4. Conclusion
The ambition of this paper was not to question the history of Asia and its ports, but rather, to
offer a new perspective on their long-term evolution. This was made possible using a largely
untapped data source, the Lloyd’s Shipping Index, which allowed for the first time to provide
a region-wide analysis based on one single measurement unit, the vessel call. Thus, despite
the drawbacks of such an approach (e.g. missing information on more local traffics such as
junk vessels, unrecorded ship movements, calls instead of vessel tonnage capacity, etc.),
Northeast Asian countries and ports could have been compared in a relatively objective
manner in terms of their ability to absorb a number of political, economic, and technological
changes and transitions in the last 120 years.
Main results are satisfactory is a sense that they convey a general snapshot of the Northeast
Asian port system at regular points in time since 1890, without too much discrepancy
compared with existing knowledge. The major traffic concentrations and hubs could have
been well identified as well as their geographic specialization and the precise turning points
where port hierarchies have shifted within the region. While traffic concentration in general
has been somewhat stable over the period, we observed a growing centralization of inter-port
links. This occurred at the advantage of Japanese hub ports, which superseded China and
Hong Kong as the region’s pivotal hub. In the 1990s, Hong Kong and South Korea became
the leading hubs as part of a more polycentric system, relegating Japan at the periphery. As
compared with previous research using similar methods, what became clear is the prominence
of transhipment hub ports, such as Busan, backed by ambitious port policies and investment.
This major shift toward Busan port could both confirm the spatial characteristics of modern
transhipment hubs (Fleming and Hayuth, 1994), such as the route and service optimality
required by increasingly global transport actors, and local dynamics stemming from the Kobe
earthquake in 1995. In particular, these results could confirm the more recent emergence of
South Korea as the leading maritime hub in Northeast Asia, based on the sole analysis of liner
shipping networks (Ducruet et al., 2009b), notwithstanding more local dynamics such as the
growing importance of local/regional hub ports like Incheon but also Onsan and Yeosu.
Many aspects motivate further research in such directions. For instance, the likely
reinforcement of the Arctic Sea Route may in the coming years or so modify profoundly the
current trends. As Northeast Asia is not a closed system, the study should be extended to East
Asia or the Asia-Pacific to grasp port dynamics in a more comprehensive way, without
naming the possibility to analyse in detail how Northeast Asian ports have evolved at the
global scale in the world maritime network. A better understanding of past and current port
dynamics at multiple scales shall provide novel views on the way future trends can be defined
and anticipated. This would necessitate to expand the time coverage of the current study to
include the post-2008 period.

Acknowledgements
The research leading to these results has received funding from the European Research
Council under the European Union's Seventh Framework Programme (FP/2007-2013) / ERC
Grant Agreement n. [313847] "World Seastems".
References
Ducruet C. (2015a) Asian cities in the global maritime network since the late nineteenth century, In:
Bracken G. (Ed), Asian Cities: From Colonial to Global, University of Amsterdam Press, pp. 173-186. Ducruet C. (2015b) Maritime Networks. Spatial Structures and Time Dynamics, Routledge Studies in
Transport Analysis, Routledge: London & New York (in press).
Ducruet C., Lee S.W., Ng A.K.Y. (2010) Centrality and vulnerability in liner shipping networks:
revisiting the Northeast Asian port hierarchy, Maritime Policy and Management, 37(1): 17-36.
Ducruet C., Lee S.W., Roussin S. (2009b) Local strength, global weakness: A maritime network
perspective on South Korea as Northeast Asia’s logistics hub. KMI International Journal of Maritime
Affairs and Fisheries, 1(1): 32-50.
Ducruet C., Lugo I. (2013) Structure and dynamics of transportation networks: Models, concepts, and
applications. In: Rodrigue J.P., Notteboom T.E., Shaw J. (Eds), The SAGE Handbook of Transport
Studies, SAGE Publications Ltd., pp. 347-364.
Ducruet C., Roussin S., Jo J.C. (2009a) Going West? Spatial polarization of the North Korean port
system, Journal of Transport Geography, 17(5): 357-368.
Fleming D.K., Hayuth Y. (1994) Spatial characteristics of transportation hubs: centrality and
intermediacy. Journal of Transport Geography, 2(1): 3-18.
Gipouloux F. (2011) The Asian Mediterranean: Port Cities and Trading Networks in China, Japan
and Southeast Asia, 13th-21st Century. Cheltenham and Northampton: Edward Elgar.
Lee J.Y., Rodrigue J.P. (2006) Trade reorientation and its effects on regional port systems: The Korea-
China link along the Yellow Sea Rim. Growth and Change, 37(4): 597-619.
Mohamed-Chérif F.Z., Ducruet C. (2015) Regional integration and maritime connectivity across the
Maghreb seaport system, Journal of Transport Geography, doi: 10.1016/j.jtrangeo.2015.01.013
Rimmer P.J. (2007) Port dynamics since 1965: Past patterns, current conditions and future directions.
Journal of International Logistics and Trade, 5(1): 75-97.
Rimmer P.J. (2014) Asian-Pacific Rim Logistics. Global Context and Local Policies. Cheltenham and
Northampton: Edward Elgar.
Wang C., Ducruet C. (2013) Regional resilience and spatial cycles: Long-term evolution of the
Chinese port system (221BC-2010AD), Tijdschrift voor Economische en Sociale Geografie, 104(5):
521-538.
Wang J.J. (1998) A container load center with a developing hinterland: a case study of Hong Kong.
Journal of Transport Geography, 6(3): 187-201.

1890 1895 1900 1905 1910 1915 1920 1925
China 56.2 67.6 77.8 88.4 99.3 99.2 98.9 99.4
Hong Kong 48.6 61.9 70.6 88.9 95.4 98.7 100.0 100.0
Japan 58.2 78.5 74.7 95.5 97.4 97.9 98.6 100.0
South Korea - - - 100.0 100.0 - - -
North Korea - - - 100.0 - - - -
Russia 70.0 82.4 90.5 97.6 98.3 100.0 96.0 100.0
Taiwan 10.0 33.3 - 100.0 85.7 100.0 100.0 100.0
Northeast Asia 53.9 70.7 75.5 92.2 97.9 98.7 98.9 99.8
World 36.6 45.6 59.3 71.2 82.1 87.3 88.9 97.2
Table 1: Share (%) of steamer vessels in total maritime traffic, 1890-1925
Source: own elaboration based on Lloyd’s Shipping Index
Year Port centrality ranking
1 2 3 4 5 6
1890 Hong Kong Xiamen Kobe Fuzhou Tainan -
1895 Hong Kong Shanghai Yokohama Kobe Nagasaki Shimonoseki
1900 Shanghai Hong Kong Yokohama Nagasaki Moji Kobe
1905 Kobe Hong Kong Shanghai Yokohama Nagasaki Shantou
1910 Shanghai Kobe Yokohama Vladivostok Moji Hong Kong
1915 Hong Kong Yokohama Shanghai Vladivostok Kobe Nagasaki
1920 Hong Kong Yokohama Shanghai Kobe Vladivostok Qinhuangdao
1925 Yokohama Shanghai Hong Kong Kobe Dalian Vladivostok
1930 Yokohama Hong Kong Shanghai Dalian Kobe Keelung
1935 Yokohama Hong Kong Shanghai Dalian Kobe Vladivostok
1940 Yokohama Kobe Hong Kong Shanghai Osaka Dalian
1946 Shanghai Yokohama Hong Kong Yokosuka Qingdao Qinhuangdao
1951 Hong Kong Yokohama Kobe Osaka Shanghai Fuzhou
1960 Yokohama Hong Kong Kobe Osaka Moji Nagoya
1965 Yokohama Moji Osaka Hong Kong Kobe Yawata
1970 Yokohama Hong Kong Kobe Vladivostok Osaka Nagoya
1975 Yokohama Kobe Osaka Nakhodka Nagoya Chiba
1980 Yokohama Hong Kong Osaka Kobe Nagoya Chiba
1985 Yokohama Kobe Hong Kong Nagoya Chiba Osaka
1990 Hong Kong Yokohama Nagoya Kobe Osaka Chiba
1995 Hong Kong Yokohama Tokyo Busan Ulsan Nagoya
2000 Busan Hong Kong Nagoya Kobe Ulsan Chiba
2008 Busan Hong Kong Shanghai Nagoya Onsan Tianjin
Table 2: Network centrality ranking of Northeast Asian ports, 1890-2008
Source: own elaboration based on Lloyd’s Shipping Index

Figure 1: Maritime traffic of Northeast Asia, 1890-2008
Source: own elaboration based on Lloyd’s Shipping Index
Figure 2: Evolution of maritime traffic by Northeast Asian country, 1890-2008
Source: own elaboration based on Lloyd’s Shipping Index

Figure 3: Share of intraregional traffic by Northeast Asian country, 1890-2008
Source: own elaboration based on Lloyd’s Shipping Index
N.B. the size expresses the share of interregional traffic (%) in total traffic, and the dark blue colour
applies to values over the country’s average over the period
Figure 4: Contrasted evolutions: China and Japan, 1890-2008
Source: own elaboration based on Lloyd’s Shipping Index
Figure 5: Network size and connectivity, 1890-2008
Source: own elaboration based on Lloyd’s Shipping Index

Figure 6: Hubs and subcomponents in the Northeast Asian maritime network, 1960-2008
Source: own elaboration based on Lloyd’s Shipping Index
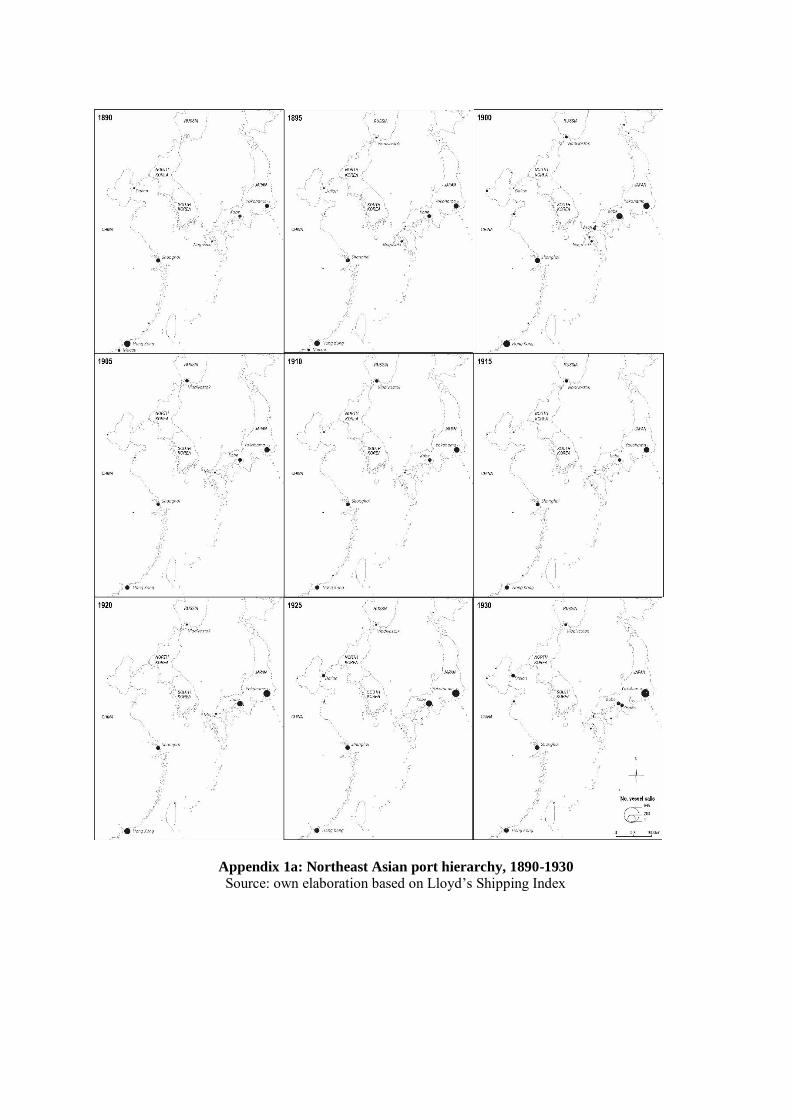
Appendix 1a: Northeast Asian port hierarchy, 1890-1930
Source: own elaboration based on Lloyd’s Shipping Index

Appendix 1b: Northeast Asian port hierarchy, 1935-1980
Source: own elaboration based on Lloyd’s Shipping Index

Appendix 1c: Northeast Asian port hierarchy, 1985-2008
Source: own elaboration based on Lloyd’s Shipping Index