
INNOVATIVE COUNTERMEASURES FOR REDUCING THE TRUCK …
76
i Center for Advanced Multimodal Mobility Solutions and Education Project ID: 2018 Project 14 INNOVATIVE COUNTERMEASURES FOR REDUCING THE TRUCK WAITING TIME AT MARINE TERMINALS Final Report by Yi Qi, Ph.D., P.E. (ORCID ID: https://orcid.org/0000-0002-6314-2626) Professor and Chair, Department of Transportation Studies,Texas Southern University Phone: 1-713-313-6809; Email: [email protected] Qun Zhao (ORCID ID: https://orcid.org/0000-0003-3760-9234) Research Associate, Department of Transportation Studies,Texas Southern University Phone: 1-713-313-1854; Email: [email protected] Mehdi Azimi, Ph.D., P.E. (ORCID ID: https://orcid.org/0000-0001-5678-0323) Assistant Professor, Department of Transportation Studies, Texas Southern University Phone: 1-713-313-1293; Email: [email protected] Hasin Jinna (ORCID ID: https://orcid.org/0000-0003-4289-1713) Graduate Research Assistant, Department of Transportation Studies, Texas Southern University Phone: 1-713-313-7532; Email: [email protected] for Center for Advanced Multimodal Mobility Solutions and Education (CAMMSE @ UNC Charlotte) The University of North Carolina at Charlotte 9201 University City Blvd,Charlotte, NC 28223 September 2019
Transcript of INNOVATIVE COUNTERMEASURES FOR REDUCING THE TRUCK …

i
Center for Advanced Multimodal Mobility
Solutions and Education
Project ID: 2018 Project 14
INNOVATIVE COUNTERMEASURES FOR REDUCING
THE TRUCK WAITING TIME AT MARINE
TERMINALS
Final Report
by
Yi Qi, Ph.D., P.E. (ORCID ID: https://orcid.org/0000-0002-6314-2626)
Professor and Chair, Department of Transportation Studies,Texas Southern University
Phone: 1-713-313-6809; Email: [email protected]
Qun Zhao (ORCID ID: https://orcid.org/0000-0003-3760-9234)
Research Associate, Department of Transportation Studies,Texas Southern University
Phone: 1-713-313-1854; Email: [email protected]
Mehdi Azimi, Ph.D., P.E. (ORCID ID: https://orcid.org/0000-0001-5678-0323)
Assistant Professor, Department of Transportation Studies, Texas Southern University
Phone: 1-713-313-1293; Email: [email protected]
Hasin Jinna (ORCID ID: https://orcid.org/0000-0003-4289-1713)
Graduate Research Assistant, Department of Transportation Studies, Texas Southern University
Phone: 1-713-313-7532; Email: [email protected]
for
Center for Advanced Multimodal Mobility Solutions and Education
(CAMMSE @ UNC Charlotte)
The University of North Carolina at Charlotte
9201 University City Blvd,Charlotte, NC 28223
September 2019

ii

iii
ACKNOWLEDGEMENTS
This project was funded by the Center for Advanced Multimodal Mobility Solutions and Education
(CAMMSE @ UNC Charlotte), one of the Tier I University Transportation Centers that were
selected in this nationwide competition, by the Office of the Assistant Secretary for Research and
Technology (OST-R), U.S. Department of Transportation (US DOT), under the FAST Act. The
authors are also very grateful for all of the time and effort spent by DOT and industry professionals
to provide project information that was critical for the successful completion of this study.
DISCLAIMER
The contents of this report reflect the views of the authors, who are solely responsible for the facts
and the accuracy of the material and information presented herein. This document is disseminated
under the sponsorship of the U.S. Department of Transportation University Transportation Centers
Program in the interest of information exchange. The U.S. Government assumes no liability for
the contents or use thereof. The contents do not necessarily reflect the official views of the U.S.
Government. This report does not constitute a standard, specification, or regulation.

iv

v
Table of Contents
EXECUTIVE SUMMARY ....................................................................................................... xiii
Chapter 1. Introduction.................................................................................................................1
1.1 Problem Statement .................................................................................................................1
1.2 Research Goal and Objectives ...............................................................................................2
1.3 Report Overview ....................................................................................................................2
Chapter 2. Marine Terminal Operation ......................................................................................3
2.1 Introduction ............................................................................................................................3
2.2 Terminal Functions ................................................................................................................3
2.3 Marine Terminal Elements ....................................................................................................3 2.3.1 Containers ................................................................................................................................... 3 2.3.2 Wharf Cranes ............................................................................................................................... 4 2.3.3 Yard Trucks/Vessel Trucks ......................................................................................................... 4 2.3.4 Yard Cranes ................................................................................................................................. 4
2.4 Marine Terminal Structure & Activities ................................................................................5 2.4.1 Gate Sector/Terminal Gate .......................................................................................................... 6 2.4.2 Yard Sector .................................................................................................................................. 7 2.4.3 Quay Sector ................................................................................................................................. 8 2.4.4 Processes at a Container Terminal .............................................................................................. 8
Chapter 3. Countermeasures for Reducing Truck Waiting Time ..........................................10
3.1 Tactical/Operational Level Countermeasures ......................................................................10 3.1.1 Gate Appointment System ........................................................................................................ 10 3.1.2 Extended Gate Hours ................................................................................................................ 11 3.1.3 Other Operational Countermeasures ......................................................................................... 12
3.2 Technology-Based Countermeasures ...................................................................................12 3.2.1 Automation Technologies ......................................................................................................... 12 3.2.2 Terminal Operating Systems (TOS) .......................................................................................... 16 3.2.3 Others ........................................................................................................................................ 20
Chapter 4. Existing Studies .........................................................................................................23
4.1 Analytical Based Studies .....................................................................................................23 4.1.1 Guan et al. (2009), “Analysis of Marine Container Terminal Gate Congestion, Truck Waiting
Cost, and System Optimization” ........................................................................................................ 23
4.2 Simulation Based Studies ....................................................................................................25 4.2.1 Chen and Yang (2014), “Methods for Estimating Vehicle Queues at a Marine Terminal: A
Computational Comparison” .............................................................................................................. 25 4.2.2 Boile et al. (2014), “Evaluating Strategies to Improve Access to Marine Container Terminals
and Streamline Gate Operations” ....................................................................................................... 26 4.2.3 Azab et al. (2016), “A Simulation-Based Study of the Effect of Truck Arrival Patterns On
Truck Turn Time in Container Terminals” ........................................................................................ 30 4.2.4 Huynh et al. (2005), “Methodologies for Reducing Truck Turn Time at Marine Container
Terminals” .......................................................................................................................................... 34

vi
4.3 Survey Based Studies ...........................................................................................................37 4.3.1 Philippe Morais et al. (2006), “Terminal Appointment System Study” .................................... 37 4.3.2 Golab & Regan (1999), “Trucking Industry Perceptions of Congestion Problems and Potential
Solutions in Maritime Intermodal Operations in California” ............................................................. 38 4.3.3 Giuliano et al. (2006), “The Terminal Gate Appointment System at the Ports of Los Angeles
and Long Beach: An Assessment” ..................................................................................................... 41
Chapter 5. Survey for Assessing the Effectiveness of Countermeasures ................................44
5.1 Methodology ........................................................................................................................44
5.2 Data Collection ....................................................................................................................45
5.3 Results & Discussion ...........................................................................................................45 5.3.1 General questions regarding marine terminals and operations of drayage companies .............. 45 5.3.2 Questions related to truck congestion and other problems faced by truck drivers at marine
terminals ............................................................................................................................................. 45 5.3.3 Questions about countermeasures for mitigating truck congestion at marine terminals ........... 47 5.3.4 Summary of the Open-ended Questions .................................................................................... 50
Chapter 6. Conclusions and Recommendations ........................................................................52
References .....................................................................................................................................55
Appendix: Survey Instrument ....................................................................................................58

vii

viii
List of Figures Figure 1. 1: Annualized Purchase Cost, O&M Cost, and Total (EAC) Costs ................................ 1
Figure 2. 1: 40-foot and 20-foot containers (Source: Huynh et al. 2005) ....................................... 4
Figure 2. 2: Wharf Crane (Source: Google Image) ......................................................................... 4
Figure 2. 3: Yard Crane. (Source: Google Image) .......................................................................... 5
Figure 2. 4: Different Sectors of Marine Terminal (Source: Azab et al. 2016) .............................. 5
Figure 2. 5: Operations of a Marine Terminal (Source: Azab et al. 2016) ..................................... 6
Figure 2. 6: Typical Gate Sector (Source: Levelton Consultants Ltd. Et al. 2006) ........................ 6
Figure 2. 7: Example of a Gate Sector (Source: Levelton Consultants Ltd. Et al. 2006) ............... 7
Figure 2. 8: Typical Yard Sector (Source: Levelton Consultants Ltd. Et al. 2006)........................ 7
Figure 2. 9: Straddle Carrier (Source: Google Image) .................................................................... 8
Figure 2. 10: Typical Quay Sector (Source: Level on Consultants Ltd. Et al. 2006) ..................... 8
Figure 2. 11: Processes at a Marine Container Terminal (Source: Huynh et al. 2005) .................. 9
Figure 3. 1: OCR Technology (Source: kritikalsolutions website)............................................... 13
Figure 3. 2: RFID Technology (Source: Peacocks website) ......................................................... 14
Figure 3. 3: GPS Technology (Source: navipedia website) .......................................................... 14
Figure 3. 4: Barcode Reader (Source: Colourbox website) .......................................................... 15
Figure 3. 5 Virtual Container Yard ............................................................................................... 21
Figure 4. 1: Queue formation process (Source: Chen, 2014) ....................................................... 26
Figure 4. 2: Estimation result of each model in the numerical experiment (Source: Chen,
2014) ................................................................................................................................. 26
Figure 4. 3: Representation of the prototype port (Source: Boile et al. 2014) .............................. 27
Figure 4. 4: Hourly distribution of the different types of vehicles in the port access
network (Source: Boile et al. 2014) .................................................................................. 28
Figure 4. 5: Total delays per hour (sec) (Source: Boile et al. 2014) ............................................. 28
Figure 4. 6: Total travel times per hour (sec) (Source: Boile et al. 2014) .................................... 29
Figure 4. 7: Travel times (in min) for CO, EG and RE (Source: Boile et al. 2014) ..................... 29
Figure 4. 8: Discrete Event Simulation Model (Source: Azab et al. 2016) .................................. 31
Figure 4. 9: Process Flow (Source: Azab et al. 2016) .................................................................. 32
Figure 4. 10: Arrival Patterns: (a) Default Arrival, (b) Decreasing Arrival, (c) Increasing
Arrival, (d) Uniform Arrival , and (e) Distributed-Peak Arrival (Source: Azab et
al. 2016) ............................................................................................................................ 33
Figure 4. 11: Scheduled arrival during the week according to a uniform arrival pattern for
16 working hours/day (Source: Azab et al. 2016) ............................................................ 34
Figure 4. 12: Truck Turn Time vs. Additional Number of Road Cranes. (Source: Huynh
et al. 2005) ........................................................................................................................ 36

ix
Figure 4. 13: Effect of Capping Truck Entry on Truck Turn Time (Source: Huynh et al.
2005) ................................................................................................................................. 36
Figure 4. 14: Effect of Capping Truck Entry on Crane Utilization (Source: Huynh et al.
2005) ................................................................................................................................. 36
Figure 4. 15: The Overall Congestion Problem (Source: Golab & Regan, 1999) ........................ 39
Figure 4. 16: Congestion Problems at Ports in General (Source: Golab & Regan, 1999) ............ 40
Figure 5. 1: Perceived Seriousness of Congestion Problem ......................................................... 46
Figure 5. 2: Mean Values of Problems Faced at Terminals (On a scale of 4). ............................. 46
Figure 5. 3: Effectiveness of Gate Appointment System. ............................................................. 47
Figure 5. 4: Effectiveness of Extended Gate Hour ....................................................................... 48
Figure 5. 5: Mean Values of Countermeasures to Reduce Truck Congestion at Terminals
(On a scale of 4). ............................................................................................................... 49
Figure 5. 6: Effectiveness of Technology-Based Countermeasures. ............................................ 50

x

xi
List of Tables Table 3. 1: Automation Technologies Summary .......................................................................... 16
Table 3. 2: Summary of Port Information System ........................................................................ 20
Table 3. 3: Summary of Planning Level and Automation Technologies based
Countermeasures ............................................................................................................... 22
Table 4. 1: Estimated optimum numbers of booths at terminal gate for different truck
arrival rates ........................................................................................................................ 24
Table 4. 2: Model Parameters ....................................................................................................... 31
Table 4. 3: Simulation Results ...................................................................................................... 33
Table 4. 4: List of Variables for the Multiple-Regression study .................................................. 35
Table 4. 5: Truck Turn Time Multiple Regression Model ............................................................ 35
Table 4. 6: List of Ports for the study (Source: 4.3.1 Philippe Morais et al. 2006), ..................... 37
Table 5. 1: Strategies for Improving the Effectiveness of Gate Appointment System ................. 47
Table 5. 2: Strategies for Extended Gate Hour. ............................................................................ 49

xii

xiii
EXECUTIVE SUMMARY
International trade and volume of freight have been increasing since the past few decades,
especially at US marine terminals. Forecasts suggest that this growth will increase dramatically by
2020. Most of the goods arriving at and departing from marine terminals are carried by trucks, and
this results in congestion inside the ports and at the gates of the marine terminals. Marine terminal
congestion is an important issue that has economic implications for stakeholders of the supply
chain community.
The objective of this report is to identify the cost-effective countermeasures that can be used to
reduce waiting times for trucks at marine terminals. This research focuses on operational level
countermeasures some of which are Gate Appointment System, Extended Gate Hour Operation
etc. At first, previous studies related to some of the countermeasures that have already been applied
to reduce truck congestion have been reviewed and synthesized in this report. After that, surveys
were conducted among the officials at the drayage companies and truck drivers. Based on the
results of the analysis of the surveys, feasible and cost-effective countermeasures/strategies for
reducing truck congestion at marine terminals were recommended.

xiv

1
Chapter 1. Introduction
1.1 Problem Statement
Trade internationally has immensely increased in the last twenty years especially between
Asian and US Marine Terminals (MTs) and thus freight volumes have also increased. Recent
forecasts of container shipping volumes suggest an attractive growth rate to take place in the next
five years. Bureau of Transportation Statistics (BTS) suggests water-borne goods shipments
account for almost about 28% of all US international merchandise trade in terms of value
(Bureau of Transportation Statistics 2006). The increasing number of containers causes higher
demands on the container terminals, logistics, and management and on technical equipment. That
is why Marine Terminals (MTs) need to increase the handling capacity as well as productivity.
Marine Terminals are places where most of the world’s goods are transferred. Most of these
goods are carried to the terminals by trucks. According to the Bureau of Transportation Statistics,
60% of the domestic freight by weight and nearly 70% by value are carried by trucks (Bureau of
Transportation Statistics 2006). This increase of trade has impacted the roadway transportation
systems of metropolitan areas, especially around the major generators that are ports, airports, rail
yards, and industrial areas causing congestion, delays, air and noise pollution. Recently, truck
waiting time has continued to increase owing to the use of larger vessels, which has increased
congestion at terminals. The increased container volumes required to be handled by MTs in
optimum time highlight the need for the development of innovative countermeasures at a
strategic, tactical and operational level. The following Figure 1 shows global container trade
between years 1985-2012.
Figure 1. 1: Annualized Purchase Cost, O&M Cost, and Total (EAC) Costs
(Source: UNCTAD based on Clarkson Research Services’ Shipping Review & Outlook, Spring 2012)

2
1.2 Research Goal and Objectives
The goal of this study is to conduct an in-depth investigation of innovative
countermeasures for reducing truck waiting times at marine terminals and to recommend the
most feasible cost-effective countermeasures to improve marine terminal operations. In general,
countermeasures for mitigating truck congestion at marine terminals can broadly be categorized
into three categories. The first type of countermeasure is at strategic level. For instance,
expanding the capacity of the terminal can be considered as a strategic level countermeasure.
The second type of countermeasure is at operational level. For instance, gate appointment system
and extended gate hour operation are some of the popular operational level countermeasures. The
third type of countermeasure is technologies based, that use different types of automation
technologies to smooth the operation of marine terminals. For instance, automatic gate system
has been increasingly used in US marine terminals. Since marine terminals are usually located
in or near major cities, where right of way is limited and very expensive, implementing
operational strategies to reduce the effect of the terminals’ truck related traffic on the
surrounding roadway network and the terminal operations is generally more feasible than
physical capacity expansions (Barber et al. 2001, Mongeluzzo et al. 2005). Thus, this study
focuses on the operational level and technology-based countermeasures. To investigate the
effectiveness and limitations of these countermeasures, a thorough literature review was
conducted conducted at first, followed by a survey to the truck drivers.
1.3 Report Overview
The remainder of this report is organized as follows: Chapter 2 provides background
information regarding marine terminal structure and operation. Chapter 3 introduces
countermeasures to reduce truck congestion at marine terminals. Chapter 4 summarizes previous
studies that have been conducted before to mitigate truck congestion at marine terminals.
Chapter 5 summarizes the results of a survey conducted on trucking companies and truck drivers
operating within greater Houston and finally, Chapter 6 concludes this report with a summary
and a discussion of the directions for future research.

3
Chapter 2. Marine Terminal Operation
2.1 Introduction
Before introducing the different countermeasures to mitigate marine terminal congestion,
it is important to have an understanding of the marine terminal operation. Chapter 2 will give a
brief description of the marine terminal functions, various elements, and the basic structure and
activities of a typical marine container terminal.
2.2 Terminal Functions
A Marine Terminal has four basic functions: 1) receiving, 2) storing, 3) staging, and 4)
loading. These four functions are performed for all containers, whether they are imports, exports,
or transshipments. Transshipments are containers that are discharged from a vessel, stored
temporarily in an intermediate terminal, and stowed onto another vessel prior to reaching their
ultimate destinations. The receiving function involves providing entry for import containers or
export containers, recording their arrivals, and capturing relevant information about the
containers. The storing function involves placing the container on the terminal at a certain
location where it can be retrieved when needed. The staging function involves getting a container
prepared to leave the terminal. An export container may be staged at the time of initial storage,
or at a later time. Lastly, the loading function involves placing the correct container on the ship,
truck, or train.
There are other activities that take place at a terminal in addition to the mentioned four
functions. An activity that is always performed is the surveying of containers and chassis. Such
activity entails inspecting for things like damages on containers, the operability of chassis, and
whether or not the proper container and/or chassis is being taken in or out. Inspections by U.S.
Customs and United States Department of Agriculture (USDA) are often performed, though not
for every container. There is also the activity of packing and unpacking containers at the
terminal's warehouse. This is performed whenever containerized cargo has "less than container
load" in size. These small shipments must first be consolidated into a single container.
2.3 Marine Terminal Elements
The most important elements of a typical marine terminal are containers, wharf cranes,
and yard cranes. A brief description of these elements is provided as follows.
2.3.1 Containers
Containers are large and standardized boxes used to transport goods from one destination to
another. They are designed to facilitate the movement of goods because they can be readily
handled by terminal equipment and transportation system. Their dimensions are standardized
by the International Standards Organization (ISO) and most containers are 20 or 40 feet.
Figure 2.1 shows pictures of a 40-foot container on the left and a 20-foot container on the
right. The term TEU (twenty-foot equivalent unit) is used to refer to one container with a
length of twenty feet. Thus, a 40-foot container is two TEUs.

4
Figure 2. 1: 40-foot and 20-foot containers (Source: Huynh et al. 2005)
2.3.2 Wharf Cranes
Every terminal has one or more wharf cranes (Figure 2.2). A wharf crane is a type of large
dockside gantry crane found at container terminals for loading and unloading intermodal
containers from container ships. They are positioned on the shore and can slide back and
forth along a track as it works a vessel. They can lift anywhere from 40 to 100 tons and load
or discharge between 25 to 50 containers per hour. These wharf cranes can process two
containers at once and could reach across 22 rows of containers on board a ship; that is, they
have an outreach of 60 meters or more.
Figure 2. 2: Wharf Crane (Source: Google Image)
2.3.3 Yard Trucks/Vessel Trucks
Yard Trucks/vessel trucks are to take import containers from wharf cranes at the dock and
transport those containers to the stack area for yard cranes to store. Unlike regular trucks that
can travel on the road, yard trucks can only operate within the terminal.
2.3.4 Yard Cranes
Yard cranes (Figure 2.3) are the container handling equipment for loading containers onto or
unloading containers from trucks in container yards in marine terminals. The yard cranes can
also move the container in and out of a truck's chassis.

5
Figure 2. 3: Yard Crane. (Source: Google Image)
2.4 Marine Terminal Structure & Activities
Basically, MTs can be divided into five areas, namely the berth, quay, transport, storage
yard, and gate (Carlo et al. 2013). These five areas comprise three different zones. Berth and the
quay are called the “Seaside”, the storage yard is called “Yard Side” while the gate is called the
“Landside”. Each side has some operations which usually interact with others. In addition to that,
MTs can also be viewed as three different sectors. The gate area is called the gate sector, the
storage yard area is called the yard sector and the berth and quay area together is called the quay
sector. In summary, a typical diagram of all the sectors of an MT is shown in Figure 2.4. The
basic operation flow of a Marine Terminal is also shown in Figure 2.5.
Figure 2. 4: Different Sectors of Marine Terminal (Source: Azab et al. 2016)

6
Figure 2. 5: Operations of a Marine Terminal (Source: Azab et al. 2016)
A brief description of different sectors/zones of a Marine Terminal is provided in the
following section.
2.4.1 Gate Sector/Terminal Gate
The Gate Sector (Figure 2.6) is the entrance point for the container trucks and represents the
first contact point between truck drivers and terminal authorities.
Figure 2. 6: Typical Gate Sector (Source: Levelton Consultants Ltd. Et al. 2006)
Operations included in this sector are container availability and storage location, trucker
appointments, equipment identification and security. Example of typical gate sector is shown
in Figure 2.7.

7
Figure 2. 7: Example of a Gate Sector (Source: Levelton Consultants Ltd. Et al. 2006)
2.4.2 Yard Sector
The Yard Sector (Figure 2.8) includes all ground or rail activities, which take place inside
Example of a Gate Sector the terminal as well as security. The yard sector includes the
interfaces between the Gate and the Quay at which ships are berthed.
Figure 2. 8: Typical Yard Sector (Source: Levelton Consultants Ltd. Et al. 2006)
These activities include the loading and unloading of containers on terminal trucks, trains and
stacking containers in the yard. Most terminals employ a mixture of storage organization. The
main different types of storage organizations are chassis storage, stack-with-yard crane storage,
and stack-with-straddle carrier storage. In chassis storage, the container is stored with the
chassis in the yard as a married unit. Yard crane storage involves moving a container in and
out of the stack by a yard crane. Lastly, a container can be stacked using a straddle carrier
(Figure 2.9). Chassis storage requires the most land but makes it fast for trucks to drop off and
pick up containers. Straddle carriers tend to be more flexible and mobile than yard cranes but
require more land (Maria et al. 2014). A straddle carrier can stack at most 1 container wide and
2 containers high whereas a yard crane can stack up to 7 containers wide and 5 containers high.
Typically, it takes longer for a truck to pick up a container at a terminal if the container is
stacked because it takes time for the yard crane or straddles carrier to dig out the container.
Other activities include container tracking, dispatching, and inventory.

8
Figure 2. 9: Straddle Carrier (Source: Google Image)
2.4.3 Quay Sector
The Quay Sector (Figure 2.10) represents the marine entrance and exit point of the Marine
Terminal. Its activity addresses all operations of loading and unloading containers on or off
the vessel as well as container identification.
Figure 2. 10: Typical Quay Sector (Source: Level on Consultants Ltd. Et al. 2006)
2.4.4 Processes at a Container Terminal
The association between terminal functions and terminal equipment/organization can be
understood by examining the flow of containers. When a ship arrives at the terminal, import
containers are unloaded. This is done by wharf cranes, which remove the containers from the
ship's hold or deck and place it onto yard trucks (a.k.a. vessel trucks). After receiving the
container, the yard truck moves to the stack. The yard cranes then take the container off the
yard trucks and store it in the stack. After a certain period, the containers are retrieved from
the stack by the yard cranes and placed onto road trucks or trains for delivery to the recipient.
The process is reversed for an export container. Note that, terminal managers may assign a set
of yard cranes to serve yard trucks (vessel operations) and another set to serve road trucks (road

9
operations). There are instances when a yard crane may serve both yard trucks and road trucks.
A diagram showing the processes at a marine container terminal is shown in Figure 2.11.
Figure 2. 11: Processes at a Marine Container Terminal (Source: Huynh et al. 2005)

10
Chapter 3. Countermeasures for Reducing Truck Waiting Time
To improve overall terminal yard side-to-landside operations and reduce congestion at
terminal gates, different countermeasures have been proposed and implemented over the last few
years. These countermeasures can be broadly categorized into three types: 1) planning/strategic
level (e.g. capacity expansion), 2) tactical/operational level (e.g. extended gate hours, gate
appointment systems) and 3) technology-based (e.g. automatic gate systems, virtual container
yard). As we mentioned before, this study focusses on the second and third types of
countermeasures. Follow is the introduction of these two types of countermeasures.
3.1 Tactical/Operational Level Countermeasures
Two of the most popular operational countermeasures are 1) gate appointment system
and 2) extended gate hours.
3.1.1 Gate Appointment System
Gate appointment is a truck reservation system that provides a certain number (limited by the
capacity of the terminal) of reserved transactions during a specified time slot (usually one
hour). Appointments are made by the use of the Internet or by phone. Modern distribution
centers that are fully automated have appointment systems for trucks in use for pick-up and
drop-off cargo. An appointment system requires the dedication of shippers, drayage
operators, and terminal operators, in order to be effective (Bureau of Transportation Statistics
2006). Gate appointment systems can be very effective in controlling the random arrival of
trucks, modifying the peak hours of demand, minimizing congestion of idling trucks, and
improving the utilization of the terminals’ capacity (both at the delivery area and the storage
yard). In order for a gate appointment to be successful, further strategies should be in place
for processing the trucks arriving before or after their appointment time. Methods of
processing arriving trucks with appointments differ from terminal to terminal. One way of
processing trucks is to have dedicated lanes for trucks with appointments. Faster processing
of trucks with appointments is assured if the conditions inside the terminal are well
organized. Besides separate lanes, another method of processing trucks without appointments
is to gather them all in a marshalling yard and service them according to a pre-determined
pattern. This way all trucks with an appointment have priority (Theofanis et al. 2008). When
there are no dedicated lanes for trucks with an appointment, the same queue can be used for
all trucks, and trucks with appointments can be pulled out of line if the wait time exceeds a
limit for trucks with appointments. Overall, according to literature, following two strategies
for processing the trucks with or without appointments are recommended:
Having dedicated lanes for trucks with appointments.
Gather all trucks in marshalling yard and service according to a pre-determined
pattern.
However, the following issues have been identified regarding gate appointment system:
Availability to match Border and Customs operation (BCO) priorities, vessel cut-offs,
free time, etc.
Inability to make enough advance appointments

11
Harder to plan dual transactions
Same-day appointments extremely difficult
Cancellation and reset rules vary
Lack of visibility for available appointments
Empty return and chassis complications
To fully take advantage of an appointment system, terminal operations must also be
organized, so that when a truck makes an appointment, containers are ready for pick up. To
facilitate this objective, containers can be reshuffled the day before, or when time is
available, based on the appointment schedule so there are no delays at the slot interchange
area of the terminal (i.e. area for pick-up and delivery of the containers by trucks).
Moreover, according to literature, several other strategies can be applied along with the gate
appointment system in order for the gate appointment system to be more successful. These
strategies are:
Appointments can be made during the day, not just 24 hours ahead of time,
Allow for reservation by phone,
Re-assign reserved time that has been canceled,
Decline or discourage double/triple appointments for the same container,
Fines for missed appointments,
Handle cancellations of appointments by phone, and
Operate based on container appointment (not truck appointment).
3.1.2 Extended Gate Hours
In addition to a gate appointment system, the strategy of extending the hours of operations of
the gates is another way to manage the demand patterns of truck arrivals and avoid high
concentration during peak hour periods. Both strategies can exist in isolation or can be
implemented together and complement each other. One of the major problems at marine
container terminals is that the terminal gates, where trucks enter and exit the terminal to
deliver or pick-up a container, are only open during certain hours on weekdays; due in part to
union agreements, although operations within the terminal carry on 24/7. Consequently,
trucks are forced to pick-up and deliver containers during specific hours of the day, resulting
in high demand over certain periods. This phenomenon has led to inefficient gate operations
that can spill traffic over to the surrounding roadway network causing serious safety and
congestion problems.
By extending gate hours, the demand for processing containers are spread out throughout the
evening, night, and even on weekends. This reduces the likelihood of congestion occurring
during peak hours. There are three main issues that affect the successful implementation of
this strategy: 1) providing incentives to drayage operators that will encourage them to utilize
the extended hours of gate operations, 2) adjustment of hours and pay of workers at the
terminal (Giuliano and O’Brien 2007), and 3) the ability of delivery locations to
accommodate the truckers that pick-up containers during the extended hours of gate
operations. Peak hour surcharges are an option to encourage traffic in off-peak hours. The
12
improved truck turn times within the terminal and increased credibility of the terminal
operator in keeping the promised truck turn times could also facilitate the successful
implementation of this strategy.
Several strategies can be implemented to make extended gate hour system work more
efficiently. These strategies are:
Use extended gate hour on weekends,
Use extended gate hour with the gate appointment system,
Provide incentives to drayage operators,
Regular hour surcharge to encourage truck arrivals in extended hours.
3.1.3 Other Operational Countermeasures
Apart from the gate appointment system and extended gate hour, there are other operational
countermeasures. The following are a brief description of these countermeasures.
Pre-staging containers for bulk delivery: for trucks that are needed to carry more than
one container from the terminal, containers are prepared and stacked together before
the truck arrives at the port so less time is required for the truck to get the containers.
Pre-entering truck and cargo information before arriving at the port: truckers can
provide information to the terminal operators regarding the details of the container
before arriving in the terminal. In that way, less time is required for the terminal
operators to prepare the designated container for the truck.
Using cellphone lots: the trucks are shifted away from the gates and drivers are
notified by a smartphone application
Using off-dock storage yard: containers are shifted to another place outside the main
terminal container yard area to reduce congestion of trucks inside the terminals.
Sometimes, empty containers are returned to the off-dock storage yard.
Connect truckers and cargo owners by third parties: it is known as triangulation of
trucker calls where containers from major customers are moved to an off-dock
storage area where truckers quickly peel off those containers destined for distribution
centers inland.
Promoting two-way loaded movement: encouraging the truckers to come to the
terminal for both import and export activity at the same time. In that way, trucks
come to the port carrying an empty container, delivers it to the yard area and receives
an import container in that same visit to the terminal. Which eliminates the need for
the trucks to come to the terminal only for dropping off empty containers.
3.2 Technology-Based Countermeasures
Another approach is to improve operational efficiencies with the implementation of
advanced technologies and information systems. In this part, state-of-art technologies used to
reduce truck congestion in marine terminal will be introduced.
3.2.1 Automation Technologies
Automation technologies including tagging, tracking, and information management systems
can be used to expand the capacity of marine terminals. These technologies are:

13
3.2.1.1 Optical Character Recognition (OCR)
Optical Character Recognition (OCR) is an automated identification and data collection
technology, which provides an efficient, hands-free means of asset identification,
tracking, and control (Figure 3.1). It is one of the lowest cost ways with the growth of the
demand for automated container handling processes. In the port, OCR used to identify
trucks automatically upon entry into the port so that it reduces truck waiting time
significantly. It can be classified in the following operations:
Gate operations: OCR is first associated with a container, then processed through the
gate area. Additionally, the movement of containers and trucks will be identified and
tracked through terminal gates. Automatic Gate Systems (AGS) is a specific system that
uses OCR to read the number on the container, search the billing file to see whose cargo
it is, and determine where it needs to go. Drivers can be identified with fingerprints,
increasing security and accountability. Workers, therefore, will not need to be on the
ground checking in drivers.
Yard operations: Containers and trucks identified by OCR uniquely when waiting for
service at the container handling equipment. The truck precise location will be identified
and reported automatically to the terminal operating system. The process without human
intervention which will minimize labor friction and optimize driver productivity.
Quay operations: Containers and operators are automatically identified and matched
under the quay crane. It improves worker safety by removing staff from under the cranes
and also enables subsequent transitions will also then be automated.
Figure 3. 1: OCR Technology (Source: kritikalsolutions website)
3.2.1.2 Radio Frequency Identification Device (RFID)
Radio Frequency Identification Device (RFID) technology (Figure 3.2) is another way to
collect data automatically in marine terminal. Generally, there are five components:
active or passive tag (transponder), antenna, transceiver, reader, and information system.
Tags are programmed with data that identifies the container to which the tag is attached.
Other information within the tag may be where the container originated, destination,

14
goods within the container, and owner of the goods. Truck and driver information
collected through the RFID tag on the truck’s front window, then will be recorded
through an image recognition system.
Figure 3. 2: RFID Technology (Source: Peacocks website)
3.2.1.3 Global Positioning System (GPS)
Global Positioning System (GPS) (Figure 3.3) is a constellation of navigation satellites
called Navigation Satellite Timing and Ranging (NAVSTAR), maintained by the U.S.
Department of Defense. In the port, GPS technology mainly used to identify container
position in marine terminal. It also used to constantly track trucks’ position, communicate
between drivers and headquarters fast, archiving electronic of increase speed of the
transport process, transparency, timeliness, and accuracy of information.
Figure 3. 3: GPS Technology (Source: navipedia website)

15
3.2.1.4 Barcode Reader
Barcode reader is a wireless scanning technology that communicates with the host
computer (Figure3.4). Barcode is ideal, especially for shipping manifests and outer
packing cases or other exposed surfaces. Reader is easy to use where the ambient light
environment in the container terminal is high. Barcode reader is capable of providing
prompt information required by customs when vessels at berth. It operates most
effectively in a controlled environment particularly when relatively small amounts of data
need to be captured. In the rough environment of a port terminal where the visibility of
the straddle carrier operator is minimal, this wireless system provides effective services
to most terminal operators and operational systems.
Figure 3. 4: Barcode Reader (Source: Colourbox website)
3.2.1.5 Voice Recognition
Voice recognition technology provides communications between the crane operator and
the ground personnel. This technology can be used either as a standalone or integrated
with other technologies during the loading and unloading of a vessel. Voice recognition
uses pattern recognition similar to that in barcode systems. Instead of an image, the
computer recognizes words in a preprogrammed vocabulary. When it is activated, crane
operators speak into a microphone; the machine recognizes words or phrases and then
converts them into electronic impulses for the micro- or host computer. The high-
performance units operate at an accuracy rate of 99.5%. One of the advantages of the
system is message recording. This would assist the terminal operator in providing the
final report on the position of containers loaded on to the ship. When properly integrated,
the system can assist in the automatic capture and processing of marine terminal data.

16
3.2.1.6 Automated Guided Vehicle (AGV)
Automated Guided Vehicle (AGV) driven by an automatic control system that serves as
the driver. It is considered to be the most flexible type of material handling system, suited
to be deployed for terminal operations very well because of the repetitive nature of
movements within the terminals. Sensors on the road or infrastructure and onboard the
vehicle provide measurements about the location and speed of the vehicle. It can achieve
the following benefits: high container throughput, controllability and reliability;
automated and consistent container handling operation and continuous operation (24
hours a day, 365 days a year); reduced operational costs, especially labor costs.
To summarize, Table 3.1 listed the automation technologies mentioned above.
Table 3. 1: Automation Technologies Summary
Technology Main Application
Optical Character
Recognition
Automatically identify containers, truck plate and chassis
information at entry and exit gates, yard and quay operations
Global Positioning System Identify container position in terminal
Radio Frequency
Identification Device
Track trucks, containers and cargo in terminal
Barcode Readers Identify containers position in terminal
Voice Recognition Assist in capturing and processing data, provide
communications between the crane operator and ground
personnel
Automated Guided
Vehicle (AGV)
AGVs are used to move containers in some maritime
container terminal. The main benefits are reduced labor
costs and a more reliable (less variable) performance.
3.2.2 Terminal Operating Systems (TOS)
The main purpose of Terminal Operating Systems (TOS) is to provide a set of computerized
procedures to manage cargo, machines and people efficiently and effectively. The systems
can get up to the minute information which allows for more timely and cost-effective
decision making. TOS utilizes technologies such as the internet, electronic data interchange
processing, laptops, wireless local area networks and RFID to monitor the flow of products
in, out and around the terminal efficiently. Data is either a batch synchronization with, or a
real-time wireless transmission to a central database. The database can then provide useful
reports about the status of goods, locations and machines in the terminal. Terminal operating
systems can be standalone systems managed as a service or utilize cloud technologies. The
following paragraphs summarize the existing TOS as well as provide a reference and a brief
description of each.
3.2.2.1 Freight Information Real-Time System for Transport (FIRST)
FIRST is an Internet-based, real-time network that integrates many resources into a
single, easy-to-use web site on cargo and port information. The FIRST Web site
(www.firstnynj.com) provides real-time information on cargo status to ocean carriers,

17
exporters, importers, foreign freight forwarders, customs brokers, terminal operators, and
rail and trucking services. Truck companies can use the system to find out the status of a
cargo container waiting to be picked up at the port. By verifying that the container is at
the terminal and has been released for pickup, the trucker can avoid multiple telephone
calls to the terminal and prevent unnecessary trips to the port.
3.2.2.2 Pacific Gateway Portal (PGP)
PGP is a web-based port community information system that serves stakeholders and
customers in the Vancouver area. It provides for information on containers status, vessel
activity, and real-time video images from port landside infrastructure as well as driver
validation. The web portal also features a dangerous goods application and a truck
appointment system available to registered users for a fee. Benefits of the system to
truckers are scheduled and seamless processing with minimum delays.
3.2.2.3 SynchroMet
SynchroMet™ On-Line, the virtual container yard service provider for the Port of
Oakland. The Port Authority and SynchroNet Marine Inc have partnered to implement a
congestion management tool to alleviate public road and port congestion at local marine
terminals. Empty container can be released through SynchroMet and matched in real-time
with off-dock equipment needs to cover export bookings, which can reduce empty truck
miles and waiting time at local marine terminals. SynchroMet also provides trucks with
the ability to access empty equipment direct from local ramps and outside the terminal
and automate the confirmation process via electronic data interchange
3.2.2.4 SEA LINK®
SEA LINK® provides for the thousands of trucking companies serving the Port of New
York and New Jersey a central database of registered trucking companies and their truck
drivers doing business. It helps speed these trucks through their marine terminal gates,
allowing their terminals to move thousands of containers each day to and from markets.
With a single identification card for calls at any of the Port of NY and NJ's Marine
Terminals, drivers save time, clearing gates quickly for dropping off and picking up
cargo.
3.2.2.5 eModal
eModal is designed to improve efficiency and decrease congestion at container terminals.
It provides a single point of contact for multiple container terminals and delivers valuable
tools to the entire intermodal community. eModal gives one easy-to-use Web site for all
container information needs, which offers detailed container status, vessel schedules,
terminal locations, truck driver lists and more container, vessel and terminal information.
These tools improve service to all parties in the transportation community. eModal also
provides extra benefits for trucking companies and terminal operators through a gate
appointment system. Trucking companies use eModal to pre-approve their drivers for
container pick up and drop off. eModal automatically sends this preapproval information
to the terminals. Terminals also rest assured knowing they are delivering containers to the
18
trucking company's designated drivers. eModal's trucker status features also reduce
trucker turn times and improve security at the terminal.
3.2.2.6 NAVIS (Yard Management)
NAVIS is a system that automates and integrates data input functions, allowing terminal
operators to see what is happening in real-time, including container movements from the
gate to vessels or rail, in their container terminal. NAVIS SPARCS, used by more than
175 terminals in 44 countries around the world, enables the operator to fully automate
and optimize vessel and rail planning, yard allocation, and equipment dispatch, with
minimal human interaction, which means faster, more efficient loading and discharge.
Additionally, SPARCS terminal operating system keeps pace with advances in equipment
technology (OCR, RFID), allowing the terminal operators to maximize their investment
in the latest equipment, such as twin lift straddle carriers. By helping optimize equipment,
land and container moves, vessels spend less time at the quay, enabling a terminal to
accept more requests from shippers and increase throughput. Many terminals implement
simple systems for servicing quay cranes resulting in the underutilization of container
handling equipment, leading to longer travel distances, un-laden travels and delays.
Because SPARCS terminal operating system operates in real-time, operators can track
current container handling equipment and productivity which means truck drivers won’t
have to wait for work instructions, assuring that drivers are making strategic moves,
saving them time and allowing them to concentrate on driving, and not on the context of
the move.
3.2.2.7 COSMOS (Yard Management, Gate Control and Container Tracking)
COSMOS System is a fully integrated yard control, terminal/vessel planning system
supported in real-time by radio frequency, using handheld and vehicle miles traveled in
all terminal operations. SPACE is COSMOS' yard planning software. Based on user-
defined parameters, it automatically determines the optimal position for containers that
enter the terminal until they are loaded on the right vessel, barge, truck or train. A
location in the terminal will be automatically assigned to every container entering the
terminal. The characteristics of the container, such as the type of container, its
destination, the date of departure, weight, etc., determine the selected area. Within the
assigned area, containers will be stacked according to user-defined algorithms. The
planner defines planning rules; based on these rules, the system then determines the
optimal position for each container. The planner just handles the exceptions and fine-
tunes his planning rules. SPACE can operate in any terminal environment, wheeled or
grounded, and container handling equipment employed. An important module of SPACE
is TRAFIC. This module automatically generates and transmits instructions to terminal
equipment drivers. As soon as these drivers have confirmed the execution of the move,
SPACE is updated in real-time, guaranteeing the accuracy of the system.
COSMOS also provides Gate Control and Container Tracking functionalities. Every
container entering the terminal is checked administratively and physically, after which
the order is confirmed. Checkers use hand-held terminals linked to COSMOS to update
the database in real-time. After the container is checked, all other software programs

19
linked to the central database are able to use the available container information.
COSMOS also monitors all operations. Whenever the information concerning a container
is changed, e.g. a container is moved or a vessel arrives, COSMOS is automatically
informed and the database is kept up-to-date at all times.
3.2.2.8 Embarcadero (ESC) (Yard Management, Gate Control and Appointment System)
ESC’s Web-based visibility tools (VoyagerTrack and webTAMS), employ Differential
Global Positioning Systems and wireless local area networks to report on the exact
position of equipment and provide real-time communication for the terminal community
complement terminal operating system software. Outside the terminal, ESC also provides
cargo visibility at any event using real-time Web access tools. With automated
intermodal solutions from ESC, terminals improve yield management by increasing
terminal and yard efficiency, reducing operational costs, improving throughput, and
elevating levels customer service.
ESC's Premier Appointment System is a real-time appointment module for motor a
carrier that extends the functionality of VoyagerTrack®. The PAS module comes
standard with VoyagerTrack. This capability in VoyagerTrack allows truck drivers to
schedule arrival appointments at the gate resulting in reduced wait time for motor
carriers.
ESC smartGATE™, providing centralized, remote processing of gate transactions for
intermodal facilities. SmartGATE includes hardware (OCR, RFID, GPS, and Smart
Camera Technologies) and software. A key module of smartGATE is Intelligent Camera,
a Closed-Circuit Television that provides accurate and real-time images of the terminal.
VoyagerTrack and webTAMS-allow intermodal customers, motor carriers and other
transportation community stakeholders’ access to secure real-time critical information
and notifications. With VoyagerTrack and webTAMS, container transportation
communities have the ability to check container availability, schedule appointments for
pickup and delivery, and make on-line demurrage payments.
3.2.2.9 Maher Terminal Logistics Systems Gate and Yard Automated System
Massport launched a web-based Gate and Yard Automated System at Conley Terminal.
The system uses an internet browser-style interface to provide the intuitive tools to enter
bookings and manifests, as well as locate important information concerning bookings,
containers, manifests, and trucker contracts. This system is designed for use by carriers,
truck drivers, brokers, and forwarders. This software also gives Massport an automated
approach to yard management, providing the most efficient and productive use of
terminal staff and yard storage space. Companies moving cargo through Conley Terminal
have been assigned passwords with varying degrees of access to the system. Each
company's access is determined by the level of control they have in the transportation of
cargo through Conley Terminal, and is limited to their cargo and equipment.
The following Table 3.2 summarizes port information system.

20
Table 3. 2: Summary of Port Information System
System Description Used in Port Authorities
FIRST
Web-based real-time network integrates many
resources into a single show on cargo and port
information
New York and New Jersey
PGP
Web-based system provides containers status, vessel
activity, and real-time video images from port landside
infrastructure and driver validation
Vancouver
SynchroMet Virtual container yard to alleviate public road and port
congestion at local marine terminals Oakland
SEA LINK Truck driver identification system to speed trucks
through marine terminal gates New York and New Jersey
eModal
Web-based system provides all container information
needs: container status, vessel schedules, terminal
locations, truck driver lists
Los Angeles, Long Beach, New
York and New Jersey, Oakland,
Tacoma, Vancouver, Seattle,
Miami, Jacksonville
NAVIS Automate and integrate data input, real-time
monitoring at the terminal Houston, Montreal
COSMOS Integrated yard control and terminal/vessel planning
system in real-time by radio frequency Halifax
ESC
Embarcadero
Web-based visibility tools use DGPS and WLANS to
report the position of equipment and provide real-time
communication
Long Beach, Oakland, Seattle
GYAS Web-based gate and yard automated system Boston
3.2.3 Others
3.2.3.1 Virtual Container Yard (VCY)
For truck congestion because of empty container issues, the virtual container yard is
essential. A web-based information system with inventory of empty containers allows
suppliers and shippers to access containers at convenient storage locations outside the
terminal. This avoids unnecessary trips to the terminal and results in savings to both
terminals and truckers. The scheme essential reduces the number of truck trips and
increases drayage productivity. In addition, having dedicated truck access roads when
traveling between terminals can reduce traffic congestion on roadways.
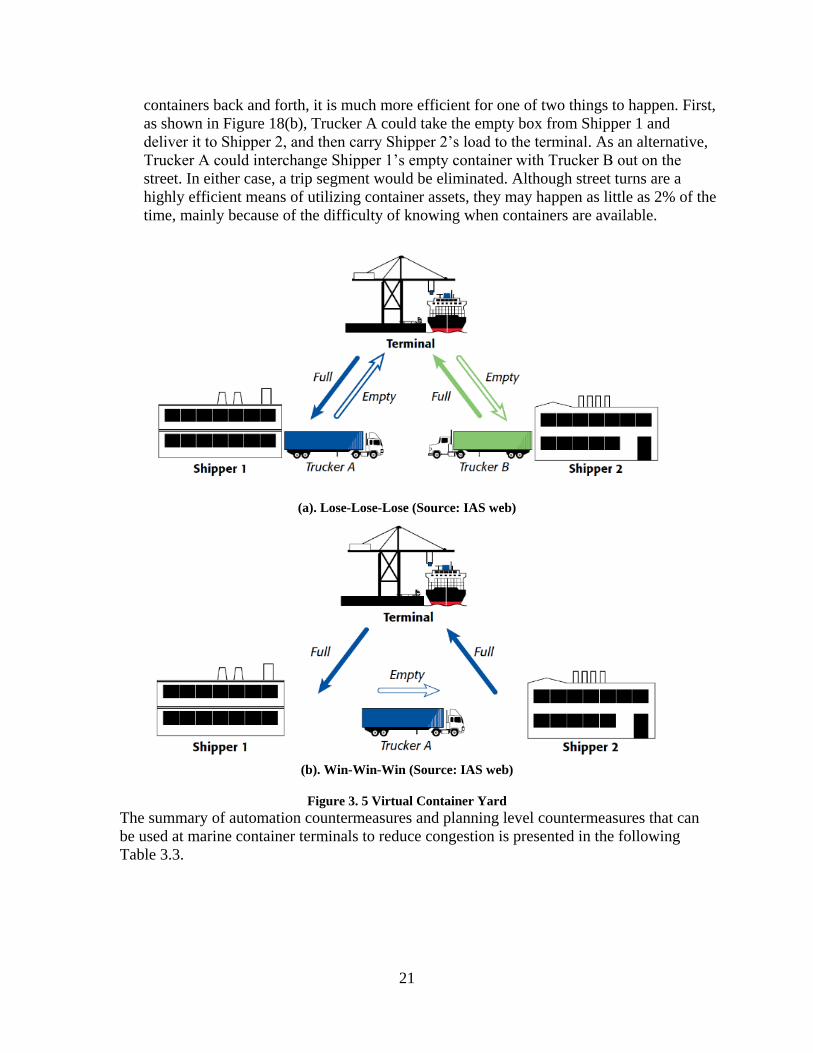
After import containers are unloaded, they are most often moved empty from customers’
premises straight back to terminals, rail ramps and container yards. That represents a
lose-lose-lose: (1) carriers pay unnecessary gate charges and storage fees, and experience
wear and tear on equipment; (2) truck drivers waste hours waiting in line at ports, rail
ramps, and container yards to return empty equipment; (3) container-facility operators
lose operating efficiency because of congestion, and face pressure from local
communities and regulatory bodies to reduce truck traffic and pollution from engines
idling at their gates. The inefficiency stems from simultaneously having two empty
containers on the road when one would suffice. As Figure 18(a) illustrates, Trucker A
carries a full load from the terminal or ramp to Shipper 1, and then hauls back an empty.
At the same time, Trucker B carries an empty to Shipper 2, and then brings back a load
into the terminal or rail ramp. It is estimated that between 30% and 40% of all containers
on the road at any given time are empty. Rather than have both truckers move empty
21
containers back and forth, it is much more efficient for one of two things to happen. First,
as shown in Figure 18(b), Trucker A could take the empty box from Shipper 1 and
deliver it to Shipper 2, and then carry Shipper 2’s load to the terminal. As an alternative,
Trucker A could interchange Shipper 1’s empty container with Trucker B out on the
street. In either case, a trip segment would be eliminated. Although street turns are a
highly efficient means of utilizing container assets, they may happen as little as 2% of the
time, mainly because of the difficulty of knowing when containers are available.
(a). Lose-Lose-Lose (Source: IAS web)
(b). Win-Win-Win (Source: IAS web)
Figure 3. 5 Virtual Container Yard
The summary of automation countermeasures and planning level countermeasures that can
be used at marine container terminals to reduce congestion is presented in the following
Table 3.3.

22
Table 3. 3: Summary of Planning Level and Automation Technologies based Countermeasures
Planning/Strategic
level
countermeasures
Name Description
Adding Yard
Cranes
Improve the level of service for managing the trucks, reduce the
truck turnaround time
Gate Expansion Physically install more gates to serve the trucks at terminal gate
Increasing Land
Area Adding more land area to the existing area of the Terminal
Automation
Technologies
OCR Automatically identify containers, truck plate and chassis
information at entry and exit gates, yard and quay operations
GPS Identify container position in terminal
RFID Track trucks, containers and cargo in terminal
Barcode
Readers Identify containers position in terminal
Voice
Recognition
Assist in capturing and processing data, provide communications
between the crane operator and ground personnel
Terminal Operating
Systems
FIRST Web based real-time network integrates many resources into a
single show on cargo and port information
PGP
Web based system provide containers status, vessel activity, and
real time video images from port landside infrastructure and
driver validation
SynchroMet Virtual container yard to alleviate public road and port
congestion at local marine terminals
SEA LINK Truck driver identification system to speed trucks through marine
terminal gates
eModal
Web based system provide all container information needs:
container status, vessel schedules, terminal locations, truck driver
lists
NAVIS Automate and integrate data input, real-time monitoring at
terminal
COSMOS Integrated yard control and terminal/vessel planning system in
real time by radio frequency
ESC
Embarcadero
Web-based visibility tools use DGPS and WLANS to report
position of equipment and provide real-time communication
GYAS Web-based gate and yard automated system
Others
Virtual
Container Yard
(VCY)
Virtual container yards are Web-based platforms where users can
match empty containers to container needs at the dock rather than
returning them to the terminal.

23
Chapter 4. Existing Studies
The existing studies have used analytical, simulation and survey-based approaches to
investigate the marine terminal gate congestion problem and its impacts. In this chapter, some
representative studies of different approaches are introduced as follows
4.1 Analytical Based Studies
4.1.1 Guan et al. (2009), “Analysis of Marine Container Terminal Gate Congestion, Truck
Waiting Cost, and System Optimization”
In his dissertation, Guan (2009) applied a multi-server queuing model to analyze marine
terminal gate congestion and quantify truck waiting cost. Based on the data collected during
field observations, online camera observation and terminal day-to-day operation records, some
relationships between the number of vessels, cargo volumes, gate transactions, and truck
volumes were developed by using statistical charts and descriptive statistics. It was found that
the ratio of every import/export container to truck trips is 1:2, to gate transactions is 1:1.4. The
statistical analysis showed that these ratios are very consistent.
The major contribution of this study is the development of a model for analyzing the marine
terminal gate congestion and quantifying congestion costs. Based on the developed cost
estimation method, the optimum numbers of booths at the terminal gate can be derived for
different truck arrival rates as shown in Table 4.1 below.

24
Table 4. 1: Estimated optimum numbers of booths at terminal gate for different truck arrival rates Fixed Indices Calculated and Observed Performance Indices Optimized Performance Indices
Hour
Truck
arrival
rate
Number
of gate
booths
working
Average
number
of truck
waiting
Average
waiting
time per
truck
(min)
Gate
operating
cost per
hour
Truck
waiting
cost
per
hour
Total
gate
cost
per
hour
Total
hourly
cost/Hourly
truck
waiting
cost
Number
of gate
booths
working
Average
number
of truck
waiting
Average
waiting
time per
truck
(min)
Gate
operating
cost per
hour
Truck
waiting
cost
per
hour
Total
gate
cost
per
hour
Total
hourly
cost/Hourly
truck
waiting
cost
6am-7am 90 4 6.0 4.0 503 194 697 21.7 5 1.1 0.7 628 35 663 20.6
7am-8am 95 4 15.9 4.0 503 512 1,014 31.5 5 1.6 1.0 628 53 681 21.2
8am-9am 138 6 9.3 10.0 754 300 1,053 32.8 7 1.3 1.1 879 82 961 29.9
9am-10am 94 6 0.6 4.1 754 18 772 24.0 5 1.6 1.0 628 53 681 21.2
10am-11am 105 6 1.0 0.4 754 33 787 24.5 5 3.2 1.8 628 102 730 22.7
11am-12pm 95 6 0.5 0.3 754 17 771 24.0 5 1.6 1.0 628 53 681 21.2
12pm-1pm 145 6 39.2 16.2 754 1,259 2,013 62.6 7 3.7 1.5 879 118 997 31.0
1pm-2pm 146 6 52.0 21.4 754 1,672 2,426 75.5 7 3.7 1.5 879 120 999 31.1
2pm-3pm 81 5 0.6 0.4 628 19 647 20.1 4 2.2 1.6 503 71 574 17.8
3pm-4pm 79 4 1.7 1.3 503 54 557 17.3 4 1.7 1.3 503 54 557 17.3
4pm-4:30pm 25 4 0.2 0.2 251 5 256 15.8 3 0.7 0.9 188 24 212 12.5
Total 1,093 6,909 4,083 10,992 6,972 764 7,736
Source: Guan, 2009
Note: Hourly truck waiting cost = $32.15 per truck (Texas Transportation Institute, 2003)
25
Furthermore, in this study, by applying the developed cost estimation model, the
effectiveness of some gate congestion mitigation countermeasures was also investigated.
These countermeasures are: 1) gate capacity expansion: add more gate lanes and service
booths, 2) productivity improvement: improve service rate/reduce service rate at each booth,
and 3) gate approximant system: control the truck arrival rates. For different
countermeasures, the average waiting time and the overall gate congestion cost were
estimated based on a model developed by this study. Following are the major findings for
each countermeasure:
Gate capacity expansion: two additional gate booths can reduce 27% of the overall
system costs and 71% of the direct truck waiting cost.
Productivity improvement: the annual truck waiting time can be reduced by 62%
based on 10% service improvement and 81% based on 50% service improvement,
respectively.
Gate Appointment system: the gate operating cost can be reduced by 7% and truck
waiting cost can be reduced by 70% respectively.
In addition, the author also provided the following comments regarding the implementations
of these three countermeasures:
Gate capacity expansion requires flexibility in-gate lanes opening and closing as well
as the use of gate clerks. This might be difficult to obtain due to labor contract
requirements. Large scale physical expansion may not feasible due to the limitation of
waterfront land.
Productivity improvement also requires flexibility in gate manpower and the number
of gate booths. This can be improved by the technologies used for the terminal
operation system.
The gate appointment system seems to be the most effective way to reduce gate
congestion and improve system efficiency. It allows the marine terminal to match
supply and demand for gate processing capacity, and control the congestion level at
the marine terminal gate.
4.2 Simulation-Based Studies
4.2.1 Chen and Yang (2014), “Methods for Estimating Vehicle Queues at a Marine Terminal: A
Computational Comparison”
Chen and Yang (2014) used a micro traffic simulation tool, PARAMIC, to simulate a
container terminal gate system and observe the formation process of a truck queue. Based on
the results of simulation, a simulation-based regression model was developed for estimating
the truck queues at a container terminal gate.
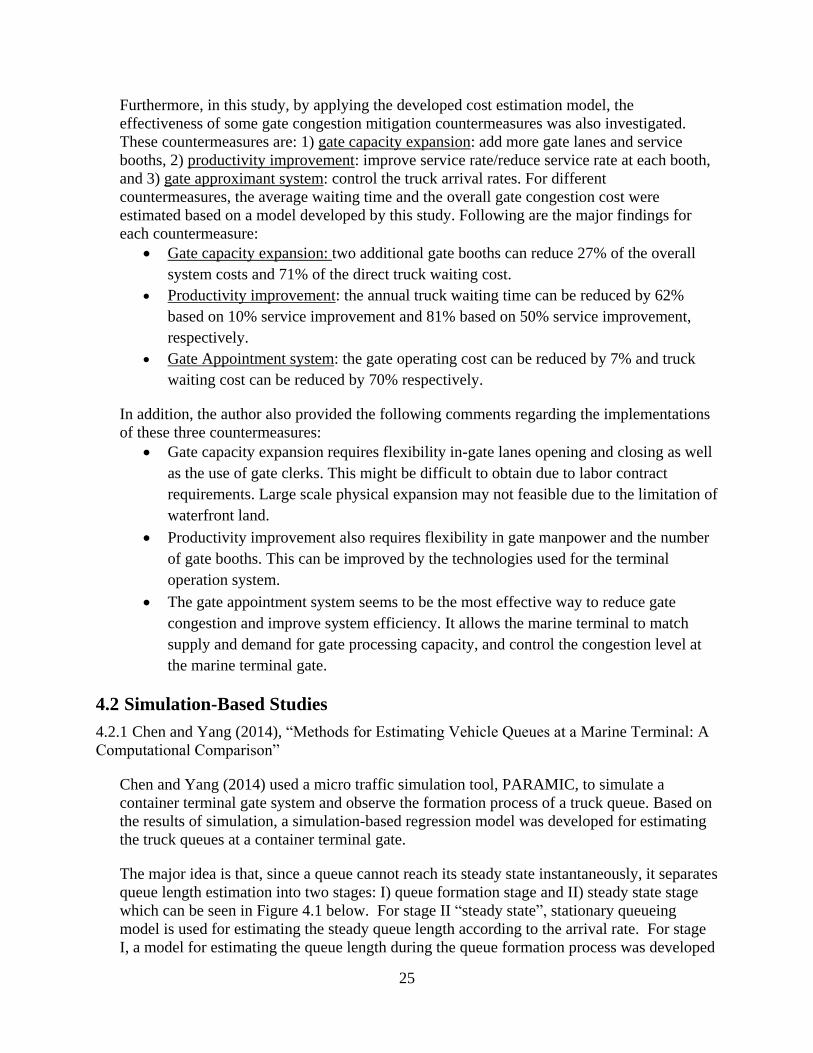
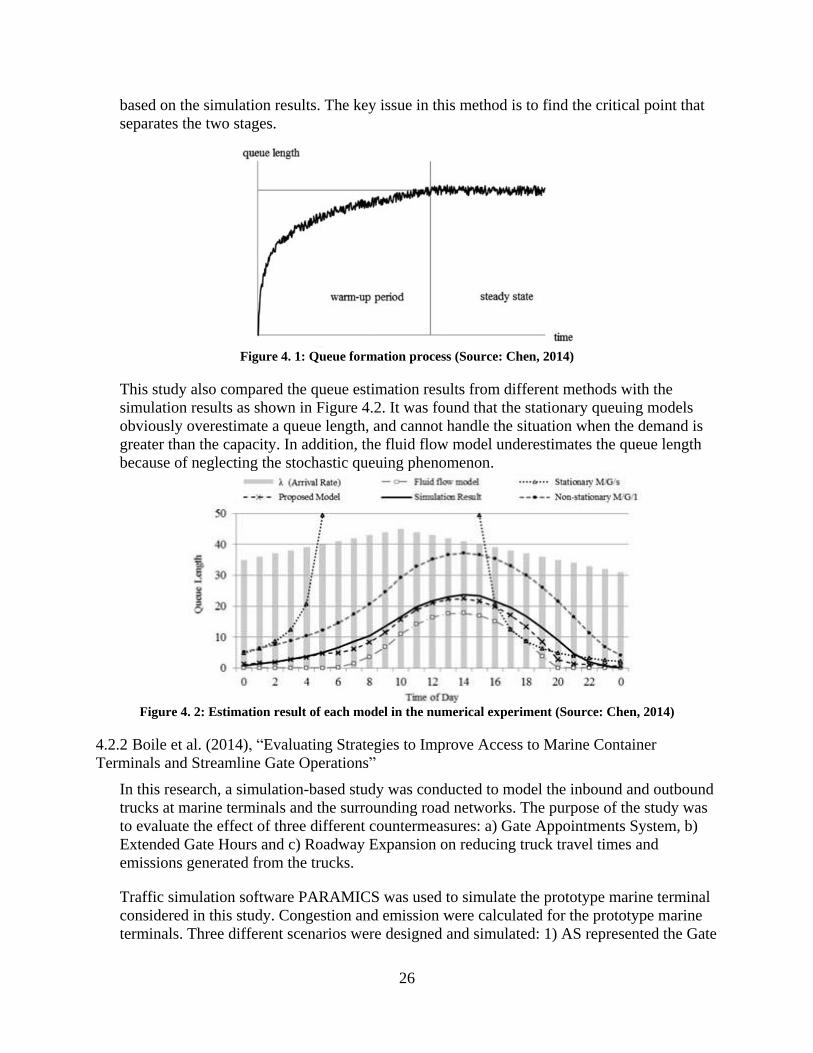
The major idea is that, since a queue cannot reach its steady state instantaneously, it separates
queue length estimation into two stages: I) queue formation stage and II) steady state stage
which can be seen in Figure 4.1 below. For stage II “steady state”, stationary queueing
model is used for estimating the steady queue length according to the arrival rate. For stage
I, a model for estimating the queue length during the queue formation process was developed
26
based on the simulation results. The key issue in this method is to find the critical point that
separates the two stages.
Figure 4. 1: Queue formation process (Source: Chen, 2014)
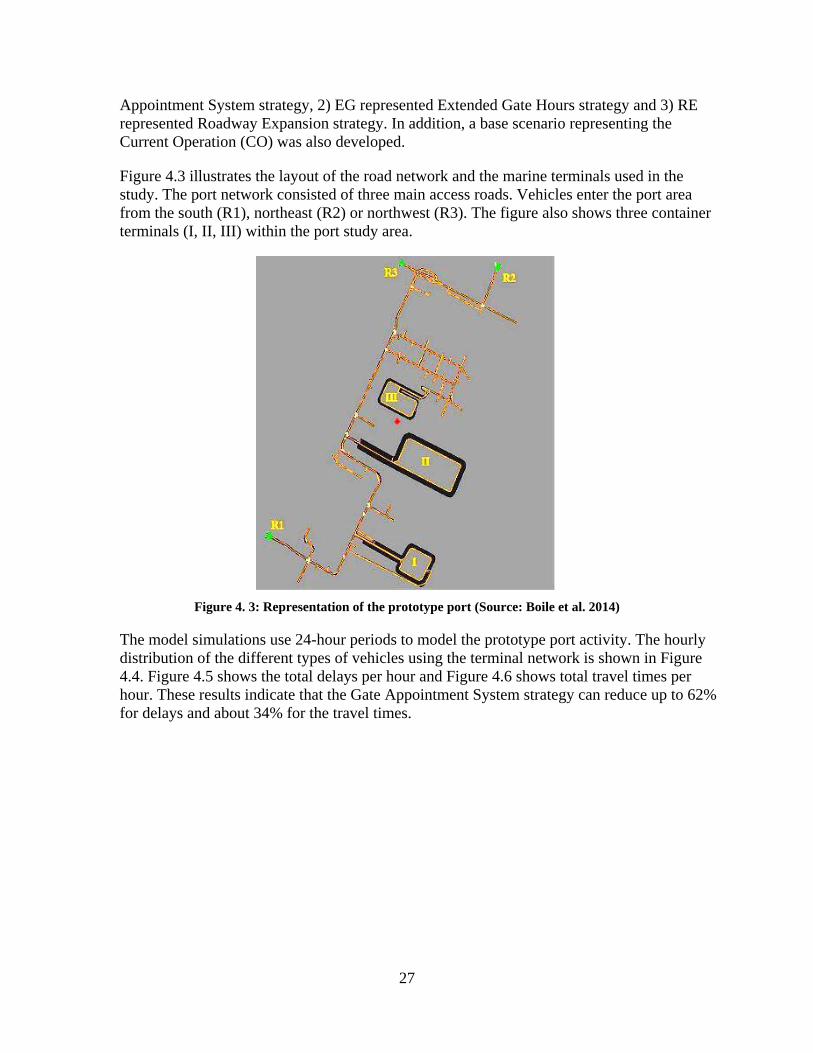
This study also compared the queue estimation results from different methods with the
simulation results as shown in Figure 4.2. It was found that the stationary queuing models
obviously overestimate a queue length, and cannot handle the situation when the demand is
greater than the capacity. In addition, the fluid flow model underestimates the queue length
because of neglecting the stochastic queuing phenomenon.
Figure 4. 2: Estimation result of each model in the numerical experiment (Source: Chen, 2014)
4.2.2 Boile et al. (2014), “Evaluating Strategies to Improve Access to Marine Container
Terminals and Streamline Gate Operations”
In this research, a simulation-based study was conducted to model the inbound and outbound
trucks at marine terminals and the surrounding road networks. The purpose of the study was
to evaluate the effect of three different countermeasures: a) Gate Appointments System, b)
Extended Gate Hours and c) Roadway Expansion on reducing truck travel times and
emissions generated from the trucks.
Traffic simulation software PARAMICS was used to simulate the prototype marine terminal
considered in this study. Congestion and emission were calculated for the prototype marine
terminals. Three different scenarios were designed and simulated: 1) AS represented the Gate
27
Appointment System strategy, 2) EG represented Extended Gate Hours strategy and 3) RE
represented Roadway Expansion strategy. In addition, a base scenario representing the
Current Operation (CO) was also developed.
Figure 4.3 illustrates the layout of the road network and the marine terminals used in the
study. The port network consisted of three main access roads. Vehicles enter the port area
from the south (R1), northeast (R2) or northwest (R3). The figure also shows three container
terminals (I, II, III) within the port study area.
Figure 4. 3: Representation of the prototype port (Source: Boile et al. 2014)
The model simulations use 24-hour periods to model the prototype port activity. The hourly
distribution of the different types of vehicles using the terminal network is shown in Figure
4.4. Figure 4.5 shows the total delays per hour and Figure 4.6 shows total travel times per
hour. These results indicate that the Gate Appointment System strategy can reduce up to 62%
for delays and about 34% for the travel times.

28
Figure 4. 4: Hourly distribution of the different types of vehicles in the port access network (Source: Boile et
al. 2014)
Figure 4. 5: Total delays per hour (sec) (Source: Boile et al. 2014)

29
Figure 4. 6: Total travel times per hour (sec) (Source: Boile et al. 2014)
Figure 4.7 represents the travel times for the three scenarios (CO, EG and RE). The results
indicate that Gate Appointment System and Extended Gate Hours can provide better results
in reducing truck congestion compared with Roadway Expansion.
Figure 4. 7: Travel times (in min) for CO, EG and RE (Source: Boile et al. 2014)
To summarize, the purpose of this research was to perform simulation of prototype marine
terminals to study the effect of Gate Appointment System, Extended Gate Hours and
Roadway Expansion on reducing travel times of trucks as well as reducing emissions
generated from the trucks. Based on the results of this study, Extended Gate Hours is more
effective compared with Roadway Expansion. Note that, these results were derived based on

30
the assumption of the demand patterns from one existing terminal. Therefore, the results may
be case-specific and may be different if a different port/terminal is analyzed.
4.2.3 Azab et al. (2016), “A Simulation-Based Study of the Effect of Truck Arrival Patterns On
Truck Turn Time in Container Terminals”
Azab & Eltawil (2016) conducted a study to identify the problem of long Truck Turn Time
(TTT) for external trucks in marine container terminals. The objective was to identify the effect
of arrival patterns of trucks on truck turn time and gate congestion. The results can be used for
improving the Gate Appointment System.
The authors used a simulation model to study the effect of various truck arrival patterns on the
TTT in container terminals. The following equation describes the TTT:
TTT=Twg+Tsg+Twy+Tsy+Txg
Where :
Twg: waiting time at the gate.
Tsg: service time at the gate.
Twy: waiting time at the yard.
Tsy: service time at the yard.
Txg: time spent at gate exit.
Figure 4.8 shows the 3D model for the main areas of the container terminal: quayside, yard
area, and gate side. This simple model considers one gate, one-yard block, one-yard crane,
one quay crane, and one vessel. FlexSim CT software*, special simulation software for
container terminal operations, is used for estimating the TTTs for different arrival patterns.
Both export and import container arrivals are simulated. Various truck arrival patterns are
tested for investigating the truck turn time changes with various patterns. The main target of
this study is to illustrate how to keep the TTT at the minimum and maintain the gate
throughput as high as possible. For simplify purpose, one vessel is assumed to reach the
terminal during the analysis time period and the vessel is assumed to deliver 200 import
containers and to be charged with 200 export containers which come via the gate by the
external trucks. Similarly, the imports will be picked up during the analysis time period by
the external trucks. The model parameters are shown in Table 4.2. These parameters are the
default parameters in FlexSim CT with little modification.

31
Figure 4. 8: Discrete Event Simulation Model (Source: Azab et al. 2016)
Table 4. 2: Model Parameters
In Figure 4.9 the process flow is described.

32
Figure 4. 9: Process Flow (Source: Azab et al. 2016)
Five arrival patterns were tested; the default arrival pattern (Def.), increasing arrival pattern
(Inc.), decreasing arrival pattern (Dec.), uniform arrival pattern (Uni.), and distributed-peak
arrival pattern (Dist.) (Figure 28). The vertical axis represents the number of external trucks
and the horizontal axis represents the day’s working hours. These five patterns are developed
using the “Gate Planner”, which is a part of the FlexSim CT software for planning the gate
appointments.
The default pattern shows that arrivals reach a peak in the middle of the day. This situation is
simulated using increasing and decreasing patterns. The uniform arrival pattern proposes a
stable level of arrival over the day. For the distributed-peak arrival pattern, the arrival peaks
are distributed to the beginning and the end of the working day. Figure 4.10 shows the arrival
patterns and the actual arrivals on a specific day after running the simulation model. The gray
bars represent the actual arrival pattern that is needed to be matched by the gate planner.

33
Figure 4. 10: Arrival Patterns: (a) Default Arrival, (b) Decreasing Arrival, (c) Increasing Arrival, (d) Uniform
Arrival, and (e) Distributed-Peak Arrival (Source: Azab et al. 2016)
The model is run for 50 replications with a one-week length for each replication. The
measures of effectiveness (MOE) studied are the average TTT, minimum and maximum
TTT, and maximum queue length at the gate. From this result, it can be seen that the uniform
arrivals exhibited the minimum value of TTT among all patterns. The decreasing arrival
pattern had a maximum TTT of about 6 hrs. As noticed from the results, the average gate
throughput is kept at the same level. This means that the arrival pattern can be used to reduce
the TTT without limiting truck arrivals or reducing terminal productivity. The results of the
simulation are shown in Table 4.3.
Table 4. 3: Simulation Results
From the results, the uniform arrival pattern exhibited the lowest average of TTT. The
simulation work is extended to obtain the best arrival schedule per each hour. 10 replications
for the uniform arrivals are performed and the scheduled arrivals for each hour of the
working day are recorded. Figure 4.11 shows the average numbers of trucks which are
expected to achieve the minimum truck turn time and max gate throughput. Using truck
schedules, the terminal operators can design Gate Appointment System which avoids the
congestions and long queues at the gates.

34
Figure 4. 11: Scheduled arrival during the week according to a uniform arrival pattern for 16 working
hours/day (Source: Azab et al. 2016)
4.2.4 Huynh et al. (2005), “Methodologies for Reducing Truck Turn Time at Marine Container
Terminals”
The authors of this study investigated the effects of two possible countermeasures to reduce
truck turn time at Marine Terminals based on the data collected from Port of Houston
Barbours Cut Marine Terminal. The first countermeasure was to see the effect of adding
more yard cranes to facilitate the handling of containers more efficiently to reduce truck
waiting time. The study tried to find the answer whether it would be beneficial in investing
more yard cranes in the terminal. The second countermeasure was to implement a Gate
Appointment system. This study analyzed whether the Gate Appointment system can help in
reducing the truck turn time. For the Gate Appointment system countermeasure, two issues
were investigated: 1) the effect of limiting truck arrivals on crane utilization, and 2) the effect
of limiting truck arrivals on the truck turn time.

35
To investigate the effects of adding more yard cranes on truck turn time, the authors
developed two methodologies. The first method was to use statistical models. In this method,
field data, including road moves (amount of time a road crane needs to move container from
yard storage to trucks), vessel moves (amount of time a yard crane needs to move container
from vessels to yard storage), other yard moves (amount of time a road crane needs to
perform other movements for transferring containers), re-handles (amount of time a road
crane needs to put container on top of another container) and observed Truck Turn Time
were collected. Then, three different regression models, including multiple regression
models, polynomial regression models and non-linear in parameter regression models, were
developed. Table 4.4 shows the list of dependent and explanatory variables for the study.
Table 4. 4: List of Variables for the Multiple-Regression study
Independent Variable Dependent Variable
Truck Turn Time (TTT)
Vessel moves
Road moves
Other yard moves
Re-handles
The results from the Multiple Regression analysis were shown in Table 4.5.
Table 4. 5: Truck Turn Time Multiple Regression Model
Model 1 Model 2 Model 3 Model 4
Variable Estimate t-stat Estimate t-stat Estimate t-stat Estimate t-stat
Intercept 50.618 4.14 53.044 5.58 52.559 7.83 35.874 17.35
Cranes -1.656 -4.44 -1.84 -9.54 -1.842 -9.77
Vessel Moves 0.002 0.61
Road Moves 0.018 1.58 0.20 1.92
Other-yard Moves 0.007 0.56
Rehandles 0.02 1.95 0.021 2.09
Total Road Moves 0.021 4.45
Total Road Moves/Crane 0.185 10.85
Adjusted R2 0.6728 0.6839 0.6917 0.7254
Source: Huynh et al. 2005
The second method was to use simulation modeling to model the precise movements of
trucks and yard cranes. Then, based on the simulation results, the relationship between the
number of cranes and the Truck Turn Time can be obtained.
Figure 4.12 shows the results of the simulation model. Results suggested that overall more
crane will result less TTT, which is consistent with the regression results. However, adding
additional yard cranes does not necessarily lower truck turn time when number of cranes
reaches to certain level. It was due to the randomness in various processes. Another reason
was because of the placement of the yard crane in the yard where it might not have the
opportunity to perform more moves because work in closer to other cranes.

36
Figure 4. 12: Truck Turn Time vs. Additional Number of Road Cranes. (Source: Huynh et al. 2005)
The simulation method was also used for studying the effect of Gate Appointment System on
Truck Turn Time. In this study, a simulation model was developed to find out the optimum
number of trucks to be allowed at a given time at the terminal gates.
Figure 4.13 and Figure 4.14 show the results obtained from the simulation. Results indicates
that capping which is limiting the arrival rate of trucks can be beneficial in reducing truck
turn time. But beyond a certain level, setting the caps too low will result in an increase in
truck turn time. Crane utilization is unaffected as long as the cap value is above a certain
level. Setting the cap value too low will lead to an inefficient use of resources.
Figure 4. 13: Effect of Capping Truck Entry on Truck Turn Time (Source: Huynh et al. 2005)
Figure 4. 14: Effect of Capping Truck Entry on Crane Utilization (Source: Huynh et al. 2005)

37
The study developed several methodologies to address truck turn time. These methods
included statistical models and simulation models. This study found that adopting Gate
Appointment System can provide better results in terms of reducing truck turnaround time
compared with adding extra yard cranes. However, the study was based on the data and
layout design of a particular port, i.e. Port of Houston and the results may vary for different
ports. Therefore, the results from this study, such as setting a cap of 12 trucks per hour can
minimize the TTT, cannot be readily applied to other ports with different resources,
capacities, demands, and layouts.
4.3 Survey Based Studies
4.3.1 Philippe Morais et al. (2006), “Terminal Appointment System Study”
The Transportation Development Center of Canada conducted a study that reviewed present
strategies and practices used at North American Ports for reducing the truck congestion at
Marine Container Terminals.
The study was performed by conducting extensive literature reviews, survey of ports
followed by on-site visits and interviews. Twelve largest North American ports by highest
annual transiting container volumes (TEUs per year) were selected for the study. Table 4.4
shows the information about the ports selected for this study.
Table 4. 6: List of Ports for the study (Source: 4.3.1 Philippe Morais et al. 2006),

38
In this research, it was found that the use of the appointment system at the observed ports
was quite successful in reducing the truck turn time at Marine Container Terminals.
However, the findings of the study also stated that the appointment system must be flexible
in order to be successful. The study reports that the appointment system should be able to do
the following things:
Handle cancellations.
Re-assign reserved time which has been canceled.
Able to make the appointment during the day, not just 24 hours earlier.
Discourage double/triple assignments for the same container.
Assign fine for missed reservations.
Allow one-hour window for the truck to show up.
Allow reservation by phone.
4.3.2 Golab & Regan (1999), “Trucking Industry Perceptions of Congestion Problems and
Potential Solutions in Maritime Intermodal Operations in California”
A survey-based study was conducted on about 1200 private for-hire drayage trucking
companies operating in California to find out congestion-related problems and solutions
faced in marine container terminals. Among these 1200 companies, more than 450
companies had operations involving marine container terminals in California. The purpose of
this study was to provide significant insights into the current state of the industry.
The survey was conducted as a computer-aided telephone interview (CATI) in the spring of
1998. Questions were posed to the logistics or operations manager in charge of operations in
California. The sample was drawn randomly from a set of 5258 freight operators, broken
down into: (1) 804 California-based for-hire trucking companies, with annual revenues of
over $1 million, (2) 2129 California-based private fleets of at least 10 vehicles (power units)
and (3) 2325 for-hire large national carriers not based in California with annual revenues of
over $6 million. The list of companies and individual contact information was drawn from a
database of over 21,000 for-hire carriers and 25,000 private fleets maintained by
Transportation Technical Services Inc. An overall response rate of 22.4% was obtained, with
many of the national carriers excluded on the basis of insufficient operations in the state of
California. Eliminating the contacts with no operations in California and invalid telephone
numbers, the effective response rate was approximately 35% (1177 participants).
Based on the results of the survey, lots of different factors were analyzed. These factors can
be divided into 3 main categories that are: 1) The overall congestion problem, 2) Congestion
Problems at Ports In General and 3) Congestion Problems at Specific Ports. For the overall
congestion problem, the different factors that were analyzed are: a) frequency with which
schedules are missed because of congestion, b) frequency with which drivers are re-routed
because of congestion, c) Frequency with which customer time-windows for pickup and
delivery force operator to work in congested conditions when the operator would otherwise
wait for less congested times and d) Perceived seriousness of the congestion problem. The
results of these factors are shown in the following Figure 4.15.

39
Figure 4. 15: The Overall Congestion Problem (Source: Golab & Regan, 1999)
For the congestion problems at ports in general, the different factors analyzed were a) typical
time spent waiting outside a port to get in, b) typical time spent inside a port and c) frequency
with which congestion or other problems at maritime port facilities impacts operations. These
results are shown in the following Figure 4.16.
a) Schedules are missed because of
congestion b) Drivers are re-routed because of
congestion
c) Force operator to work in congested
conditions d) Perceived seriousness of the
congestion problem
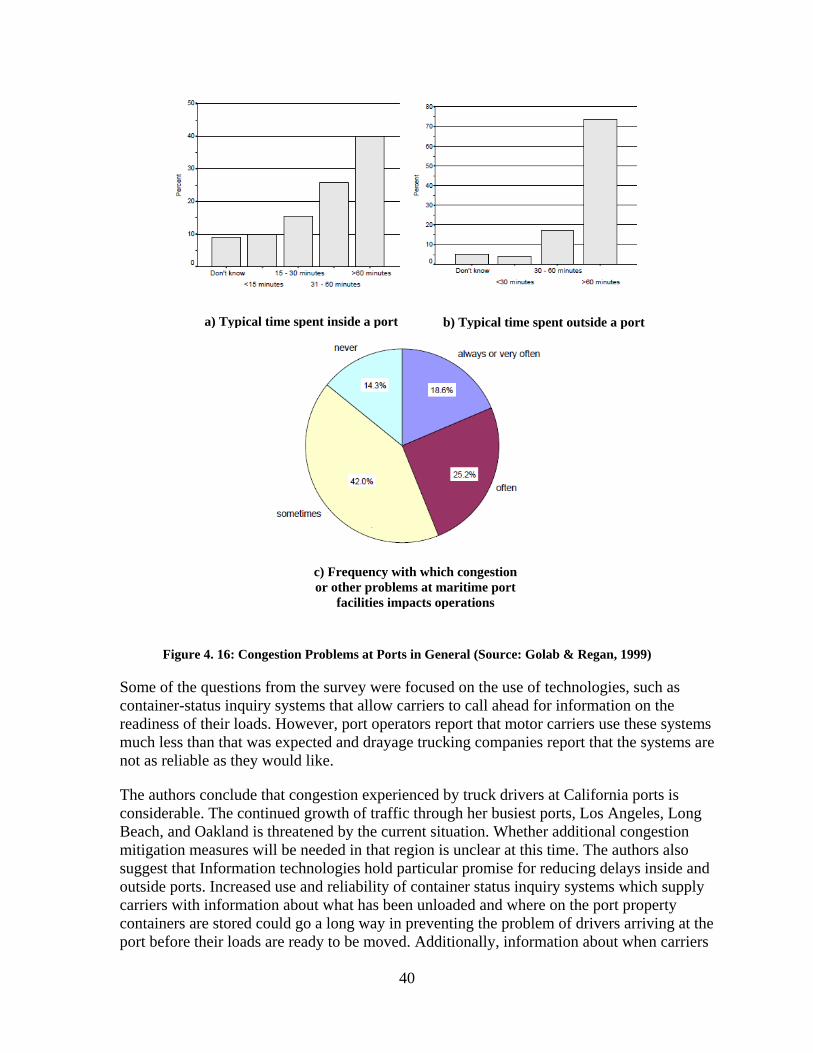
40
Figure 4. 16: Congestion Problems at Ports in General (Source: Golab & Regan, 1999)
Some of the questions from the survey were focused on the use of technologies, such as
container-status inquiry systems that allow carriers to call ahead for information on the
readiness of their loads. However, port operators report that motor carriers use these systems
much less than that was expected and drayage trucking companies report that the systems are
not as reliable as they would like.
The authors conclude that congestion experienced by truck drivers at California ports is
considerable. The continued growth of traffic through her busiest ports, Los Angeles, Long
Beach, and Oakland is threatened by the current situation. Whether additional congestion
mitigation measures will be needed in that region is unclear at this time. The authors also
suggest that Information technologies hold particular promise for reducing delays inside and
outside ports. Increased use and reliability of container status inquiry systems which supply
carriers with information about what has been unloaded and where on the port property
containers are stored could go a long way in preventing the problem of drivers arriving at the
port before their loads are ready to be moved. Additionally, information about when carriers
a) Typical time spent inside a port b) Typical time spent outside a port
c) Frequency with which congestion
or other problems at maritime port
facilities impacts operations

41
have scheduled their pickups at the port could help port operators make more appropriate
decisions about short, medium and long-term staging areas for unloaded containers.
The survey provides valuable insights about the port operators and the trucking companies’
perception of truck congestion problems faced at terminals. It can be concluded that
congestion problems need to be addressed for better operation within the terminal and
efficient drayage operation as well. However, the survey only focused on the problems of
terminals and no effective countermeasures were proposed that can help reduce the truck
congestion problems, especially at terminal gates. Moreover, the effectiveness of different
countermeasures also needs to be evaluated.
4.3.3 Giuliano et al. (2006), “The Terminal Gate Appointment System at the Ports of Los
Angeles and Long Beach: An Assessment”
The purpose of this study was to present an evaluation of the terminal gate appointment
system at the ports of Los Angeles and Long Beach. The appointment system was
implemented in 2002 in response to California Assembly Bill (AB) 2650, which seeks to
limit highway congestion by reducing truck queuing at marine terminal gates and distributing
truck traffic over a greater period of time throughout the day. The legislation mandates
terminals to adopt either gate appointments or off-peak operating hours as a means of
avoiding fines for truck queues. This research focuses on an overall assessment of AB 2650
and its impact on the terminals.
The study was conducted by monitoring the gate appointment system over a 16-month period
from January 2004, six months after its operational implementation, through June 2005. The
data was collected from a number of sources: 1) extended interviews with managers at both
ports (Los Angeles & Long Beach), 8 terminal operators, trucking industry representatives,
longshore labor, public agency representatives and elected officials; 2) field observations at
two terminals; 3) a trucking company survey, 4) SCAQMD compliance reports; 5) publicly
available data on port operations; 6) newspapers and newsletters, and 7) data provided by
selected terminals.
The intent of AB 2650 was to force some changes in port operation to reduce truck
congestion by mandating the terminals to use either gate appointment system or extended
gate hour operation. The appointment system was implemented differently across terminals.
Some terminals chose to use extended gate hour operation. The most popular web-based
information system used to make appointments was e-Modal which existed prior to AB 2650
which provided information on container availability.
Terminal Operator Responses
When the terminal operators were asked about the assessment of the appointment system,
they had differing responses. Those who did not see appointments as a useful strategy made
the following observations: First, terminals must be flexible and organize their operations
based on the nature of their business. Second, the web-based container information systems
were already providing data on container availability; hence it was unclear what additional
benefit appointments would add. Third, the most promising option for improving
productivity is technology, such as efficient use of OCRs (Optical Character Recognition),

42
using GPS (Global Positioning System) to track container movers, and streamlined cargo
tracking. Fourth, an appointment system adds to the data burden of terminal operators.
Finally, there is a discouragement for the use of appointments because it was found that, the
greater the proportion of appointments, the more likely there will be a long queue, and hence
the greater risk of being fined.
The three terminals that had already developed an appointment system see it as an essential
means for managing dock operations. They said that appointment slots can be determined for
each yard area so that traffic on the docks is smoothed across the day, and so that high
demand areas can be rationed.
Trucking Company Responses
A survey of drayage trucking companies was conducted to elicit information on their
responses to the appointment system. Results were obtained from 27 companies. All but
three firms reported that they use the appointment system, but the extent to which it is used
varies greatly, which is consistent with the reports from terminal operators. The average
percentage of appointments kept is 63, with a range of 6 to 100percent. Since there is no
penalty for missing or canceling appointments, the incentive is to keep appointments only
when convenient to do so. The most common reason given for missing an appointment is the
delays at the marine terminal. There is an overall perception that the appointment system has
not improved conditions for truckers. The majority stated that it did not improve their ability
to meet customer demands, or in reducing turn times. No firm gave an unequivocally positive
response.
Survey participants were also asked to rate the effectiveness of the appointment system at
each terminal in reducing turn times because the intent of AB 2650 was to reduce queuing at
the terminal gates, which should, in turn, lead to shorter turn times. Results show that it was
also possible that the appointment system would simply shift the queue to inside the terminal
if the rate of processing transactions did not change. Written comments, as well as the open-
ended discussion conducted with survey participants after completion of the survey, provide
some explanations for their negative assessment. First, there was an expectation on the part
of truckers that appointments would reduce transaction time by assuring that containers
and/or chassis were ready and available for pick-up. However, this was not the case;
practices “inside the gate” did not change as a result of the appointment system. Survey
participants commented that those with appointments still must wait in line for container
moves, may find that the container is not available, or that a chassis is not in working order.
Second, some survey participants noted that the real constraints are limited gate hours and
limited dock labor. If container volumes are increasing and the container processing rate
remains constant, transaction time will increase, with or without appointments. Third, several
survey participants noted the difficulty of using several different appointment systems, rather
than having one system for all terminals and all appointments. Finally, survey participants
cited the difficulties of making and keeping sequential appointments, because any delay with
an earlier transaction cascades to all other later transactions.
The survey also included an open-ended question regarding the advantages of using the
appointment system. Of the 16 survey participants who answered, 7 said there were no

43
advantages. Others stated that the appointment system could work better if containers and
equipment were ready, on-dock transaction times were reduced, or those with appointments
did not have to wait in line at the terminal gates or on the dock.
A number of conclusions can be drawn based on this study. First, the use of the appointment
system varies greatly and depends upon operating policies of individual terminals. Second,
perceptions of the appointment system’s effectiveness differ across user groups. Third, there
is no evidence that the appointment system has affected queuing at marine terminal gates and
fourth, while a majority of the terminals that did not offer extended gate hours implemented
an appointment system in response to the legislation, most did so in order to avoid paying the
high labor costs associated with extending operations to off-peak hours. Following is an
explanation for the finding concluded from this study:
The regulation was imposed from the outside, not as an industry response to a
perceived problem.
There were other operational changes already underway that had a more dramatic
impact on the ability of terminals to operate more efficiently.
The costs and risks of not complying were low compared to the alternative of
extended gate hours.
However, this study was conducted on the ports of Los Angeles and Long Beach. Further
studies should also be conducted across different ports of U.S.A to measure the effectiveness
of the countermeasures proposed in this study.

44
Chapter 5. Survey for Assessing the Effectiveness of
Countermeasures
To assess the effectiveness of various countermeasures to reduce truck waiting time at
Marine Terminals, a survey was conducted within the greater Houston area. The survey was
conducted on various trucking companies and truck drivers. A questionnaire survey was
prepared and distributed through mails and emails. Moreover, various truck stops were visited
within greater Houston and truck drivers were approached and asked to participate in the survey.
The following sections will provide more details regarding this survey-based study. The survey
instrument is presented in the Appendix section.
5.1 Methodology
In order to assess the effectiveness and feasibility of the existing countermeasures, a
survey was conducted to the officials from drayage companies and truck drivers. The purpose of
this survey was to find out the perception of truck drivers and officials of drayage companies
about the truck congestion problem at ports and solicit their feedback on the existing
countermeasures for reducing truck congestion. A questionnaire survey was prepared which
consisted of 22 questions. The survey was conducted on a total of 130 people. The questions
were divided into 3 parts.
1) Part 1: general questions regarding marine terminals and operations of drayage
companies.
2) Part 2: questions related to truck congestion and other problems faced by truck drivers
at marine terminals.
3) Part 3: questions about countermeasures for mitigating truck congestion at marine
terminals.
The detailed survey instrument is provided in the appendix. The participants of the survey
comprised of truck drivers and officials of different drayage companies in the greater Houston
area. All these surveyed drayage companies and truck drivers had regular business with ports and
need to go to marine terminals for picking or delivering goods on a regular base.
The survey was conducted by three different approaches. First, the survey was sent
through e-mail to different truck drivers and officials of drayage companies. Second, the survey
forms were mailed to drayage companies situated in the greater Houston area. Third, a field
survey was conducted on 6 truck stops within the greater Houston area where truck drivers were
approached directly and asked to participate in the survey. Besides, an interview with the gate
manager of Barbour’s Cut Container Terminal was conducted to gather opinions from the port
authority. After the survey was completed, the responses were recorded and analyzed. From the
survey responses, problems at the marine terminals were identified and the effective
countermeasures for mitigating truck congestions at marine terminals and the strategies for
improving their effectiveness were also identified.

45
5.2 Data Collection
Data were collected through conducting a survey through mails and emails to various
trucking companies operating within greater Houston. Besides, an interview with the gate
manager of Barbour’s Cut Container Terminal was also conducted to gather opinions from the
port authority. Moreover, a number of truck stops were visited and truck drivers were
approached and requested to participate in the survey and their responses were collected. All the
data collected were analyzed in statistical software SPSS and Microsoft Excel. After analyzing
the responses, conclusions were drawn and presented in this report.
5.3 Results & Discussion
5.3.1 General questions regarding marine terminals and operations of drayage companies
Types of Services Provided by Drayage Companies
Survey participants were asked the types of services they provided (Pickup, Delivery or
both). 45 out of 130 responders said that they provided both pickup and delivery services
which constitute about 35% of all the participants. 47 people answered only delivery, and 27
people answered only pickup.
Average Length of Movement by Trucks
Responders were asked the average length they have to travel from/to the marine terminal.
The options were less than 50 miles, 50-99 miles, 100-249 miles, 250-499 miles, and 500+
miles. 34 out of 130 people responded they traveled less than 50 miles whereas only 8 people
responded 500+ miles.
5.3.2 Questions related to truck congestion and other problems faced by truck drivers at marine
terminals
Perceived Seriousness of Congestion Problem at Terminals
Survey responders were asked about the seriousness of truck congestion at marine terminals.
Only 28 people out of 130 responded that the congestion problem is not serious at marine
terminals. The rest of the responses ranged from somewhat serious to very serious apart from
the 11 missing responses. Figure 5.1 presents the survey results regarding the perceived
seriousness of congestion problem at terminals.

46
Figure 5. 1: Perceived Seriousness of Congestion Problem
Problems Faced at Marine Terminals
Several problems that are faced by truckers at marine terminals have been identified by the
literature and the survey participants were asked to rate the problems according to their
severity. The mean scores of each of the problems were calculated on a scale of 4. Figure 5.2
presents the survey results regarding the problems faced at terminals. Based on the responses,
“Congestion/Waiting/Delays” is identified as the most severe problem faced by truckers
which received a mean score of 2.82 and followed by “Slow Operation” which received a
mean score of 2.62.
Figure 5. 2: Mean Values of Problems Faced at Terminals (On a scale of 4).
2.82
2.62
2.33
2.25
2.09
2.02
1.96
1.89
1.87
0.0 0.5 1.0 1.5 2.0 2.5 3.0
Congestion/Waiting/Delays
Slow Operation
Hours of Operation
Hours Too Rigid
Product Not Being Available
Containers Being Littered
Not Wide Enough For Trucks/Clearance
Inadequate Parking Space For Trucks
Connections Too Far Away From Ports
Mean Score
Prob
lem
s

47
5.3.3 Questions about countermeasures for mitigating truck congestion at marine terminals
Effectiveness of Gate Appointment System
Survey participants were asked about the effectiveness of the gate appointment system. The
options ranged from not effective to very effective. Figure 5.3 presents the survey results
regarding the effectiveness of gate appointment system. Only 30 people felt it was not
effective and the rest of the responders felt gate appointment system was at least somewhat
effective in reducing truck congestion at marine terminals.
Figure 5. 3: Effectiveness of Gate Appointment System.
Strategies for Improving the Effectiveness of Gate Appointment System
As discussed in the “Countermeasures” section, the gate appointment system can be more
effective by applying several strategies. The survey participants were asked to vote for the
strategies that can improve the effectiveness of gate appointment system. The participants
were provided with the option to select more than one strategy. Table 5.1 presents the survey
results regarding these strategies.
Table 5. 1: Strategies for Improving the Effectiveness of Gate Appointment System
Strategies Number of Votes Percentage
Having Dedicated Lanes for Trucks with
Appointments
80 61.50%
Agree to Appointments Made During That Day 70 53.80%
Handle Cancellations of Appointments by Phone 69 53.10%

48
Allow for Reservation by Phone 64 49.20%
Re-assign Reserved Time That Has Been
Cancelled
64 49.20%
Better Organization of Terminal Operations 64 49.20%
Gathering All Trucks in Marshalling Yard 54 41.50%
Decline Double/Triple Appointments for The
Same Container
53 40.80%
Fines for Missed Reservations 54 41.50%
Operation Based on Container Appointment 50 38.50%
It’s clear from the above table that “Having Dedicated Lanes for Trucks with Appointments”,
“Agree to Appointments Made During That Day” and “Handle Cancellations of
Appointments by Phone” were the most popular choices among the participants as 61.50%,
53.80% and 53.10% people selected those strategies over other strategies respectively.
Effectiveness of Extended Gate Hour
Participants were asked about the effectiveness of extended gate hour in mitigating truck
congestion at marine terminals. 26 people responded it was very effective and 30 people
responded it was not effective. Figure 5.4 presents the survey results regarding the
effectiveness of extended gate hours.
Figure 5. 4: Effectiveness of Extended Gate Hour

49
Strategies for Improving the Effectiveness of Extended Gate Hour
Similar to the question about strategies for gate appointment system, survey participants were
also asked to vote for the strategies that can improve the effectiveness of extended gate hour.
Likewise, the participants were provided with the option to select more than one strategy.
Almost 61% people preferred the strategy “Use Extended Gate Hour with Gate Appointment
System” over other options. “Provide Incentives to Drayage Operators” were preferred by
almost 53% of participants. The following Table 5.2 shows the strategies for extended gate
hour.
Table 5. 2: Strategies for Extended Gate Hour.
Strategies Number of Votes Percentage
Use Extended Gate Hour with Gate
Appointment System
79 60.80%
Provide Incentives to Drayage Operators 68 52.30%
Regular Hour Surcharge 57 43.80%
Use Extended Gate Hour in Weekends 79 60.80%
Other Operational Countermeasures for Reducing Truck Congestion at Terminals
Several other operational countermeasures were identified from the literature review. Survey
participants were asked to rate the countermeasures based on their effectiveness. The mean
score of each of the countermeasures was calculated on a scale of 4. Figure 5.5 presents the
survey results regarding other operational countermeasures. “Connect Truckers and Cargo
Owners by Third Parties” received the highest mean score of 2.75 among all the other
countermeasures which was followed by “Promote Two-way Loaded Movement” (a mean
score of 2.54) and “Pre-staging Containers for Bulk delivery” (a mean score of 2.39). All the
other countermeasures received scores below 2.
Figure 5. 5: Mean Values of Countermeasures to Reduce Truck Congestion at Terminals (On a scale of 4).
2.75
2.54
2.39
2.12
1.99
1.92
1.88
0.0 0.5 1.0 1.5 2.0 2.5 3.0
Connect Truckers And Cargo Owners By Third
Parties
Promote Two-way Loaded Movement (Eliminating
Need For Dropping-off Empty Containers)
Pre-staging Containers For Fulk Delivery
Allow Containers From Major Customers To Be
Moved To A Designated Area
Pre-entering Truck and Cargo Information Before
Arriving To The Port
Collect & Drop-off empty Containers At Off-dock
Storage Yard
Shifting Traffic Away From Gates By Using
Cellphone Lots
Mean Score
Cou
nte
rmea
suer
e

50
Effectiveness of Technology-Based Countermeasures
Participants were asked about the effectiveness of different technologies used in marine
terminals for improving operation and reducing truck congestion. Only 22 out of 130 people
felt technologies were not effective. 9 responses were missing. Figure 5.6 presents the
survey result regarding the effectiveness of technology-based countermeasures.
Figure 5. 6: Effectiveness of Technology-Based Countermeasures.
5.3.4 Summary of the Open-ended Questions
In the survey questionnaire, the participants were also asked some open-ended questions
to provide their suggestions/comments regarding problems faced at terminals and
countermeasures. Some of the participants provided their opinions regarding these issues. The
main findings from these responses are summarized below:
Off-dock storage yards are effective in mitigating truck congestion when the number
of trucks doesn’t exceed a certain limit. This number depends on the configuration
and capacity of the terminal.
Technologies can be used to improve the communication between drivers and
terminal operators so that the drivers don’t arrive at the terminal before the
availability of the container.
The procedure to resolve issues regarding trouble tickets could be improved by using
innovative technologies to reduce truck waiting time inside the terminal.

51
The gate appointment system will not work for the trucks that need to visit the
terminal more than once in a day. It is because that the truck turnaround time in the
marina terminal is very difficult to predict. If the trucks miss one appointment, all the
rest of the appointments needs to be rescheduled. Therefore, the gate appointment
system is more feasible for the trucks that only need to visit the terminal once a day.
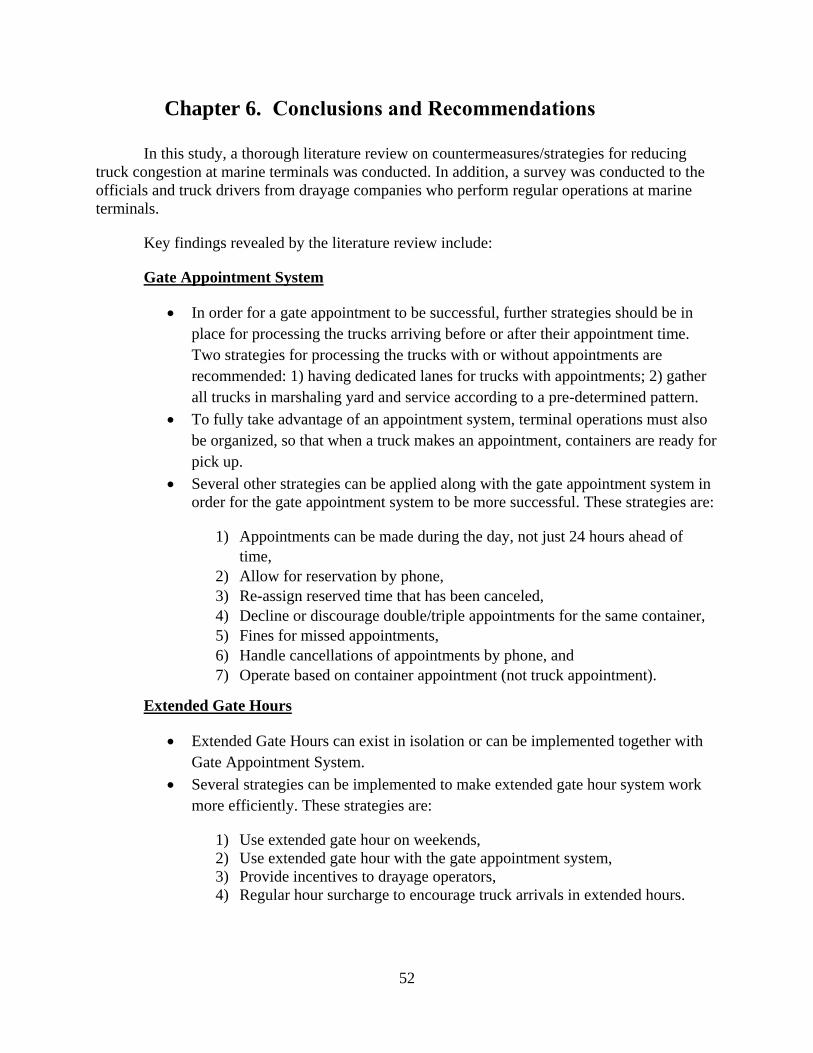
52
Chapter 6. Conclusions and Recommendations
In this study, a thorough literature review on countermeasures/strategies for reducing
truck congestion at marine terminals was conducted. In addition, a survey was conducted to the
officials and truck drivers from drayage companies who perform regular operations at marine
terminals.
Key findings revealed by the literature review include:
Gate Appointment System
In order for a gate appointment to be successful, further strategies should be in
place for processing the trucks arriving before or after their appointment time.
Two strategies for processing the trucks with or without appointments are
recommended: 1) having dedicated lanes for trucks with appointments; 2) gather
all trucks in marshaling yard and service according to a pre-determined pattern.
To fully take advantage of an appointment system, terminal operations must also
be organized, so that when a truck makes an appointment, containers are ready for
pick up.
Several other strategies can be applied along with the gate appointment system in
order for the gate appointment system to be more successful. These strategies are:
1) Appointments can be made during the day, not just 24 hours ahead of
time,
2) Allow for reservation by phone,
3) Re-assign reserved time that has been canceled,
4) Decline or discourage double/triple appointments for the same container,
5) Fines for missed appointments,
6) Handle cancellations of appointments by phone, and
7) Operate based on container appointment (not truck appointment).
Extended Gate Hours
Extended Gate Hours can exist in isolation or can be implemented together with
Gate Appointment System.
Several strategies can be implemented to make extended gate hour system work
more efficiently. These strategies are:
1) Use extended gate hour on weekends,
2) Use extended gate hour with the gate appointment system,
3) Provide incentives to drayage operators,
4) Regular hour surcharge to encourage truck arrivals in extended hours.

53
Other Operational Countermeasures
Apart from gate appointment system and extended gate hour, there are other
operational countermeasures, such as pre-staging containers for bulk delivery,
pre-entering truck and cargo information before arriving at the port, using
cellphone lots, using off-dock storage yard, connect truckers and cargo owners by
third parties, and promoting two-way loaded movement.
Technology-Based Countermeasures
The implementation of advanced technologies and information systems could also
improve the operational efficiencies of marine terminals. In this report, state-of-art
technologies used to reduce truck congestion in the marine terminal were introduced,
which include:
1) Automation Technologies, such as Optical Character Recognition, Global
Positioning System, Radio Frequency Identification Device, Barcode Readers,
Voice Recognition, Automated Guided Vehicle (AGV)
2) Terminal Operating Systems, such as Freight Information Real-Time System for
Transport (FIRST), Pacific Gateway Portal (PGP), SynchroMet, SEA LINK®,
eModal, NAVIS, COSMOS, Embarcadero (ESC), Maher Terminal Logistics
Systems Gate and Yard Automated System
3) Other Technology-Based Countermeasures such as Virtual Container Yard (VCY)
The description for each countermeasure was summarized into several tables.
The results of the survey conducted in this study lead to the following key findings:
“Congestion/Waiting/Delays” and “Slow Operation” are the two most concerning
problems faced by the US marine terminals.
Gate appointment system and extended gate hour operation are two effective and
most popular countermeasures that have the potentiality to mitigate truck
congestion and there are some strategies could be used with these
countermeasures to improve their effectiveness. Specifically,
o “Having Dedicated Lanes for Trucks with Appointments”, “Agree to
Appointments Made During That Day” and “Handle Cancellations of
Appointments by Phone” are the preferred strategies for using a gate
appointment system, and
o “Use Extended Gate Hour with Gate Appointment System” and “Provide
Incentives to Drayage Operators” are the preferred strategies for using
extended gate hour operation.
There are other operational countermeasures that can mitigate truck congestion at
marine terminals. Among them, “Promote Two-way Loaded Movement”,
“Connect Truckers and Cargo Owners by Third Parties” and “Pre-staging

54
Containers for Bulk Delivery” are preferred by the truck drivers and drayage
companies.
In addition, more useful information about the effectiveness and limitations of
some countermeasures are obtained from answers to the open-ended questions. The
findings of this study will help port managers to select the most feasible and cost-
effective countermeasures for reducing truck congestion at marine terminals in the future.
In this study, the survey responses are received from 130 participants in the greater
Houston area. The results of this research could be improved by conducting a survey on
more truck drivers and drayage companions in different areas in the future.

55
References
1. Maguire, A., Ivey, S., Golias, M. M., & Lipinsk, M. (2010, March). Relieving congestion at
intermodal marine container terminals: review of tactical/operational strategies. In 51th
Annual Transportation Research Forum (pp. 11-13).
2. Huynh, N. N. (2005). Methodologies for reducing truck turn time at marine container
terminals (Doctoral dissertation).
3. Maria, B., Eleftherios, S., & Afroditi, A. (2014, April). Evaluating strategies to improve
access to marine container terminals and streamline gate operations. In Transport Research
Arena (TRA) 5th Conference: Transport Solutions from Research to Deployment.
4. Azab, A. E., & Eltawil, A. B. (2016). A Simulation Based Study Of The Effect Of Truck
Arrival Patterns On Truck Turn Time In Container Terminals. In ECMS (pp. 80-86).
5. Morais, P., & Lord, E. (2006). Terminal appointment system study (No. TP 14570E).
6. Ioannou, P. A., Jula, H., Liu, C. I., Vukadinovic, K., Pourmohammadi, H., & Dougherty, E.
(2000). Advanced material handling: Automated guided vehicles in agile ports. Center for
Advanced Transportation Technologies, Univ. Southern California, Los Angeles.
7. Ioannou, E. B., Kosmatopoulos, E. B., Jula, H., Collinge, A., Liu, C. I., Asef-Vaziri, A., ... &
Third Floor Ardmore, P. A. (2000). Cargo Handling Technologies Final Report. University
of Southern California Center for Advanced Transportation Technologies.
8. Cimino, M. G., Celandroni, N., Ferro, E., La Rosa, D., Palumbo, F., & Vaglini, G. (2015).
Wireless communication, identification and sensing technologies enabling integrated
logistics: a study in the harbor environment. arXiv preprint arXiv:1510.06175.
9. Shi, X., Tao, D., & Voß, S. (2011). RFID technology and its application to port-based
container logistics. Journal of Organizational Computing and Electronic Commerce, 21(4),
332-347.
10. Kia, M., Shayan, E., & Ghotb, F. (2000). The importance of information technology in port
terminal operations. International Journal of Physical Distribution & Logistics Management,
30(3/4), 331-344.
11. Ammah-Tagoe, F. (2006). Freight in America: A New national picture. US Department of
Transportation, Research and Innovative Technology Administration, Bureau of
Transportation Statistics.
12. Roche Ltée and Levelton Consultants Ltd. Terminal appointment system study. Prepared for
Transportation Development Centre of Transport Canada.
13. OCR in Ports and Terminals. A Port Equipment Manufacturers Association (PEMA)
Information Paper
14. Guan, C. Q. (2009). Analysis of Marine Container Terminal Gate Congestion, Truck Waiting
Cost, and System Optimization (Doctoral dissertation), New Jersey Institute of Technology.
15. Chen et al. “Using time-varying tolls to optimize truck arrivals at ports”,
Transportation Research Part E: Logistics and Transportation Review. 2011
16. Chen and Yang, “Methods for estimating vehicle queues at a marine terminal: a
computational comparison”, International Journal of Applied Mathematics and Computer
Science. 2014
17. Morais, P., & Lord, E. (2006). Terminal appointment system study (No. TP 14570E).
18. Regan, A. C., & Golob, T. F. (2000). Trucking industry perceptions of congestion problems
and potential solutions in maritime intermodal operations in California. Transportation
Research Part A: Policy and Practice, 34(8), 587-605.

56
19. Giuliano, G., O’Brien, T., Dell'aquila, P., & Hayden, S. (2006, September). The terminal gate
appointment system at the ports of Los Angeles and Long Beach: An assessment. In Metrans
Seminar (Vol. 13).
20. Lange, A. K., Schwientek, A., & Jahn, C. (2017). Reducing truck congestion at ports–
classification and trends. In Proceedings of the Hamburg International Conference of
Logistics (HICL) (pp. 37-58). epubli.

57

58
Appendix: Survey Instrument
Survey Consent Form The transportation researchers at Texas Southern University is conducting a research project titled “innovative countermeasures
for reducing the truck waiting time at marine terminals” for the Center for Advanced Multimodal Mobility Solutions and
Education (CAMMSE). For this study, we are conducting a survey on different marine terminals and trucking companies in
Texas. The purpose of this survey is to assess the effectiveness of different innovative countermeasures for reducing truck
waiting times at marine terminals. Your responses to this survey will provide important information for formulating solutions in
reducing terminal congestion in the future.
PARTICIPATION
Your participation in this survey is voluntary. You may refuse to take part in the research or exit the survey at any time without
penalty. You are free to decline to answer any particular question you do not wish to answer for any reason.
BENEFITS
You will receive no direct benefits from participating in this research study. However, your responses will help us to determine
best possible countermeasures to mitigate truck turnaround time at Marine Terminals especially at terminal gates.
RISKS
There are no foreseeable risks involved in participating in this study
CONFIDENTIALITY
Your survey answers will remain anonymous. No one will be able to identify you or your answers, and no one will know whether
or not you participated in the study. However, you will be asked to provide your name, contact information and email address but
it’s completely up to you whether you want to provide this information or not.
CONTACT
If you have questions at any time about the study or the procedures, you may contact me (Hasin Fahad Jinna) via phone at 713-
345-0627 or via email at [email protected].
CONSENT
"This study has been explained to me. I volunteer to take part in this research. I have had an opportunity to ask questions. If I
have questions later about the research, I can ask one of the researcher(s) listed above. If I have questions about my rights as a
research participant, I can call the Texas Southern University Office of Research at 713-313-4301, or go to visit the Office of
Research on the Texas Southern University website (http://www.tsu.edu)."
Please select your choice below. You may print a copy of this consent form for your records. Clicking on the “Agree” button
indicates that
You have read the above information
You voluntarily agree to participate
You are 18 years of age or older
Agree
Disagree
Enclosed you will find a self-addressed, stamped envelope to use when returning the survey. Please feel free to include
any additional comments you deem necessary or relevant to this project. Your response and time is greatly
appreciated. Thank you!
Name of Port/Terminal: ___________________________ E-mail: ______________________
Contact No: __________________________ Years in Practice: ________________________
Part 1. General questions
1. What are the operating hours in the terminal when trucks can enter/exit the terminal precinct?
______________________________________________
2. Does the terminal operate during the weekends? A) Yes B) No
Part 2. Congestion related questions at Marine Terminals
3. How serious the truck congestion problem is especially at ports? A) Not serious
B) Somewhat serious C) Serious D) Very serious E) Extremely serious
4. What is the typical time that import/export trucks have to wait at the gate of container
terminals to get in?
A) < 15 minutes B) 15-30 minutes C) 30-45 minutes D) 45-60 minutes

59
E) >60 minutes
5. What is the typical time that import/export trucks have to wait inside terminals?
A) < 15 minutes B) 15-30 minutes C) 30-45 minutes D) 45-60 minutes
E) >60 minutes
6. How frequently, there is congestion of import/export truck activity during the peak hours?
A) Never B) Sometimes C) Often D) Very often E) Always
7. How frequently, people serving the trucks in the landside area are shifted to the quayside
area to serve the vessels? A) Never B) Sometimes C) Often D) Very often
E) Always
8. How often the terminal is over saturated by the number of trucks? A) Never B)
Sometimes C) Often D) Very often E) Always
9. How often the number of trucks to be served at the gates is greater than the service rate (The
time allotted for each truck to be served)? A) Never B) Sometimes C) Often D) Very
often E) Always
10. Typically during which period of the day, the number of trucks to be served is the highest
and greater than the service rate? A) Early morning B) Morning C) Noon D)
Afternoon E) Evening F) Night
11. Please provide your comments/suggestions/concerns about truck congestion in
ports/terminals.
Part 3. Countermeasures to mitigate Truck Waiting time at Marine Terminals
12. Please rate the following countermeasures according to the measure of effectiveness in
reducing truck turn time at Marine Terminals (1= not effective to 5 = very effective).
Countermeasure
Not effective Very effective
1 2 3 4 5
Pre-staging containers for bulk delivery
Pre-entering truck and cargo information before
arriving to the port
Shifting traffic away from gates by using cellphone
lots and paging drivers using a smartphone
application
Collect & drop-off empty containers at off-dock
storage yard
Allow containers from major customers to be moved
to a designated area (off-dock storage yard) where
truckers could quickly peel off those containers
destined for distribution centers inland.

60
Connect truckers and cargo owners by third parties
(triangulation of trucker calls) in a region so that a
container that is unloaded at a distribution
warehouse is matched with an exporter that needs
the empty container.so that trucker delivers the
empty container to the exporter rather than bringing
it back to the marine terminal
Promoting two-way loaded movement (eliminating
the need for dropping off empty containers)
Assigning specific yard cranes to serve
import/export trucks only
13. Please provide your comments/suggestions/concerns about reducing truck turn time at
Marine Terminals.
Gate Appointment System
14. Does your port/terminal use the Gate Appointment System? A) Yes B) No (If yes,
then answer the following set of questions, otherwise skip this section)
15. Do you think Gate Appointment System is effective in mitigating truck waiting time at
terminal gates? A) Not effective B) Little effective C) Somewhat effective
D) Effective E) Very effective
16. Please select the following strategies in order for a Gate Appointment System to be
successful (Check all that apply).
A) Having dedicated lanes for trucks with appointments B) Gather all trucks in marshalling
yard and service them according to a pre-determined pattern C) Better organization of
Terminal Operations D) Handle cancellations of appointments by phone E) Re-assign
reserved time that has been cancelled F) Agree to appointments there are made during the
day, not just 24 hours ahead of time G) Decline or discourage double/triple appointments
for the same container H) Fines for missed reservations I) Operate based on container
appointment (not truck appointment) J) Allow for reservation by phone
17. Please provide your comments/suggestions/concerns about the Gate Appointment System.
Extended Gate Hour
18. Does your port/terminal use the Extended Gate Hour Operation (Off-Peak Program? A) Yes
B) No (if yes, then answer the following set of questions, otherwise skip this section)
19. Do you think Extended Gate Hour Operation is effective in mitigating truck waiting time at
61
terminal gates? A) Not effective B) Little effective C) Somewhat effective D)
Effective E) Very effective
20. Please select the following strategies in order for Extended Gate Hour Operation to be
successful at mitigating truck waiting time at marine terminals (Check all that apply).
A) Use Extended Gate Hour in weekends B) Use Extended Gate Hour with Gate
Appointment System C) Provide incentives to drayage operators D) Peak hour
surcharge
21. Please provide your comments/suggestions/concerns about Extended Gate Hour Operation
in reducing truck turn time at terminals.
Technologies
Following is a table of summary of technologies that are currently being used in ports/terminals.
A) Optical Character Recognition: Automatically identify containers, truck plate and chassis
information at entry and exit gates, yard and quay operations.
B) Global Positioning System: Identify container position in terminal.
C) Radio Frequency Identification Device: Track trucks, containers and cargo in terminal.
D) Barcode Readers: Identify containers position in terminal.
E) Voice Recognition: Assist in capturing and processing data, provide communications
between the crane operator and ground personnel.
F) Automatic Gate Systems: Use camera portals and optical recognition to read the number
on the container, search the billing file to see whose cargo it is, and determine where it needs
to go. Drivers can be identified with fingerprints, increasing security and accountability.
G) Automated Guided Vehicle: Driven by an automatic control system which serves as the
driver. It is considered to be the most flexible type of material handling system.
H) Virtual Container Yard: A web-based information system with inventory of empty
containers allowing suppliers and shippers to access containers at convenient storage locations
outside the terminal.
I) FIRST: Web based real-time network integrates many resources into a single show on
cargo and port information.
J) PGP: Web based system provides containers status, vessel activity, and real-time video
images from port landside infrastructure and driver validation.
K) SynchroMet: Virtual container yard to alleviate public road and port congestion at local
marine terminals.

62
L) SEA LINK: Truck driver identification system to speed trucks through marine terminal
gates.
M) eModal: Web based system provide all container information needs: container status,
vessel schedules, terminal locations, truck driver lists.
N) NAVIS: Automate and integrate data input, real-time monitoring at terminal.
O) COSMOS: Integrated yard control and terminal/vessel planning system in real time by
radio frequency.
P) ESC Embarcadero: Web-based visibility tools use DGPS and WLANS to report position
of equipment and provide real-time communication.
22. What are the technologies that are used in the terminal where you work? (please provide
names)
23. Do you think Automation Technologies are effective in mitigating truck waiting time at
terminal gates? A) Not effective B) Little effective C) Somewhat effective
D) Effective E) Very effective
24. Please provide your comments/suggestions/concerns about using Technologies in reducing
truck turn time at terminals.