INNOVATION & SOCIAL MEDIA IN LOCAL TV NEWS · a digital place, digital show, ... We’ve changed...
43
INNOVATION & SOCIAL MEDIA IN LOCAL TV NEWS INNOVAT IN LOCAL DIA Local TV News and the New Media Landscape: Part 2 Local TV News an
Transcript of INNOVATION & SOCIAL MEDIA IN LOCAL TV NEWS · a digital place, digital show, ... We’ve changed...

1
INNOVATION & SOCIAL MEDIA IN LOCAL TV NEWS
INNOVATION & SOCIAL MEDIA IN LOCAL TV NEWS
INNOVATION & SOCIAL MEDIA IN LOCAL TV NEWS
Local TV News and the New Media Landscape: Part 2 Local TV News and the New Media Landscape: Part 2
2
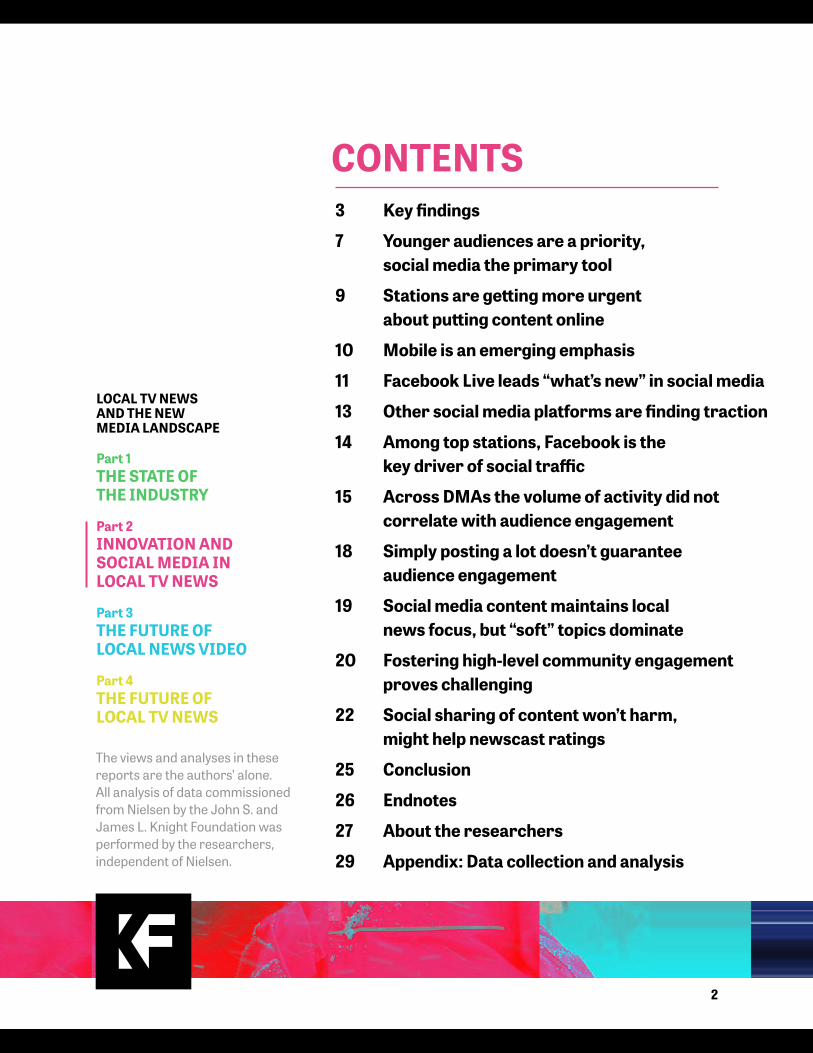
CONTENTS3 Key findings
7 Younger audiences are a priority, social media the primary tool
9 Stations are getting more urgent about putting content online
10 Mobile is an emerging emphasis
11 Facebook Live leads “what’s new” in social media
13 Other social media platforms are finding traction
14 Among top stations, Facebook is the key driver of social traffic
15 Across DMAs the volume of activity did not correlate with audience engagement
18 Simply posting a lot doesn’t guarantee audience engagement
19 Social media content maintains local news focus, but “soft” topics dominate
20 Fostering high-level community engagement proves challenging
22 Social sharing of content won’t harm, might help newscast ratings
25 Conclusion
26 Endnotes
27 About the researchers
29 Appendix: Data collection and analysis
The views and analyses in these reports are the authors’ alone. All analysis of data commissioned from Nielsen by the John S. and James L. Knight Foundation was performed by the researchers, independent of Nielsen.
LOCAL TV NEWS AND THE NEW MEDIA LANDSCAPE
Part 1 THE STATE OF THE INDUSTRY
Part 2 INNOVATION AND SOCIAL MEDIA IN LOCAL TV NEWS
Part 3 THE FUTURE OF LOCAL NEWS VIDEO
Part 4 THE FUTURE OF LOCAL TV NEWS

3
LOCAL TELEVISION NEWS IS FREQUENTLY CRITICIZED FOR ITS LACK OF INNOVATION. And in one sense, that’s probably accurate. Station newscasts today look much the way they have for the last 30 years. But that doesn’t mean there isn’t plenty of innovation. It’s just that most of it isn’t happening on air; it’s exemplified by a digital-first mentality that’s showing up everywhere except on air.
• Many stations are consciously seeking new audiences. Stations self-report myriad strategies to find and reach new and especially younger audiences. Chief among these is an emphasis on social media, including traditional social media outreach and content designed and oriented toward a social and sharing environment.
• Facebook is a dominant platform and use of Facebook stands out as a central social medium and a streaming distribution service. Many stations report using Facebook as their primary social media outreach strategy in addition to using Facebook Live as a new way to deliver content
• Sharing content on Facebook does not cannibalize the news-cast audience. Analysis of Facebook engagement data and Nielsen ratings data indicates a significant correlation between days with higher levels of social engagement and higher news-cast ratings. However, cause and effect are not clear and the driver for both may simply be the day’s news events.
KEY FINDINGS KEY FINDINGS KEY FINDINGS KEY FINDINGS

4
To better understand whether and how local TV news stations have been trying to innovate in their approach to reporting, producing and distributing news, this study began with the most comprehensive industry survey: the Radio Television Digital News Association/Hofstra University Annual Survey (RTDNA/Hofstra University Survey).1 This survey, which had responses from 357 of the country’s 705 TV newsrooms in 2016, is an imperfect tool but is the most comprehensive outreach to TV stations each year.2 Along with the RTDNA Survey, we also sent multiple emails to every local TV news director seeking their own innovations or the innovations of others
TV news directors understand that if a significant part of the potential audience will not come to them, then stations must seek out the audience. We found that almost two-thirds (65 percent) of station innovations were focused on digital platforms: 17 percent were technical in nature; 14 percent detailed altered approaches to newscast presentation or coverage; and 4 percent dealt with organizational structure.
Sometimes, the innovation looked a lot like a second take on an older idea. For example, KLTV-TV in Tyler, TX, started all day streaming in 2008. That was too early to make it work, according to assistant news director and anchor Joe Terrell, but it set the stage for their current efforts. The digital director at corpo-rate parent Raycom, Glen Hale, says the station in Tyler is one of the company’s most aggressive. “They’re planning to focus everything on real-time distribution of content on OTT (over-the-top), producing the news as a video stream that can go anywhere.”
A number of stations are now running digital-only newscasts. KGMB-TV in Honolulu, HI, calls them “snackable” newscasts or “shortcasts.” The station also recently moved sports out of its newscasts and put that content online. That’s where the real sports fans are these days, according to Mary Vorsino, the station’s digital content director.
Almost two-thirds (65 percent) of station innovations were focused on digital platforms
INNOVATION & SOCIAL MEDIA IN LOCAL TV NEWS INNOVATION & SOCIAL MEDIA IN LOCAL TV NEWSLocal TV News and the New Media Landscape: Part 2 Local TV News and the New Media Landscape: Part 2

5
KWCH-TV in Wichita, KS, didn’t go quite that far, but they built an online sports network that’s been quite popular. In Detroit, the digital first strategy manifests as its own ecosystem. “We’ve created a digital space that didn’t exist: a digital set, a digital place, digital show, digital people,” says Kim Voet, news director at WDIV-TV. “We have a digital anchor and digital shows — online and on Facebook Live.”
“Some our most innovative projects have involved digital episodic content that is digital first — major investigative stories have made a big difference,” notes Ellen Crooke, Vice President News at Tegna Media. “With digital first, we reach more people than just running a piece on Thursday night. We’ll have millions of page views. We’ve changed lives and changed laws; we’ve reached a younger audi-ence.” Crooke says their efforts started with “Charlie Foxtrot” — a project on veteran suicides, then “The Triangle” took on heroin in the Atlanta suburbs, and they’re now working on investigating sex trafficking across the country.
Most of our innovator stations have changed the digital staffing at the station. Some hired digital-only reporters or producers. Some hired a whole bunch of digital people, sometimes converting old positions to keep head count steady. A number of stations converted existing positions into multi-media journalists or expanded the number of backpack journalists — many with a digital focus.
KATC-TV in Lafayette, LA, was an early adopter of digital first and rearranged its staffing to ensure follow-through. Despite being market 120, the station puts three people on the desk all day to ensure that the station’s product is distrib-uted across all platforms. “We’ve been consistently moving more assets, more resources, more technology toward digital distribution. We’ve created blended positions; for example, my desk person is in charge of posting to social, posting web,” said KATC News Director Letitia Walker. “Every newscast has a web person or more than one to develop content for TV, but primarily the web.”
INNOVATION & SOCIAL MEDIA IN LOCAL TV NEWS INNOVATION & SOCIAL MEDIA IN LOCAL TV NEWSLocal TV News and the New Media Landscape: Part 2 Local TV News and the New Media Landscape: Part 2

6
Our innovators have all run news on various digital platforms before running it on air, and a number of them have run major projects on digital first. “Some-times the hits online far exceed anything on air,” notes Bob Walters, then news director at KNOE.
“We do a lot of just Facebook stories,” says Voet at WDIV. “We did something on people missing in Michigan earlier … on Facebook … seen by 1.1 million people.”
But what audiences see on morning and evening newscasts has changed little. Hank Price, president and general manager of WVTM-TV in Birmingham, AL, says reinventing TV news will not be easy.
“Our product has become completely predictable,” Price said, “but radical change is not the answer. We have to start with rethinking our product with the audience in mind. Most of what we do is unrelated to viewers, and viewer inter-ests are rarely considered.”
And some acknowledge that the industry itself often fails to reward innovation.
“We eat our young,” cautions Crooke. “We make fun of people who try some-thing different or new. We say it’s not journalism. We criticize innovation as if there’s a conflict between journalism and innovation. People see new things as against journalism. We need to support innovations and companies trying new things. We need to support our people.”
INNOVATION & SOCIAL MEDIA IN LOCAL TV NEWS INNOVATION & SOCIAL MEDIA IN LOCAL TV NEWSLocal TV News and the New Media Landscape: Part 2 Local TV News and the New Media Landscape: Part 2
7
Almost two-thirds of TV news directors (63 percent) in the RTDNA Survey reported that they were doing something specific to reach 18 to 34-year-olds. Leading the way were efforts to improve social media outreach. Over half (55 percent) said what they were doing to reach younger audiences was “social media.” (Some said that they were “emphasizing social media” or “aggressively pushing social media”). Coming in second, at 15 percent, were news directors who said they were pushing specific social platforms or features. A third of mentions concerned Facebook Live. Snapchat came in next, closely followed by Instagram, then, further back, Twitter, Burst and YouTube.
Some reported new content strategies targeting a younger audience. A total of 14 percent reported developing younger-oriented content on digital platforms. Few specifics were provided, although one news director said the station was doing live chats aimed at millennials. At 10 percent came a millennial-oriented digital strategy. In most cases, nothing else was reported, although one news director said the station had created a website specifically for millennials. Several Sinclair Broadcast Group news directors also noted Sinclair’s efforts with Circa: a “mobile-friendly, video-driven news and entertainment portal” aimed at millennials that emphasizes shareable content and easy customization.3
YOUNGER AUDIENCES ARE A PRIORITY, SOCIAL MEDIA THE PRIMARY TOOL
INNOVATION & SOCIAL MEDIA IN LOCAL TV NEWS INNOVATION & SOCIAL MEDIA IN LOCAL TV NEWSLocal TV News and the New Media Landscape: Part 2 Local TV News and the New Media Landscape: Part 2

8
A much smaller number reported other approaches. For example, five stations noted new on-air programs aimed at millennials (or at least younger people). Another five noted alterations to one or more newscasts to target millennials or running a newscast at a non-traditional time; another noted a faster-paced show; and another mentioned including social media comments on the air. Four stations reported digital producer hires. Three mentioned technology: measuring social media impact, Roku and over-the-top (OTT) content (content transmitted via the internet as a standalone product).
Surprisingly, a quarter to a third of TV news directors said they were doing nothing new online or in social media or in trying to reach younger viewers.
Surprisingly, a quarter to a third of TV news directors said they were doing nothing new online or in social media or in trying to reach younger viewers.
INNOVATION & SOCIAL MEDIA IN LOCAL TV NEWS INNOVATION & SOCIAL MEDIA IN LOCAL TV NEWSLocal TV News and the New Media Landscape: Part 2 Local TV News and the New Media Landscape: Part 2

9
More than three-quarters (78 percent) of TV news directors said they were doing something new and important online in 2016. Just under a quarter (22 percent) said they were doing nothing new.
As in the past, content remains king, with almost two-thirds of the responses relating to content. A significant number simply pointed to Facebook Live, but a range of online-oriented content strategies emerged including:
• Moving newscasts online: Several stations reported either making more newscasts available online or documenting events live online.
• Web-only content: Stations also reported a significant jump in content designed specifically for the web and for mobile platforms. They also reported developing enterprise and long-form storytelling for the web.
• Leveraging digital to improve storytelling: Stations pointed to experiments in user-generated content and graphics as ways they were taking advantage of digital platforms.
• Properties for younger audiences: Some stations also developed digital assets targeting younger audiences, such as website redesigns or sites devel-oped specifically for millennials.
After content, the second most common response involved a new strategy for digital offerings (21 percent). Examples included more clickable content, more selective content (rather than just posting everything), more sharing across stations, improved staffing, more audience engagement efforts and enhanced tracking of digital metrics.
STATIONS ARE GETTING MORE URGENT ABOUT PUTTING CONTENT ONLINE
INNOVATION & SOCIAL MEDIA IN LOCAL TV NEWS INNOVATION & SOCIAL MEDIA IN LOCAL TV NEWSLocal TV News and the New Media Landscape: Part 2 Local TV News and the New Media Landscape: Part 2
10
More than two-thirds of TV news directors (69 percent) said they were doing something new in mobile.
App development remains the top mobile strategy at 29 percent, but this is a decline of about 10 points from the year before. Leading the list: weather apps, including radar and special severe weather apps. Some stations have been adding apps, but several stations developed apps for the first time.
There were also several areas of growth in mobile strategies. Push alerts moved up 10 percentage points to 25 percent of responses. Push alerts and notifications were a major area of development and refinement in the past year, with terms like “enhanced” and “refined” used frequently. Stations are also developing special news categories of push alerts that are more specific to audience interests (e.g. school closings, weather, etc.). Another area of growth was streaming, at 18 percent of respondents. Many responses centered on live streaming and Facebook Live in particular.
All told, 16 percent of stations have also begun to focus on mobile strategy and technical redesign more broadly. Leading in this category came new, cleaner, easi-er-to-use mobile. Just behind that were mentions of a new mobile-first strategy, including a newsroom reorganization to emphasize mobile. Several stations also introduced new content management systems, in part driven by mobile needs.
Despite significant emphasis in “online” content, far fewer stations reported new developments in mobile content, which at 7 percent of respondents has fallen by half in three years.
KLTV, the Raycom station in Tyler, TX, has several successful mobile apps — one developed around high school football, one around local food and recipes and one for Spanish-language speakers. Terrell says he believes many stations have trouble understanding what works best in the app culture.
“Broadcasters are not used to niche; we’re used to hundreds of thousands of people consuming our content,” Terrell said. “For us, this was as much about relevancy with a younger audience as anything else. My argument was we have to be relevant with this younger age so they’ll at least know what KLTV is.”
MOBILE IS AN EMERGING EMPHASIS
INNOVATION & SOCIAL MEDIA IN LOCAL TV NEWS INNOVATION & SOCIAL MEDIA IN LOCAL TV NEWSLocal TV News and the New Media Landscape: Part 2 Local TV News and the New Media Landscape: Part 2

11
“We think of ourselves as a 24/7 digital company that puts on television shows,” notes Tegna’s Crooke. “We reach more people through our digital platforms than through TV. On air is where the revenue is, but we reach more people elsewhere.”
A significant majority of TV news directors (86 percent) said they did some-thing new in social media in 2016, an increase of almost 20 percentage points from 2015 (which came in at 67 percent). More than half of these (56 percent) included Facebook Live in their answer.
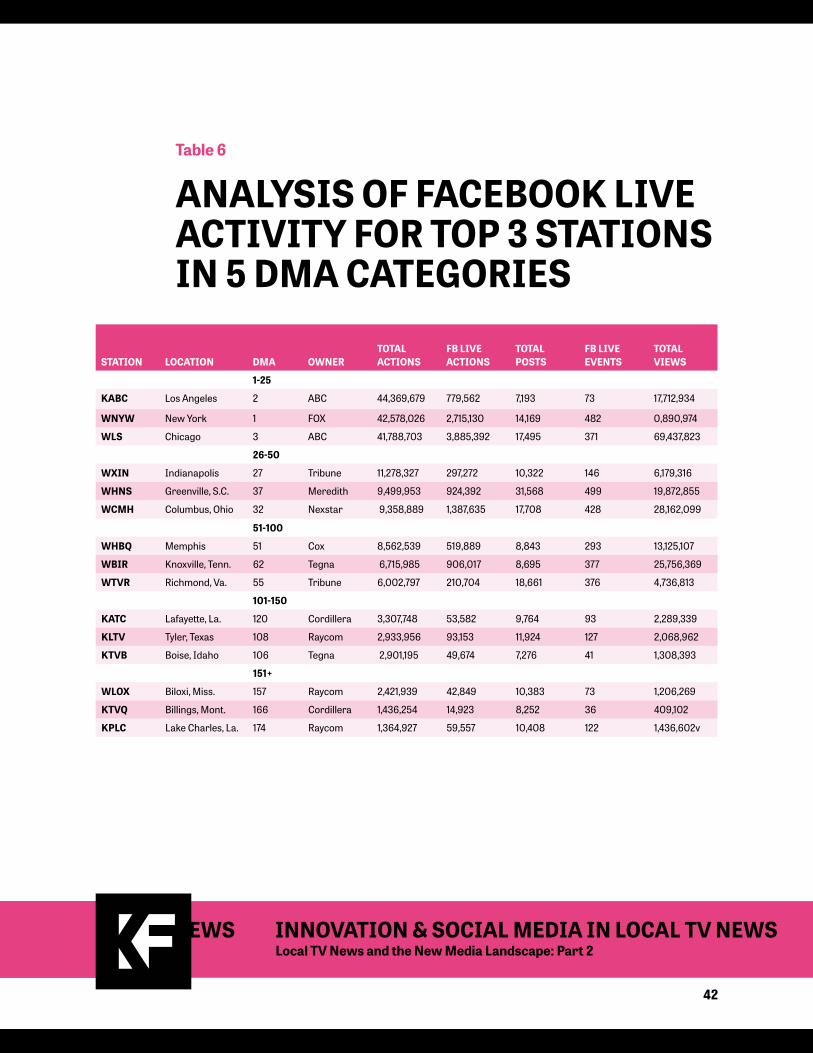
How did stations use Facebook Live? Breaking news led the way, including: bad weather, polls, sports specials, major events and behind-the-scenes broadcasts. One station said it made a point of using Facebook Live weekly. Another said it used Facebook Live daily before every newscast.
Jacque Harms at KNOP-TV in North Platte, NE says they’ve arranged their workflow around Facebook Live — which has been a little tricky because bonded cellular (for live, remote broadcasting) hasn’t worked as well as they had hoped because of the terrain. In market 209, with a mostly young staff, organization is everything when you’re producing 10 newscasts a day with 12 full time people.
WLS, the ABC affiliate in Chicago, used Facebook Live 371 times in 2016 and generated not only 9 percent of the total actions for the station for the year with those live posts but also garnered almost 70 million views for those live streams.
Jennifer Hoppenstedt is an executive producer for news and social media at WLS. She says the Facebook Live strategy there is still evolving.
“Six months ago, we’d go out in the community, find something going on and go live. Today we have more capability; we are taking news conferences live on Facebook as much as 12 hours a day. Yesterday, I took the Arizona wildfires coverage, and it did terrific,” Hoppenstedt said.
Weather, which is one of the most significant content areas for local TV news, is also one of the most common topics covered with Facebook Live.
FACEBOOK LIVE LEADS “WHAT’S NEW” IN SOCIAL MEDIA
INNOVATION & SOCIAL MEDIA IN LOCAL TV NEWS INNOVATION & SOCIAL MEDIA IN LOCAL TV NEWSLocal TV News and the New Media Landscape: Part 2 Local TV News and the New Media Landscape: Part 2

12
“For us it’s a two-pronged approach,” said Scott Wise, director of interactive media for Tribune-owned WTVR in Richmond, VA. “We use it to interact with the audience, and we use it to engage the viewer directly. For example, our mete-orologists do them frequently, and they will answer specific viewer questions directly. They’ll do a general forecast and answer viewer questions; this viewer engagement is why Facebook rolled Live out in the first place.”
“We also kind of use it as a way to dip into big news events, like an important news conference. It’s less personal, but it lets the people we serve know what’s happening in our government agencies or police departments.”
The ability to get a station’s content, people and its brand broad exposure with relatively minimal effort is one reason why many stations systematically use Face-book Live as promotional tool — streaming segments to tease a story or taking viewers behind the scenes of a newscast during commercial breaks. Though the stations included in this study appreciate the marketing opportunities provided by Facebook Live, News Director Janelle Shriner at Raycom’s KPLC in Lake Charles, LA, (DMA 174) says live streaming has become a critical way of reaching people.
“We try to have a very big digital presence, so we’re very deliberate in this as well. If the mayor is making an announcement or a congressman in town, we’ll stream it. We also stream some big national news like congress hearing Trump speaking. Any time a reporter is at breaking news, we stream. We know the phone is the first place people will see the story.”
Facebook was also cited as a key part of other social strategies, such as a place for more content, exclusive interviews, special web stories, polls, user-gener-ated content and digital-only video.
While Facebook dominated “new” approaches in social media, a small number of stations (16 percent) reported efforts to improve their social media approaches generally. This included such tactics as developing a specific social media strategy, staff training, better linking social media products to newscasts, improved posting practices and a social media checklist for reporters. These responses also included hiring people specifically to work on social media or oversee social media or restructuring job roles to improve social media.
Critical to the process is understanding how to use social media. “If one of our anchors runs into someone at Trader Joe’s, and they say how much they like the anchor, you wouldn’t respond by telling them a news story,” notes WBTV assis-tant news director Kim Saxon. “You’d interact with them as a person, and that’s the way you need to think of social media.”
Facebook was also cited as a key part of other social strategies, such as a place for more content, exclusive interviews, special web stories, polls, user-generated content and digital-only video.
INNOVATION & SOCIAL MEDIA IN LOCAL TV NEWS INNOVATION & SOCIAL MEDIA IN LOCAL TV NEWSLocal TV News and the New Media Landscape: Part 2 Local TV News and the New Media Landscape: Part 2

13
TV newsrooms were also asked if they were using social media beyond Facebook and Twitter, and three in four (76 percent) replied in the affirmative. Instagram led the way at 82 percent. The list of what stations are doing included: “behind-the-scenes, glimpse-into-our-lives” images, beauty shots, talent, photos of weather events, station events and other ways to engage audiences.
“Instagram gives us a way to reach audiences you don’ get on Facebook,” Brad Conaway, former corporate digital content manager at Raycom Media, which owns or provides services for 65 local TV stations. “The No. 1 key to success is interesting, beautiful pictures.”
Well behind Instagram, at 34 percent, came Snapchat. News directors noted they used Snapchat for sharing pictures and short videos and behind-the-scenes photos. Several stations said they were experimenting with Snapchat, although several said it wasn’t working for them. Other platforms — Pinterest, YouTube, etc. — came in at single digit percentages.
Beyond the domination of Facebook and Twitter, there were significant shifts from 2015 to 2016 in social media use. The first is the domination of Instagram and rise of Snapchat; every other platform declined. The second trend is one of consolidation. In 2015, TV news directors noted using 22 different software programs (beyond Facebook and Twitter). In 2016, the list fell to just 12.
OTHER SOCIAL MEDIA PLATFORMS ARE FINDING TRACTION
INNOVATION & SOCIAL MEDIA IN LOCAL TV NEWS INNOVATION & SOCIAL MEDIA IN LOCAL TV NEWSLocal TV News and the New Media Landscape: Part 2 Local TV News and the New Media Landscape: Part 2

14
With a few exceptions, the stations that generated the most social actions on Facebook in 2016 generated the most social actions overall. Facebook has clearly been the dominant compo-nent of most local TV newsrooms’ social media strategies. In the largest markets, Designated Market Areas (DMAs) 1-25, the three stations driving the most activity on Facebook each had more than 40 million reactions, shares and comments on their posts for the year 2016.
By some estimates, Facebook has driven more than 90 percent of total social engagement in local media.4 But by the end of 2017, Google was sending more traffic (44 percent) to news sites than Facebook (26 percent) in what was a dramatic reversal from 2016.5 And more upheaval appears to be coming. At the start of 2018, Facebook announced it was making a major change to the News Feed algorithm that would prioritize content from friends and family at the expense of content from publishers and brands. A few days later, the social platform modified its position to update the News Feed again, so it would also prioritize local news.
That’s one reason that industry leaders like Glen Hale, executive director of digital content at Raycom Media, says his company, like many others, is “frene-mies” with Facebook.
“It’s a love/hate relationship. Social offers us a whole pool of audience we wouldn’t otherwise reach, but the bad thing is that it’s so democratized that we are in a pool with fake news and people who are leeches who scrounge off the real newsgathering to squeeze out salacious headlines.’’
AMONG TOP STATIONS, FACEBOOK IS THE KEY DRIVER OF SOCIAL TRAFFIC
INNOVATION & SOCIAL MEDIA IN LOCAL TV NEWS INNOVATION & SOCIAL MEDIA IN LOCAL TV NEWSLocal TV News and the New Media Landscape: Part 2 Local TV News and the New Media Landscape: Part 2

15
Initial data analysis shows that, when measuring Facebook audi-ence engagement through reactions, shares and comments, the most successful local TV news stations are clearly found in the biggest DMA categories (see Figure 1 in the appendix). This is likely not surprising as, by definition, larger markets feature far bigger potential audiences.
Despite this edge, however, the relationship between the level of activity and engagement is not conclusive. In our sample of top stations across DMA cate-gories, the two stations that had the highest level of engagement posted less frequently than others in their respective categories. The station that posted the most often had the lowest engagement percentage of all the top stations in the sample.
In DMAs 1-25, KABC in Los Angeles (DMA 2) generated more than 44 million actions on its 7,193 Facebook posts for 2016. Much of that activity was likely facilitated by its more than 2 million fans. In addition, the station enjoys high engagement per post (which Shareablee defines as essentially the number of actions taken on each post, per fan).6 For KABC that percentage was .34 in 2016 compared to .23 for the overall Local TV category. WNYW in New York (DMA 1) had about half a million fewer fans (1,477,073) and generated more than 42.5 million actions, possibly because the station posted to Facebook more than 14,000 times in 2016, almost twice as much as KABC. The station’s engagement per post was at the category average of .23.
WLS in Chicago (DMA 3) had more than 1.7 million fans, generating more than 41.7 million actions with 17,500 posts. The station posted the most often among the Top 3 in DMAs 1-25, but underperformed the engagement per post for the Local TV category with .15 percent.
ACROSS DMAs THE VOLUME OF ACTIVITY DID NOT CORRELATE WITH AUDIENCE ENGAGEMENT
INNOVATION & SOCIAL MEDIA IN LOCAL TV NEWS INNOVATION & SOCIAL MEDIA IN LOCAL TV NEWSLocal TV News and the New Media Landscape: Part 2 Local TV News and the New Media Landscape: Part 2

16
In this case, having the most fans and the smallest number of posts led to the highest level of audience engagement. What’s unique about these three stations as compared to the rest of the stations in our sample is that they are huge players in very big markets. Together, they account for more than 8 percent of what Shareablee calls the “social voice” for the category of “Local TV,” which includes more than 800 stations. “Social voice” is not just determined by a prop-erty’s presence on Facebook, but also Twitter, Instagram, YouTube and other social platforms.
WLS News Director Jennifer Graves says Facebook has been an important part of the station’s overall news strategy for some time.
“Early on we recognized it was a platform people turned to for information, and we realized we needed content there to reach people,” Graves said. “We used Facebook to engage people with our brand and then drive them back to TV. It was another shelf for our product.”
The station, which is owned by ABC, reports as much as 84 percent of digital traffic to its website comes from Facebook referrals.
When you drop down into slightly smaller markets, DMAs 26-50, the top station in terms of Facebook actions is WXIN in Indianapolis (DMA 27). The station had more than 609,000 fans in 2016 and generated more than 11 million actions. WXIN’s engagement percentage was .20. WHNS in Greenville, SC, (DMA 37) had the lowest post engagement percentage (.08) and the largest volume of posts (31,568) for any station in our sample. Despite the frequency of posts, the station had almost 443,000 fans. WCMH in Columbus, OH, (DMA 32) had about as many actions as WHNS with about half as many posts for an engagement percentage of .20.
At WHNS, News Director Kelly Boan says her station posts several times an hour, so depending on the day and how much news there is, that means about 60-100 posts per day.
“We post most any local news on Facebook and a lot of national news,” Boan said. “My feeling with Facebook is, if people expect us to have it, we’re going to have it. The culture of Facebook, and our industry has contributed to this; we have created an environment on Facebook where people expect to get their news there, so we’re going to put it there.”
INNOVATION & SOCIAL MEDIA IN LOCAL TV NEWS INNOVATION & SOCIAL MEDIA IN LOCAL TV NEWSLocal TV News and the New Media Landscape: Part 2 Local TV News and the New Media Landscape: Part 2
17
Boan says the Meredith-owned WHNS is taking a “we have your back” mentality with Facebook — essentially feeding the station’s page with anything her news-room believes people will want to know.
In the still smaller DMAs 51-100, the station that achieved one of the highest totals for interactions with the fewest posts to Facebook also came out on top in audience engagement. Tegna-owned WBIR in Knoxville, TN, (DMA 62) achieved the category average of .23 for its engagement percentage.
Former WBIR news Director Martha Jennings thinks part of the station’s success is tied to her newsroom’s diligence in taking the Facebook audience seriously.
“Someone is assigned to monitor Facebook comments at all times of the day; we’re always listening, in the comment section, we’re replying. You can’t let something blow up on our Facebook page without a response,” Jennings said. “Originally, I never wanted to say we’re sorry because I felt like it meant we had done something wrong, but it’s a different beast. We had to change; we apolo-gize when the Facebook audience feels we’ve let them down.”
Of the Top 3 stations in DMAs 101-150, KTVB in Boise, ID, (DMA 106) had the fewest posts and the fewest fans, but outperformed the category with a .24 percent for audience engagement, and the same held true in the smallest DMAs 151+ where KTVQ in Billings, MT, (DMA 166) had the fewest fans and the fewest posts of the top three stations, but came closest to achieving the category average for engagement among the three stations in this sample with a .22 percent rating.
The two stations outperforming the category average for engagement — KABC (.34) and KTVB (.24) — appear to be posting with a purpose. Their knowledge of the Facebook audience seems to allow them to be more selective with posting content they know will resonate.
“For us, we are very loyal to our brand, and we know our audience, so things that work in other markets don’t necessarily engage or do well here, and I think our team really knows our audience,” said Tegna-owned KTVB’s general manager Kate Morris. “We study metrics and look at what does well on a regular basis, so we feel we are in tune with our hyperlocal audience; we don’t over-post throughout the day; we focus on quality content.”
Morris says they are talking about increasing the frequency of their posts, but they won’t “post just to post.”
INNOVATION & SOCIAL MEDIA IN LOCAL TV NEWS INNOVATION & SOCIAL MEDIA IN LOCAL TV NEWSLocal TV News and the New Media Landscape: Part 2 Local TV News and the New Media Landscape: Part 2

18
The formula for guaranteed success on Facebook remains elusive, though certain station groups seem to be closer to divining the perfect strategy than others.
Raycom executives have gone on the record saying that social media has changed everything about their stations’ connectivity with viewers, and they treat their Facebook pages like the news organizations’ “first screen.”7 Their digital managers report focusing on serious news as opposed to clickbait, with an emphasis on keeping posts local.8
Responsiveness to the audience is also a critical part of Raycom’s overall strategy, as is the station group’s efforts to encourage its digital managers to connect on a regular basis to share success stories and track the posts that generate the most audience reactions.9
Partly to improve its effectiveness in social media, Raycom created something called the RNN Digital Hub, a national news service which creates and distrib-utes national online and mobile content to the websites of Raycom’s 41 TV stations across the U.S. The Hub is based in Atlanta and operates 24 hours a day, seven days a week, 365 days a year.
By centralizing the production of national news, Cecilia Hanley, the Hub’s digital content manager, says the stations can focus on local, and the 24/7 support the Hub offers even the company’s smallest stations makes them tough to beat on big, breaking national stories.
“Our corporate Facebook policy is every post should be constructed, first and foremost, to elicit engagement; secondly to encourage a click-through to watch the video or read the story on our website where we sell ads. Engagement is the fuel to get you in front of large audiences.”
SIMPLY POSTING A LOT DOESN’T GUARANTEE AUDIENCE ENGAGEMENT
INNOVATION & SOCIAL MEDIA IN LOCAL TV NEWS INNOVATION & SOCIAL MEDIA IN LOCAL TV NEWSLocal TV News and the New Media Landscape: Part 2 Local TV News and the New Media Landscape: Part 2

19
A content analysis of more than 1,100 posts for the four stations which met or exceeded the engagement average for the local TV category revealed a basic component of social media success for news organizations. Human interest and entertainment content dominated these posts, but information related to emer-gencies and risks, politics and public policy, and civic institutions is also engaging audiences at the highest level. In addition, the content analysis found that, overall, content was more local than non-local. (See the appendix for supporting data.)
At WBIR, newscast producers are asked to “amplify” the station’s news-gathering by using Facebook and the station’s website to drive people to the newscast and vice versa.
“We have built a following of which we’re proud, without doing any sponsored posts or contests to increase likes; it’s all very organic. We try to understand that many people have come to us for a reason, they want a mix of news, things that will be shareable; that’s obviously how we grow our following,” Jennings said.
Though the amount of information related to emergencies and risks, politics and public policy, as well as civic institutions posted to Facebook is significant, the success of human interest stories when it comes to engaging audience is not surprising given that social media platforms were not originally created to serve as distribution channels for hard news. Raycom’s Conaway says even stories about pregnant giraffes and celebrity breakups have a legitimate purpose in the news ecosystem: “Bulk engagement from these posts helps grease the wheels for bigger engagement overall. When the story is important, the audience is already there.”
SOCIAL MEDIA CONTENT MAINTAINS LOCAL NEWS FOCUS, BUT “SOFT” TOPICS DOMINATE
INNOVATION & SOCIAL MEDIA IN LOCAL TV NEWS INNOVATION & SOCIAL MEDIA IN LOCAL TV NEWSLocal TV News and the New Media Landscape: Part 2 Local TV News and the New Media Landscape: Part 2

20
In addition to analyzing the type of content that appears on local TV news stations’ Facebook pages, we asked station managers whether they saw Facebook providing an opportunity to foster community discussion around important topics and what that engagement might look like. What we found were two forms of community building. At one level, stations are simply informing audiences about local issues, events and people, while at a higher level, there are examples of broadcast newsrooms truly engaging the public to understand areas of community need and interest.
At WLS in Chicago, Hoppenstedt sees Facebook as helping the station improve the quality of its journalism by connecting people in the community to each other. It often happens organically and somewhat randomly.
“This story came from our Facebook page: an 89-year-old popsicle vendor had a daughter who died, leaving him two grandsons to raise. The story took off and we started reporting it on all platforms; a GoFundMe raised about $400,000,” said Hoppenstedt. “Sometimes we feel like we change lives.”
In Boise, KTVB’s Morris says her station found that “gold is in the comments.” She points to a story about a proposed amendment to the Idaho constitution that many people seemed to find confusing. The station found a viewer on Face-book who had been asking thoughtful questions on the topic and took him out with a camera to help him find answers. The video produced was then posted to Facebook where the resulting viewer engagement helped inform the audience on this key issue.
FOSTERING HIGH-LEVEL COMMUNITY ENGAGEMENT PROVES CHALLENGING
INNOVATION & SOCIAL MEDIA IN LOCAL TV NEWS INNOVATION & SOCIAL MEDIA IN LOCAL TV NEWSLocal TV News and the New Media Landscape: Part 2 Local TV News and the New Media Landscape: Part 2

21
“Our Facebook post had such a smart, interesting conversation, but with a tradi-tional TV story we would have had very little of that interaction,” Morris said. “We learned a lot about making TV stories more engaging.”
However, becoming civic producers of content is not easy, and therefore not as common as some in the industry might like. For example, at KPLC in Lake Charles, the news director says the station simply doesn’t “keep up posts that are racially divisive” and in Knoxville, Jennings says continual monitoring of a Facebook page is critical.
“Political posts, anything LGBTQ, religion — those are difficult topics to post and not be ready to moderate. Sometimes memes are very bad; we have to be there and be ready to step in.”
Digital producers like Renee Johnson at WLOX in Biloxi aren’t always sure that the station’s Facebook page is promoting community discussion. “There are days when I read the comments, and it’s very disheartening. Are these the people who are my neighbors? Is this how people in the community feel about something? And there are other times when you get thoughtful comments and you realize the mix of both sides is a good thing. It becomes more of a debate, not one side pushing an agenda.”
INNOVATION & SOCIAL MEDIA IN LOCAL TV NEWS INNOVATION & SOCIAL MEDIA IN LOCAL TV NEWSLocal TV News and the New Media Landscape: Part 2 Local TV News and the New Media Landscape: Part 2

22
“As of August 2017, two-thirds (67 percent) of Americans report that they get at least some of their news on social media — with two-in-ten doing so often,” according to a new survey from Pew Research Center.”10 That same survey found that just under half (45 percent) of U.S. adults say they get news specifically on Facebook. That may be good for local TV stations, which tend to dominate their media markets when it comes to engaging audiences on the Facebook platform, but news organizations have long had a niggling fear that distributing too much of their content through a channel that’s difficult to monetize is not a smart business move.
Recently, at least one local news director went public with his concerns. Mike Snuffer, the news director for WSIL, the ABC affiliate owned by Wheeler Broad-casting in Carterville, IL (in the Paducah, KY, DMA, No. 83) told one industry website that TV stations are making a big monetary mistake. Snuffer said WSIL does post regularly on Facebook, but he thinks the station gives too much content away without getting any news viewership in return, and news viewer-ship generates the bulk of the revenue for local TV companies.11
One previously published study suggests Snuffer has less to worry about than he may think. In 2015, researchers for the market research and strategy company SmithGeiger analyzed social media and ratings data and found a “very strong relationship between social engagement and positive audience behav-iors for broadcasters. Social activity by local audiences appears to follow TV ratings in all markets in the morning, then by early afternoon social ratings start
SOCIAL SHARING OF CONTENT WON’T HARM, MIGHT HELP NEWSCAST RATINGS
INNOVATION & SOCIAL MEDIA IN LOCAL TV NEWS INNOVATION & SOCIAL MEDIA IN LOCAL TV NEWSLocal TV News and the New Media Landscape: Part 2 Local TV News and the New Media Landscape: Part 2

23
to precede the TV ratings, peaking in the evening.”12 In other words, content from morning newscasts seems to prompt social media engagement, and social media engagement throughout the day seems to prompt newscast viewing.
However, the SmithGeiger analysis was not widely reported or apparently replicated. That may be because addressing the question of how social media impacts local television consumption requires a reliable source of social media data analyzed in conjunction with a high-quality TV measurement system.
For this research project, we utilized Facebook data for nine of the stations in our list of top performers.
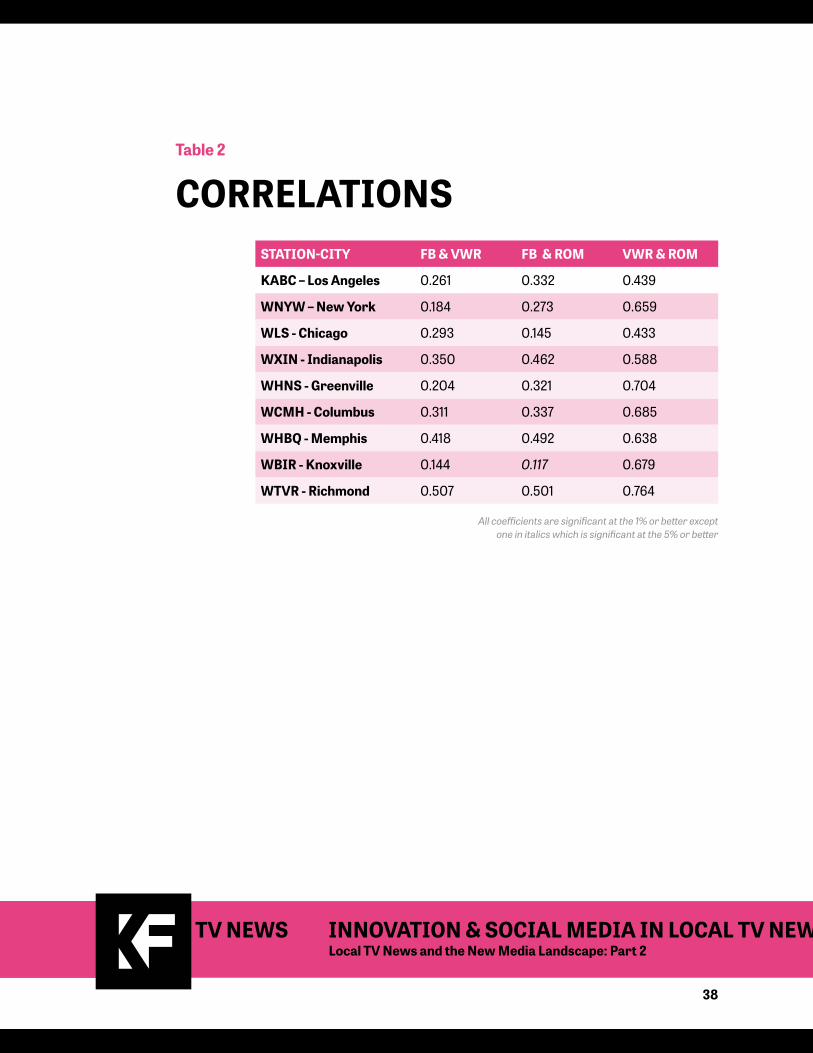
The results reveal a clear relationship between high levels of Facebook engage-ment, as defined by total actions, and higher newscast ratings. When we examine the relationship between viewership and Facebook actions, without controlling for anything else, we find a significantly positive relationship between the two (Table 2 in the appendix).
These findings support what WLS News Director Jennifer Graves and others have long suspected. “We’ve seen anecdotally that, when there is a post that talks about unique content at 10 p.m., we see a bump in newscast ratings. We just can’t prove it’s a cause and effect,” Graves said.
And the authors found that cause and effect difficult to prove as well. To more directly examine the relationship between Facebook actions and viewership, we statistically analyzed the association between changes in daily Facebook actions to changes in daily viewership. For six of the nine stations, when Face-book actions increase compared to the previous day, viewership for the station also goes up. For five stations, this relationship is significant and for one, Los Angeles, it is only marginally significant. For three stations namely, New York, Chicago and Knoxville, the relationship is not significant.
Essentially, there is something more at play here than simply increasing social media engagement to prompt newscast viewing. WHNS News Director Kelly Boan knows that intuitively.
“There are days when you see both increases in social media engagement and higher ratings. The day of the Manchester bombing, for example, on a day like that, you’ll see big newscast and social numbers,” Boan said. “But some days that relationship just baffles me because I’ll expect to see a newscast bump, and we don’t.”
The results reveal a clear relationship between high levels of Facebook engagement, as defined by total actions, and higher newscast ratings.
INNOVATION & SOCIAL MEDIA IN LOCAL TV NEWS INNOVATION & SOCIAL MEDIA IN LOCAL TV NEWSLocal TV News and the New Media Landscape: Part 2 Local TV News and the New Media Landscape: Part 2

24
When we factor in changes in newscast viewership for all of the stations in each of the nine markets observed, the relationship between social engagement and viewership becomes insignificant in all but one market, Memphis. However, the relationship between increased viewership for our high-performing stations and the rest of the market is always positively significant.
One interpretation of this result is that major news events are driving not only increases in social media engagement, but also newscast ratings increases across the board. In other words, it may be the news of the day that dictates whether both social and newscast metrics will increase.
Ultimately, the data leads us to assert with confidence that posting content to Facebook is not cannibalizing the newscast audience for local TV stations. However, success in terms of Facebook engagement does not guarantee more ratings success in comparison to a station’s competitors.
INNOVATION & SOCIAL MEDIA IN LOCAL TV NEWS INNOVATION & SOCIAL MEDIA IN LOCAL TV NEWSLocal TV News and the New Media Landscape: Part 2 Local TV News and the New Media Landscape: Part 2
25
CONCLUSION CONCLUSION CONCLUSION CONCLUSION
Most innovation in local TV news shows up on the online and social media side of the operation and not on air. While local TV news is clearly winning the social media war, news directors and executives remain concerned because of the difficulty of monetizing social efforts. Still, social media analysis seems to indicate that these strategies can pay off in terms of reach and, if used well, increase audience engagement.
In interviews with newsroom managers and company news executives, we heard consistent themes:
1. A large social audience helps “grease the wheels” for bigger engagement on important issues, though it may be built, in large part, on the content the audience finds entertaining.
2. On days when social engagement is higher, newscast ratings are also higher. This finding suggests that news organizations are not “giving away” the content that could attract larger newscast audiences.
3. It’s clear that social is driving a vast percentage of the traffic stations receive on their websites, but there’s a “love/hate” relationship with Facebook, even among those who use the social networking site exceptionally well.
4. Stations are using social media to find and deliver news, and using Facebook Live, in particular, as a way to add more and different coverage to their reper-toire than they have previously.
26
ENDNOTES1. The 2017 RTDNA/Hofstra University Survey
was conducted in the fourth quarter of 2016 among all 1,684 operating, non-satellite televi-sion stations. Valid responses came from 1,409 television stations (84 percent). Some data sets (e.g. the number of TV stations originating local news, getting it from others and women TV news directors) are based on a complete census and are not projected from a smaller sample. Different numbers of news directors responded to different questions. Four questions in the existing survey on the state of local TV news in 2017 were used to identify potential innovation:
• Is the station doing anything specific to reach younger (18- to 34-year-old) viewers? If yes, what?
• What’s the most important new thing that you started doing online in 2016?
• What’s the most important new thing that you started doing with mobile in 2016?
• What’s the most important new thing that you started doing with social media in 2016?
Responses to these questions — which ranged in depth — were coded and analyzed. Where possible, comparisons with previous survey responses were analyzed.
2. To supplement selective self-reporting, two forms of follow-up took place. First, emails were sent to all local TV news directors — regardless of whether they participated in the RTDNA/Hofstra University Survey — asking for them to nominate the most innovative practices they had seen at their station or another. Second, we scheduled interviews with many responding stations.
3. Circa was originally created as a “born on mobile” news app with no legacy medium affiliated with the content. Sinclair Broadcast purchased the app in 2015 and re-launched it in 2016.
4. Facebook Delivers 9X More Engagement in Local TV (2015, August 27). Retrieved April 17, 2017, from http://sharerocket.com/facebook-deliv-ers-9x-more-engagement-in-local-tv/
5. https://www.recode.net/2017/12/11/16748026/google-facebook-publisher-traffic-2017-increase Retrieved January 27, 2018.
6. Shareablee defines “engagement” as “a percent of the fan count, the average number of actions (likes, shares, comments) taken on each post published by the property, during the time period.”
7. Greeley, P. (2016, November 07). Tucson’s KOLD Leads Local Social Media. Retrieved April 17, 2017, from http://www.netnewscheck.com/article/55635/tucsons-kold-leads-local-social-media?ref=search
8. Greeley, P. (2016, September 26). Hawaii News Now Dominates Islands’ Social Media. Retrieved April 17, 2017, from http://www.netnewscheck.com/article/54433/hawaii-news-now-domi-nates-islands-social-media?ref=search
9. Greeley, P. (2016, August 08). Facebook Propels WLBT To Social Leadership. Retrieved April 17, 2017, from http://www.netnewscheck.com/article/53031/facebook-propels-wlbt-to-so-cial-leadership?ref=search
10. Retrieved from http://www.journalism.org/2017/09/07/news-use-across-social-media-platforms-2017/ on September 16, 2017.
11. Retrieved from http://www.tvnewscheck.com/marketshare/2017/09/08/news-director-sug-gests-1-day-facebook-boycott/ on September 16, 2017.
12. Retrieved from http://sharerocket.com/wp-content/uploads/2015/05/LocalSocialMedia-StudyTVRatings.pdf on September 16, 2017.
INNOVATION & SOCIAL MEDIA IN LOCAL TV NEWS INNOVATION & SOCIAL MEDIA IN LOCAL TV NEWSLocal TV News and the New Media Landscape: Part 2 Local TV News and the New Media Landscape: Part 2

27
ABOUT THE RESEARCHERSDEBORA WENGER, Ph.D., is assistant dean and associate professor at the University of Mississippi’s Meek School of Journalism and New Media. She has worked in broadcast news in Fargo, North Dakota, Ft. Myers, Florida, Manchester, New Hampshire, Charlotte, North Carolina, and Tampa, Florida. Wenger’s work has been recognized with dozens of national, regional and local awards including a Cronkite Award for Excellence in Political Journalism and a Scripps Headliner Award. She is a Society of Professional Journalists/Google News Lab trainer and is co-author of the widely-adopted broadcast journalism textbook, “Advancing the Story: Journalism in a Multimedia World,” as well as “Managing Today’s News Media: Audience First.” Wenger moved into teaching full time in 2002, and in 2017, she was named as a top broadcast journalism educator by Crain’s NewsPro magazine.
BOB PAPPER is Emeritus Distinguished Professor of Journalism at Hofstra University. For 24 years, he has overseen the RTDNA/Hofstra University Annual Survey on the state of local radio and television news. His “Broadcast News and Writing Stylebook” is in its sixth edition, and he’s the founder and co-ed-itor of Electronic News, the official journal of the Electronic News Division of the Association for Education in Journalism and Mass Communication. He’s worked at television stations in Minneapolis, Washington, D.C., San Fran-cisco, and Columbus, Ohio, and is a past president of the Maine Association of Broadcasters. He has won more than 100 state, regional and national awards, including more than a dozen regional Edward R. Murrow Awards and an Alfred I. duPont-Columbia University Award for “Excellence in Broadcast Journalism.” In 2012, he received the Ed Bliss Award, the highest honor from the Elec-tronic News Division of the Association for Education in Journalism and Mass Communication.
INNOVATION & SOCIAL MEDIA IN LOCAL TV NEWS INNOVATION & SOCIAL MEDIA IN LOCAL TV NEWSLocal TV News and the New Media Landscape: Part 2 Local TV News and the New Media Landscape: Part 2
28
RACHNA PRAKASH, Ph.D.,CPA, is an assistant professor at the University of Mississippi’s Patterson School of Accountancy. Her expertise in data science has led to her research being published in The Accounting Review, Contemporary Accounting Research, and Journal of Accounting and Public Policy. Her recent research on carbon emissions has been widely cited in the business press and referred to by investment banks. In addition to being a regular speaker at major accounting conferences, she has a track record of invited presentations of her research at the Securities and Exchange Commission and the Public Company Accounting Oversight Board. In 2010, she was nominated for the “Ernst & Young Inclusive Excellence Award” for teaching. She also has extensive international corporate experience having worked for KPMG in Delhi, Citibank in Mumbai, and Salomon Smith Barney in New York.
DEBORAH CARO GOLDMAN is a post-graduate researcher who has worked as a writer-producer at WTTG in Washington, D.C., and as a news producer at WSOC-TV in Charlotte, North Carolina, and at WTEN in Albany, New York. She was an anchor, reporter and producer at WAGM in Presque Isle, Maine. A 1990 graduate of Syracuse University, she has degrees in policy studies and broad-cast journalism and graduated summa cum laude and Phi Beta Kappa. She has a master’s degree from the Medill School of Journalism, finishing her program in Washington, D.C., as a correspondent for WDAY in Fargo, North Dakota.
INNOVATION & SOCIAL MEDIA IN LOCAL TV NEWS INNOVATION & SOCIAL MEDIA IN LOCAL TV NEWSLocal TV News and the New Media Landscape: Part 2 Local TV News and the New Media Landscape: Part 2

29
The local TV news landscape includes 705 local newsrooms producing at least one newscast per day on 1,062 stations. All local stations that produce news have at least one Facebook page, along with a presence on several other social platforms.
To access data on a broad cross section of TV news stations, including use, content and audience engagement, this report draws on the social analytics company Shareablee. The company was founded in February 2014 and includes CBS, NBC, ESPN, Fox News, CNN, as well as hundreds of additional media brands and publishers, including local TV stations, among its clients worldwide.
Based on Shareablee data for 765 local TV stations’ social media that the company tracks, the study organized the stations according to Nielsen’s Desig-nated Market Areas (DMAs) for the 2016-2017 television season. Market sizes are determined by population, and this study adopts five tiers (1-25, 26-50, 51-100, 101-150 and 150-plus) to remain consistent with the RTNDA/Hofstra Survey. Stations in each DMA category were analyzed five ways, based on data collected from Jan. 1, 2016 through Dec. 31, 2016: Total Actions, Facebook Total Actions, Twitter Total Actions, Instagram Total Actions and YouTube Total Actions.1 Due to the centrality of Facebook in local TV news social media use, Facebook Total Actions results were used to determine the top three performers in each of the DMA categories.
DATA COLLECTION AND ANALYSIS
APPENDIX
INNOVATION & SOCIAL MEDIA IN LOCAL TV NEWS INNOVATION & SOCIAL MEDIA IN LOCAL TV NEWSLocal TV News and the New Media Landscape: Part 2 Local TV News and the New Media Landscape: Part 2

30
In addition to the data collection and analysis, a significant question to address included the type of content resonating with audiences on Facebook. Content was therefore coded according to 14 factors, which included the eight Crit-ical Information Needs (CIN) of local communities, developed for the Federal Communications Commission.2 They are:
• CIN1: emergencies and risks.
• CIN2: health and welfare.
• CIN3: education.
• CIN4: transportation.
• CIN5: economic opportunities.
• CIN6: the environment.
• CIN7: civic information.
• CIN8: political information.
To these eight categories, several others were added: sports, weather, crime, entertainment and human interest. Human interest was the broadest content category, including the trivial content often associated with social media as well as representations of people and their problems, challenges or achievements that cause others to sympathize or empathize or just learn something about other people and communities. Content was also analyzed for total actions taken and whether it concerned local versus non-local information.
This first phase of the content analysis involved analyzing the top 3 percent of posts (n=1121) for stations meeting or outperforming the engagement per post average for the category of Local TV (.23).3
Each post was assigned a primary category but was coded for secondary content areas as well. For example, a story could be marked as CIN1 (Emergency/Risk) and also be coded as “Weather.”
INNOVATION & SOCIAL MEDIA IN LOCAL TV NEWS INNOVATION & SOCIAL MEDIA IN LOCAL TV NEWSLocal TV News and the New Media Landscape: Part 2 Local TV News and the New Media Landscape: Part 2

31
Across all four stations, analysis of the most engaging posts revealed that content of human interest (35 percent) dominated (See Figure 3). Entertain-ment-related content (12 percent) and emergencies and risks (CIN1 – 12 percent) ran second and third. Content about our civic institutions (CIN7 – 9 percent) and politics and public policy (CIN8 – 9 percent), including news about candi-dates, was also prevalent. Sports (7 percent), crime (6 percent) and weather (4 percent) were also regularly included, but stories about education (CIN3 – 2 percent), health and welfare (CIN2 – 2 percent), transportation (CIN4 – <1 percent), economic opportunities (CIN5 – <1 percent) and the environment (CIN6 – <1 percent) were relatively rare.
Many of the high-engagement posts produced by the four stations were non-local (Local n=599, Non-local n=522). However, for the stations we analyzed, the two smaller markets focused much more on the communities they cover. WBIR Knoxville posted the most local content (81 percent), followed by KTVB Boise (72 percent), KABC Los Angeles (42 percent) and WNYW New York (34 percent).
ANALYSIS OF FACEBOOK POSTS BY CONTENT
100%450
90%400
80%35070%30060%
25050%
20040%
15030%
100 20%
50 10%
0 0%
Posts by Primary Category
HUM ENT CIN1 CIN7 CIN8 SPO CR WEA CIN3 CIN2 CIN4 CIN5 CIN6
INNOVATION & SOCIAL MEDIA IN LOCAL TV NEWS INNOVATION & SOCIAL MEDIA IN LOCAL TV NEWSLocal TV News and the New Media Landscape: Part 2 Local TV News and the New Media Landscape: Part 2

32
METHODOLOGY Our Facebook data is for one station each in nine different markets for the calendar year 2016, obtained from Shareablee. The nine stations come from a list of Facebook top performers as determined by total audience actions on Facebook content. The markets included in our sample range from the Knox-ville, Tennessee, market (62) to the three biggest markets in the country: New York, Los Angeles and Chicago. All nine of the stations selected are in metered markets, which means viewership in these markets is estimated via technolog-ical means. (Diary markets are those in which selected audience members are required to record their own viewing and that data is generally considered less reliable. Nielsen is expected to phase out the diary system in 2018.)4
The markets included in our analyses are:
SOCIAL ENGAGEMENT/ NIELSEN RATINGS ANALYSIS
STATION-CITY MARKET SIZE
KABC – Los Angeles 2
WNYW – New York 1
WLS - Chicago 3
WXIN - Indianapolis 27
WHNS - Greenville 37
WCMH - Columbus 32
WHBQ - Memphis 51
WBIR - Knoxville 62
WTVR - Richmond 55
INNOVATION & SOCIAL MEDIA IN LOCAL TV NEWS INNOVATION & SOCIAL MEDIA IN LOCAL TV NEWSLocal TV News and the New Media Landscape: Part 2 Local TV News and the New Media Landscape: Part 2

33
We add all the Facebook actions per day in our sample to get total Facebook (FB) related activity on a particular day for each station in our sample. Since 2016 was a leap year we have 366 observations for each station, one per day.
We obtained ratings data for all the stations in different markets from Nielsen for the calendar year 2016. We focused on three dayparts — the morning, early evening and late news time periods. Although we have ratings for multiple age categories in the ratings data, we retain the ratings for only the age group “P25-54” that is, for the group “People 25-54”. We retain this specific group only because it is routinely targeted by advertisers.5 We multiply the daily ratings with Sum Of Weights (SOW) to get the daily viewership for every station in the market. We add the daily viewership data for our station and combine the daily viewership data for all other stations in the market to get aggregate daily view-ership data for our station as well as for the rest of the market (ROW). We then combined the daily FB actions data with the respective viewership data for each of the nine stations listed above.
To examine the relationship between FB actions and viewership, we estimate the following model for each of the nine stations separately. We estimate the model on a daily basis (levels model) and also examine the changes in each variable from the previous day (changes model).
VWR=α +β1FB+ β2ROM+ε
Where:
VWR: is the total daily viewership (Total Daily Ratings/100*SOW) for the stations in our sample,
FB: is the total daily Facebook actions for each station,
ROM: is the total daily viewership for the rest of the market i.e., all the other stations in the sample station’s market.
INNOVATION & SOCIAL MEDIA IN LOCAL TV NEWS INNOVATION & SOCIAL MEDIA IN LOCAL TV NEWSLocal TV News and the New Media Landscape: Part 2 Local TV News and the New Media Landscape: Part 2

34
DESCRIPTIVESAs mentioned earlier, the nine stations we examine are all from different sized markets. The largest market size in our sample is New York with over one million viewers daily on average (Table 1). The next market segment is Los Angeles and Chicago with over half a million viewers daily on average. The smallest market in our sample is Knoxville with a little over 80,000 viewers daily. Although New York is the largest market in terms of number of viewers, the daily FB actions are highest in Los Angeles with about 121,228 average daily FB actions and a median of 103,956. Facebook actions in New York and Chicago are comparable, with New York being slightly higher. In general, for all the stations, the mean FB actions are higher than the median actions, indicating that there are days when there is a lot of FB activity. We winsorize all the variables at the 1 percent on both tails to correct for the skewness in the data. Our results using unwinsorized data are very similar to the results using winsorized data (not tabulated).
The Spearman Rank correlation between FB actions (FB) and viewership for our station (VWR) is generally small, 0.35 or lower. The exception being Rich-mond with the highest correlation of 0.507, followed by Memphis at 0.418. The correlation between FB and viewership for other stations in the market (ROM) is higher, generally ranging between 0.3 and 0.5. The lowest correla-tion between FB and ROM is for Knoxville at 0.117 (significant at the 5 percent or better). The correlations between viewership for our station (VWR) and the other stations in its market (ROM) generally ranging between 0.55 and 0.70 (Table 2). All the correlations are significant at the 1 percent or more expect where explicitly noted differently.
INNOVATION & SOCIAL MEDIA IN LOCAL TV NEWS INNOVATION & SOCIAL MEDIA IN LOCAL TV NEWSLocal TV News and the New Media Landscape: Part 2 Local TV News and the New Media Landscape: Part 2

35
RESULTSWe estimate two different models to examine the relationship between FB actions and viewership for our sample stations. The first model examines the association between daily viewership of the station and daily FB actions. The second model we run examines the changes in viewership as a function of changes in FB actions. The changes are calculated over the previous day.
First, we test the association between daily FB actions (FB) and daily viewership (VWR). When we examine the relationship between viewership and FB actions, without controlling for anything else, we find a significantly positive relationship between the two (Table 2). For the nine sample stations, when daily FB actions are high, viewership for the station is high. The coefficient on FB ranges from 0.067 to 1.38. This coefficient is significant at 1 percent or better in six of the nine stations and at 5 percent or better for one station. For three stations, New York, Chicago, and Greenville, the relationship, though positive, is only marginally significant.
Next, we add viewership of other stations in the market (ROM) to the model (Table 2). Adding viewership of other stations to the model controls for events in the market or other nation-wide events that may have resulted in an increase in viewership for all the stations in the market. To the extent that FB activity is related to such events, adding ROM to the model reduces the likelihood of finding a relationship between FB and VWR. After adding ROM to the model, the coefficient on FB is not significant for any of the stations except Memphis, where it is positive but only marginally significant, at the 10 percent (one-tailed).
INNOVATION & SOCIAL MEDIA IN LOCAL TV NEWS INNOVATION & SOCIAL MEDIA IN LOCAL TV NEWSLocal TV News and the New Media Landscape: Part 2 Local TV News and the New Media Landscape: Part 2

36
To more directly examine the relationship between FB actions and viewership, we regress changes in daily viewership on changes in daily FB actions. For six of the nine stations, when FB actions increase compared to the previous day, viewership for the also station goes up. For five stations, this relationship is significant at the 5 percent or better and for one, LA, it is only marginally signifi-cant (10 percent, one-tailed). For three stations namely, New York, Chicago, and Knoxville, the relationship is not significantly different from zero.
On adding the changes in viewership for the rest of the market (ROM), the relationship documented above becomes insignificant in all but one market, Memphis. However, consistent with the notion that there may be events that are driving both FB actions and viewership, the coefficient on changes in ROM is significant for all the markets at the 1 percent or better.
It is important to note the changes in r-squared for all the stations between a model with only FB actions and one that also includes ROM as independent variable. In general, FB actions explain very little variation in daily viewership or changes in daily viewership but adding ROM to the model increases the explan-atory power of the model significantly. In sum, both the levels and changes regressions suggest that although the relationship between FB actions of the station and its viewership is positive on average, both of them are likely driven by local or national news events.
INNOVATION & SOCIAL MEDIA IN LOCAL TV NEWS INNOVATION & SOCIAL MEDIA IN LOCAL TV NEWSLocal TV News and the New Media Landscape: Part 2 Local TV News and the New Media Landscape: Part 2

37
Table 1
DESCRIPTIVE STATISTICSSTATION-CITY TOTAL
STATIONSFB ACTIONS (FB)
STATION VIEWERSHIP (VWR)
REST OF THE MARKER (ROM)
Mean Median Mean Median Mean Median
KABC – Los Angeles 4 121,228.60 103,956.50 245,538.20 244,583.20 507,727.60 522,140.90
WNYW – New York 4 116,291.30 93,854.50 192,936.90 197,650.70 1,123,108.00 1,180,602.00
WLS - Chicago 4 114,184.20 88,761.50 300,562.00 293,845.00 542,848.10 571,873.10
WXIN - Indianapolis 5 30,815.12 26,327.50 92,918.52 97,158.61 265,567.80 290,694.90
WHNS - Greenville 4 25,956.96 19,902.50 30,020.88 30,043.66 259,953.00 291,448.50
WCMH - Columbus 4 25,570.81 17,941.00 70,211.05 69,596.45 205,596.40 214,744.10
WHBQ - Memphis 4 23,394.92 20,577.00 111,096.30 128,242.10 184,108.50 189,461.10
WBIR - Knoxville 4 18,349.69 10,661.50 76,701.66 80,395.86 80,512.99 84,882.34
WTVR - Richmond 4 16,400.60 13,517.00 56,928.71 58,340.85 154,443.90 163,138.30
INNOVATION & SOCIAL MEDIA IN LOCAL TV NEWS INNOVATION & SOCIAL MEDIA IN LOCAL TV NEWSLocal TV News and the New Media Landscape: Part 2 Local TV News and the New Media Landscape: Part 2
38
Table 2
CORRELATIONSSTATION-CITY FB & VWR FB & ROM VWR & ROM
KABC – Los Angeles 0.261 0.332 0.439
WNYW – New York 0.184 0.273 0.659
WLS - Chicago 0.293 0.145 0.433
WXIN - Indianapolis 0.350 0.462 0.588
WHNS - Greenville 0.204 0.321 0.704
WCMH - Columbus 0.311 0.337 0.685
WHBQ - Memphis 0.418 0.492 0.638
WBIR - Knoxville 0.144 0.117 0.679
WTVR - Richmond 0.507 0.501 0.764
All coefficients are significant at the 1% or better except one in italics which is significant at the 5% or better
INNOVATION & SOCIAL MEDIA IN LOCAL TV NEWS INNOVATION & SOCIAL MEDIA IN LOCAL TV NEWSLocal TV News and the New Media Landscape: Part 2 Local TV News and the New Media Landscape: Part 2

39
Table 3
LEVELS REGRESSIONSVWR FB ROM N R-SQUARED
LA 0.24 (3.18) — — 366 0.037
0.076 (1.23) 0.25 9.42 — 0.25
NYC 0.099 (1.4) — — 362 0.007
-0.039 (-0.83) 0.196 15.98 — 0.478
Chicago 0.067 (1.58) — — 366 0.007
0.002 (0.07) 0.128 4.59 — 0.086
Indianapolis 0.74 (6.22) — — 366 0.078
0.086 (0.87) 0.243 14.89 — 0.434
Greenville 0.069 (1.48) — — 364 0.008
-0.041 (-1.28) 0.11 22.31 — 0.526
Columbus 0.126 2.41 — — 366 0.013
0.018 0.53 0.251 17.01 — 0.475
Memphis 1.38 4.45 — — 366 0.091
0.297 1.63 0.723 20.38 — 0.498
Knoxville 0.219 2.39 — — 335 0.021
0.061 0.69 0.691 19.05 — 0.557
Richmond 0.825 3.05 — — 366 0.086
0.119 0.99 0.385 25.18 — 0.638
VWR: (Rtg/100)*SOWFB: Total FB actions
ROM: rest of the market audienceAll variables are measured concurrently on a daily basis
All variables are winsorized at the 1% on both endsWe report robust standard errors.
All the significance levels are two-tailedGrey: NS
Grey and Italics: 10% or better (one-tailed)Italics: 10% or better
Bold and Italics: 5% or betterBold: 1% or better (mostly 1% or better)
INNOVATION & SOCIAL MEDIA IN LOCAL TV NEWS INNOVATION & SOCIAL MEDIA IN LOCAL TV NEWSLocal TV News and the New Media Landscape: Part 2 Local TV News and the New Media Landscape: Part 2

40
Table 4
CHANGES REGRESSIONSVWR FB ROM N R-SQUARED
LA 0.099 (1.39) — — 365 0.007
0.002 (0.03) 0.299 (10.47) — 0.25
NYC 0.07 (1.14) — — 357 0.005
0.022 (0.53) 0.168 (15.62) — 0.419
Chicago 0.04 (0.53) — — 365 0.001
-0.012 (-0.18) 0.104 (3.15) — 0.037
Indianapolis 0.600 (4.89) — — 365 0.063
0.097 (1.15) 0.23 (14.02) — 0.434
Greenville 0.084 (2.35) — — 361 0.013
0.029 (1.00) 0.096 (18.45) — 0.433
Columbus 0.115 (2.00) — — 365 0.017
0.013 (0.38) 0.205 (11.13) — 0.324
Memphis 0.874 (3.99) — — 365 0.044
0.434 (2.19) 0.636 (14.35) — 0.392
Knoxville 0.092 (0.73) — — 333 0.002
-0.074 (-0.66) 0.616 (15.87) — 0.443
Richmond 0.61 (2.59) — — 365 0.039
0.067 (0.61) 0.385 (21.13) — 0.565
All the variables are measured as changes from the previous day.VWR: (Rtg/100)*SOW
FB: Total FB actionsROM: rest of the market audience
We report robust standard-errors.All variables are winsorized at the 1% on both ends
All the significance levels are two-tailedGrey: NS
Grey and Italics: 10% or better (one-tailed)Italics: 10% or better
Bold and Italics: 5% or betterBold: 1% or better (mostly 1% or better)
INNOVATION & SOCIAL MEDIA IN LOCAL TV NEWS INNOVATION & SOCIAL MEDIA IN LOCAL TV NEWSLocal TV News and the New Media Landscape: Part 2 Local TV News and the New Media Landscape: Part 2

41
STATION LOCATION DMA OWNER FANS FB ACTIONS POSTSENGAGE-MENT %
1-25
KABC Los Angeles 2 ABC 2,068,499 44,369,679 7,193 0.34
WNYW New York 1 FOX 1,477,973 42,578,026 14,169 0.23
WLS Chicago 3 ABC 1,768,514 41,788,703 17,495 0.15
26-50
WXIN Indianapolis 27 Tribune 558,959 11,278,327 10,322 0.20
WHNS Greenville, S.C. 37 Meredith 442,991 9,499,953 31,568 0.08
WCMH Columbus, Ohio 32 Nexstar 334,374 9,358,889 17,708 0.20
51-100
WHBQ Memphis 51 Cox 558,959 8,562,539 8,843 0.19
WBIR Knoxville, Tenn. 62 Tegna 352,572 6,715,985 8,695 0.23
WTVR Richmond, Va. 55 Tribune 315,411 6,002,797 18,661 0.11
101-150
KATC Lafayette, La. 120 Cordillera 301,563 3,307,748 9,764 0.12
KLTV Tyler, Texas 108 Raycom 253,853 2,933,956 11,924 0.11
KTVB Boise, Idaho 106 Tegna 182,586 2,901,195 7,276 0.24
151+
WLOX Biloxi, Miss. 157 Raycom 184,113 2,421,939 10,383 0.13
KTVQ Billings, Mont. 166 Cordillera 88,595 1,436,254 8,252 0.22
KPLC Lake Charles, La. 174 Raycom 142,893 1,364,927 10,408 0.10
INNOVATION & SOCIAL MEDIA IN LOCAL TV NEWS INNOVATION & SOCIAL MEDIA IN LOCAL TV NEWSLocal TV News and the New Media Landscape: Part 2 Local TV News and the New Media Landscape: Part 2
Table 5
ANALYSIS OF FACEBOOK ACTIVITY FOR TOP 3 STATIONS IN 5 DMA CATEGORIES
42
STATION LOCATION DMA OWNERTOTAL ACTIONS
FB LIVE ACTIONS
TOTAL POSTS
FB LIVE EVENTS
TOTAL VIEWS
1-25
KABC Los Angeles 2 ABC 44,369,679 779,562 7,193 73 17,712,934
WNYW New York 1 FOX 42,578,026 2,715,130 14,169 482 0,890,974
WLS Chicago 3 ABC 41,788,703 3,885,392 17,495 371 69,437,823
26-50
WXIN Indianapolis 27 Tribune 11,278,327 297,272 10,322 146 6,179,316
WHNS Greenville, S.C. 37 Meredith 9,499,953 924,392 31,568 499 19,872,855
WCMH Columbus, Ohio 32 Nexstar 9,358,889 1,387,635 17,708 428 28,162,099
51-100
WHBQ Memphis 51 Cox 8,562,539 519,889 8,843 293 13,125,107
WBIR Knoxville, Tenn. 62 Tegna 6,715,985 906,017 8,695 377 25,756,369
WTVR Richmond, Va. 55 Tribune 6,002,797 210,704 18,661 376 4,736,813
101-150
KATC Lafayette, La. 120 Cordillera 3,307,748 53,582 9,764 93 2,289,339
KLTV Tyler, Texas 108 Raycom 2,933,956 93,153 11,924 127 2,068,962
KTVB Boise, Idaho 106 Tegna 2,901,195 49,674 7,276 41 1,308,393
151+
WLOX Biloxi, Miss. 157 Raycom 2,421,939 42,849 10,383 73 1,206,269
KTVQ Billings, Mont. 166 Cordillera 1,436,254 14,923 8,252 36 409,102
KPLC Lake Charles, La. 174 Raycom 1,364,927 59,557 10,408 122 1,436,602v
INNOVATION & SOCIAL MEDIA IN LOCAL TV NEWS INNOVATION & SOCIAL MEDIA IN LOCAL TV NEWSLocal TV News and the New Media Landscape: Part 2 Local TV News and the New Media Landscape: Part 2
Table 6
ANALYSIS OF FACEBOOK LIVE ACTIVITY FOR TOP 3 STATIONS IN 5 DMA CATEGORIES

43
ENDNOTES1. Total actions across platforms are defined as the
volume of post-level likes, shares, retweets and comments that a specified property receives during a defined period.
2. Friedland, L., Napoli, P., Ognyanova, K., Weil, C., & Wilson III, E. J. (2012). Review of the litera-ture regarding critical information needs of the American public. Report prepared for the Federal Communications Commission, http://transition. fcc. gov/bureaus/ocbo/Final_Litera-ture_Review. pdf [accessed 19 May 2013].
3. Engagement per post is defined as a percent of the fan count — that is, the average number of actions (likes, shares and comments) on each post published by the property during a specified time period. The average Facebook engagement per post for all the stations Shareablee includes in its local TV category is .23.
4. http://www.adweek.com/tv-video/nielsen-will-fi-nally-stop-using-paper-tv-diaries-2018-173501/
5. http://www.nielsen.com/us/en/insights/news/2011/under-25-and-over-54-the-power-of-demographic-outliers.html
INNOVATION & SOCIAL MEDIA IN LOCAL TV NEWS INNOVATION & SOCIAL MEDIA IN LOCAL TV NEWSLocal TV News and the New Media Landscape: Part 2 Local TV News and the New Media Landscape: Part 2
INNOVATION & SOCIAL MEDIA IN LOCAL TV NEWSLocal TV News and the New Media Landscape: Part 2