Optical digital fragmentation measuring systems – inherent sources ...

Oceanography and Marine Biology: An Annual Review, 2007, 45, 1-38 © R. N. Gibson, R. J. A. Atkinson, and J. D. M. Gordon, Editors
Taylor & Francis
INHERENT OPTICAL PROPERTIES OF NON-SPHERICAL MARINE-LIKE PARTICLES — FROM THEORY
TO OBSERVATION
WILHELMINA R. CLAVANO1, EMMANUEL BOSS2 & LEE KARP-BOSS2
1School of Civil and Environmental Engineering, Cornell University, 453 Hollister Hall, Ithaca, New York 14853, U.S.
E-mail: [email protected] of Marine Sciences, University of Maine,
5706 Aubert Hall, Orono, Maine 04469, U.S.E-mail: [email protected], [email protected]
Abstract In situ measurements of inherent optical properties (IOPs) of aquatic particles showgreat promise in studies of particle dynamics. Successful application of such methods requires anunderstanding of the optical properties of particles. Most models of IOPs of marine particles assumethat particles are spheres, yet most of the particles that contribute significantly to the IOPs are non-spherical. Only a few studies have examined optical properties of non-spherical aquatic particles.The state-of-the-art knowledge regarding IOPs of non-spherical particles is reviewed here and exactand approximate solutions are applied to model IOPs of marine-like particles. A comparison ofmodel results for monodispersions of randomly oriented spheroids to results obtained for equal-volume spheres shows a strong dependence of the biases in the IOPs on particle size and shape,with the greater deviation occurring for particles much larger than the wavelength. Similarly, biasesin the IOPs of polydispersions of spheroids are greater, and can be higher than a factor of two,when populations of particles are enriched with large particles. These results suggest that shapeplays a significant role in determining the IOPs of marine particles, encouraging further laboratoryand modelling studies on the effects of particle shape on their optical properties.
Introduction
Recent advances in optical sensor technology have opened new opportunities to study biogeochem-ical processes in aquatic environments at spatial and temporal scales that were not possible before.Optical sensors are capable of sampling at frequencies that match the sub-metre and sub-secondsampling scales of physical variables such as temperature and salinity and can be used in a varietyof ocean-observing platforms including moorings, drifter buoys, and autonomous vehicles. In situmeasurements of inherent optical properties (IOPs) such as absorption, scattering, attenuation andfluorescence reveal information on the presence, concentration and composition of particulate anddissolved material in the ocean. Variables such as organic carbon, chlorophyll-a, dissolved organicmaterial, nitrate and total suspended matter, among others, are now estimated routinely from IOPs(e.g., Twardowski et al. 2005). Retrieval of seawater constituents from in situ (bulk) IOP measure-ments is not a straightforward problem — aquatic systems are complex mixtures of particulate anddissolved material, of which each component has specific absorption, scattering and fluorescencecharacteristics. In situ IOP measurements provide a measure of the sum of the different propertiesof all individual components present in the water column. Interpretation of optical data and its
1

WILHELMINA R. CLAVANO, EMMANUEL BOSS & LEE KARP-BOSS
successful application to studies of biogeochemical processes thus requires an understanding ofthe relationships between the different biogeochemical constituents, their optical characteristicsand their contribution to bulk optical properties.
Suspended organic and inorganic particles play an important role in mediating biogeochemicalprocesses and significantly affect IOPs of aquatic environments, as can be attested from images takenfrom air- and space-borne platforms of the colour of lakes and oceans where phytoplankton bloomsand suspended sediment have a strong impact (e.g., Pozdnyakov & Grassl 2003). Interactions ofsuspended particles with light largely depend on the physical characteristics of the particles, suchas size, shape, composition and internal structure (e.g., presence of vacuoles). Optical characteristicsof marine particles have been studied since the early 1940s (summarised by Jerlov 1968) and, withan increased pace, since the 1970s (e.g., Morel 1973, Jerlov 1976). In the past decade, developmentof commercial in situ optical sensors and the launch of several successful ocean-colour missionshave accelerated the efforts to understand optical characteristics of marine particles, in particular thebackscattering coefficient because of its direct application to remote sensing (e.g., Boss et al. 2004).These efforts, which have focused on both the theory and measurement of IOPs of particles, aresummarised in books, book chapters and review articles on this topic (Shifrin 1988, Stramski &Kiefer 1991, Kirk 1994, Mobley 1994, Stramski et al. 2004, Jonasz & Fournier 2007, and others).
Although considerable effort has been given to the subject of marine particles and their IOPs,there is still a gap between theory and the reality of measurement. Such a gap is attributed to bothinstrumental limitations (e.g., Jerlov 1976, Roesler & Boss 2007) and simplifying assumptions usedin theoretical and empirical models (e.g., Stramski et al. 2001). The majority of theoretical investi-gations on the IOPs of marine particles assume that particles are homogeneous spheres. Opticalproperties of homogeneous spheres are well characterised (see Mie theory in, e.g., Kerker 1969,van de Hulst 1981) and there is good agreement between theory and measurement for such particles.Mie theory has been used to model IOPs of aquatic particles (e.g., Stramski et al. 2001) and inretrieving optical properties of oceanic particles (e.g., Bricaud & Morel 1986, Boss et al. 2001,Twardowski et al. 2001) with varying degrees of success. For example, while phytoplankton andbacteria dominate total scattering in the open ocean, based on Mie theory calculations for homo-geneous spheres, they account for only a small fraction (<20%) of the measured backscattering(referred to as the ‘missing backscattering enigma’, Stramski et al. 2004). Uncertainties in thebackscattering efficiencies of phytoplankton cells due to shape effects, however, are not wellconstrained and may account for a portion of this ‘missing’ backscattering.
A sphere is not likely to be a good representative of the shape of the ‘average’ aquatic particlefor two main reasons: (1) the majority of marine particles are not spherical, and (2) of all the convexshapes a sphere is rather an extreme shape: for a given particle volume it has the smallest surface-area-to-volume ratio. Only a limited number of studies have examined the IOPs of non-sphericalmarine particles and results indicate a strong dependence of optical properties, in particular scat-tering, on shape (Aas 1984, Voss & Fry 1984, Jonasz 1987b, Volten et al. 1998, Gordon & Du2001, Herring 2002, MacCallum et al. 2004, Quirantes & Bernard 2004, 2006, Gordon 2006).Unfortunately, with the exception of two, non-peer-reviewed publications (Aas 1984, Herring 2002)and a short book chapter (Jonasz 1991), there is no published methodical evaluation of shape effectson IOPs in the context of marine particles.
The goal of this review is to provide a systematic evaluation of the effects of particle shape onthe IOPs of marine particles, bringing together knowledge gained in ocean optics and other relevantfields. While it is recognised that marine particles (in particular, living cells) are not necessarilyhomogeneous, the focus in this article, for the sake of simplicity and due to limitations in availableanalytical and numerical solutions, is on the significance of the deviation from sphericity byhomogeneous particles. A survey of theoretical and experimental studies on the IOPs of
2

INHERENT OPTICAL PROPERTIES OF NON-SPHERICAL MARINE-LIKE PARTICLES
non-spherical homogeneous particles addressing the wide range of particle sizes and indices ofrefraction relevant to aquatic systems is presented here. Exact analytical solutions are available fora limited number of shapes and physical characteristics (e.g., cylinders and concentric sphereslarger than the wavelength and with an index of refraction similar to the medium, Aas 1984), butadvances in computational power have enabled the growth of numerical and approximate techniquesthat permit calculations for a wider range of particle shapes and sizes (Mishchenko et al. 2000 andreferences therein). It is not realistic to develop a model for all possible shapes of marine particlesbut in order to cover the range of observed shapes, from elongated to squat geometries, a simpleand smooth family of shapes — spheroids — is used here to model particles. Spheroids are ellipsoidswith two equal equatorial axes and a third axis being the axis of rotation. The ratio of the axis ofrotation, s, to an equatorial axis, t, is the aspect ratio, s/t, of a spheroid (Figure 1). The family ofspheroids include oblate spheroids (s/t < 1; disc-like bodies), prolate spheroids (s/t > 1; cigar-shapedbodies), and spheres (s/t = 1). Spheroids provide a good approximation to the shape of phytoplanktonand other planktonic organisms that often dominate the IOP signal. Furthermore, by choosingspheroids of varying aspect ratios as a model, solutions for elongated and squat shapes can easilybe compared with solutions for spheres and the biases associated with optical models that are basedon spheres can be quantified. This review focuses on marine particles because the vast majority ofstudies on IOPs of aquatic particles have been done in the marine context. However, the resultspresented here apply to particles in any other aquatic environment.
Bulk inherent optical properties (IOPs)
Definitions
Inherent optical properties (IOPs) refer to the optical properties of the aquatic medium and itsdissolved and particulate constituents that are independent of ambient illumination. To set the stagefor an IOP model of non-spherical particles, a brief description of the parameters that define theIOPs of particles is given here. For a more extensive elaboration on IOPs, the reader is referred toJerlov (1976), van de Hulst (1981), Bohren & Huffman (1983) and Mobley (1994). Most of thenotation used in this review follows closely that used by the ocean optics community (e.g., Mobley
Figure 1 Illustration of spheroids of different aspect ratios, s/t; oblate spheroids (s/t < 1) and prolate spheroids(s/t > 1). A sphere is a spheroid with an aspect ratio of one.
s
t
= 0.5st = 1s
t= 2s
t= 4s
t
st = 0.25
3

WILHELMINA R. CLAVANO, EMMANUEL BOSS & LEE KARP-BOSS
1994). A summary of the notation along with their definitions and units of measure is provided inthe Appendix (see p. 37).
Light interacting with a suspension of particles can either be transmitted (remain unaffected)or attenuated due to absorption (transformed into other forms of energy, e.g., chemical energy inthe case of photosynthesis) and due to scattering (redirected). Neglecting fluorescence, the twofundamental IOPs are the absorption coefficient, a(λ), and the volume scattering function (VSF),β(θ,λ), where λ is the incident wavelength and θ is the scattering angle. All other IOPs discussedhere can be derived from these two IOPs. Other IOPs not discussed in the current review includethe polarisation characteristics of scattering and fluorescence. While all quantities are wavelengthdependent, the notation is henceforth ignored for compactness.
The absorption coefficient, a, describes the rate of loss of light propagating as a plane wavedue to absorption. According to the Beer-Lambert-Bouguer law (e.g., Kerker 1969, Shifrin 1988),the loss of light in a purely absorbing medium follows (Equation 11.1 in Bohren & Huffman 1983):
(1)
where E(R) is the incident irradiance at a distance R from the light source with irradiance E(0)[W m–2 nm–1]. The light source and detector are assumed to be small compared with the path lengthand the light is plane parallel and well collimated. The absorption coefficient, a, is thus computedfrom
(2)
This equation reveals that the loss of light due to absorption is a function of the path length andthat the decay along that path is exponential. In a scattering and absorbing medium, such as naturalwaters, the measurement of absorption requires the collection of all the scattered light (e.g., usinga reflecting sphere or tube).
The volume scattering function (VSF), β(Ψ), describes the angular distribution of light scatteredby a suspension of particles toward the direction Ψ [rad]. It is defined as the radiant intensity, dI(Ω)[W sr–1 nm–1] (Ω [sr] being the solid angle), emanating at an angle Ψ from an infinitesimal volumeelement dV [m3] for a given incident irradiant intensity, E(0):
(3)
It is often assumed that scattering is azimuthally symmetric so that , where θ [rad] isthe angle between the initial direction of light propagation and that to which the light is scatteredirrespective of azimuth. The assumption of azimuthal symmetry is valid for spherical particles orrandomly oriented non-spherical particles. This assumption is most likely valid for the turbulentaquatic environment of interest here; it is assumed throughout this review and is further addressedin the following discussion.
A measure of the overall magnitude of the scattered light, without regard to its angulardistribution, is given by the scattering coefficient, b, which is the integral of the VSF over all(4π[sr]) angles:
E R E e aR( ) ( ) [ ]= ,− − −0 2 1W m nm
aR
E R
E= −
.−1
01ln
( )( )
[ ]m
β( )( )
( )[ ]Ψ Ω= .− −1
01 1
E
I
V
dd
m sr
β β θ( ) ( )Ψ =
4

INHERENT OPTICAL PROPERTIES OF NON-SPHERICAL MARINE-LIKE PARTICLES
(4)
where ϕ [rad] is the azimuth angle. Scattering is often described by the phase function, , whichis the VSF normalised to the total scattering. It provides information on the shape of the VSFregardless of the intensity of the scattered light:
(5)
Other parameters that define the scattered light include the backscattering coefficient, bb, whichis defined as the total light scattered in the hemisphere from which light has originated (i.e., scatteredin the backward direction):
(6)
and the backscattering ratio, which is defined as
(7)
Finally, the attenuation coefficient, c, describes the total rate of loss of a collimated, mono-chromatic light beam due to absorption and scattering:
(8)
which is the coefficient of attenuation in the Beer-Lambert-Bouguer law (see Equation 1) in anabsorbing and/or scattering medium (Bohren & Huffman 1983):
(9)
When describing the interaction of light with individual particles it is convenient to express aquantity with dimensions of area known as the optical cross section. An optical cross section isthe product of the geometric cross section of a particle and the ratio of the energy attenuated,absorbed, scattered or backscattered by that particle to the incident energy projected on an areathat is equal to its cross-sectional area (denoted by Cc, Ca, Cb and , respectively). For a non-spherical particle, the cross-sectional area perpendicular to the light beam, G [m2], depends on itsorientation. In the case when particles are randomly oriented, as assumed here, it has been foundthat for convex particles (such as spheroids) the average cross-sectional area perpendicular to thebeam of light (here denoted as ) is one-fourth of the surface area of the particle (Cauchy 1832).
In analogy to the IOPs (Equation 8), the attenuation cross section is equal to the sum of theabsorption and scattering cross sections:
(10)
b ≡ = , =∫ ∫ ∫ ∫β β θ ϕ θ θ ϕ π β θπ π π π
( ) ( )sin (Ψ Ωd d d0
4
0
2
0 02 ))sin [ ]θ θd m− ,1
β θ( )
β θ β θ( ) ≡ .−( )[ ]
bsr 1
bb ≡ = ,∫ ∫ −β π β θ θ θπ π
π( ) ( )sin [ ]Ψ Ωd d m
0
212
2
bbbb≡ .[ ]dimensionless
c a b= + ,−[ ]m 1
E R E e cR( ) ( ) [ ]= .− − −0 2 1W m nm
Cbb
⟨ ⟩G
C C Cc a b= + .[ ]m 2
5

WILHELMINA R. CLAVANO, EMMANUEL BOSS & LEE KARP-BOSS
Many theoretical texts on optics focus on optical efficiency factors, in their treatmentof light interaction with particles (e.g., van de Hulst 1981). Optical efficiency factors are the ratiosof the optical cross sections to the particle cross-sectional area; their appeal is in that efficiencyfactors of compact particles are bounded (i.e., their values rarely exceed three) and their values forparticles much larger than the wavelength are constant and independent of composition (see below).For non-spherical particles efficiency factors for attenuation, absorption, scattering and backscat-tering, respectively, are defined as (e.g., Mishchenko et al. 2002):
(11)
Other useful optical parameters are the volume-normalised cross sections defined as:
(12)
where is the particle volume; they provide insight into what size particle most effectivelyaffects light per unit volume (or per unit mass, see Bohren & Huffman 1983, and Figure 6 in Bosset al. 2001).
To relate IOPs to optical cross sections, efficiency factors and volume-normalised cross sections,information on particle concentration (and size distribution, see below) is required. For example,for N identical particles within a unit volume, the relations are given by:
(13)
Characteristics of particles affecting their optical properties
Three physical characteristics of homogeneous particles determine their optical properties: thecomplex index of refraction relative to the medium in which the particle is immersed, the size ofthe particle with respect to the wavelength of the incident light and the shape of the particle. Fornon-spherical particles, specifying the orientation of the particle in relation to the light beam is anadditional requirement. To continue to set the stage for an optical model for non-spherical particles,the physical characteristics of marine particles are discussed in this section and the values that areused to parameterise them in the current study are provided.
Index of refraction
The complex index of refraction comprises real, n, and imaginary, k, parts:
(14)
The real part is proportional to the ratio of the speed of light within a reference medium to thatwithin the particle. It is convenient to choose the reference medium to be that in which the particleis immersed, in which case the proportionality constant is one. The imaginary part of the index ofrefraction (referred to as the absorption index, e.g., Kirk 1994) represents the absorption of light
Qc a b bb, , , ,
QC
Gc a b bc a b b
b
b, , ,
, , ,≡⟨ ⟩
.[ ]dimensionless
αc a b bc a b b
b
bC
V, , ,, , , −≡ ,[ ]m 1
V [ ]m −3
c a b b NC N G Q NVb c a b b c a b b c a bb b, , , = = ⟨ ⟩ =, , , , , , , , ,α bbb
[ ]m− .1
m n ik= + .[ ]dimensionless
6

INHERENT OPTICAL PROPERTIES OF NON-SPHERICAL MARINE-LIKE PARTICLES
as it propagates through the particle. It is proportional to the absorption by the intra-particle material,α*[nm–1]:
(15)
These definitions are independent of particle shape.For purposes of biogeochemical and optical studies it is often convenient to group aquatic
particles into organic and inorganic pools. Organic particles comprise living (viruses, bacteria,phytoplankton and zooplankton) and non-living material (faecal pellets, detritus; although theseare likely to harbour bacteria). Inorganic particles consist of lithogenous minerals (quartz, clay andother minerals) and minerals associated with biogenic activity (calcite, aragonite and siliceousparticles). Particles in each of these two main groups share similar characteristics with respect totheir indices of refraction. Living organic particles often have a large water content (Aas 1996),making them less refractive than inorganic particles. The real part of the index of refraction ofaquatic particles ranges from 1.02 to 1.2; the lower range is associated with organic particles whilethe upper range is associated with highly refractive inorganic materials (Jerlov 1968, Morel 1973,Carder et al. 1974, Aas 1996, Twardowski et al. 2001). The imaginary part of the index of refractionspans from nearly zero to 0.01, with the latter associated with strongly absorbing bands due topigments (e.g., Morel & Bricaud 1981, Bricaud & Morel 1986). This review aims to primarilyillustrate the effects of shape as it applies to two ‘representative’ particle types: phytoplankton withm = 1.05 + i0.01 and inorganic particles with m = 1.17 + i0.0001 (Stramski et al. 2001). Varyingthe real and imaginary parts of the index of refraction among the values of the two illustrativeparticles chosen here showed similar dependence on changes in index of refraction to those observedin spheres (van de Hulst 1981, Herring 2002) and was not found to provide additional insight intothe effects of shape on IOPs.
Size
Size is a fundamental property of particles that determines sedimentation rates, mass transfer toand from the particle (e.g., nutrient fluxes and dissolution), encounter rates between particles and,most relevant to this review, their optical properties. Foremost, the ratio of particle size to wavelengthdetermines the resonance characteristics of the VSF (its oscillatory pattern as a function of scatteringangle) and the size for which maximum scattering per volume will occur (i.e., maximum αb). Inaddition, in general, the larger an absorbing particle is, the less efficient it becomes in absorbinglight per unit volume (i.e., the volume-normalised absorption efficiency, αa, decreases with increas-ing size), often referred to as the package effect or self-shading (see Duysens 1956).
In both marine and freshwater environments particles relevant to optics span at least eightorders of magnitude in size, ranging from sub-micron particles (colloids and viruses) to centimetre-size aggregates and zooplankton (Figure 2). Numerically, small particles are much more abundantthan larger particles. A partitioning of particles into logarithmic size bins shows that each binincludes approximately the same volume of particulate material (Sheldon et al. 1972). This obser-vation is consistent with a Junge-like (power-law) particulate size distribution (PSD), where thedifferential particle number concentration is inversely proportional to the fourth power of size(Junge 1963, Morel 1973; see p. 22).
Several other distribution functions have been used to represent size distributions of particlesin the ocean, which include the log-normal distribution (Jonasz 1983, Shifrin 1988, Jonasz &Fournier 1996), the Weibull distribution (Carder et al. 1971), the gamma distribution (Shifrin 1988)
k = .∗α λπ4
[ ]dimensionless
7

WILHELMINA R. CLAVANO, EMMANUEL BOSS & LEE KARP-BOSS
and sums of log-normal distributions (Risoviç 1993). Here, the focus is on particles ranging indiameter from 0.2 to 200 µm (diameter here is given by that of an equal-volume sphere). The lowerbound is associated with a common operational cutoff between dissolved and particulate material —often set by a filter with that pore size — and the upper bound chosen arbitrarily to represent theupper bound of particles that can still be assumed to be distributed as a continuum in operationalmeasurements (Siegel 1998). Two particulate size distributions are adopted (as in Twardowski et al.2001) for the illustrative optical model used in this study: the power-law distribution and thatdescribed by Risoviç (1993).
Shape
Several measures have been used to characterise the shape of particles in nature; some focus onthe overall shape while others concentrate on specific features such as roundness and compactness.An elementary measure of particle shape is the aspect ratio, which is the ratio of the principal axesof a particle. It describes the elongation or flatness of a particle and hence the deviation from aspherical shape (a sphere having an aspect ratio of one). Shape effects on optical properties areexamined here by modelling the IOPs of spheroids of varying aspect ratios.
Aquatic particles vary greatly in their shape; most notable is the striking diversity in cell shapesamong phytoplankton. Hillebrand et al. (1999) provides a comprehensive survey of geometricmodels for phytoplankton species from 10 taxa. Two relevant results arise from their analysis:(1) the sphere is not a common shape among microphytoplankton taxa and (2) despite the apparenthigh diversity of cell geometries, the diverse morphologies represent variations on a smaller subsetof geometric forms, primarily ellipsoids, spheroids and cylinders. Picoplankton, which are notincluded in the analysis of Hillebrand et al. (1999), tend to be more spherical in shape, althoughrod-like morphologies are also common.
Figure 2 Representative sizes of different constituents in sea-water, after Stramski et al (2004). Optical regionsreferred to in the text are denoted at the top axis (shading represents approximate boundaries between theseregions). These boundaries vary with refractive index for a given particle size.
Bubbles
Organic detritus, minerogenic particles
Zooplankton
Phytoplankton: Pico- Nano- Micro-
Bacteria
Viruses
Colloids
Truly soluble substances
Suspended particulate matter
Dissolved organic matter
0.1 nm 1 nm 10 nm 0.1 µm 1 µm 10 µm 100 µm 1 mm 1 cm
10−10 10−9 10−8 10−7 10−6 10−5 10−4 10−3 10−2
Particle size (m)
Wat
er m
ole
cule
sRayleigh Rayleigh−Gans−Debye Van de Hulst Geometric Optics
8

INHERENT OPTICAL PROPERTIES OF NON-SPHERICAL MARINE-LIKE PARTICLES
The authors are not aware of any published paper that provides the range of values of aspectratios of phytoplankton cells in natural assemblages. To demonstrate the deviation from a sphericalshape among phytoplankton, field data on cell dimensions of different taxonomic groups (nano-and microphytoplankton) were used to calculate aspect ratios of phytoplankton (Figure 3; dataavailable from the California State Department of Water Resources). Aspect ratios of phytoplanktonspan a wide range, varying between 0.4 and 72 (Figure 3). Diatom chains, which are not includedin the analysis, can have even higher aspect ratios. The frequency distribution of the aspect ratiosshows that elongated shapes are a more common form compared with spheres or squat shapes(Figure 3).
Inorganic aquatic particles are very often non-spherical; clay mineral particles have plate-likecrystalline structures with sizes on the order of D = 0.5 µm and have aspect ratios varying between0.05 and 0.3 (Jonasz 1987b, Bickmore et al. 2002). In nature, clays tend to aggregate and formlarger particles with reduced aspect ratios. It is not possible to generalise their shapes except tosay that they are extremely variable and do not look like spheres. Larger sedimentary particles suchas sand and silt have aspect ratios ranging between 0.04 and 11 (derived from Komar & Reimers1978, Baba & Komar 1981). Consistent with these observations, spheroids with aspect ratiosbetween 0.1 and 46 are used in the analysis of IOPs of non-spherical particles presented here (98%of the cells that constitute the data in Figure 3 are within this range). Finer-scale structures thatmay be found in each particle do not dominate scattering, in general, as much as the effect of the
Figure 3 Frequency distribution of aspect ratios of phytoplankton. Data are provided by the California StateDepartment of Water Resources and the U.S. Bureau of Reclamation and are available on the Bay-Delta andTributaries (BDAT) project website at http://baydelta.water.ca.gov/. A subset of the data was randomly selectedfor the analysis here and includes data collected during the period 2002–2003 from a variety of aquatic habitats:from freshwater in the Sacramento-San Joaquin Delta to estuarine environments in the Suisun and San PabloBays (California, USA). The data include phytoplankton from five different classes, including Bacillario-phyceae (diatoms), Chlorophyceae, Cryptophyceae, Dynophyceae, and Cyanophyceae (N = 8059 cells). Phy-toplankton analyses (identification, counts, and measurements of cell dimensions) were conducted at the BryteChemical Laboratory (California Department of Water Resources). Further information on the methods usedcan be found at http://iep.water.ca.gov/emp/Metadata/Phytoplankton/. The aspect ratio is calculated as theratio between the rotational and equatorial axes of a cell based on the three-dimensional shape associated witheach species as provided in Hillebrand et al. (1999). The reader is cautioned on the fact that the phytoplanktondata do not include picophytoplankton (i.e., cells smaller than 2 µm) that tend to be more spherical in shape.
0.5 1 2 5 10 20 500
500
1000
1500
2000
2500
3000
Aspect ratio
Nu
mb
er o
f ce
lls
per
siz
e b
in (
N)
N = 8059
9

WILHELMINA R. CLAVANO, EMMANUEL BOSS & LEE KARP-BOSS
‘gross’ shape of the particle (Gordon 2006). Furthermore, Gordon (2006) found that, in theory, thetotal scattering of any curved shape (that is not rotationally symmetric) will behave similarly fora given particle thickness and cross-sectional area. However, when a particle exhibits sharp edges,smooth shapes are not able to reproduce the sharp spikes observed in the forward scattering(Macke & Mishchenko 1996).
To allow comparisons between spheroids and spheres, particle size is used as a reference. Thedefinition of size is often ambiguous when dealing with non-spherical particles; here the size of aspheroid is defined as the diameter of an equal-volume sphere This was chosen fortwo main reasons: (1) popular particle sizers such as the Coulter counter are sensitive to particlevolume and (2) mass, which is most often the property of interest in studies of particles, isproportional to particle volume. Size and shape, however, may not be independent attributes foraquatic particles. There appears to be a tendency for particles in ocean samples to deviate from aspherical shape as particle size increases (Jonasz 1987b). This trend has been observed for particlesin both coastal (Baltic Sea) and offshore areas (Kadyshevich 1977, Jonasz 1987a). Shape effectson IOPs are examined here for two types of particulate populations: monodispersions (comprisingparticles with one size and one shape) and polydispersions (comprising particles with varying sizesand shapes) and are quantified by defining a bias, , which is the ratio of the IOPs (attenuation,absorption, scattering and backscattering, respectively) of spheroids to that of spheres with thesame particle volume distribution.
Orientation
In this review particles are assumed to be randomly oriented. IOPs of non-spherical particles,however, are strongly dependent on particle orientation (e.g., Latimer et al. 1978, Asano 1979) butdata on the orientation of particles found in the natural marine environment are practically non-existent. There are certain cases for which the assumption of random orientation may not applybecause of methodological issues or because environmental conditions cause particles to align ina preferred orientation. Non-random orientation associated with methodology will be encounteredwhen: (1) the instrument used to measure an IOP causes particles to orient themselves relative tothe probing light beam (e.g., the flow cytometer in which particles are aligned one at a time withinthe flow chamber) and (2) when the existence of particles of a given sub-population (e.g., big diatomchains) is rare enough in the sample volume such that not all orientations are realised in a givenmeasurement. In the latter case, averaging over many samples is necessary to randomise orientations.
In the natural environment, shear flows can result in the alignment of particles with respect tothe flow (e.g., Karp-Boss & Jumars 1998). When the environment is quiescent enough, largeaggregates are oriented by the force of gravity as can be seen in photographs of in situ long stringersand teardrop-shape flocs (e.g., Syvitski et al. 1995).
The following optical characteristics can be used to assess whether or not an ensemble ofparticles is randomly oriented (Mishchenko et al. 2002): (1) the attenuation, scattering and absorp-tion coefficients are independent of polarisation and instrument orientation; (2) the polarisedscattering matrix is block diagonal; and (3) the emitted blackbody radiation is unpolarised. Notethat care should be applied so that the measurement procedures have minimal effect on theorientation of the particles investigated.
Given that the orientation of aquatic particles is currently unconstrained we proceed in thisreview by assuming random orientation. Future studies, however, may find orientation effects tobe important under certain conditions as was found in atmospheric studies due, for example, toorientation of particles under gravity (e.g., Aydin 2000).
( ).D st= 2 23
γ c a b bb, , ,
10

INHERENT OPTICAL PROPERTIES OF NON-SPHERICAL MARINE-LIKE PARTICLES
Optical regimes
A century and a half of theoretical studies on the interaction of light and particles has taught usthat this interaction is strongly dependent on several parameters. First among them is the sizeparameter, x, which is defined as the ratio of the particle size to the wavelength:
(16)
where D is the particle size and λ is the wavelength of light within the medium (both with thesame units), in this case water.
An additional important parameter is the ratio of the speed of light within the particle to thatin the medium (it is the reciprocal of the real part of the index of refraction of the particle to thatof water, n). Marine particles are mostly considered to be ‘soft’; their index of refraction is closeto that of water, that is, .
Finally, another important parameter is the phase shift parameter, ρ, which describes the shiftin phase between the wave travelling within the particle and the wave travelling in the mediumsurrounding it and is a function of both the size parameter and the index of refraction of that particle:
(17)
These parameters are useful to delineate optical regimes for which analytical approximationsthat apply to soft particles have been developed (see below). The material in this section borrowsheavily from Bohren & Huffman (1983), Mishchenko et al. (2002) and Kokhanovsky (2003), wheremore details can be found. Many of the approximations discussed in these references are applicableto randomly oriented non-spherical particles (as in the case of marine particles) and help establishan intuition for their optical characteristics when compared with spheres. The characteristics ofparticles (size and index of refraction) most emphasised in Bohren & Huffman (1983), Mishchenkoet al. (2002) and Kokhanovsky (2003), however, are significantly different from those of marineparticles.
Particles much smaller than the wavelength
The Rayleigh region (RAY) ( )
In this optical region shape does not contribute to the optical properties of particles; for a givenwavelength, the IOPs are only dependent on particle volume and its index of refraction (e.g., Kerker1969, Bohren & Huffman 1983, Kokhanovsky 2003):
(18)
(19)
(20)
xD= ,πλ
[ ]dimensionless
m n− ≈ −1 1 1
ρ = −( ) .2 1x n [ ]dimensionless
x D 1 1, ,ρ λ
β θθ( ) =
+ ,3 1
4
2cos ( )[ ]dimensionless
CV m
c =−
,k
m2 2 2
2
21
6π[ ]
CV
a = ,4 2πλk
m[ ]
11

WILHELMINA R. CLAVANO, EMMANUEL BOSS & LEE KARP-BOSS
(21)
(22)
where k = 2π/λ [nm–1] is the wave number. Since the IOPs are a function of only particle volume,incident wavelength and index of refraction (Equations 18–22), there is no difference between theIOPs of non-spherical particles and equal-volume spheres. In the marine environment, small organicand inorganic dissolved molecules fall within this regime.
Particles of size much larger than the wavelength
The geometric optics (GO) region ( )
In this optical region scattering is dominated by diffraction although refraction effects introduce anecessary correction for intermediate values of the size parameter (known as ‘edge effects’, e.g.,Kokhanovsky & Zege 1997). An analytical solution has been derived for the attenuation crosssection of absorbing particles of random shape in this region (e.g., Kokhanovsky & Zege 1997)and is given by:
(23)
The absorption cross section, Ca, can also be derived analytically. In general, it is a complexfunction of both parts of the index of refraction and x (e.g., Kokhanovsky & Zege 1997). For sizeswhere , it simplifies to
Within the GO region, these analytical solutions imply that the attenuation, absorption, andscattering (but not the VSF) of a randomly oriented non-spherical particle will be the same as thatof a sphere of the same cross-sectional area, that is, it will approach the geometric optics limit(Kerker 1969):
(24)
Given that the average cross-sectional area of a sphere is always the smallest of any convexshape of the same volume, an equal-volume sphere will always underestimate the IOPs of particlesmuch larger than the wavelength. The VSF in this regime for known shapes (including spheroids)can be obtained from ray tracing computations (see below). Particles that fall in this region in themarine environment include large diatom chains, large heterotrophs (e.g., Noctiluca sp.), meso-and macrozooplankton and macrosize aggregates, including faecal pellets.
Particles of size comparable to or larger than the wavelength
The Rayleigh-Gans-Debye (RGD) (x < 1, ρ < 1, D ≈ λ) and the van de Hulst (VDH)
(x > 1, 1 < ρ < 100, D > λ) regions
The RGD and VDH optical regions are of particular interest because many optically relevant marineparticles (e.g., phytoplankton and sediments) fall within them. However, no simple closed-formanalytical solution exists for randomly oriented non-spherical particles in these regions (Aas 1984).
C C Cb c a= − ,[ ]m2
CC
bb
b= ,
22[ ]m
x D 1 100, ,ρ λ
C x Gc = + ⟨ ⟩ .−
2 1
23 2[ ]m
kx 1 C Ga = ⟨ ⟩.
limρ
γ→∞ , , = ⟨ ⟩ ≥ .c a b
G
G1
12

INHERENT OPTICAL PROPERTIES OF NON-SPHERICAL MARINE-LIKE PARTICLES
Scattering by soft particles in the RGD and VDH regions is dominated by diffraction althoughcontributions from reflection and refraction need to be taken into account. Absorption is assumedto be independent of the real part of the index of refraction, although more recent approximationshave included n effects on absorption (Kokhanovsky & Zege 1997). Simple analytical solutionsfor Cc, Ca and Cb have been derived for spheres and for some simple shapes by van de Hulst (1981)and Aas (1984). Shepelevich et al. (2001), following Paramonov (1994a,b), derive Cc, Ca and Cb
for randomly oriented monodispersed spheroids from a polydispersed population of spheres havingthe same volume and cross-sectional area. A similar approach is used here to examine the IOPs ofnon-spherical marine-like particles but, rather than follow Shepelevich et al. (2001) who used theapproximation given by van de Hulst (1981) to obtain the optical values for spheres, values forspheres are derived here directly from Mie theory.
Size ranges of aquatic constituents and optical regions are provided in Figure 2 for the particularwavelength (λ = 676 nm) and the specific refractive indices (n = 1.05, 1.17) used in this review.Results for other visible wavelengths are not expected to be very different and can be deducedfrom the results presented here by changing the diameter while keeping x constant. Similarly, theindices of refraction used here span the range of those of marine particles thus bounding the likelyresults for all relevant marine particles. The sizes associated with the different optical size regionsare provided in Table 1.
IOPs of monodispersions of randomly oriented spheroids
Exact and approximate methods
Since the 1908 paper by Mie there is now an exact solution (in the form of a series expansion)providing the optical properties of a homogeneous sphere of any size and index of refraction relevantto aquatic optics. Unfortunately, there is no equivalent converging solution for non-sphericalparticles for all relevant sizes. Asano & Yamamoto (1975) obtained an exact series solution forscattering by spheroids of arbitrary orientation but their solution did not converge for size parameters>30. Obtaining optical properties of non-spherical particles for the wide range of sizes exhibitedby marine particles requires the use of several methods, each valid within a specific optical region.The appropriate application of each of these approaches depends on the combination of sizes,shapes and refractive indices of the particles of interest. For small particles the T-matrix method(Waterman 1971, cf. Mishchenko et al. 2000), which is an exact solution to Maxwell’s equationsfor light scattering, applies. This method is limited to particles with a phase shift parameter that issmaller than approximately 10 (it covers particles with phase shift parameters as large as those inthe RGD region, see Table 1). As particles deviate from a spherical shape the phase shift parameterfor which this method is valid decreases. For larger particles, a variety of methods that provideapproximate solutions for optical properties have been used (see Mishchenko et al. 2002 for areview of the state of the art).
Table 1 Size ranges roughly corresponding to the size regions defined for two different refractive indices given λ = 676 nm
Size region n = 1.05 n = 1.17 Equivalent ρ
RAY D 0.2 µm D 0.2 µm ρ 0.1RGD D < 5 µm D < 2 µm ρ < 3VDH 5 < D < 200 µm 2 < D < 65 µm 3 < ρ < 100GO D 200 µm D 65 µm ρ 100
13

WILHELMINA R. CLAVANO, EMMANUEL BOSS & LEE KARP-BOSS
One such approximation is the Paramonov (1994b) method for obtaining the attenuation, absorptionand scattering of optically soft spheroids (Shepelevich et al. 2001). In this approach, a polydispersionof spheres with the same volume and average cross section (given an appropriate size distribution) isused to provide the attenuation, absorption and scattering coefficients of a monodispersion of randomlyoriented spheroids. A comparison of absorption and attenuation efficiencies obtained by this methodwith T-matrix results (for the largest sizes possible) reveals that the differences are <0.2% for Qa and<3% for Qc when m = 1.05 + i0.01 (i.e., an organic-like particle). When m = 1.17 + i0.0001 (i.e., aninorganic-like particle), differences between the two methods are <4% for Qa and <5% for Qc.
Another method is the ray tracing technique (the implementation by Macke et al. 1995 is usedhere), which provides solutions for the IOPs in the geometric optics region (good for soft particleswith a phase shift parameter greater than ρ = 400 (n – 1) (based on Mishchenko et al. 2002) and appliesto particles such as large zooplankton and aggregates; Table 1 and Figure 2). Using this approach, thephase function, , for which there is no solution in the relevant intermediate sizes, can be approx-imated. In addition, it provides both the VSF, , and the backscattering coefficient, bb, for this sizerange. This method agrees well with the Paramonov method described above,with a difference of 3%for Qc, 5% for Qa and 0.2% for Qb, for m = 1.05 + i0.01; and of 3% for Qc, 40% for Qa and 3% forQb, for m = 1.17 + i0.0001, thus increasing the confidence in the former approach as well. The relativelylarger difference in the absorption efficiency is due to the fact that the absorption index is too small tobring even the largest particles considered here to approach the geometric optics limit, that is, thecondition is not satisfied. The ray tracing method is therefore used here only for computing theVSF in the GO limit while the Paramonov approach is used to obtain c, a and b at that limit.
Two other approaches were evaluated: (1) an analytical approximation method developed byFournier & Evans (1991) to obtain the attenuation efficiency of randomly oriented spheroids (thisapproach works extremely well for a wide range of particles) and (2) an analytical approximationmethod developed by Kirk (1976) to obtain the absorption cross section of randomly orientedspheroids. The agreement between these two methods and the T-matrix method was not as goodas the agreement with the Paramonov method and therefore these two methods are not used here.
The data used in this review can be found at http://misclab.umeoce.maine.edu/research/research10_data.php. Numerical codes used in this review can be found at http://misclab.umeoce.maine.edu/software.php.
Results: IOPs of a monodispersion
Application of the methods described above to a wide range of particle sizes and aspect ratios(across all optical regions) reveals the potential biases associated with the use of spheres as modelsto obtain optical properties of monodispersed non-spherical particles (which may apply, for exam-ple, to single species blooms and laboratory studies of phytoplankton cultures).
The volume scattering function
The VSFs of monodispersed, non-spherical particles do not have the resonance structure (expressedas oscillations in the VSF as a function of scattering angle) observed for monodispersed spheres,much like polydispersions of spheres (Chylek et al. 1976; see also Figure 4 in Mishchenko et al.
β θ( )β θ( )
kx 1
14
Figure 4 (see facing page) (See also Colour Figure 4 in the insert following page 344.) The volume scatteringfunction for spheres, (A, D), and for equal-volume spheroids, with aspect ratio s/t = 2 (B, E). Theratio between the two (i.e., the bias denoted as γβ(θ) is presented in panels C and F. The primary y-axis for eachplot represents variation in particle size, D[µm], while the secondary y-axis represents variation in the phaseshift parameter, ρ (scale found on C and F). Results are for two different types of particles: phytoplankton-likeparticles with m = 1.05 + i0.01 (A, B, C) and inorganic-like particles with m = 1.17 + i0.0001 (D, E, F). Valuesfor spheroids have been obtained using the T-matrix method for D ≤ 10 µm and by the ray tracing method forD ≥ 40 µm. No solution is available for 10 < D < 40 µm (white regions in B, C, E and F).
β θ ( ) β θ( )

INHERENT OPTICAL PROPERTIES OF NON-SPHERICAL MARINE-LIKE PARTICLES
Figu
re 4
Particle size D (µm)
0.2
0.5125
10
20
50
20
0
10
−5
10
−2
10
2
10
5
A m =
1.0
5 +
i0.0
11
0−4
10
−2
10
0
10
2
10
4
B m =
1.0
5 +
i0.0
11
0−1
10
0
10
1
10
2Phase shift parameter ρ
C m =
1.0
5 +
i0.0
10
.2
0.5
12510
20
50
10
0
Particle size D (µm)
Sca
tter
ing
an
gle
θ (
deg
)
03
06
09
01
20
15
01
80
0.2
0.5125
10
20
50
20
0
10
−5
10
−2
10
2
10
5D m
= 1
.17
+ i0
.00
01
Sca
tter
ing
an
gle
θ (
deg
)
03
06
09
01
20
15
01
80
10
−3
10
−1
10
1
10
3
E m =
1.1
7 +
i0.0
00
1
Sca
tter
ing
an
gle
θ (
deg
)
03
06
09
01
20
15
01
80
10
−1
10
0
10
1
10
2
Phase shift parameter ρ
F m =
1.1
7 +
i0.0
00
10
.5
12510
20
50
10
0
20
03
00
β (
θ) (
m−1
sr−1
)β
(θ)
(m
−1sr
−1);
s t= 2
γ β (θ
) =β
(θ
)
β
(θ)
15

WILHELMINA R. CLAVANO, EMMANUEL BOSS & LEE KARP-BOSS
2002). Because the VSF is smoother for spheroids (Figure 4B,E, see also Colour Figure 4 in theinsert following p. 344), the anomalous diffraction peaks inherent in spheres determine the patternof the biases (Figure 4C,F). Internal transmission and refraction cause the number of peaks in theVSF for spheres to increase with particle size; however, the magnitudes are dampened and so isthe general trend in the bias.
For both large non-spherical organic-like and inorganic-like particles, forward scattering isstronger compared with that of equal-volume spheres (Figure 4). In the backward and side-scatteringdirections, however, there are differences in the biases in the VSF between the two types of particles;for organic-like particles, the largest biases are in the backward direction and are associated withsmall particles (in particular, particles on the order of the wavelength of light, e.g., D ≈ 0.5 µm;Figure 4C). For inorganic-like particles the largest differences are in the side-scattering directionand are associated with large particles (Figure 4F).
Attenuation, absorption and scattering: efficiency factors and biases
Efficiency factors for attenuation, Qc, as a function of particle size, show a similar trend of variationfor spheres and spheroids (Figures 5 and 6), approaching an asymptotic value of two when the GOlimit is reached (Figure 6A,B). The size, D, however, at which Qc reaches its maximal valueincreases with increased departure from a spherical shape (Figure 6A,B).
In general, a sphere will overestimate the attenuation (γc < 1) of an equal-volume spheroid (upto 50% for the most extreme shapes) but will underestimate the attenuation (γc > 1) of an equal-volume spheroid for particles larger than the wavelength (Figures 7A,C and 8A,B). Scatteringdominates attenuation; the efficiency factors and biases for scattering are very similar to those ofattenuation (Figures 6E,F, 8E,F, 9A,C and 10A,C).
The trend in the change of the efficiency factors for absorption, Qa, as a function of particlesize is similar for spheres and spheroids, approaching an asymptotic value of one at the GO limit(Figures 5B,D and 6C,D). The absorption efficiency factor of spheroids, however, is always lowerthan or equal to that of an equal-volume sphere, regardless of particle size and aspect ratio(Figure 6C,D). Absorption efficiency factors of inorganic-like particles are low (Figure 6D) and thebiases in absorption between spheres and spheroids are small (Figure 8D). Biases in absorption arealso small for small organic-like particles (γa ≈ 1; Figure 8C), but increase with increasing particlesize and deviation from sphericity. For large organic-like particles, absorption by a spheroid isalways larger than that of a sphere of the same volume (Figures 7B and 8C). That is because theabsorbing material in a randomly oriented spheroid is less packaged compared with that in a sphere,exposing more absorbing material to the incident light. However, Qa is smaller for a randomlyoriented spheroid (Figures 5B,D and 6C,D), as it is derived from Ca by dividing by the averagecross-sectional area, which is always smaller for spheres.
The backscattering bias can be very large (by a factor of 16, Figure 10B), especially in theRGD region and for particles much larger than the wavelength (Figures 8G,H and 10B,D). For thelargest particles, the backscattering does not reach the asymptotic value of the other IOPs, at leastin the range of sizes examined here. By applying an unrealistically large absorption value, however,the backscattering bias does approach the same asymptotic value as total scattering (by using theT-matrix method, Herring 2002).
The volume-normalised cross sections for attenuation and scattering, αc and αb, respectively,illustrate that the size contributing most to attenuation and scattering (per unit volume or per unit mass)is larger for spheroids than for equal-volume spheres (Figure 11A,B,E,F; consistent with the findingsby Jonasz (1987a) that there is as much as a 300% difference between spheres and spheroids in thevolume-normalised attenuation cross section). In general, the magnitude of the volume-normalisedcross sections for attenuation and scattering decreases with departure from sphericity, suggesting
16

INHERENT OPTICAL PROPERTIES OF NON-SPHERICAL MARINE-LIKE PARTICLES
that spheres interact (resonate) better, per unit volume, with the impinging radiation compared withother shapes. Similar to attenuation and scattering, model results for the volume-normalised crosssection for backscattering, , show that the size contributing most to backscattering is larger forspheroids than for equal-volume spheres (Figure 11G,H). Unfortunately, the lack of solutions forintermediate regions limits the ability here to discuss any further.
The volume-normalised absorption cross section, αa, is higher for all strongly absorbing sphe-roids with low indices of refraction, consistent with the idea that in a randomly oriented mono-dispersion of homogeneous spheroids more material can interact with the incident light than in amonodispersion of spheres of the same volume, which is better ‘packaged’ or ‘self-shaded’(Figure 11C,D). This is not the case for weakly absorbing particles that are smaller than a fewmicrons — probably due to scattering within the particle that increases the average path length ofa light ray — hence increasing the probability of absorption. This effect is slightly larger for spheresgiven that they are more effective scatterers (Figure 11D).
Figure 5 Efficiency factors for attenuation, Qc (A, C), and absorption, Qa (B, D), for spheroids as a functionof size, D [µm] (primary x-axis, bottom), with corresponding phase shift parameter, ρ (secondary x-axis, top),and aspect ratio, s/t. Results were derived using the T-matrix method for small particles (area within the whiteline to the left of each plot), and the Paramonov (1994b) method for intermediate and larger particles (rest ofthe plot), for two different types of particles: phytoplankton-like particles with refractive index m = 1.05 +i0.01 (A, B) and inorganic-like particles with m = 1.17 + i0.0001 (C, D).
0.1
0.2
0.5
1
2
5
10
20
Phase shift parameter ρ
A
m = 1.05 + i0.01
0.2 0.5 1 2 5 10 20 50 100 Qc
Qc
Qa
Qa
0.5
1
1.5
2
2.5
Phase shift parameter ρ
B
m = 1.05 + i0.01
0.2 0.5 1 2 5 10 20 50 100
0.2
0.4
0.6
0.8
1
Particle size D (µm)
0.2 0.5 1 2 5 10 20 50 100 2000.1
0.2
0.5
1
2
5
10
20C
m = 1.17 + i0.0001
0.5 1 2 5 10 20 50 100 200
0.5
1
1.5
2
2.5
3
3.5
Particle size D (µm)
0.2 0.5 1 2 5 10 20 50 100 200
D
m = 1.17 + i0.0001
0.5 1 2 5 10 20 50 100 200
0.05
0.1
0.15
0.2
0.25
0.3
Asp
ect
rati
os t
Asp
ect
rati
os t
αbb
αbb
17

WILHELMINA R. CLAVANO, EMMANUEL BOSS & LEE KARP-BOSS
Figure 6 Efficiency factors for attenuation, Qc (A, B), absorption, Qa (C, D), scattering, Qb (E, F), and back-scattering, Qbb
(G, H), for spheroids as a function of size, D [µm] (primary x-axis, bottom), with correspondingphase shift parameter, ρ (secondary x-axis, top), and aspect ratio, s/t. Results were derived using the T-matrixmethod for small particle sizes and the Paramonov (1994b) method for intermediate sizes, while the ray tracingmethod was used to obtain Qbb
for large sizes. Results are presented for two different types of particles: aphytoplankton-like particle with refractive index m = 1.05 + i0.01 (A, C, E, G) and an inorganic-like particlewith m = 1.17 + i0.0001 (B, D, F, H). The lines represent aspect ratios (legend is shown in D): oblate spheroidswith s/t = 0.5 (grey solid line) and s/t = 0.1 (grey dashed line), prolate spheroids with s/t = 2 (dark solid line)and s/t = 10 (dark dashed line), and spheres with s/t = 1 (solid line with dots).
0
0.5
1
1.5
2
2.5
3Q c
0.2 0.5 1 2 5 10 20 50
Phase shift parameter ρ
A
m = 1.05 + i0.01
0
0.2
0.4
0.6
0.8
1
1.2
Q a
C
m = 1.05 + i0.01
0
0.5
1
1.5
2
2.5
Q b
E
m = 1.05 + i0.01
0.2 0.5 1 2 5 10 20 50 2000.000
0.001
0.002
0.003
0.004
Particle size D (µm)
Q bb
G m = 1.05 + i0.01
0
1
2
3
4
Q c
0.5 1 2 5 10 20 50 200
B
m = 1.17 + i0.0001
Phase shift parameter ρ
0
0.1
0.2
0.3
0.4
Q a
Aspect ratio st
10
2
1
0.5
0.1
D m = 1.17 + i0.0001
0
1
2
3
4
Q b
F
m = 1.17 + i0.0001
0.2 0.5 1 2 5 10 20 50 2000
0.02
0.04
0.06
0.08
0.1
Particle size D (µm)
Q bb
H
m = 1.17 + i0.0001
18
INHERENT OPTICAL PROPERTIES OF NON-SPHERICAL MARINE-LIKE PARTICLES
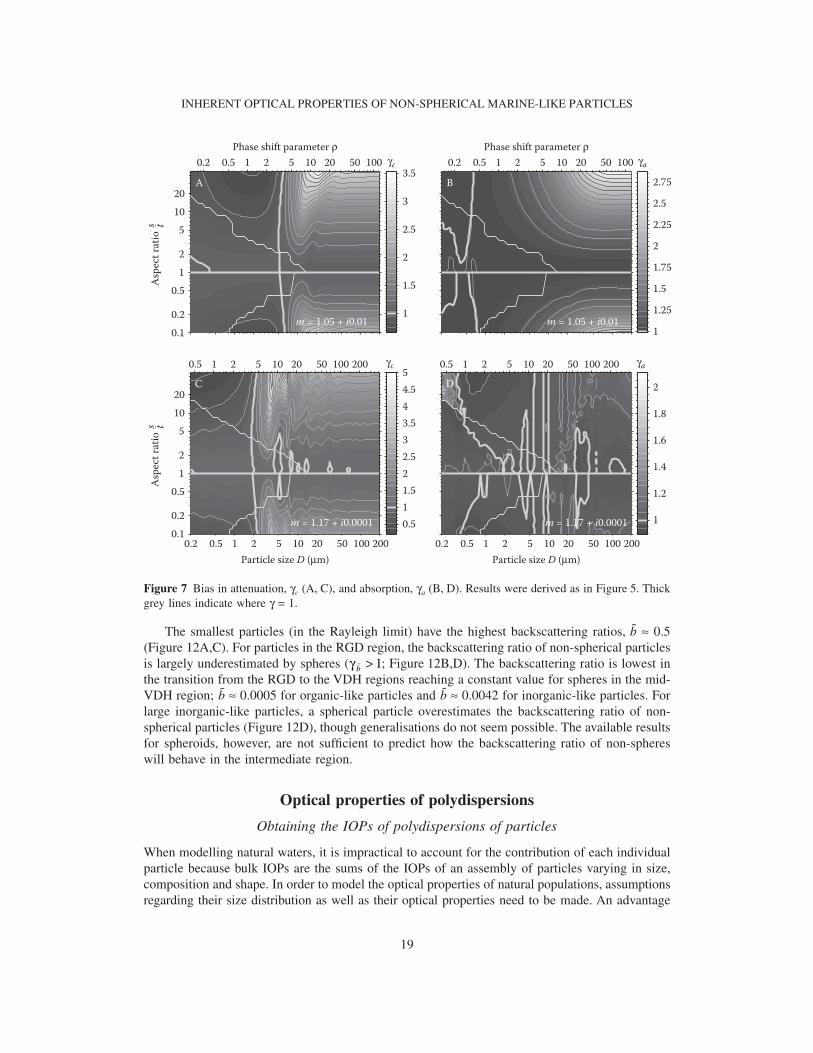
The smallest particles (in the Rayleigh limit) have the highest backscattering ratios, b ≈ 0.5(Figure 12A,C). For particles in the RGD region, the backscattering ratio of non-spherical particlesis largely underestimated by spheres ( ; Figure 12B,D). The backscattering ratio is lowest inthe transition from the RGD to the VDH regions reaching a constant value for spheres in the mid-VDH region; b ≈ 0.0005 for organic-like particles and b ≈ 0.0042 for inorganic-like particles. Forlarge inorganic-like particles, a spherical particle overestimates the backscattering ratio of non-spherical particles (Figure 12D), though generalisations do not seem possible. The available resultsfor spheroids, however, are not sufficient to predict how the backscattering ratio of non-sphereswill behave in the intermediate region.
Optical properties of polydispersions
Obtaining the IOPs of polydispersions of particles
When modelling natural waters, it is impractical to account for the contribution of each individualparticle because bulk IOPs are the sums of the IOPs of an assembly of particles varying in size,composition and shape. In order to model the optical properties of natural populations, assumptionsregarding their size distribution as well as their optical properties need to be made. An advantage
Figure 7 Bias in attenuation, γc (A, C), and absorption, γa (B, D). Results were derived as in Figure 5. Thickgrey lines indicate where γ = 1.
Asp
ect
rati
os t
0.1
0.2
0.5
1
2
5
10
20
Phase shift parameter ρ
A
m = 1.05 + i0.01
0.2 0.5 1 2 5 10 20 50 100 γc
1
1.5
2
2.5
3
3.5
Phase shift parameter ρ
B
m = 1.05 + i0.01
0.2 0.5 1 2 5 10 20 50 100 γa
1
1.25
1.5
1.75
2
2.25
2.5
2.75
Particle size D (µm)
s tA
spec
t ra
tio
0.2 0.5 1 2 5 10 20 50 100 2000.1
0.2
0.5
1
2
5
10
20C
m = 1.17 + i0.0001
0.5 1 2 5 10 20 50 100 200 γc
0.5
1
1.5
2
2.5
3
3.5
4
4.5
5
Particle size D (µm)
0.2 0.5 1 2 5 10 20 50 100 200
D
m = 1.17 + i0.0001
0.5 1 2 5 10 20 50 100 200 γa
1
1.2
1.4
1.6
1.8
2
γ b > 1
19

WILHELMINA R. CLAVANO, EMMANUEL BOSS & LEE KARP-BOSS
Figure 8 Biases for attenuation, γc (A, B), absorption, γa (C, D), scattering, γb (E, F), and backscattering, γbb
(G, H), for spheroids as a function of size, D [µm] (primary x-axis, bottom), with corresponding phase shiftparameter, ρ (secondary x-axis, top). Each line represents a different aspect ratio, s/t (legend is shown inpanel D). Results were derived as in Figure 6 for two different types of particles: a phytoplankton-like particlewith refractive index m = 1.05 + i0.01 (A, C, E, G) and an inorganic-like particle with m = 1.17 + i0.0001(B, D, F, H).
0.5
1
1.5
2
2.5
3γ c
0.2 0.5 1 2 5 10 20 50
Phase shift parameter ρ
A
m = 1.05 + i0.01
1
1.4
1.8
2.2
2.6
γ a
C m = 1.05 + i0.01
0
1
2
3
4
γ b
E
m = 1.05 + i0.01
0
1
2
3
4
5
6
7
Particle size D (µm)
γ bb
G m = 1.05 + i0.01
0
1
2
3
4
γ c
0.5 1 2 5 10 20 50 200
B
m = 1.17 + i0.0001
Phase shift parameter ρ
0.8
1
1.2
1.4
1.6
1.8
γ a
Aspect ratio st
10
2
1
0.5
0.1
D
m = 1.17 + i0.0001
0
1
2
3
4
γ b
F
m = 1.17 + i0.0001
0
0.5
1
1.5
2
2.5
Particle size D (µm)
γ bb
H
m = 1.17 + i0.0001
0.2 0.5 1 2 5 10 20 50 200 0.2 0.5 1 2 5 10 20 50 200
20

INHERENT OPTICAL PROPERTIES OF NON-SPHERICAL MARINE-LIKE PARTICLES
of modelling polydispersions is that the results provide more realistic values of IOPs that bettermimic natural populations by eliminating the extreme characteristics of monodispersions that areaveraged out and smoothed in the IOPs for polydispersions.
Particles are distributed according to a particulate size distribution (PSD) that describes howtheir number concentration varies with size. Most often the PSD, f (D) [# m–3 µm–1], is given in itsdifferential form in number of particles per unit volume per unit bin length, such that the numberconcentration, N, between two size classes, D1 and D2, is computed as:
(25)
For a population of particles with varied composition, the IOPs are computed from the PSD as:
(26)
Figure 9 Efficiency factors for scattering, Qb (A, C), and backscattering, Qbb (B, D), for spheroids as a function
of size, D [µm] (primary x-axis, bottom), with corresponding phase shift parameter, ρ (secondary x-axis, top),and aspect ratio, s/t. Results were derived as described in Figure 5. Only the T-matrix and ray tracing methodswere used for Qbb
, however, as no other approximation is currently available for intermediate sizes.
Asp
ect
rati
os t
0.1
0.2
0.5
1
2
5
10
20
Phase shift parameter ρ
A
m = 1.05 + i0.01
0.2 0.5 1 2 5 10 20 50 100 Qb
0.5
1
1.5
2
Phase shift parameter ρ
B
m = 1.05 + i0.01
0.2 0.5 1 2 5 10 20 50 100 Qbb
0.001
0.002
0.003
0.004
0.005
0.006
Particle size D (µm)
s tA
spec
t ra
tio
0.2 0.5 1 2 5 10 20 50 100 2000.1
0.2
0.5
1
2
5
10
20C
m = 1.17 + i0.0001
0.5 1 2 5 10 20 50 100 200 Qb
0.5
1
1.5
2
2.5
3
3.5
Particle size D (µm)
0.2 0.5 1 2 5 10 20 50 100 200
D
m = 1.17 + i0.0001
0.5 1 2 5 10 20 50 100 200 Qbb
0.01
0.02
0.03
0.04
0.05
0.06
0.07
0.08
0.09
N D D D f D D #D
D
∆ = − = ( ) .
−∫2 13
1
2
d m[ ]
c a b b C D f D DbD
D
c a b bb, , , = ( ) ( ) ,∫ , , ,
−
min
max
d m[ ]1
21

WILHELMINA R. CLAVANO, EMMANUEL BOSS & LEE KARP-BOSS
For the analysis conducted here two common PSDs previously used in other studies of IOPsare employed:
1. The power-law PSD (also referred to as the Junge-like PSD) is given by:
(27)
where D0 [µm] is a reference diameter and is the differential numberconcentration at the reference diameter. ξ is the slope of the differential PSD (values inaquatic environments are within the range 2.5 < ξ < 5.0; Morel 1973, Jonasz 1983,Stramski & Kiefer 1991). When ξ = 4.0 the PSD is known as the Junge PSD for whichan equal volume of particulate material is distributed in logarithmically increasing sizebins. The smaller the value of the power-law slope, ξ, the smaller is the relative contri-bution of small particles to the PSD. In the analysis presented here, ξ is allowed to vary
Figure 10 Bias in scattering, γb (A, C), and backscattering, γbb (B, D). Results were derived as in Figure 9.
Thick grey lines indicate where γ = 1.
Asp
ect
rati
os t
Asp
ect
rati
os t
0.1
0.2
0.5
1
2
5
10
20
Phase shift parameter ρ
A
m = 1.05 + i0.01
0.2 0.5 1 2 5 10 20 50 100 γb
0.5
1
1.5
2
2.5
3
3.5
4
4.5
Phase shift parameter ρ
B
m = 1.05 + i0.01
0.2 0.5 1 2 5 10 20 50 100 γbb
2
4
6
8
10
12
14
16
Particle size D (µm)
0.2 0.5 1 2 5 10 20 50 100 2000.1
0.2
0.5
1
2
5
10
20C
m = 1.17 + i0.0001
0.5 1 2 5 10 20 50 100 200 γb
0.5
1
1.5
2
2.5
3
3.5
4
4.5
5
Particle size D (µm)
0.2 0.5 1 2 5 10 20 50 100 200
D
m = 1.17 + i0.0001
0.5 1 2 5 10 20 50 100 200 γbb
0.5
1
1.5
2
2.5
3
3.5
f DD D D D
n DD
( ) =, < > ;
−
0
0 0
if ormin max
ξ
, ≤ ≤
,
− −
ifm m
min maxD D D#[ ]3 1µ
n #03 1[ ]m m− −µ
22

INHERENT OPTICAL PROPERTIES OF NON-SPHERICAL MARINE-LIKE PARTICLES
Figure 11 Volume-normalised cross sections for attenuation, αc (A, B), absorption, αa (C, D), scattering, αb
(E, F), and backscattering, αbb (G, H), for spheroids as a function of size, D [µm] (primary x-axis, bottom),
with corresponding phase shift parameter, ρ (secondary x-axis, top). Each line represents a different aspectratio, s/t (legend is shown in panel G). Results were derived as in Figure 6 for two different types of particles:a phytoplankton-like particle with refractive index m = 1.05 + i0.01 (A, C, E, G) and an inorganic-like particlewith m = 1.17 + i0.0001 (B, D, F, H).
0
0.2
0.4
0.6
0.8
1α c
0.2 0.5 1 2 5 10 20 50
Phase shift parameter ρ
A m = 1.05 + i0.01
0
0.05
0.1
0.15
0.2
0.25
0.3
α a
C m = 1.05 + i0.01
0
0.1
0.2
0.3
0.4
0.5
0.6
0.7
α b
E m = 1.05 + i0.01
0.2 0.5 1 2 5 10 20 50 2000
0.002
0.004
0.006
0.008
0.01
0.012
Particle size D (µm)
α bb
Aspect ratio st
10
2
1
0.5
0.1
G m = 1.05 + i0.01
0
0.5
1
1.5
2
2.5
3
3.5
α c
0.5 1 2 5 10 20 50 200
B m = 1.17 + i0.0001
Phase shift parameter ρ
0.0020
0.0025
0.0030
0.0035
0.0040
α a
D m = 1.17 + i0.0001
0
0.5
1
1.5
2
2.5
3
3.5
α b
F m = 1.17 + i0.0001
0.2 0.5 1 2 5 10 20 50 2000
0.02
0.04
0.06
0.08
0.1
0.12
Particle size D (µm)
α bb
H m = 1.17 + i0.0001
23

WILHELMINA R. CLAVANO, EMMANUEL BOSS & LEE KARP-BOSS
(representing the variations in the natural environment) to examine how changes in therelative concentration of small to large particles affects biases between spherical andnon-spherical populations of particles.
2. A more elaborate PSD based on generalised gamma functions was introduced by Risoviç(1993):
where nS and nL are the number concentrations of small and large particles [# m–3 µm–1],respectively, and D0 [µm] is the reference diameter. The other parameters, µS,L, τS,L andυS,L, help to generalise the gamma functions that express the distributions of the smalland large particles, respectively, and are site-specific with values provided by Risoviç(1993) (parametric values of a ‘typical’ water body are µS = 2, τS = 52 µm–1, υS = 0.157;and µL = 2, τL = 17 µm–1 and υL = 0.226). In the analysis that follows, the ratio of thenumber of small to large particles, , is likewise varied, as with the power-law
Figure 12 Backscattering ratios, (A, C), and biases in the backscattering ratio, (B, D), as a functionof particle size, D [µm] (primary x-axis, bottom), with corresponding phase shift parameter, ρ (secondaryx-axis, top). Results are derived as in Figure 9 for two different types of particles: a phytoplankton-like particlewith m = 1.05 + i0.01 (A, B) and an inorganic-like particle with m = 1.17 + i0.0001 (C, D). Each line representsa different aspect ratio, s/t (legend is shown in panel A).
10−4
10−3
10−2
10−1
100b
Aspect ratio st
10
2
1
0.5
0.1
0.2 0.5 1 2 5 10 20 50
Phase shift parameter ρ
A
m = 1.05 + i0.01
0
2
4
6
8
γ bγ b
0.2 0.5 1 2 5 10 20 50
B
m = 1.05 + i0.01
Phase shift parameter ρ
0.2 0.5 1 2 5 10 20 50 200
10−2
10−1
100
Particle size D (µm)
b
0.5 1 2 5 10 20 50 200
C
m = 1.17 + i0.0001
0.2 0.5 1 2 5 10 20 50 2000
1
2
3
4
5
Particle size D (µm)
0.5 1 2 5 10 20 50 200
D
m = 1.17 + i0.0001
b bbb= γ
bb
f D
D D D D
nDDS
S( )
, ;
exp(
min max
=
< >
−
0
0
if orµ
τSS L LD nDD
D D D DS
L
Lνµ
ντ) exp( ), min m+
− ≤ ≤
0
if aax
[# ],m m− −
3 1µ
(28)
n nS L:
24

INHERENT OPTICAL PROPERTIES OF NON-SPHERICAL MARINE-LIKE PARTICLES
distribution earlier, to examine how changes in the relative concentration of small tolarge particles affects the bias between spherical and non-spherical particles. The smallerthe value of , the smaller is the relative contribution of small particles to the PSD.
Two types of comparisons between the IOPs of a polydispersion of spheroids are performedhere:
1. A constant aspect ratio is assumed for the whole population and only the slope of thePSD (ξ or ) is allowed to vary.
2. The slope of the PSD and the aspect ratio are varied as a function of size following theobservations of Jonasz (1987b) who, utilising scanning electron microscopy, derived thefollowing shape distribution:
(29)
The implication of Equation 29 is that the smaller the particles are the more sphere-likethey become. Jonasz (1987b) also found that the larger particles resembled elongatedcylinders with aspect ratios >1. The geometric cross section of an elongated cylinder,however, is very similar to that of a prolate spheroid and so prolate spheroids are usedhere to model larger particles. Thus, the deviation from sphericity of a particle can beexpressed in terms of its aspect ratio, s/t, and diameter of its equal-volume sphere, D,and Equation 29 becomes:
(30)
Given a size D, this equation is solved to obtain s/t, which is used in the populationmodel with aspect ratios varying as a function of size (see also Figures 2 and 3 in Jonasz1987b).
Results for polydispersions
In the following section, the modelled IOPs (c, a and b) of polydispersions of spheroids arepresented. Due to the inability to obtain the VSF of spheroids throughout the size range of interest,results regarding either the VSF or the backscattering coefficient, bb, are not presented here.
For polydispersions of spheroids, shape effects depend on the relative contributions of smalland large particles to the population and the degree to which particles deviate from a sphericalshape (as indicated by the aspect ratio). In both the power-law and Risoviç (1993) PSD simulations,with constant and varying aspect ratios, the biases of all the IOPs increase with increasing proportionof large particles in the population (i.e., as or as , Figures 13 and 14). This isa direct consequence of the nearly monotonic change in the bias as a function of size for amonodispersion (Figure 8). As expected from the results for monodispersions of spheroids, thebiases in attenuation and scattering increase as the aspect ratio departs from one, the absorptionbias also increases with departure from sphericity and with increasing absorption index. In mostcases the biases are >1 (i.e., a spherical model will underestimate a population of spheroids), being
n nS L:
n nS L:
⟨ ⟩ = . ..G
GD1 28 0 22
12
1
1
23
13 1 2
2
− − −
−
+( ) − ( )
− ( )
s
t
st
st
st
sin
= . ..1 28 0 22D
ξ → 3 n nS L: → 1012
25

WILHELMINA R. CLAVANO, EMMANUEL BOSS & LEE KARP-BOSS
<1 only for attenuation and scattering by populations dominated by small particles (i.e., asor as , Figures 13 and 14) and for absorption when small cells dominate and theaspect ratio is significantly different from one (Figure 13D). Biases of the Risoviç (1993) PSD aresimilar to those of the power-law PSD (Figures 13 and 14). Changes in the bias as a function ofthe PSD parameter (Figures 13 and 14) are smooth due to the averaging over particles of manydifferent sizes, as well as to random orientation. The more realistic case of a population varyingin both size and shape exhibits, in general, a larger bias than populations with a constant shape(Figures 13 and 14) because for all the particles in this population the bias is one or larger whilefor those with constant shape the smallest particles very often have biases smaller than one.
Figure 13 The bias in attenuation, γc (A, B), absorption, γa (C, D), scattering, γb (E, F), and backscattering,γbb
(G, H), for a power-law polydispersion of spheroids relative to a power-law polydispersion of spheres withthe same volume as a function of the power-law exponent, ξ. Each line represents a different aspect ratio, s/t(legend below the plot). The grey line with dots (legend: ‘x’) denotes the polydispersions of spheroids wherethe shape co-varies with size following Jonasz (1983; see text). The dotted vertical lines are used to compareequivalent size distributions in Figure 14.
0.8
1
1.2
1.4
1.6
1.8
2
γ cm = 1.05 + i0.01 A
1
1.2
1.4
1.6
1.8
γ a
m = 1.05 + i0.01 C
4.54.2543.753.50.6
0.8
1
1.2
1.4
1.6
1.8
2
ξ
γ b
m = 1.05 + i0.01 E
0.8
1
1.2
1.4
1.6
1.8
2
γ c
m = 1.17 + i0.0001 B
1
1.1
1.2
1.3
1.4
γ a
m = 1.17 + i0.0001 D
Aspect ratio st
x 10 2 1 0.5 0.1
4.54.2543.753.5
0.8
1
1.2
1.4
1.6
1.8
2
ξ
γ b
m = 1.17 + i0.0001 F
ξ → .4 5n nS L: → 1017
26

INHERENT OPTICAL PROPERTIES OF NON-SPHERICAL MARINE-LIKE PARTICLES
The results here are consistent with those of Herring (2002) who investigated the attenuationbias of a population of particles with a power-law PSD with varying shape as well as varyingrefractive index (using the model of the dependence of the index of refraction on size by Zaneveldet al. 1974). Variations in the attenuation bias were slightly larger in the study by Herring (2002)than the results obtained here (Figure 13), varying from 2.2 to 1.1 as the power-law slope variedbetween 3 ≤ ξ ≤ 5. Varying the imaginary part of the index of refraction between 0.0015 ≤ k ≤0.01 results in a difference of up to 10% in the attenuation bias, most pronounced for a steeperPSD (Herring 2002).
Figure 14 The biases in attenuation, γc (A, B), absorption, γa (C, D), and scattering, γb (E, F), for a Risoviç(1993) polydispersion of spheroids relative to a Risoviç polydispersion of spheres with the same volume asa function of the relative numbers of small to large particles, Each line represents a different aspectratio, s/t (legend below the plot). The grey line with dots (legend: ‘x’) denotes the polydispersions of spheroidswhere the shape co-varies with size following Jonasz (1983; see text). The dotted vertical lines indicate theratios where the size distributions having approximately a power-law slope of ξ = 3.5 and ξ = 4.0, from leftto right respectively, as shown on Figure 13.
1
1.2
1.4
1.6
1.8
2
2.2
γ c
A
1
1.2
1.4
1.6
1.8
γ a
C
1013 1014 1015 1016 10170.7
1
1.3
1.6
1.9
2.2
2.5
nS : nL
γ b
E
0.7
1
1.3
1.6
1.9
2.2
2.5
γ c
B
1
1.05
1.1
1.15
1.2
1.25
γ a
D
Aspect ratio st
x 10 2 1 0.5 0.1
1013 1014 1015 1016 10170.7
1
1.3
1.6
1.9
2.2
2.5
nS : nL
γ b
F
m = 1.05 + i0.01
m = 1.05 + i0.01
m = 1.05 + i0.01
m = 1.17 + i0.0001
m = 1.17 + i0.0001
m = 1.17 + i0.0001
n nS L: .
27

WILHELMINA R. CLAVANO, EMMANUEL BOSS & LEE KARP-BOSS
In general, for the populations of particles modelled here with particle sizes ranging from D =0.2 to 200 µm, at least 50% of the contribution to c, a and b comes from particles smaller thanD = 10 µm (Figure 15). However, the strongest contribution, as much as 65% (indicated by thesteepness of the curves in the plots), comes from the contribution made by particles of intermediatesizes belonging to the VDH region. Because in this region the biases are large (Figure 8), modelsbased on spherical particles will underestimate the IOPs (lines with dots in Figure 15).
Figure 15 The normalised cumulative contribution to attenuation (c) (A, B), absorption (a) (C, D), andscattering (b) (E, F), for both the Risoviç and power-law (ξ = 4) polydispersions. Each linerepresents a different aspect ratio, s/t (legend below the plot). The uppermost curves in each panel representpopulations with a power-law size distribution (compare with Figure 13) and the lowermost curves representpopulations with a Risoviç size and shape distribution (compare with Figure 14). In all cases, the greater thedeviation from sphericity (as indicated by the aspect ratio, s/t) the greater is the contribution by larger particlesto the IOPs of the polydispersion.
0
0.2
0.4
0.6
0.8
1A
0.2 0.5 1 2 5 10 20 50
m = 1.05 + i0.01
Phase shift parameter ρ
0
0.2
0.4
0.6
0.8
1C
m = 1.05 + i0.01
0.2 0.5 1 2 5 10 20 50 2000
0.2
0.4
0.6
0.8
1
Particle size D (µm)
E
m = 1.05 + i0.01
0
0.2
0.4
0.6
0.8
1B
0.5 1 2 5 10 20 50 200
m = 1.17 + i0.0001
Phase shift parameter ρ
0
0.2
0.4
0.6
0.8
1D
m = 1.17 + i0.0001
Aspect ratio st
10 2 1 0.5 0.1
0.2 0.5 1 2 5 10 20 50 2000
0.2
0.4
0.6
0.8
1
Particle size D (µm)
F
m = 1.17 + i0.0001
Power-law
Risoviç
Σ i=
1 c i
/ ΣN c N
nΣ i
=1
ai/
ΣN a
Nn
Σ i=
1 b
i/ Σ
N bN
n
Σ i=
1 c i
/ ΣN c N
nΣ i
=1
ai/
ΣN a
Nn
Σ i=
1 b
i/ Σ
N bN
n
( )n nS L: = 1016
28

INHERENT OPTICAL PROPERTIES OF NON-SPHERICAL MARINE-LIKE PARTICLES
The reader is cautioned that the shapes chosen here, the specific choices for size distribution(including the size range from Dmin to Dmax), the index of refraction and the internal structure areall idealisations and may differ from natural environmental conditions. The general trends in theresults, however, are expected to hold true for the natural environment as has been found in manypast studies where idealised optical theory has been used to interpret and invert in situ observations.In addition, model results presented here provide an order of magnitude estimate for the likely biasresulting when spherical particles are used to model natural assemblages of particles. Two conclu-sions can be drawn from the results here and from Herring (2002): (1) biases in IOPs are expectedto be greatest in populations enriched with large particles similar to those in coastal assemblies ofphytoplankton and those in benthic environments and (2) these biases are likely to be smaller thana factor of three (the biases are likely to be <30% when a population is enriched with small particlesas in the near-surface layer of an oligotrophic ocean).
Observations on the effects of particle shape on IOPs
There are relatively few direct observations on the effects of shape on the IOPs of aquatic particles(e.g., Volten et al. 1998). Size determination and hence volume are often ambiguous. For example,when size fractionation is used (i.e., using filters or sieves of increasingly smaller pore sizes)information on only two of the three dimensions (possibly the largest) of the particles can beestimated. Similarly, when microscopy is used in sizing, it is difficult to estimate the third (usuallysmaller) dimension. Thus, there are uncertainties in both measurements and modelling of IOPs ofnon-spherical particles. Several studies provide evidence that aquatic particles in general, and non-spherical particles in particular, are not optically equivalent to spheres.
Kadyshevich (1977), Voss & Fry (1984) and Volten et al. (1998) measured the VSF and polarisedscattering characteristics of oceanic samples and phytoplankton cultures, respectively, and foundthat the polarisation characteristics of scattering are not consistent with spherical particles. Hod-kinson (1963), Proctor & Barker (1974) and Proctor & Harris (1974) have found that the attenuationefficiency factor (Qc) as a function of size of sorted nonspherical particles did not exhibit theoscillatory behaviour seen for monodispersed spheres and, similar to spheres, attained an asymptoticvalue for large particles. This behaviour is similar to Qc for a polydispersion of spheres. However,the asymptotic value found in those studies was not always two, probably a consequence of thevariety of means by which the ‘size’ of the particles of interest has been determined in the variousstudies (Aas 1984).
An example of recent measurements of the near-forward VSF of natural particles from theSatluj River in India (Figure 16) exhibits two features that are similar to those suggested by thetheoretical analysis presented in this review (Figure 4) and in previous theoretical papers (e.g.,Kerker 1969). The resonance pattern in the VSF associated with a monodispersion of spheresdisappears for even tightly sorted natural particles, in a similar manner as a polydispersion ofspheres (Figure 16A,C). Associated with a larger cross-sectional area, non-spherical particlesexhibit stronger (diffraction-dominated) forward-peaked VSFs (Figure 16A,C). These results areconsistent with the theoretical results showing no resonance pattern in the VSF of monodispersedspheroids as a function of angle (Figure 4) and a scattering bias >1 for large particles comparedwith wavelength (Figure 8F) due to a higher VSF in the near-forward direction. Similar resultshave been recorded by MacCallum et al. (2004) for phytoplankton cultures where the best agreementin the near-forward VSF was found for spheres with a volume larger by a factor of 1.5.
When Mie-based size inversions are applied to non-spherical and complex particles such asphytoplankton, unexpected results are produced. For example, inversion of VSF measurementsconducted on a culture of Ceratium longipes suggests a multi-modal population (Figure 17). The
29

WILHELMINA R. CLAVANO, EMMANUEL BOSS & LEE KARP-BOSS
peaks in the volume size distribution, however, are found to correspond to the outer boundary ofthe cell, the core part of the cell and the thickness of the appendages (Figure 17).
Summary and future prospect
Together with size, composition and internal structure (not addressed here, however, the reader isreferred to Kitchen et al. 1982, Quirantes & Bernard 2004, 2006), shape has important effects onIOPs. For a monodispersion of particles, the biases between spheroids and equal-volume spherescan be larger than a factor of three, while for more realistic polydispersions biases in attenuation,absorption and scattering are smaller than a factor of three. The size of the particles having themaximal IOP per unit volume is larger for spheroids than for spheres for all IOPs; this size increaseswith non-sphericity.
Many studies have attempted to solve the problem of optical properties of non-spherical particlesby looking for a spherical equivalent. While for certain optical properties and size ranges a singlesphere can provide an adequate model for a non-spherical particle, it has been found that otherproperties cannot be modelled with spheres; of these, the degree of polarisation and the VSF inthe backward direction are inherently different for non-spherical geometries (Bohren & Singham1991). In this survey, following Paramonov (1994b), a polydispersion of spheres with the samevolume and cross-sectional area as a monodispersion of spheroids is used to model the attenuation,absorption and scattering for the size range in which no ‘exact’ solutions are available (the T-matrixapproach or the ray tracing method). This approximation works well in that it merges into theT-matrix and ray tracing solutions with very little difference. This method, however, does notprovide an accurate estimate for the VSF or the backscattering coefficient of non-spherical particles.
For the smallest particles, such as viruses in aquatic environments, shape is not likely to affectthe IOPs and hence these particles can be modelled as spheres. Particles with sizes comparable
Figure 16 Measurements of near-forward scattering. A is a comparison of the shape of the near-forwardscattering between sorted particles (Satluj River sediment; solid line) and glass spheres (line with dots)75–90 µm in size. An image of the particles used in the measurement of the sediment in A is presented in B.C is a comparison between sediment (solid line) and glass spheres (line with dots) 25–30 µm in size. Notethe narrowing of the scattering pattern and absence of a secondary maximum for the non-spherical naturalparticles (solid lines) compared to polydispersions of spheres sieved similarly (lines with dots). Scatteringmeasurements were performed with the LISST-100 instrument (data courtesy of Briggs-Whitmire and Agrawalat Sequoia Scientific, Inc.).
0 1 2 3 4 5 6 100
101
102
103
104
Scattering angle θ (deg)
β (
θ)
(un
scal
ed)
A
75–90 µm
Glass spheres
Sediment
B
Satluj River sediment
0 1 2 3 4 5 6 100
101
102
103
104
Scattering angle θ (deg)
β (
θ)
(un
scal
ed)
C
25–30 µm100 µm
Glass spheres
Sediment
30

INHERENT OPTICAL PROPERTIES OF NON-SPHERICAL MARINE-LIKE PARTICLES
with the wavelength (e.g., bacteria) have attenuation and scattering biases that are <1. This biasbecomes greater than one as particle size increases (e.g., for microphytoplankton) until it reachesan asymptote: the ratio of the average cross-sectional area of the spheroid to that of an equal-volume sphere (Equation 24), which is always >1. For absorption, the bias generally increases withsize until an asymptotic value is reached, as a randomly oriented spheroidal particle is less ‘pack-aged’ than a sphere.
Backscattering by non-spherical particles is still largely unexplored due to the lack of compu-tational methods covering much of the range of interest (Figures 9B,D, 10B,D, and 12). Thebackscattering bias is, in general, >1 and can be greater by as much as a factor of seven (95% ofthe time in Figure 9B) for specific sizes of phytoplankton-like particles. For particles with a verylarge absorption coefficient (unrealistic for marine particles), an asymptotic value similar to theother IOPs is reached (Herring 2002), suggesting that in general, for particles larger than thewavelength, the backscattering should be more enhanced compared with that of equal-volumespheres. Despite the complexity observed, it seems sensible to conclude that the backscattering ofspheroids is likely to be significantly larger than that of equal-volume spheres for the sizes relevantto phytoplankton (Figure 8G,H). In this respect, shape may be a factor contributing to the inabilityto account for the bulk backscattering coefficient in the ocean, when spheres are used as a modelfor natural particles (e.g., Stramski et al. 2004). Indeed, Morel et al. (2002) used a mixture ofprolate and oblate spheroidal particles (using the T-matrix method) to generate the phase function
Figure 17 Volume concentration (assuming spherical particles) inverted from VSF measurements of thedinoflagellate Ceratium longipes using the Sequoia Scientific LISST-100. The peaks in the size distributioncorrespond to different length scales associated with the individual cell.
0 50 100 150 200
20 µm
2500
0.2
0.4
0.6
0.8
1
1.2
Mean particle diameter (µm)
Vo
lum
e co
nce
ntr
atio
n[
]
µl l
31

WILHELMINA R. CLAVANO, EMMANUEL BOSS & LEE KARP-BOSS
of small phytoplankton-like particles that was more realistic in the backward directions comparedwith that derived from spheres.
For polydispersions of particles with constant or varying shape as a function of size, the biasesin attenuation, absorption and scattering have been found here to be bounded, reaching high values(270%) only for extreme shapes and size distribution parameters but generally being within about50% of that of spheres (Figures 13 and 14). While not as large as for monodispersions, these biasesare significant and most often >1, implying that populations of spherical particles perform poorlyas an average, unbiased model.
Diffraction-based instruments provide an opportunity to measure particle size in situ. Giventhat measurements are made for angular scattering and that inversions from optical measurementsto obtain particle size are based on Mie theory, shape may cause significant biases for the sizingof particles. A population of non-spherical particles will appear, on average, larger (and moredispersed) than a population of equal-volume spheres (Figure 11). In addition, such an inversionwill ‘create’ populations at the tail ends of the size distribution due to the fact that the non-sphericalparticles have no resonance pattern in the near-forward scattering as a function of angle (in contrastto spheres, see Figures 4, 16 and 17; see also Heffels et al. 1996).
Shape is likely to have some effect on optical inversions that are based on Mie theory. In suchinversions, IOPs are used to predict the physical characteristics of the underlying bulk particulatepopulation. For example, the imaginary part of the index of refraction of phytoplankton has beenfound by inverting absorption data using measured size distributions and Mie theory (Bricaud &Morel 1986). Based on the results of this paper, the inverted k is likely to be an overestimate, withthe bias increasing with increasing phytoplankton size and departure from sphericity. Similarly, aninversion of the backscattering ratio was used to obtain the real part of the index of refraction forpopulations of particles with a power-law size distribution, assuming spherical particles (Tward-owski et al. 2001, Boss et al. 2004). Results of this work suggest that a spherical model is likelyto underestimate the index of refraction as deviations from sphericity will enhance the backscat-tering ratio, thus increasing the bias of the inverted index of refraction. Shape effects, on the otherhand, were not found to significantly change the spectral slope of the beam attenuation (Boss etal. 2001) and thus are not likely to significantly affect the inversion of this parameter to obtaininformation on the particulate size distribution. Given the inherent biases associated with usingspheres as models for natural particles, it is sensible to predict that inversions that include non-spherical characteristics should provide an improvement compared to those based on Mie theory.This has been the case in several atmospheric studies (e.g., Dubovik et al. 2002, Zhao et al. 2003,Kocifaj & Horvath 2005).
Shape has important effects on the polarisation of light scattered by marine particles but is atopic which is beyond the focus of this review. Nevertheless, it is one of the future frontiers inocean optics, as currently there is no in situ commercial instrumentation able to measure polarisedscattering. The aquatic community has largely neglected polarisation when studying particulatesuspensions (with a few exceptions, e.g., Quinby-Hunt et al. 2000 and references therein). Studiesby Geller et al. (1985) and Hoovenier et al. (2003) suggest that there is promise in obtaininginformation regarding some aspects of particle shape (e.g., departure from sphericity) by analysingcertain elements of the polarised scattering matrix. For example, theoretical shape indices havebeen derived based on both linear (Kokhanovsky & Jones 2002) and circular (Hu et al. 2003)polarisation measurements. In particular, the latter was found to be less sensitive to multiplescattering. Both were found to be most sensitive at scattering angles in the backward hemisphere.Polarimetry shows promise especially for extreme shapes and larger particles (Macke & Mishchenko1996).
Both organic and inorganic aquatic particles are not randomly distributed among shapes butrather tend to span a limited and non-uniform range of aspect ratios, with spheres being relatively
32

INHERENT OPTICAL PROPERTIES OF NON-SPHERICAL MARINE-LIKE PARTICLES
rare. Given the limited amount of data available regarding shape distributions of natural particles,more measurements of shape parameters are needed; in particular, these are needed as input toimprove inversion models that currently assume spherical particles. Laboratory experimentsdesigned to measure the effects of shape on optical properties and their consistency with thepredictions presented here and elsewhere are also required so that a more complete picture of theeffect of shape on IOPs can be established.
Acknowledgements
We are indebted to J.R.V. Zaneveld, G. Dall’Olmo and H. Gordon for helpful discussions andconstructive comments on earlier drafts of this manuscript; D. Risoviç for the delight in sharingthe pragmatism of representing particle size distributions; Y.C. Agrawal and A. Briggs-Whitmirefor the scattering measurements and pictures of river sediment; G.R. Fournier for insight intoanalytical solutions to ‘the problem’; J.T.O. Kirk for resurrecting the absorption cross section tripleintegral that was done on a hand calculator and M.I. Mishchenko for a lifetime of T-matrix code.This project is supported by the Ocean Optics and Biology programme of the Office of NavalResearch (Contract No. N00014-04-1-0710) to E. Boss and by NASA’s Ocean Biology and Bio-geochemistry research programme (Contract No. NAG5-12393) to L. Karp-Boss.
References
Aas, E. 1984. Influence of shape and structure on light scattering by marine particles, Report series 53. Instituteof Geophysics, University of Oslo, Oslo, Norway.
Aas, E. 1996. Refractive index of phytoplankton derived from its metabolite composition. Journal of PlanktonResearch 18, 2223–2249.
Asano, S. 1979. Light scattering properties of spheroidal particles. Applied Optics 18, 712–723.Asano, S. & Yamamoto, G. 1975. Light scattering by a spheroidal particle. Applied Optics 14, 29–49.Aydin, K. 2000. Centimeter and millimeter wave scattering from nonspherical hydrometeors. In Light Scat-
tering by Nonspherical Particles: Theory, Measurements, and Applications, M.I. Mishchenko et al.(eds). San Diego, California: Academic Press, 451–479.
Baba, J. & Komar, P.D. 1981. Settling velocities of irregular grains at low Reynolds numbers. Journal ofSedimentary Petrology 51, 121–128.
Bickmore, B.R., Nagy, K.L., Sandlin, P.E. & Crater, T.S. 2002. Quantifying surface areas of clays by atomicforce microscopy. American Mineralogist 87, 780–783.
Bohren, C.F. & Huffman, D.R. 1983. Absorption and Scattering of Light by Small Particles. New York: Wiley.Bohren, C.F. & Singham, S.B. 1991. Backscattering by nonspherical particles: a review of methods and
suggested new approaches. Journal of Geophysical Research 96, 5269–5277.Boss, E., Stramski, D., Bergmann, T., Pegau, W.S. & Lewis, M. 2004. Why should we measure optical
backscattering? Oceanography 17, 44–49.Boss, E., Twardowski, M.S. & Herring, S. 2001. The shape of the particulate beam attenuation spectrum and
its relation to the size distribution of oceanic particles. Applied Optics 40, 4885–4893.Bricaud, A. & Morel, A. 1986. Light attenuation and scattering by phytoplankton cells: a theoretical modeling.
Applied Optics 25, 571–580.Carder, K.L., Beardsley, G.F. & Pak, H. 1971. Particle size distributions in the eastern equatorial Pacific.
Journal of Geophysical Research 76, 5070–5077.Carder, K.L., Betzer, P.R. & Eggiman, D.W. 1974. Physical, chemical and optical measures of suspended
particle concentrations: Their intercomparison and application to the west African shelf. In SuspendedSolids in Water, R.J. Gibbs (ed.). New York: Plenum, 173–193.
33

WILHELMINA R. CLAVANO, EMMANUEL BOSS & LEE KARP-BOSS
Cauchy, A.L. 1832. Mémoire sur la rectification des courbes et la quadrature des surfaces courbes. Paris:Académie des Sciences.
Chylek, P., Grams, G.W. & Pinnick, R.G. 1976. Light scattering by irregular randomly oriented particles.Science 193, 480–482.
Dubovik, O., Holben, B.N., Lapyonok, T., Sinyuk, A., Mishchenko, M.I., Yang, P. & Slutsker, I. 2002. Non-spherical aerosol retrieval method employing light scattering by spheroids. Geophysical ResearchLetters 29, 1415–1418.
Duysens, L.M.N. 1956. The flattening of the absorption spectrum of suspensions, as compared to that ofsolutions. Biochimica et Biophysica Acta 19, 1–12.
Fournier, G.R. & Evans, B.T.N. 1991. Approximation to extinction efficiency for randomly oriented spheroids.Applied Optics 30, 2042–2048.
Geller, P.E., Tsuei, T.G. & Barber, P.W. 1985. Information content of the scattering matrix for spheroidalparticles. Applied Optics 24, 2391–2396.
Gordon, H.R. 2006. Backscattering of light from disklike particles: is fine-scale structure or gross morphologymore important? Applied Optics 45, 7166–7173.
Gordon, H.R. & Du, T. 2001. Light scattering by nonspherical particles: application to coccoliths detachedfrom Emiliania huxleyi. Limnology and Oceanography 46, 1438–1454.
Heffels, C.M.G., Verheijen, P.J.T., Heitzmann, D. & Scarlett, B. 1996. Correction of the effect of particleshape on the size distribution measured with a laser diffraction instrument. Particle and ParticleSystems Characterization 13, 271–279.
Herring, S.G. 2002. A systematic survey of the modeled optical properties of nonspherical marine-like particles.MS thesis, Oregon State University, Corvallis, Oregon.
Hillebrand, H., Dürselen, C.-D., Kirschtel, D., Pollingher, U. & Zohary, T. 1999. Biovolume calculation forpelagic and benthic microalgae. Journal of Phycology 35, 403–424.
Hodkinson, J.R. 1963. Light scattering and extinction by irregular particles larger than the wavelength. InElectromagnetic Scattering, M. Kerker (ed.). New York: Macmillan, 87–100.
Hoovenier, J.W., Volten, H., Muñoz, O., van der Zande, W.J. & Waters, L.B.F.M. 2003. Laboratory studies ofscattering matrices for randomly oriented particles: potentials, problems, and perspectives. Journalof Quantitative Spectroscopy and Radiative Transfer 79–80, 741–755.
Hu, Y.-X., Yang, P., Lin, B., Gibson, G. & Hostetler, C. 2003. Discriminating between spherical and non-spherical scatterers with lidar using circular polarization: a theoretical study. Journal of QuantitativeSpectroscopy and Radiative Transfer 79–80, 757–764.
Jerlov, N.G. 1968. Optical Oceanography. Amsterdam: Elsevier.Jerlov, N.G. 1976. Marine Optics. Amsterdam: Elsevier Scientific Publishing Company, Elsevier Oceanogra-
phy Series 14. 2nd edition.Jonasz, M. 1983. Particle-size distributions in the Baltic. Tellus 35B, 346–358.Jonasz, M. 1987a. Nonspherical sediment particles: comparison of size and volume distributions obtained
with an optical and resistive particle counter. Marine Geology 78, 137–142.Jonasz, M. 1987b. Nonsphericity of suspended marine particles and its influence on light scattering. Limnology
and Oceanography 32, 1059–1065.Jonasz, M. 1991. Size, shape, composition, and structure of microparticles from light scattering. In Principles,
Methods, and Application of Particle Size Analysis, J.P.M. Syvitski (ed.). Cambridge: CambridgeUniversity Press, 143–162.
Jonasz, M. & Fournier, G.F. 1996. Approximation of the size distribution of marine particles by a sum of log-normal functions. Limnology and Oceanography 41, 744–754. Errata published 1999, Limnology andOceanography 44, 1358.
Jonasz, M. & Fournier, G. 2007. Light Scattering by Particles in Water: Theoretical and ExperimentalFoundations. Amsterdam: Elsevier Science.
Junge, C.E. 1963. Air Chemistry and Radioactivity. New York: Academic Press.Kadyshevich, Ye. A. 1977. Light-scattering matrices of inshore waters of the Baltic Sea. Izvestiya, Atmospheric
and Oceanic Physics 13, 77–78. Translated by the American Geophysical Union from IzvestiiaAkademii nauk SSSR. Fizika atmosfery i okeana.
34

INHERENT OPTICAL PROPERTIES OF NON-SPHERICAL MARINE-LIKE PARTICLES
Karp-Boss, L. & Jumars, P.A. 1998. Motion of diatom chains in steady shear flow. Limnology and Oceanog-raphy 43, 1767–1773.
Kerker, M. 1969. The Scattering of Light and Other Electromagnetic Radiation. San Diego, California:Academic Press.
Kirk, J.T.O. 1976. A theoretical analysis of the contribution of algal cells to the attenuation of light withinnatural waters. III. Cylindrical and spheroidal cells. New Phytologist 77, 341–358.
Kirk, J.T.O. 1994. Light and Photosynthesis in Aquatic Environments. Cambridge: Cambridge UniversityPress. 2nd edition.
Kitchen, J.C., Zaneveld, J.R.V. & Pak, H. 1982. Effect of particle size distribution and chlorophyll contenton bean attenuation spectra. Applied Optics 21, 3913–3918.
Kocifaj, M. & Horvath, H. 2005. Retrieval of size distribution for urban aerosols using multispectral opticaldata. Journal of Physics: Conference Series 6, 97–102.
Kokhanovsky, A.A. 2003. Optical properties of irregularly shaped particles. Journal of Physics D: AppliedPhysics 36, 915–923.
Kokhanovsky, A.A. & Jones, A.R. 2002. The cross-polarization of light by large non-spherical particles.Journal of Physics D: Applied Physics 35, 1903–1906.
Kokhanovsky, A.A. & Zege, E.P. 1997. Optical properties of aerosol particles: a review of approximateanalytical solutions. Journal of Aerosol Science 28, 1–21.
Komar, P.D. & Reimers, C.E. 1978. Grain shape effects on settling rates. Journal of Geology 86, 193–209.Latimer, P., Brunsting, A., Pyle, B.E. & Moore, C. 1978. Effects of asphericity on single particle scattering.
Applied Optics 17, 3152–3158.MacCallum, I., Cunningham, A. & McKee, D. 2004. The measurement and modelling of light scattering by
phytoplankton cells at narrow forward angles. Journal of Optics A: Pure and Applied Optics 6, 698–702.Macke, A. & Mishchenko, M.I. 1996. Applicability of regular particle shapes in light scattering calculations
for atmospheric ice crystals. Applied Optics 35, 4291–4296.Macke, A., Mishchenko, M.I., Muinonen, K. & Carlson, B.E. 1995. Scattering of light by large nonspherical
particles: ray-tracing approximation versus T-matrix method. Optics Letters 20, 1934–1936.Mie, G. 1908. Beiträge zur Optik trüber Medien, speziell kolloidaler Metallösungen. Annalen der Physik 25,
377–445.Mishchenko, M.I., Hoovenier, J.W. & Travis, L.D. (eds). 2000. Light Scattering by Nonspherical Particles:
Theory, Measurements, and Applications. San Diego, California: Academic Press.Mishchenko, M.I., Travis, L.D. & Lacis, A.A. 2002. Scattering, Absorption and Emission of Light by Small
Particles. New York: Cambridge University Press.Mobley, C.D. 1994. Light and Water: Radiative Transfer in Natural Waters. San Diego, California: Academic Press.Morel, A. 1973. Diffusion de la lumière par les eaux de mer: résultats expérimentaux et approche theorique.
AGARD Lecture Series 61, 3.1.1–3.1.76.Morel, A., Antoine, D. & Gentili, B. 2002. Bidirectional reflectance of oceanic waters: accounting for Raman
emission and varying particle scattering phase function. Applied Optics 41, 6289–6306.Morel, A. & Bricaud, A. 1981. Theoretical results concerning light absorption in a discrete medium, and
application to specific absorption of phytoplankton. Deep-Sea Research 28A, 1375–1393.Paramonov, L.E. 1994a. A simple formula for estimation of the absorption cross section of biological suspen-
sions. Optics and Spectroscopy 77, 506–512. Translated from Optika I Spektroskopiya.Paramonov, L.E. 1994b. On optical equivalence of randomly oriented ellipsoidal and polydisperse spherical
particles. The extinction, scattering and absorption cross sections. Optics and Spectroscopy 77, 589–592.Translated from Optika i Spektroskopiya.
Pozdnyakov, D. & Grassl, H. 2003. Colour of Inland and Coastal Waters: A Methodology for Its Interpretation.Chichester, U.K.: Praxis.
Proctor, T.D. & Barker, D. 1974. The turbidity of suspensions of irregularly shaped diamond particles. Journalof Aerosol Science 5, 91–99.
Proctor, T.D. & Harris, G.W. 1974. The turbidity of suspensions of irregular quartz particles. Journal of AerosolScience 5, 81–90.
35

WILHELMINA R. CLAVANO, EMMANUEL BOSS & LEE KARP-BOSS
Quinby-Hunt, M.S., Hull, P.G. & Hunt, A.J. 2000. Polarized light scattering in the marine environment. InLight Scattering by Nonspherical Particles: Theory, Measurements, and Applications, M.I. Mish-chenko et al. (eds). San Diego, California: Academic Press, 525–554.
Quirantes, A. & Bernard, S. 2004. Light scattering by marine algae: two-layer spherical and nonsphericalmodels. Journal of Quantitative Spectroscopy and Radiative Transfer 89, 311–321.
Quirantes, A. & Bernard, S. 2006. Light-scattering methods for modelling algal particles as a collection ofcoated and/or nonspherical particles. Journal of Quantitative Spectroscopy and Radiative Transfer100, 315–324.
Risoviç, D. 1993. Two-component model of sea particle size distribution. Deep-Sea Research I 40, 1459–1473.Roesler, C.S. & Boss, E. 2007. In situ measurement of the inherent optical properties (IOPs) and potential
for harmful algal bloom detection and coastal ecosystem observations. In Real-Time Coastal ObservingSystems for Ecosystem Dynamics and Harmful Algal Blooms, M. Babin et al. (eds). Paris: UNESCOPublishing, in press.
Sheldon, R.W., Prakash, A. & Sutcliffe, W.H. Jr. 1972. The size distribution of particles in the ocean. Limnologyand Oceanography 17, 327–340.
Shepelevich, N.V., Prostakova, I.V. & Lopatin, V.N. 2001. Light-scattering by optically soft randomly orientedspheroids. Journal of Quantitative Spectroscopy and Radiative Transfer 70, 375–381.
Shifrin, K.S. 1988. Physical Optics of Ocean Water. New York: American Institute of Physics, AIP translationseries. Originally published as Vvedenie v optiku morya 1983.
Siegel, D.A. 1998. Resource competition in a discrete environment: Why are plankton distributions paradox-ical? Limnology and Oceanography 43, 1133–1146.
Stramski, D., Boss, E., Bogucki, D. & Voss, K.J. 2004. The role of seawater constituents in light backscatteringin the ocean. Progress in Oceanography 61, 27–56.
Stramski, D., Bricaud, A. & Morel, A. 2001. Modeling the inherent optical properties of the ocean based onthe detailed comparison of the planktonic community. Applied Optics 40, 2929–2945.
Stramski, D. & Kiefer, D.A. 1991. Light scattering by microorganisms in the open ocean. Progress inOceanography 28, 343–383.
Syvitski, J.P.M., Asprey, K.W. & Leblanc, K.W.G. 1995. In-situ characteristics of particles settling within adeep-water estuary. Deep-Sea Research Part II: Topical Studies in Oceanography 42, 223–256.
Twardowski, M.S., Boss, E., MacDonald, J.B., Pegau, W.S., Barnard, A.H. & Zaneveld, J.R. 2001. A modelfor estimating bulk refractive index from the optical backscattering ratio and the implications forunderstanding particle composition in Case I and Case II waters. Journal of Geophysical Research106, 14129–14142.
Twardowski, M.S., Lewis, M.R., Barnard, A.H. & Zaneveld, J.R. 2005. In-water instrumentation and platformsfor ocean color remote sensing applications. In Remote Sensing of Coastal Aquatic Environments:Technologies, Techniques and Applications, R.L. Miller et al. (eds). Dordrecht: Springer, 69–100.
van de Hulst, H.C. 1981. Light Scattering by Small Particles. New York: Dover.Volten, H., de Haan, J.F., Hoovenier, J.W., Schreurs, R. & Vassen, W. 1998. Laboratory measurements of
angular distributions of light scattered by phytoplankton and silt. Limnology and Oceanography 43,1180–1197.
Voss, K.J. & Fry, E.S. 1984. Measurement of the Mueller matrix for ocean water. Applied Optics 23,4427–4439.
Waterman, P.C. 1971. Symmetry, unitarity, and geometry in electromagnetic scattering. Physical Review D 3,825–839.
Zaneveld, J.R.V., Roach, D.M. & Pak, H. 1974. The determination of the index of refraction distribution ofoceanic particles. Journal of Geophysical Research 79, 4091–4095.
Zhao, T.X.-P., Laszlo, I., Dubovik, O., Holben, B.N., Sapper, J., Tanré, D. & Pietras, C. 2003. A study of theeffect of non-spherical dust particles on the AVHRR aerosol optical thickness retrievals. GeophysicalResearch Letters 30, 1317–1320.
36

INHERENT OPTICAL PROPERTIES OF NON-SPHERICAL MARINE-LIKE PARTICLES
APPENDIX: NOTATION
Notation used following Mobley (1994) closely. The actual units used are given in the text, however,only the dimensions are provided in this table for mass, M, length, L, and time, T, or angularmeasure as indicated.
Symbol Definition Dimension
a Absorption coefficient L–1
b Scattering coefficient L–1
b Backscattering ratio dimensionlessbb Backscattering coefficient L–1
Ca Absorption cross section of a particle L2
Cb Scattering cross section of a particle L2
CbbBackscattering cross section of a particle L2
Cc Attenuation cross section of a particle L2
c Attenuation coefficient L–1
D Particle size represented by diameter of an equal-volume sphere LD0 Reference diameter of size range LE(0) Irradiance at the light source M L–1 T –3
E(R) Irradiance at distance R from the light source M L–1 T –3
f (D) Particulate size distribution # L–4
G Geometrical cross-sectional area of a sphere L2
⟨G⟩ Average geometrical cross-sectional area of a non-sphere L2
I Radiant intensity M L–1 T –3 sr–1
k Imaginary part of the relative index of refraction dimensionlessk Wave number of the incident light L–1
m Complex relative index of refraction dimensionlessN Number of particles per unit volume # L–3
n Real part of the relative index of refraction dimensionlessn0 Number concentration of particles at the reference diameter D0 # L–4
nS Number concentration of small particles # L–4
nL Number concentration of large particles # L–4
Qa Absorption efficiency factor of a particle dimensionlessQb Scattering efficiency factor of a particle dimensionlessQbb
Backscattering efficiency factor of a particle dimensionlessQc Attenuation efficiency factor of a particle dimensionlessR Arbitrary path length of light Ls Rotational axis of a spheroid Ls/t Aspect ratio of a spheroid dimensionlesst Equatorial axis of a spheroid LV Particle volume L3
x Size parameter dimensionlessα* Specific absorption coefficient of a particle L–1
αa Volume-normalised absorption cross section L–1
αb Volume-normalised scattering cross section L–1
αbbVolume-normalised backscattering cross section L–1
αc Volume-normalised attenuation cross section L–1 β(θ) Volume scattering function (VSF) L–1sr–1
β(θ)˜ Volume scattering phase function sr–1
γa Absorption bias dimensionlessγb Scattering bias dimensionless
37

WILHELMINA R. CLAVANO, EMMANUEL BOSS & LEE KARP-BOSS
γbbBackscattering bias dimensionless
γc Attenuation bias dimensionlessθ Scattering angle radians (rad)λ Wavelength of the incident light LµS Small-particle generalised gamma distribution parameter dimensionlessµL Large-particle generalised gamma distribution parameter dimensionlessξ Slope of the power-law size distribution dimensionlessρ Phase shift parameter dimensionlessτS Small-particle generalised gamma distribution parameter L–1
τL Large-particle generalised gamma distribution parameter L–1
υS Small-particle generalised gamma distribution parameter dimensionlessυL Large-particle generalised gamma distribution parameter dimensionlessϕ Azimuth angle radians (rad)Ψ Angular direction into which light is scattered radians (rad)Ω Solid angle into which light is scattered steradians (sr)
Symbol Definition Dimension
38