Inherent optical behavior and structural variation in Na0 ...
5
Inherent optical behavior and structural variation in Na0.5Bi0.5TiO3-6%BaTiO3 revealed by temperature dependent Raman scattering and ultraviolet-visible transmittance T. Huang, Z. G. Hu, G. S. Xu, X. L. Zhang, J. Z. Zhang, and J. H. Chu Citation: Applied Physics Letters 104, 111908 (2014); doi: 10.1063/1.4869309 View online: http://dx.doi.org/10.1063/1.4869309 View Table of Contents: http://scitation.aip.org/content/aip/journal/apl/104/11?ver=pdfcov Published by the AIP Publishing Articles you may be interested in Large strain response based on relaxor-antiferroelectric coherence in Bi0.5Na0.5TiO3–SrTiO3–(K0.5Na0.5)NbO3 solid solutions J. Appl. Phys. 116, 184104 (2014); 10.1063/1.4901549 Structural stability and depolarization of manganese-doped (Bi0.5Na0.5)1− x Ba x TiO3 relaxor ferroelectrics J. Appl. Phys. 116, 154101 (2014); 10.1063/1.4898322 Composition induced structure evolution and large strain response in ternary Bi0.5Na0.5TiO3-Bi0.5K0.5TiO3- SrTiO3 solid solution J. Appl. Phys. 114, 164105 (2013); 10.1063/1.4825122 Origin of large recoverable strain in 0.94(Bi0.5Na0.5)TiO3-0.06BaTiO3 near the ferroelectric-relaxor transition Appl. Phys. Lett. 102, 062902 (2013); 10.1063/1.4790285 Inference of oxygen vacancies in hydrothermal Na0.5Bi0.5TiO3 Appl. Phys. Lett. 101, 142902 (2012); 10.1063/1.4755882 This article is copyrighted as indicated in the article. Reuse of AIP content is subject to the terms at: http://scitation.aip.org/termsconditions. Downloaded to IP: 58.198.191.64 On: Fri, 12 Dec 2014 12:30:15
Transcript of Inherent optical behavior and structural variation in Na0 ...
Inherent optical behavior and structural variation in Na0.5Bi0.5TiO3-6%BaTiO3 revealedby temperature dependent Raman scattering and ultraviolet-visible transmittanceT. Huang, Z. G. Hu, G. S. Xu, X. L. Zhang, J. Z. Zhang, and J. H. Chu Citation: Applied Physics Letters 104, 111908 (2014); doi: 10.1063/1.4869309 View online: http://dx.doi.org/10.1063/1.4869309 View Table of Contents: http://scitation.aip.org/content/aip/journal/apl/104/11?ver=pdfcov Published by the AIP Publishing Articles you may be interested in Large strain response based on relaxor-antiferroelectric coherence inBi0.5Na0.5TiO3–SrTiO3–(K0.5Na0.5)NbO3 solid solutions J. Appl. Phys. 116, 184104 (2014); 10.1063/1.4901549 Structural stability and depolarization of manganese-doped (Bi0.5Na0.5)1− x Ba x TiO3 relaxor ferroelectrics J. Appl. Phys. 116, 154101 (2014); 10.1063/1.4898322 Composition induced structure evolution and large strain response in ternary Bi0.5Na0.5TiO3-Bi0.5K0.5TiO3-SrTiO3 solid solution J. Appl. Phys. 114, 164105 (2013); 10.1063/1.4825122 Origin of large recoverable strain in 0.94(Bi0.5Na0.5)TiO3-0.06BaTiO3 near the ferroelectric-relaxor transition Appl. Phys. Lett. 102, 062902 (2013); 10.1063/1.4790285 Inference of oxygen vacancies in hydrothermal Na0.5Bi0.5TiO3 Appl. Phys. Lett. 101, 142902 (2012); 10.1063/1.4755882
This article is copyrighted as indicated in the article. Reuse of AIP content is subject to the terms at: http://scitation.aip.org/termsconditions. Downloaded to IP:
58.198.191.64 On: Fri, 12 Dec 2014 12:30:15
Inherent optical behavior and structural variation in Na0.5Bi0.5TiO3-6%BaTiO3
revealed by temperature dependent Raman scattering and ultraviolet-visibletransmittance
T. Huang (黄婷),1 Z. G. Hu (胡志高),1,a) G. S. Xu (许桂生),2 X. L. Zhang (张小龙),1
J. Z. Zhang (张金中),1,3 and J. H. Chu (褚君浩)1,31Key Laboratory of Polar Materials and Devices, Ministry of Education, Department of ElectronicEngineering, East China Normal University, Shanghai 200241, China2R&D Center of Synthetic Crystals, Shanghai Institute of Ceramics, Chinese Academy of Sciences,Shanghai 201800, China3National Laboratory for Infrared Physics, Shanghai Institute of Technical Physics, Chinese Academyof Science, Shanghai 200083, China
(Received 26 January 2014; accepted 12 March 2014; published online 20 March 2014)
Optical properties of Na0.5Bi0.5TiO3-6%BaTiO3 (NBT-6%BT) single crystal have been studied by
temperature dependent Raman and ultraviolet-visible spectra from 25 to 180 �C. With increasing
the temperature, the absorption edge approximately decreases from 3.13 to 3.04 eV. Moreover,
abnormal changes of phonon mode and spectral transmission are observed at 83, 106, and 150 �C,which can be unambiguously correlated with thermal evolutions of polar nano-regions and phase
transition. It indicates that there is an inherent relationship between optical behavior and structural
variation of NBT-6%BT, which provides a valid methodology to explore the phase transition of
relaxor ferroelectric oxides.VC 2014 AIP Publishing LLC. [http://dx.doi.org/10.1063/1.4869309]
Bismuth sodium titanate Na0.5Bi0.5TiO3 (NBT), first dis-
covered by Smolenskii et al.,1 adopts complex ABO3 perovskite
with A-site being equally shared by two different cations (Naþ
and Bi3þ). NBT andNBT-based compounds have been regarded
as one of the future generation of environmental-friendly ferro-
electric (FE) materials to replace the widely used lead-based pie-
zoelectrics due to its large remnant polarization and relatively
good piezoelectric properties.2,3 Among these NBT-based solid
solutions, BaTiO3 (BT) modified NBT system, Na0.5Bi0.5 TiO3-
x%BaTiO3 (NBT-x%BT) is the most attractive and promising.
NBT-x%BT emerges as potential lead-free piezoelectric sys-
tems with a rhombohedral (R) to tetragonal (T) phase transition
at morphotropic phase boundary (MPB) of 6< x< 8.3,4 It was
reported that NBT-x%BT near the MPB region exhibits the
highest piezoelectric constants and electric field induced
strains.2 In view of the well established correlation between
enhanced piezoelectric properties and MPB patterns, there is an
increasing emphasis on lead-free ferroelectric MPB systems. As
a result, NBT-6%BT is explored for its unique structure property
as a prototypical bismuth-based piezoceramic in numerous
fundamental studies.5–7 Accordingly, physical properties of
NBT-6%BT material, such as electrical and optical characteris-
tics, should be thoroughly studied for potential device
applications.
As a relaxor ferroelectrics, NBT-x%BT (x is 6 and 11)
has complex domain structures and undergoes a complicated
phase transition sequence.8 Note that the phase diagram of
NBT-x%BT is still uncertain at MPB region from dielectric
and piezoelectric data, especially below 180 �C.6 In general,
NBT-6%BT is considered to be stabilized in a coexistence of
the rhombohedral and tetragonal structure at room tempera-
ture (RT) and over a wide range of temperatures, i.e.,
�150 �C.8,9 Nevertheless, the exact nature of these phases
and the temperature for rhombohedral to tetragonal transition
are still controversial. Recent investigations indicated that
the relaxor state for the BT compositions near the MPB
region coexists from polar nano-regions (PNRs) with tetrag-
onal (P4bm, a0a0cþ in-phase oxygen octahedral tilting10)
and rhombohedral (R3c, a– a– a– anti-phase oxygen octahe-
dral tilting10) symmetries within an average cubic
matrix.5,8,9,11–13 It suggests that phase transition process of
NBT-6%BT system is far away from the clarification and
further investigations, especially optical properties are neces-
sary. This is because optical responses can be directly con-
nected with interband/intraband electronic transitions for
materials studied. Therefore, optical characterizations could
be complementary methodology for discovering phase tran-
sition dynamics of NBT-6%BT relaxor ferroelectrics.
The nondestructive Raman scattering is an advantageous
tool to provide precise information about local distortions
and ionic configurations in the crystal structures.14 Recently,
Raman spectroscopy has been used to study phase transitions
and the nanoscale structural characteristics of NBT-based
solid solutions.6,15–17 However, Raman studies for NBT-
based systems seldom focus on the controversial temperature
range of 25–180 �C. Although dielectric, piezoelectric, ferro-
electric properties, phase transition behavior, and domain
structures of NBT-x%BT single crystals have been exten-
sively studied,2,5,11,18 less attention has been paid to optical
properties, especially temperature dependence of electronic
transitions for NBT-6%BT materials. As the important mac-
roscopic phenomena, optical properties are strongly related
to the electronic structures, which can be essentially deter-
mined by crystal structures.19 Therefore, one can investigate
the phase transition behavior by analyzing electronic band
structures and/or dielectric functions corresponding to the
lattice variation. Furthermore, spectral technique takes
a)Author to whom correspondence should be addressed. Electronic mail:
[email protected]. Tel.: þ86-21-54345150. Fax: þ86-21-54345119.
0003-6951/2014/104(11)/111908/4/$30.00 VC 2014 AIP Publishing LLC104, 111908-1
APPLIED PHYSICS LETTERS 104, 111908 (2014)
This article is copyrighted as indicated in the article. Reuse of AIP content is subject to the terms at: http://scitation.aip.org/termsconditions. Downloaded to IP:
58.198.191.64 On: Fri, 12 Dec 2014 12:30:15
advantages of nondestructive measurement and avoiding
interface effects from electrodes, etc.
In the Letter, Raman and ultraviolet-visible (UV-VIS)
spectra of Na0.5Bi0.5TiO3-6%BaTiO3 (NBT-6%BT) single
crystal have been investigated as a function of temperature
from 25 to 180 �C. The variations from the phonon mode, band
gap, and transmittance have been discussed in detail. The
results reveal an intrinsic relationship between optical behavior
and structural variation of NBT-6%BT single crystal.
Single crystal of NBT-6%BT was grown by Bridgman
method, using the appropriate amount of Na2CO3, Bi2O3,
TiO2, and BaCO3 oxide powders as starting reagents.18 The
obtained crystal was cut perpendicular to the h001i direction.The crystal was double-side polished with a mechanical pol-
ishing process to smooth the surface. Then, the specimen was
cleaned in pure ethanol with an ultrasonic bath and rinsed by
deionized water for several times for spectral measurements.
Note that the specimen has been annealed (�400 �C) after
the mechanical polishing prior to spectral measurements.
The normal-incident transmittance spectra were measured
by a double beam ultraviolet-infrared spectrophotometer
(PerkinElmer UV/VIS Lambda 950) at the wavelength region
of 2650-190 nm (0.5–6.5 eV) with the interval of 2 nm. The
sample was mounted on a heating stage (Bruker A511) for
high temperature experiments from 25 to 180 �C with a reso-
lution of about 0.5 �C.20 Temperature dependent Raman scat-
tering experiments were carried out by a Jobin-Yvon
LabRAM HR 800 micro-Raman spectrometer and a THMSE
600 heating/cooling stage (Linkam Scientific Instruments) in
the temperature range from 25 to 180 �C with a resolution of
0.1 �C. The crystal was excited by the 488 nm line of an Ar
laser at power of �20 mW and recorded in back-scattering ge-
ometry with a resolution of better than 1 cm�1. The laser
beam was focused through a 50� microscope with a working
distance of 18mm. An air-cooled charge coupled device
(CCD) (�70 �C) with a 1024� 256 pixels front illuminated
chip was used to collect the scattered signal dispersed on 1800
grooves/mm grating.14 Note that no mathematical smoothing
has been performed on the experimental data.
Detailed X-ray powder diffraction (XRD) information
about the specimen could refer to the previous work, which
revealed the coexistence of rhombohedral and tetragonal
phase in the measured crystal.18 Note that the diffraction
peak intensity could be related to the domain structure, which
can result in the slight discrepancy on the XRD pattern.
Moreover, the X-ray fluorescence analysis shows that the
actual composition of the crystal is located at about 6% (not
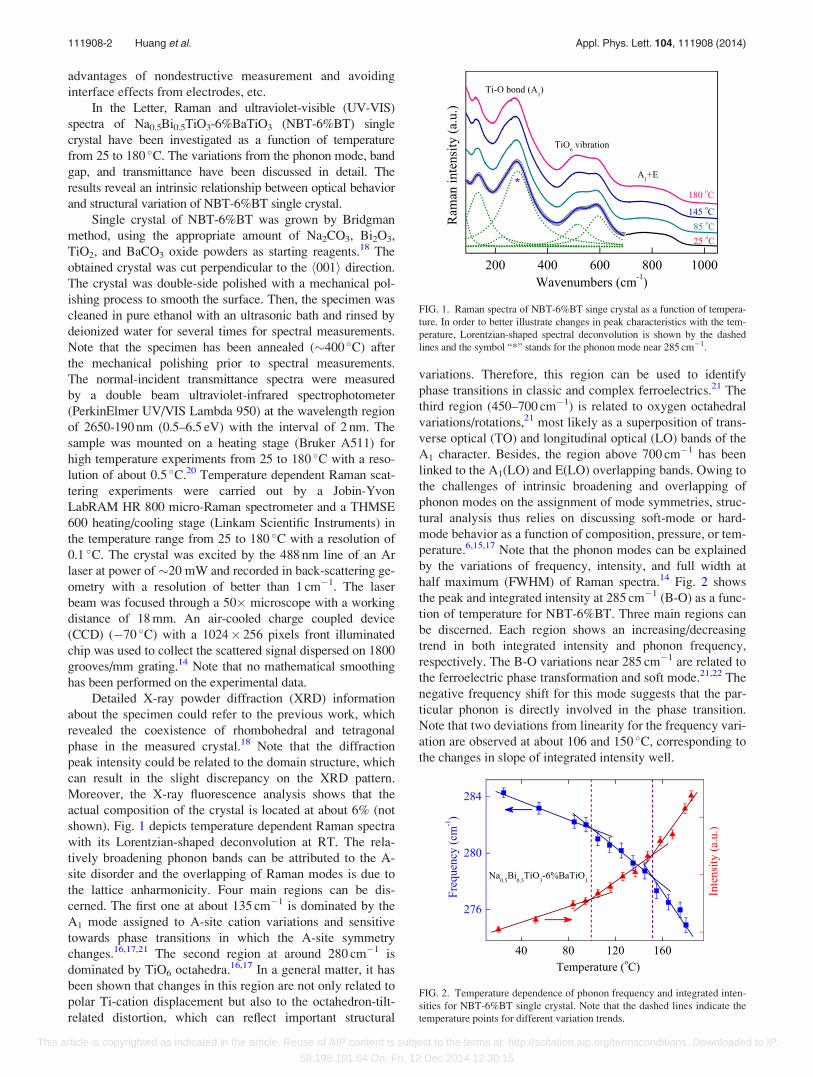
shown). Fig. 1 depicts temperature dependent Raman spectra
with its Lorentzian-shaped deconvolution at RT. The rela-
tively broadening phonon bands can be attributed to the A-
site disorder and the overlapping of Raman modes is due to
the lattice anharmonicity. Four main regions can be dis-
cerned. The first one at about 135 cm�1 is dominated by the
A1 mode assigned to A-site cation variations and sensitive
towards phase transitions in which the A-site symmetry
changes.16,17,21 The second region at around 280 cm�1 is
dominated by TiO6 octahedra.16,17 In a general matter, it has
been shown that changes in this region are not only related to
polar Ti-cation displacement but also to the octahedron-tilt-
related distortion, which can reflect important structural
variations. Therefore, this region can be used to identify
phase transitions in classic and complex ferroelectrics.21 The
third region (450–700 cm�1) is related to oxygen octahedral
variations/rotations,21 most likely as a superposition of trans-
verse optical (TO) and longitudinal optical (LO) bands of the
A1 character. Besides, the region above 700 cm�1 has been
linked to the A1(LO) and E(LO) overlapping bands. Owing to
the challenges of intrinsic broadening and overlapping of
phonon modes on the assignment of mode symmetries, struc-
tural analysis thus relies on discussing soft-mode or hard-
mode behavior as a function of composition, pressure, or tem-
perature.6,15,17 Note that the phonon modes can be explained
by the variations of frequency, intensity, and full width at
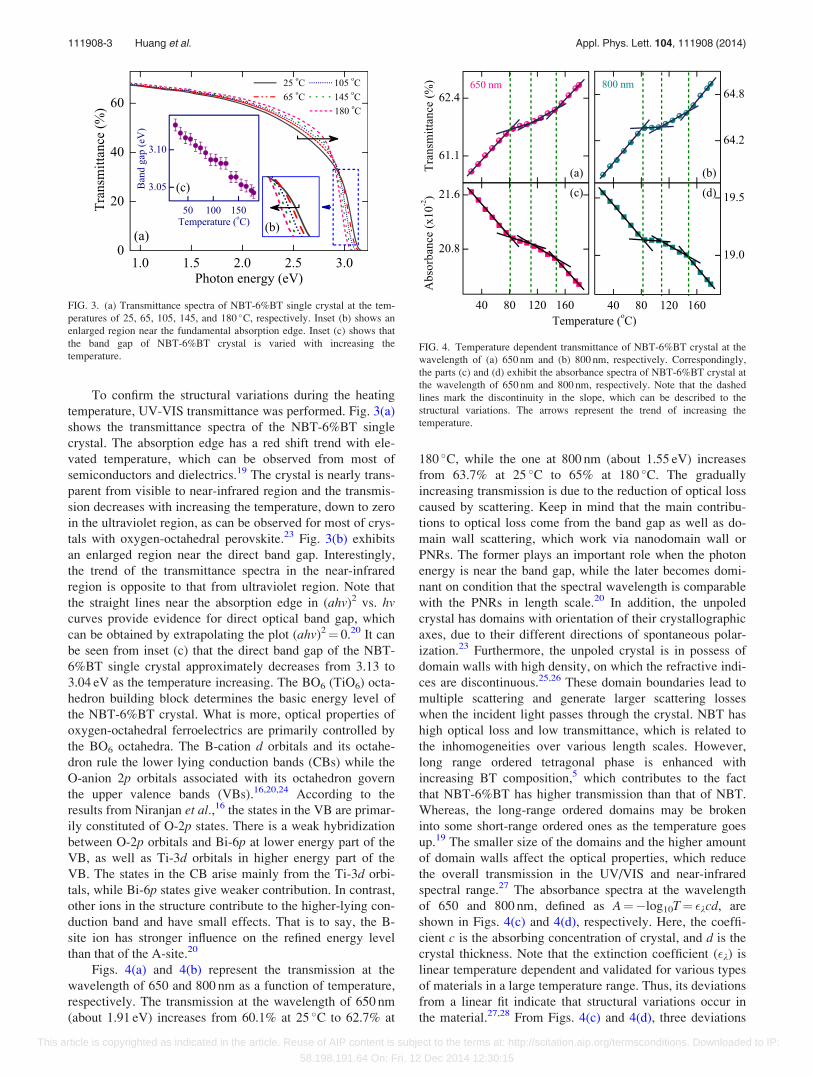
half maximum (FWHM) of Raman spectra.14 Fig. 2 shows
the peak and integrated intensity at 285 cm�1 (B-O) as a func-
tion of temperature for NBT-6%BT. Three main regions can
be discerned. Each region shows an increasing/decreasing
trend in both integrated intensity and phonon frequency,
respectively. The B-O variations near 285 cm�1 are related to
the ferroelectric phase transformation and soft mode.21,22 The
negative frequency shift for this mode suggests that the par-
ticular phonon is directly involved in the phase transition.
Note that two deviations from linearity for the frequency vari-
ation are observed at about 106 and 150 �C, corresponding to
the changes in slope of integrated intensity well.
FIG. 1. Raman spectra of NBT-6%BT singe crystal as a function of tempera-
ture. In order to better illustrate changes in peak characteristics with the tem-
perature, Lorentzian-shaped spectral deconvolution is shown by the dashed
lines and the symbol “*” stands for the phonon mode near 285 cm�1.
FIG. 2. Temperature dependence of phonon frequency and integrated inten-
sities for NBT-6%BT single crystal. Note that the dashed lines indicate the
temperature points for different variation trends.
111908-2 Huang et al. Appl. Phys. Lett. 104, 111908 (2014)
This article is copyrighted as indicated in the article. Reuse of AIP content is subject to the terms at: http://scitation.aip.org/termsconditions. Downloaded to IP:
58.198.191.64 On: Fri, 12 Dec 2014 12:30:15
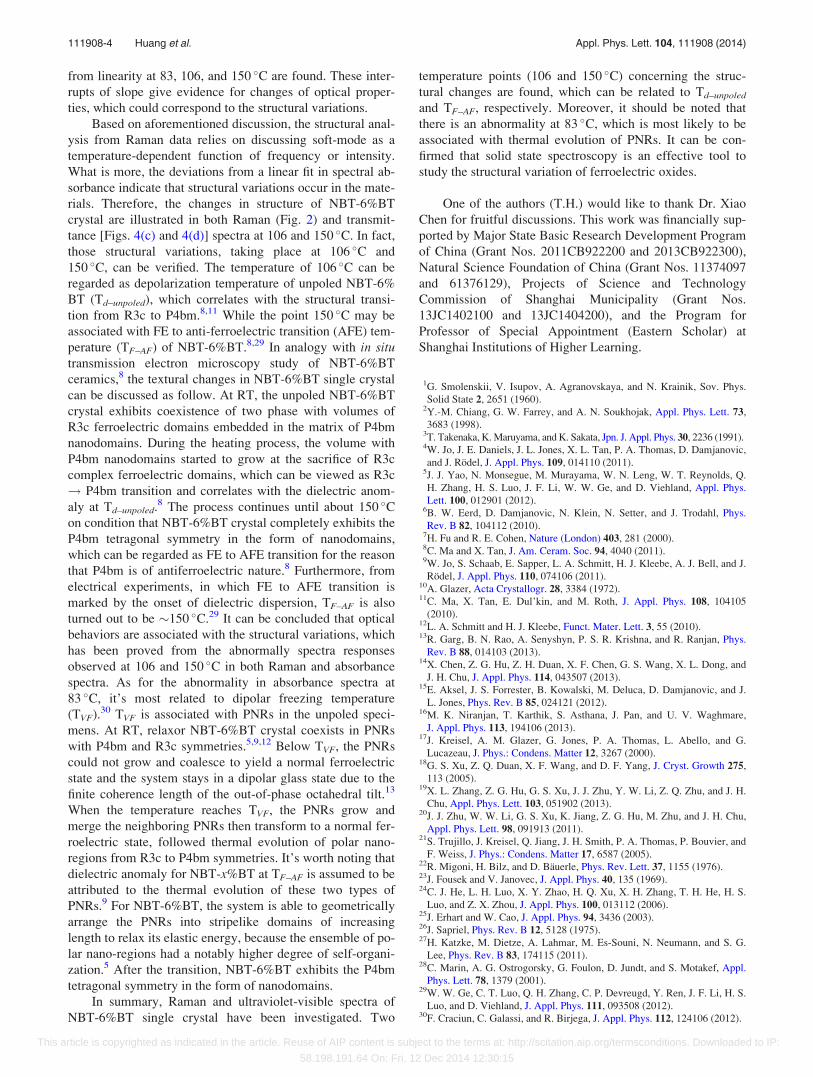
To confirm the structural variations during the heating
temperature, UV-VIS transmittance was performed. Fig. 3(a)
shows the transmittance spectra of the NBT-6%BT single
crystal. The absorption edge has a red shift trend with ele-
vated temperature, which can be observed from most of
semiconductors and dielectrics.19 The crystal is nearly trans-
parent from visible to near-infrared region and the transmis-
sion decreases with increasing the temperature, down to zero
in the ultraviolet region, as can be observed for most of crys-
tals with oxygen-octahedral perovskite.23 Fig. 3(b) exhibits
an enlarged region near the direct band gap. Interestingly,
the trend of the transmittance spectra in the near-infrared
region is opposite to that from ultraviolet region. Note that
the straight lines near the absorption edge in (ahv)2 vs. hvcurves provide evidence for direct optical band gap, which
can be obtained by extrapolating the plot (ahv)2¼ 0.20 It can
be seen from inset (c) that the direct band gap of the NBT-
6%BT single crystal approximately decreases from 3.13 to
3.04 eV as the temperature increasing. The BO6 (TiO6) octa-
hedron building block determines the basic energy level of
the NBT-6%BT crystal. What is more, optical properties of
oxygen-octahedral ferroelectrics are primarily controlled by
the BO6 octahedra. The B-cation d orbitals and its octahe-
dron rule the lower lying conduction bands (CBs) while the
O-anion 2p orbitals associated with its octahedron govern
the upper valence bands (VBs).16,20,24 According to the
results from Niranjan et al.,16 the states in the VB are primar-
ily constituted of O-2p states. There is a weak hybridization
between O-2p orbitals and Bi-6p at lower energy part of the
VB, as well as Ti-3d orbitals in higher energy part of the
VB. The states in the CB arise mainly from the Ti-3d orbi-
tals, while Bi-6p states give weaker contribution. In contrast,
other ions in the structure contribute to the higher-lying con-
duction band and have small effects. That is to say, the B-
site ion has stronger influence on the refined energy level
than that of the A-site.20
Figs. 4(a) and 4(b) represent the transmission at the
wavelength of 650 and 800 nm as a function of temperature,
respectively. The transmission at the wavelength of 650 nm
(about 1.91 eV) increases from 60.1% at 25 �C to 62.7% at
180 �C, while the one at 800 nm (about 1.55 eV) increases
from 63.7% at 25 �C to 65% at 180 �C. The gradually
increasing transmission is due to the reduction of optical loss
caused by scattering. Keep in mind that the main contribu-
tions to optical loss come from the band gap as well as do-
main wall scattering, which work via nanodomain wall or
PNRs. The former plays an important role when the photon
energy is near the band gap, while the later becomes domi-
nant on condition that the spectral wavelength is comparable
with the PNRs in length scale.20 In addition, the unpoled
crystal has domains with orientation of their crystallographic
axes, due to their different directions of spontaneous polar-
ization.23 Furthermore, the unpoled crystal is in possess of
domain walls with high density, on which the refractive indi-
ces are discontinuous.25,26 These domain boundaries lead to
multiple scattering and generate larger scattering losses
when the incident light passes through the crystal. NBT has
high optical loss and low transmittance, which is related to
the inhomogeneities over various length scales. However,
long range ordered tetragonal phase is enhanced with
increasing BT composition,5 which contributes to the fact
that NBT-6%BT has higher transmission than that of NBT.
Whereas, the long-range ordered domains may be broken
into some short-range ordered ones as the temperature goes
up.19 The smaller size of the domains and the higher amount
of domain walls affect the optical properties, which reduce
the overall transmission in the UV/VIS and near-infrared
spectral range.27 The absorbance spectra at the wavelength
of 650 and 800 nm, defined as A¼�log10T¼ �kcd, are
shown in Figs. 4(c) and 4(d), respectively. Here, the coeffi-
cient c is the absorbing concentration of crystal, and d is the
crystal thickness. Note that the extinction coefficient (�k) islinear temperature dependent and validated for various types
of materials in a large temperature range. Thus, its deviations
from a linear fit indicate that structural variations occur in
the material.27,28 From Figs. 4(c) and 4(d), three deviations
FIG. 3. (a) Transmittance spectra of NBT-6%BT single crystal at the tem-
peratures of 25, 65, 105, 145, and 180 �C, respectively. Inset (b) shows anenlarged region near the fundamental absorption edge. Inset (c) shows that
the band gap of NBT-6%BT crystal is varied with increasing the
temperature.FIG. 4. Temperature dependent transmittance of NBT-6%BT crystal at the
wavelength of (a) 650 nm and (b) 800 nm, respectively. Correspondingly,
the parts (c) and (d) exhibit the absorbance spectra of NBT-6%BT crystal at
the wavelength of 650 nm and 800 nm, respectively. Note that the dashed
lines mark the discontinuity in the slope, which can be described to the
structural variations. The arrows represent the trend of increasing the
temperature.
111908-3 Huang et al. Appl. Phys. Lett. 104, 111908 (2014)
This article is copyrighted as indicated in the article. Reuse of AIP content is subject to the terms at: http://scitation.aip.org/termsconditions. Downloaded to IP:
58.198.191.64 On: Fri, 12 Dec 2014 12:30:15
from linearity at 83, 106, and 150 �C are found. These inter-
rupts of slope give evidence for changes of optical proper-
ties, which could correspond to the structural variations.
Based on aforementioned discussion, the structural anal-
ysis from Raman data relies on discussing soft-mode as a
temperature-dependent function of frequency or intensity.
What is more, the deviations from a linear fit in spectral ab-
sorbance indicate that structural variations occur in the mate-
rials. Therefore, the changes in structure of NBT-6%BT
crystal are illustrated in both Raman (Fig. 2) and transmit-
tance [Figs. 4(c) and 4(d)] spectra at 106 and 150 �C. In fact,
those structural variations, taking place at 106 �C and
150 �C, can be verified. The temperature of 106 �C can be
regarded as depolarization temperature of unpoled NBT-6%
BT (Td–unpoled), which correlates with the structural transi-
tion from R3c to P4bm.8,11 While the point 150 �C may be
associated with FE to anti-ferroelectric transition (AFE) tem-
perature (TF–AF) of NBT-6%BT.8,29 In analogy with in situtransmission electron microscopy study of NBT-6%BT
ceramics,8 the textural changes in NBT-6%BT single crystal
can be discussed as follow. At RT, the unpoled NBT-6%BT
crystal exhibits coexistence of two phase with volumes of
R3c ferroelectric domains embedded in the matrix of P4bm
nanodomains. During the heating process, the volume with
P4bm nanodomains started to grow at the sacrifice of R3c
complex ferroelectric domains, which can be viewed as R3c
! P4bm transition and correlates with the dielectric anom-
aly at Td–unpoled.8 The process continues until about 150 �C
on condition that NBT-6%BT crystal completely exhibits the
P4bm tetragonal symmetry in the form of nanodomains,
which can be regarded as FE to AFE transition for the reason
that P4bm is of antiferroelectric nature.8 Furthermore, from
electrical experiments, in which FE to AFE transition is
marked by the onset of dielectric dispersion, TF–AF is also
turned out to be �150 �C.29 It can be concluded that optical
behaviors are associated with the structural variations, which
has been proved from the abnormally spectra responses
observed at 106 and 150 �C in both Raman and absorbance
spectra. As for the abnormality in absorbance spectra at
83 �C, it’s most related to dipolar freezing temperature
(TVF).30 TVF is associated with PNRs in the unpoled speci-
mens. At RT, relaxor NBT-6%BT crystal coexists in PNRs
with P4bm and R3c symmetries.5,9,12 Below TVF, the PNRs
could not grow and coalesce to yield a normal ferroelectric
state and the system stays in a dipolar glass state due to the
finite coherence length of the out-of-phase octahedral tilt.13
When the temperature reaches TVF, the PNRs grow and
merge the neighboring PNRs then transform to a normal fer-
roelectric state, followed thermal evolution of polar nano-
regions from R3c to P4bm symmetries. It’s worth noting that
dielectric anomaly for NBT-x%BT at TF–AF is assumed to be
attributed to the thermal evolution of these two types of
PNRs.9 For NBT-6%BT, the system is able to geometrically
arrange the PNRs into stripelike domains of increasing
length to relax its elastic energy, because the ensemble of po-
lar nano-regions had a notably higher degree of self-organi-
zation.5 After the transition, NBT-6%BT exhibits the P4bm
tetragonal symmetry in the form of nanodomains.
In summary, Raman and ultraviolet-visible spectra of
NBT-6%BT single crystal have been investigated. Two
temperature points (106 and 150 �C) concerning the struc-
tural changes are found, which can be related to Td–unpoled
and TF–AF, respectively. Moreover, it should be noted that
there is an abnormality at 83 �C, which is most likely to be
associated with thermal evolution of PNRs. It can be con-
firmed that solid state spectroscopy is an effective tool to
study the structural variation of ferroelectric oxides.
One of the authors (T.H.) would like to thank Dr. Xiao
Chen for fruitful discussions. This work was financially sup-
ported by Major State Basic Research Development Program
of China (Grant Nos. 2011CB922200 and 2013CB922300),
Natural Science Foundation of China (Grant Nos. 11374097
and 61376129), Projects of Science and Technology
Commission of Shanghai Municipality (Grant Nos.
13JC1402100 and 13JC1404200), and the Program for
Professor of Special Appointment (Eastern Scholar) at
Shanghai Institutions of Higher Learning.
1G. Smolenskii, V. Isupov, A. Agranovskaya, and N. Krainik, Sov. Phys.
Solid State 2, 2651 (1960).2Y.-M. Chiang, G. W. Farrey, and A. N. Soukhojak, Appl. Phys. Lett. 73,3683 (1998).
3T. Takenaka, K.Maruyama, and K. Sakata, Jpn. J. Appl. Phys. 30, 2236 (1991).4W. Jo, J. E. Daniels, J. L. Jones, X. L. Tan, P. A. Thomas, D. Damjanovic,
and J. Rodel, J. Appl. Phys. 109, 014110 (2011).5J. J. Yao, N. Monsegue, M. Murayama, W. N. Leng, W. T. Reynolds, Q.
H. Zhang, H. S. Luo, J. F. Li, W. W. Ge, and D. Viehland, Appl. Phys.
Lett. 100, 012901 (2012).6B. W. Eerd, D. Damjanovic, N. Klein, N. Setter, and J. Trodahl, Phys.
Rev. B 82, 104112 (2010).7H. Fu and R. E. Cohen, Nature (London) 403, 281 (2000).8C. Ma and X. Tan, J. Am. Ceram. Soc. 94, 4040 (2011).9W. Jo, S. Schaab, E. Sapper, L. A. Schmitt, H. J. Kleebe, A. J. Bell, and J.
Rodel, J. Appl. Phys. 110, 074106 (2011).10A. Glazer, Acta Crystallogr. 28, 3384 (1972).11C. Ma, X. Tan, E. Dul’kin, and M. Roth, J. Appl. Phys. 108, 104105(2010).
12L. A. Schmitt and H. J. Kleebe, Funct. Mater. Lett. 3, 55 (2010).13R. Garg, B. N. Rao, A. Senyshyn, P. S. R. Krishna, and R. Ranjan, Phys.
Rev. B 88, 014103 (2013).14X. Chen, Z. G. Hu, Z. H. Duan, X. F. Chen, G. S. Wang, X. L. Dong, and
J. H. Chu, J. Appl. Phys. 114, 043507 (2013).15E. Aksel, J. S. Forrester, B. Kowalski, M. Deluca, D. Damjanovic, and J.
L. Jones, Phys. Rev. B 85, 024121 (2012).16M. K. Niranjan, T. Karthik, S. Asthana, J. Pan, and U. V. Waghmare,
J. Appl. Phys. 113, 194106 (2013).17J. Kreisel, A. M. Glazer, G. Jones, P. A. Thomas, L. Abello, and G.
Lucazeau, J. Phys.: Condens. Matter 12, 3267 (2000).18G. S. Xu, Z. Q. Duan, X. F. Wang, and D. F. Yang, J. Cryst. Growth 275,113 (2005).
19X. L. Zhang, Z. G. Hu, G. S. Xu, J. J. Zhu, Y. W. Li, Z. Q. Zhu, and J. H.
Chu, Appl. Phys. Lett. 103, 051902 (2013).20J. J. Zhu, W. W. Li, G. S. Xu, K. Jiang, Z. G. Hu, M. Zhu, and J. H. Chu,
Appl. Phys. Lett. 98, 091913 (2011).21S. Trujillo, J. Kreisel, Q. Jiang, J. H. Smith, P. A. Thomas, P. Bouvier, and
F. Weiss, J. Phys.: Condens. Matter 17, 6587 (2005).22R. Migoni, H. Bilz, and D. Bauerle, Phys. Rev. Lett. 37, 1155 (1976).23J. Fousek and V. Janovec, J. Appl. Phys. 40, 135 (1969).24C. J. He, L. H. Luo, X. Y. Zhao, H. Q. Xu, X. H. Zhang, T. H. He, H. S.
Luo, and Z. X. Zhou, J. Appl. Phys. 100, 013112 (2006).25J. Erhart and W. Cao, J. Appl. Phys. 94, 3436 (2003).26J. Sapriel, Phys. Rev. B 12, 5128 (1975).27H. Katzke, M. Dietze, A. Lahmar, M. Es-Souni, N. Neumann, and S. G.
Lee, Phys. Rev. B 83, 174115 (2011).28C. Marin, A. G. Ostrogorsky, G. Foulon, D. Jundt, and S. Motakef, Appl.
Phys. Lett. 78, 1379 (2001).29W. W. Ge, C. T. Luo, Q. H. Zhang, C. P. Devreugd, Y. Ren, J. F. Li, H. S.
Luo, and D. Viehland, J. Appl. Phys. 111, 093508 (2012).30F. Craciun, C. Galassi, and R. Birjega, J. Appl. Phys. 112, 124106 (2012).
111908-4 Huang et al. Appl. Phys. Lett. 104, 111908 (2014)
This article is copyrighted as indicated in the article. Reuse of AIP content is subject to the terms at: http://scitation.aip.org/termsconditions. Downloaded to IP:
58.198.191.64 On: Fri, 12 Dec 2014 12:30:15