infrastructure improvements in new haven county - Connecticut
79
INFRASTRUCTURE IMPROVEMENTS IN NEW HAVEN COUNTY POTENTIAL BUILD-OUT STRATEGIES A Dynamic Impact Analysis By Fred V. Carstensen, Director William F. Lott, Director of Research Stan McMillen, Manager, Research Projects Hemanta Shrestha, Senior Research Assistant Nandika Weerasinghe, Senior Research Assistant September 26, 2000 CONNECTICUT CENTER FOR ECONOMIC ANALYSIS ª University of Connecticut 341 Mansfield Road, U-63 Storrs, CT 06269-1063 Voice: 860-486-0485 Fax: 860-486-4463 www.lib.uconn.edu/ccea
Transcript of infrastructure improvements in new haven county - Connecticut

INFRASTRUCTURE IMPROVEMENTSIN NEW HAVEN COUNTY
POTENTIAL BUILD-OUT STRATEGIES
A Dynamic Impact Analysis
By
Fred V. Carstensen, DirectorWilliam F. Lott, Director of Research
Stan McMillen, Manager, Research ProjectsHemanta Shrestha, Senior Research Assistant
Nandika Weerasinghe, Senior Research Assistant
September 26, 2000
CONNECTICUT CENTER FOR ECONOMIC ANALYSIS
University of Connecticut341 Mansfield Road, U-63
Storrs, CT 06269-1063Voice: 860-486-0485 Fax: 860-486-4463
www.lib.uconn.edu/ccea
i
Executive Summary: New Haven Regional Transportation
Improvements and Build-out Scenarios
The Regional Growth Partnership of New Haven has contracted the CCEA to
review the economic impact of various transportation infrastructure improvements and
build-out scenarios in New Haven County, several towns therein and the City of New
Haven. Transportation infrastructure improvements include roadways, airports, seaports
and railways. Specifically, we consider in this report the impact of Amtrak’s high speed
rail service from New York to Boston, enhancements to Metro-North and Shore Line East
rail service, as well as the new Pearl Harbor Memorial Bridge and associated I-95
improvements. These investments total approximately $1.2 billion of which the latter
project represents about 96% of the total investment. Table 1, Chart 1 and subsidiary
tables detail the completed and in process transportation projects in the full report. We
examine the impacts of five build-out scenarios on the New Haven region, New Haven
County and the State.
With respect to air transport, Tweed New Haven Airport is updating its Master
Plan and is seeking additional short haul business traffic. CCEA performed an analysis of
several growth scenarios. By the year 2019, the analysis projects transportation benefits
range from $6,467,635 under the base case scenario, to a high of $25,091,634 under the
no-constraint scenario. Economic benefits range from a low of $57,315,850 under the
base case scenario, to a high of $302,147,331 under the no-constraint scenario in the year
2019. Please see CCEA’s report “Tweed-New Haven Airport: Master Plan Update: An
Economic Evaluation-Phase 1”, November 23, 1999. With respect to waterborne
transport, the Connecticut Coastline Port Authority has proposed several capital
improvements to the Ports of New Haven and Bridgeport. New Haven dominates as
Connecticut’s primary entry point for petroleum products. CCEA performed an analysis of
the hypothetical disappearance of Connecticut’s deepwater ports to assess the impact of
current operations on the State’s economy. Please see CCEA’s report “The Economic
Impact of Connecticut’s Deepwater Ports: An IMPLAN and REMI Analysis”, March 30,
2000.

i i
Many studies have shown that economic growth and development depends heavily
and positively on the growth and quality of the regional transportation infrastructure. As
most of this infrastructure is provided by the public sector, the effects of public investment
in infrastructure expansion and improvement lead to enhancement of private capital
productivity, and, to substitution for private capital as well. This means that public sector
investment obviates some private sector capital investment. The net effect is positive in
general.
An efficient transportation infrastructure not only facilitates economic growth, it
influences business location decisions. Firms can reach their output markets at lower cost
and their workers enjoy lower transportation costs. Workers in efficient transportation
environments may not require premiums that compensate them for lost time, increased fuel
consumption and incidence of accidents, as well as reduced air quality, to induce them to
commute to work.
Intermodal transportation is important in firm and worker location as well. Road
and rail transport are complementary modes in their movement of goods, services and
workers to and from firms. Air and water transport further facilitates movement of people
and bulk goods. Efficient transportation reduces costs for employers and workers and is
complementary to the production process of firms and adds to the amenity value of
households in the region.
The high-speed train (HST) first introduced in Japan in 1964 and subsequently in
France in 1981 has acted as an engine of growth in these countries. Several other
European countries have implemented HST with similar positive results. There are
several U.S. proposals for HST, but only Amtrak’s Acela from Washington to Boston is in
operation albeit without all new equipment and complete schedules. HST primarily moves
people not cargo. The character of each country’s implementation depends on its
topography, and, to a large extent, on the distribution and density of its population centers.
HST offers reduced travel times, increased amenities that lead to increased ridership for

i i i
medium and short haul operations (50-100 miles between stations). The immediate
consequence is a reduction in highway traffic and some diversion from air traffic. HST
also induces new travelers to ride the system.
Among several other studies described in the report, one by Nakamura and Udea
(1989) compares the economic effects of HST and expressways on per capita income,
employment in retail, and, information industry growth. They show that per capita income
increased by 2.6% due to HST station location effects, 6.4% due to expressway effects,
and, 9.5% due to combined effects. Similarly, total employment rose by 0.4% due to HST
station location effects, 1.2% due to expressway effects, and, 2.8% due to combined
effects. Employment growth in the information industry sector increased by 22% for the
combined HST station location and expressway effects and 7% for expressways only
(Haynes, 1997).
Firms’ profitability directly depends on their proximity and accessibility to their
input (labor, materials and intermediate goods and services) and output (goods and
services) markets. A location such as New Haven with good access to road, rail, air and
sea transport modes, and with over 100 million people within a 150-mile radius, is posed
for significant economic growth. HST provides a crucial linkage in this transportation
network that is likely to attract and retain businesses in the region. We expect travel time-
sensitive, and service industries to be attracted to the region, as well as to see growth in
the retail and wholesale sectors. Travel and tourism will benefit, but with mixed results as
reduced travel times mean fewer overnight stays. Land values in HST station locations are
likely to increase, as are the tax proceeds that result from increased economic activity in
the region. There would be reductions in highway and air travel resulting in lower fuel
consumption and concomitant taxes. HST is likely to increase the amenity value of a
region because of the reductions in airport wait time, roadway congestion, pollution and
accidents. Thus any reductions in highway and air travel are likely to be offset by new
economic activity and migrants. Hagiwara (1982) finds that HST is “a system that joins
smaller communities to larger communities, rather than the reverse,” and thereby improves
the welfare of the former. In this context, the New Haven region benefits more than the

iv
New York metropolitan area.
HST thus binds together cities and creates a new region formed like a string of
pearls. Haynes (1997) calls this a functional region. Such a band of cities connected by
HST, highways, airports, and, seaports is expected to have a higher competitive advantage
over more isolated (less accessible) regions. These advantages accrue to firms and
workers alike. Firms can recruit labor in wider circles with more suitable competency
profiles. Workers can supply their labor in a larger geography. Firms enjoy greater
contact with other firms, suppliers and customers. Thus, an efficient transportation
network contributes to an agglomeration or clustering effect leading to increased efficiency
(profitability) and economic growth. This is the emerging scenario in the biotech industry
that is clustering in the Northeast corridor. Other clusters include arts and entertainment,
photonics, microelectronics, software and telecommunications. Some of the best
educational and research facilities in the world lie in this corridor from Washington D.C.
to Boston, MA.
The HST is one of several transportation infrastructure improvements in the region.
Metro-North and Shore Line East are improving service and accessibility as well with
new stations and parking facilities. The Pearl Harbor Memorial Bridge and the I-95
approaches are being widened. There are capital improvements planned for the port of
New Haven that will bring rail service closer to the docks. Tweed-New Haven Airport
plans safety improvements and other site improvements in its ongoing efforts to its increase
commuter and short-haul air traffic. Temporally following these infrastructure
improvements, five build-out scenarios are analyzed for their economic impact on the
region and fifteen towns in the Regional Growth Partnership (RGP).
The first three scenarios are scaled replicas of each other. These are the maximum,
moderate, and, minimum build-out cases in which three-, two-, and, one-story labs and
offices respectively are built on 40% of the land likely developable based on RGP
estimates. These in turn are based on input from the towns in the Partnership. The fourth
scenario extrapolates the “current office space growth trend” over the last five years, that
v
is, a 1.92% average annual growth rate from 1994-1999. The same proportion of lab
(40%) and office (60%) is used as in the first three scenarios. The last scenario, “new 2.5
million square feet of lab space” builds just that over five years commencing in 2001 (they
all begin in 2001). In the first three scenarios, construction lasts ten years and employment
ramps up in 2011 for ten years. Employment in the second scenario ramps up over ten
years commencing in 2003. Employment in the last scenario ramps up over five years
commencing in 2003. In each scenario we include the construction of a 700-room hotel
and a 200,000 square foot convention center.
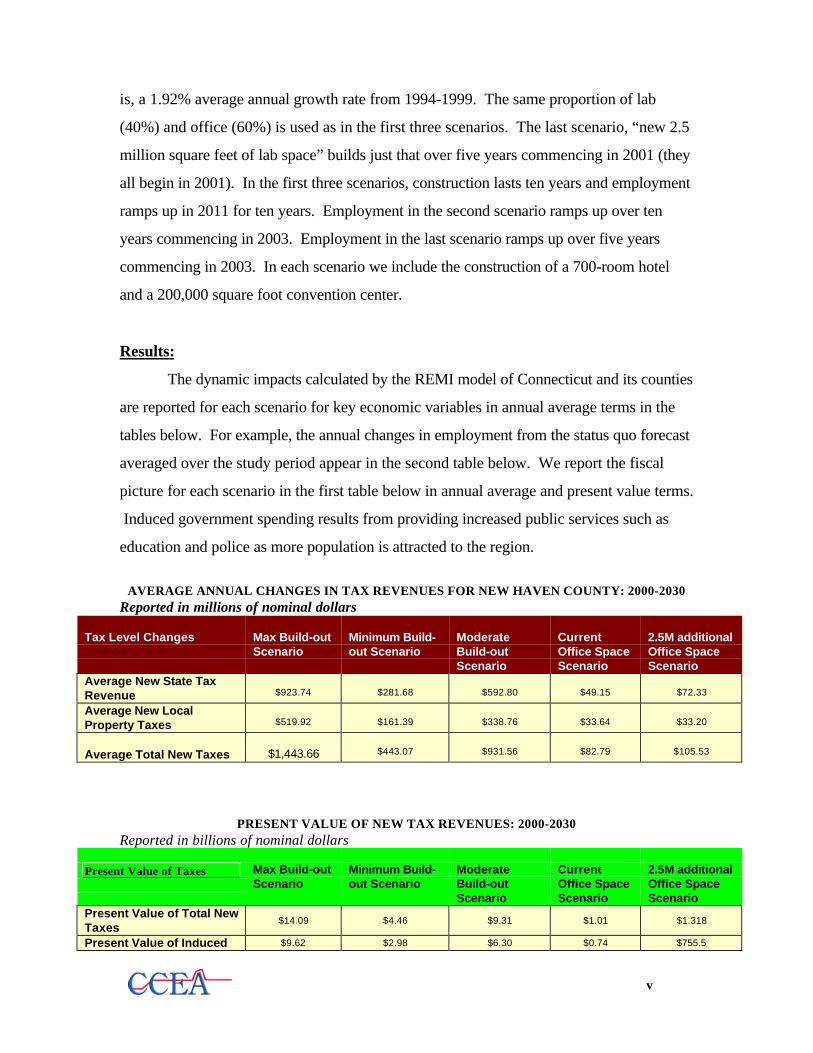
Results:
The dynamic impacts calculated by the REMI model of Connecticut and its counties
are reported for each scenario for key economic variables in annual average terms in the
tables below. For example, the annual changes in employment from the status quo forecast
averaged over the study period appear in the second table below. We report the fiscal
picture for each scenario in the first table below in annual average and present value terms.
Induced government spending results from providing increased public services such as
education and police as more population is attracted to the region.
AVERAGE ANNUAL CHANGES IN TAX REVENUES FOR NEW HAVEN COUNTY: 2000-2030Reported in millions of nominal dollars
Tax Level Changes Max Build-outScenario
Minimum Build-out Scenario
ModerateBuild-outScenario
CurrentOffice SpaceScenario
2.5M additionalOffice SpaceScenario
Average New State TaxRevenue $923.74 $281.68 $592.80 $49.15 $72.33
Average New LocalProperty Taxes $519.92 $161.39 $338.76 $33.64 $33.20
Average Total New Taxes $1,443.66 $443.07 $931.56 $82.79 $105.53
PRESENT VALUE OF NEW TAX REVENUES: 2000-2030Reported in billions of nominal dollars
Present Value of Taxes Max Build-outScenario
Minimum Build-out Scenario
ModerateBuild-outScenario
CurrentOffice SpaceScenario
2.5M additionalOffice SpaceScenario
Present Value of Total NewTaxes
$14.09 $4.46 $9.31 $1.01 $1.318
Present Value of Induced $9.62 $2.98 $6.30 $0.74 $755.5

vi
New govt. SpendingPresent Value of Net NewTaxes $4.47 $1.49 $3.02 $0.27 $562.3
CHANGES IN KEY ECONOMIC VARIABLES FOR NEW HAVEN COUNTY:2000-2030
Maximum Build-out Scenario
Minimum Build-outScenario
Moderate Build-out Scenario
Current OfficeSpace Scenario
2.5M additionalOffice SpaceScenario
Tax LevelChanges
ChangeinLevels
(%)Change
ChangeinLevels
(%)Change
ChangeinLevels
(%)Change
ChangeinLevels
(%)Change
ChangeinLevels
(%)Change
Employment(Thousands)
145.01 28.70% 47.77 9.46% 96.63 19.13% 9.75 0.123% 10.72 0.205%GRP(Billion Nominal $)
$20.28 28.47% $6.21 9.12% $13.04 18.71% $1.06 0.087% $1.89 0.151%Personal Income(Billion Nominal $)
$15.86 25.82% $4.81 7.88% $10.16 16.56% $0.86 0.171% $0.97 0.244%Population(Thousands)
163.73 18.84% 51.14 5.89% 106.80 12.29% 11.84 0.134% 11.93 0.196%Future HousingDemand(Billion Nominal $) $6.58 0.72% $1.95 0.22% $4.24 4.34% $0.27 0.031% $0.30 0.04%
Spillover Effects:
We estimate the effects of the increased economic activity in each scenario in eight
neighboring towns based on their commuter share in New Haven and weighted by per
capita income in each town. The moderate build-out scenario results are presented in the
table below as perhaps the most illustrative.

vii
Table 3: Net Changes in Selected Economic VariablesModerate Build-out Scenario
Average Change over Baseline (2000-2030)
New HavenLocal
Hamden WestHaven
EastHaven
NorthHaven
Branford Guilford Wallingford Milford
Employment
(Thousands)
3.4298 1.2048 0.7129 0.5209 0.3156 0.6721 0.4073 0.2546 0.2232
GRP
(Bill. Nom $)
0.4628 0.1626 0.0962 0.0703 0.0426 0.0907 0.0550 0.0344 0.0301
Personal Income
(Bill. Nom $)
0.3605 0.1266 0.0749 0.0548 0.0332 0.0706 0.0428 0.0268 0.0235
Population
(Thousands)
3.7910 1.3316 0.7880 0.5758 0.3488 0.7428 0.4502 0.2814 0.2467
Housing Demand
(Bill Nom $)
0.1503 0.0528 0.0312 0.0228 0.0138 0.0295 0.0179 0.0112 0.0098
Rail Ridership Effects:
We estimated short and long run changes in ridership on Metro-North, Shore Line
East and Amtrak based on Amtrak, Shore Line East and Metro-North changes planned for
the frequency of trains, speed and fare. Based on Voith (1995), we estimated the
elasticities of ridership with respect to frequency, speed and fare. The table below
presents the long run results (short run results are described in the report body).

viii
LONG RUN Ridership Forecast
VariablesElasticity Current
LevelProjectedChange
(%)
CurrentRidership
Level
ProjectedRidership
Level
ProjectedChange inRidership
(%)SHORE LINE EASTNo. of Trains(Units) 0.317 8 10 (25%)Speed (MPH) 0.212 50 55 (10%)Round Trip Fare -1.02 $ 7.75 $7.98 (3%)
272,624 291,713 + 7%
METRO-NORTHNo. of Trains(Units) 0.317 244 260 (6.5%)Speed (MPH) 0.212 80 90 (12.5%)Round Trip Fare -1.02 $22.5 $23.20 (3%)
35,000,000 35,587,214 + 1.6%
AMTRAKNo. of Trains(Units) 0.317 9 17 (89%)Speed (MPH) 0.212 80 120 (50%)Round Trip Fare -1.02 NA 3%
884,860 1,201,642 +35.8%
The estimates of increased train ridership above are based on the improvements to
rail service in New Haven County without respect of the build-out scenarios. The
ridership estimates in the table below account for increases in employment that result from
the five build-out scenarios. In each case, ridership is assumed to increase in proportion to
the increases in employment. The baseline is the long-run projected ridership level that
results from the enhanced rail service listed in the table above.

ix
Rail Ridership Consequences of Build-out Scenarios
Maximum Build- outScenario
Minimum Build-outScenario
Moderate Build-outScenario
Current OfficeSpace Scenario
2.5M additional OfficeSpace Scenario
Rail ServiceProvider(BaselineRidership)
%Change
ProjectedRidership
%Change
ProjectedRidership
%Change
ProjectedRidership
%Change
ProjectedRidership
%Change
ProjectedRidership
Shore LineEast(291,713) 28.70% 375,435 9.46% 319,309 19.13% 347,518 0.123% 292,072 0.205% 292,311Metro-North
(35,587,214) 28.70% 45,800,744 9.46% 38,953,764 19.13% 42,395,048 0.123% 35,630,986 0.205% 35,660,168Amtrak
(1,201,642) 28.70% 1,546,513 9.46% 1,315,317 19.13% 1,431,516 0.123% 1,203,120 0.205% 1,204,105
Conclusion
The City of New Haven and New Haven County are poised for an economic boom.
The unlocking of the human genome code will accelerate the growth of the biotech
industry. Yale University has been helping to locate biotech firms to the greater New
Haven area to participate with Yale in developing new drug therapies. A vibrant biotech
cluster already stretches from Baltimore to Boston. Connecticut can be a prime location
for growth in this cluster because of our highly educated and productive workforce,
relatively uncongested coastline, and, a cluster of some of the best institutions of higher
education in the country. In addition, the photonics, microelectronics and software industry
clusters are growing in the tri-state region. Connecticut has much to offer and New Haven
can lead the way with sensible office and laboratory development supported by adequate
hotel and convention space, and, infrastructure development. This report has not dealt with
communication infrastructure, but in the new economy, transportation infrastructure
development must be complemented by communication infrastructure development.
Policies to support these developments will ensure Connecticut’s leadership in the new
economy as its precision manufacturing capabilities have in the past.

x
Table of Contents
Executive Summary i
Table of Contents x
Literature Review 1
Infrastructure and Economic Development 1
Transportation Infrastructure, Economic Development
and Industrial Location 4
The High Speed Train: A Major Transportation
Infrastructure Of The 21st Century 10
France: TGV 11
Japan: Shinkansen 12
Germany: ICE 12
Italy: Direttissima 13
Spain: AVE 13
The Economic Impacts Of High-Speed Train: Past
Experience And Future Potential 14
Impacts on Employment, Production, and Population 14
Types of Business Stimulated by HST 16
Service Industries 17
Travel and Tourism Industry 17
Real Estate Market 18
Impact on Tax Revenues 19
Impact on Amenity Values 19
Diverted Travelers and Induced Travelers 20
Potential Urban Redevelopment, and Revitalization 21
Potential Urban Redevelopment, and Revitalization 22
Relocation of Firms and Economic Growth 22

xi
Improved Accessibility and Economic Growth 23
Prospect of HST in Northeast Corridor 24
Prospects for Greater New Haven 25
Transportation Sector Improvements in New Haven County:
An Economic Impact And Build-Out Analysis 26
Phase I: Infrastructure Construction Phase 27
Phase II: Potential Expansion Phase 29
Methodology 33
Results 34
Spillover Effects Of Infrastructure Developments
In New Haven Region 49
Impact Of Enhanced Rail Service On Train Ridership 52
Assumptions 52
Impact Of Enhanced Rail Service And Build-Out Scenarios
On Train Ridership In New Haven County 56
Transportation And Local Economic Development 58
Princeton Corridor Economic Development 59
Conclusions 61
Appendix 62
References 63

1
TRANSPORTATION INFRASTRUCTURE AND ECONOMIC DEVELOPMENT:
POTENTIAL ECONOMIC IMPACT OF HIGH SPEED RAIL ON A REGIONAL
ECONOMY
A Literature Review
Objective
This literature review provides regional development specialists some insight and
intuition about the role of infrastructure development in regional economic growth. It
explores earlier studies measuring the relationship between infrastructure development and
economic growth. This literature review focuses specifically on the role of transportation
infrastructure on the economic growth of a region. The first part of the literature review
discusses the significance of public investment in infrastructure in general and provides
some empirical evidence on infrastructure development and economic growth. This part
discusses transportation infrastructure and its potential impact on the location decision of
firms. Continuing the discussion of transportation infrastructure, the second part
specifically focuses on the economic impact of high-speed rail transport in a regional
economy.
INFRASTRUCTURE AND ECONOMIC DEVELOPMENT
There is no doubt that infrastructure is the most crucial part of economic growth,
without which economic development effort is virtually impossible. Nearly two-thirds of
non-military public capital consists of “core infrastructure” which includes highways,
airports, and mass transit facilities, electric gas plants, water supply facilities, sewers,
schools, hospitals, police and fire stations, courthouses, garages and passenger terminals.
Currently, in the United States, about 90% of infrastructure capital is owned by state and
local governments, although much of this was financed with federal intergovernment grants
(Arsen, 1997).
The investment in infrastructure is a major input to regional economic growth. The
investment decision by state and local governments to improve existing and provide new
infrastructure should not be based only on their direct costs and benefits. In fact, the

2
indirect benefits of infrastructure may be significantly high enough to justify any investment
decisions on infrastructure by local and state government. Infrastructure can largely
contribute to economic growth by inducing different kinds of private investments in the
region that are directly or indirectly related to infrastructure. The economic significance of
infrastructure should not be measured by its immediate impact on the local economy.
Rather, it should be evaluated by measuring its ability to stimulate private investment and
to affect the decisions of households and firms. Arsen (1997) appropriately argues:
“the economic significance of infrastructure investment lies not so much in the stock
of physical capital per se as in the flow of services it provides to households and firms.
Conceptually, it is the amount of services that affects decisions, represented, for instance,
as a variable in an individual’s utility function or a firm’s production function.”
Several studies suggest that public investment in infrastructure has a positive and
significant impact on economic growth, and the total output and total productivity of a
region. Two researchers, namely, David Aschauer and Alicia Munnell have made
significant contributions to the literature on measuring the role of infrastructure on
economic growth. Aschauer (1989) did the first major evaluation of the impact of public
capital investment on economic performance. He argues that there is a shortfall substantial
enough to justify a significant expansion of government investment in infrastructure in the
United States. His study shows that investment in infrastructure was not only an important
determinant of economic development but also that a decline in infrastructure stock relative
to GNP was a primary cause of the disappointing downward shift in the nation’s long run
productivity trajectory after the early 1970s. In his earlier study, by adding public capital
to the conventional production function and using aggregate time-series, Aschauer (1989)
concludes that each additional $1 of public sector investment would yield approximately
60 cents in additional output for the economy. In a follow-up study he concludes
“increases in GNP resulting from increased public infrastructure spending are estimated to
exceed those from private investment by a factor of between two and five” (Aschauer,
1990, p.16).
Munnell (1990) examines the relationship between public capital and measures of
economic activity at the state level using estimates of private and public capital stocks for
each state. She finds that public capital has a positive impact on output, investment and

3
employment growth at the state level, though the magnitudes of these effects are
considerably smaller than at the national level, roughly half the estimate at the national
level. Her study includes an examination of the relationship between public and private
investment, where public capital can enhance the productivity of private capital but can
also act as a substitute for it, or it “crowds out” private capital. Her results suggest that in
general, the net effect is positive; that public investment stimulates private investment.
Munnell’s (1990) empirical work also indicates that those states that have invested more in
infrastructure tend to have greater output, more private investment, and more employment
growth.
Other than output and employment, infrastructure is likely to contribute to economic
growth and social welfare through increases in productivity and efficiency. Increases in
productivity not only lead to economic growth, but also improve the standard of living and
overall welfare by increasing real wages. Several studies have attempted to examine the
relation between public investment and productivity per worker. Ashchauer (1989) also
examines the relation between the stock of public infrastructure as well as the stock of
private capital and productivity in the private sector. His results show that there is a
strong relationship between output per unit of private capital and the stock of public
capital.
Aschauer (1989) finds a strong relationship between output per unit of private
capital and the stock of public capital. He also finds a statistically significant relationship
between the level of productivity and the stock of non-military capital.
From a production function that includes public as well as private capital, Munnell
(1990) calculates multifactor productivity of private non-farm business sector for the
period 1948-1987. She finds a 1.4 percentage point decline in labor productivity during
the period 1948-69 and 1969-1987. However, she finds that only 0.3 percent can be
attributed to slower productivity growth and 1.1 percent is due to the decline in the rate of
growth in the public capital-labor ratio.
Eberts (1986, 1988), Eberts and Fogarty (1987), and Duffy-Deno and Eberts
(1989) examine the relationship between public capital and productivity using data for
metropolitan areas. They consistently find that public capital has a positive impact on
output but it is much smaller than that from private capital and labor. More recent studies
seem to confirm this: Harmatuck (1996), for example, finds that the change in output due to

4
a unit change in infrastructure investment is 0.03, compared to the 0.3-0.6 range found in
earlier studies. Among other regional studies, Garcia-Milla and McGuire (1992) results
suggest that public capital has a positive impact on state- or metropolitan-level output,
investment, and employment growth. Similarly, Morrison and Schwartz (1996) use data on
the manufacturing sectors of the 48 contiguous states in the United States to estimate the
relation between state infrastructure and productivity of manufacturing firms. They use
state level data on the quantities and prices of output, non-production and production labor,
energy, and private and public capital inputs for 1970-1987. Their results indicate that the
return to infrastructure investment is positive and significant.
We next focus on transportation infrastructure rather than infrastructure in general,
and its impact on the location decisions of firms.
Transportation Infrastructure, Economic Development and Industrial Location
The transportation system is the most crucial infrastructure component from an
economic development point of view. The transportation system contributes not only to the
growth of any particular sector but it has large multiplier effects on almost all sectors of
the economy. As a result, regional planners are more interested in transportation
infrastructure investment and its impact on regional economy than any other type of
infrastructures.
Broadly speaking, there are two major approaches to estimate the impact of
investments in transportation systems on the economic performance of a region. One is to
treat infrastructure as input in a firm’s production function, alongside inputs such as labor
and private capital, and see if improvements in infrastructure increase the firm’s output.
The other is to look at the effects of infrastructure on the firm’s cost functions, to see if such
improvements reduce its costs. There are several studies that attempt to evaluate the
significance of transportation in a regional economy.
Fox (1990) presents a general regional model where transportation infrastructure
affects output through three channels. First, it can directly increase a firm’s output as an
input to its production process. Second, it can allow other inputs to be more productive.
Third, it may attract inputs from other regions. Building transportation infrastructure
therefore increases the demand for inputs and enhances multiplier effects in the economy.

5
Greater output in turn encourages more infrastructure investment as congestion occurs.
A 1992 study for the Federal Highway Administration (FHWA) extensively
explores the indirect effects of public infrastructure investment. The primary purpose of
this study was to evaluate the importance of transportation on the productivity of certain
sectors of the economy. Using data from 226 manufacturing firms for the period 1969-86,
the study looks at the net effects on these firms and the sources of their savings in costs. It
finds three main sources of cost savings that arise from development of the transportation
system. First, more frequent and reliable delivery lowered inventory costs. Second,
access to wider markets meant economies of scale. Third, more frequent deliveries from
plants to retailers reduced the need for warehousing operations. One major finding was
that the net effects of cost savings grew smaller over time, indicating diminishing returns to
scale.
Despite the fact that infrastructure facilitates economic growth, local economic
development specialists may be more interested in the linkage between infrastructure and
business location rather than overall economic growth. Transportation is one of the major
factors that can largely determine the location decisions of firms. An efficient
transportation system may significantly increase the competitiveness of a region relative to
other regions in terms of quality of life for the workers, households and firms. Depending
on other public policies, better transportation infrastructure further facilitates to create a
favorable business climate for firms in the region. Consequently, it can affect the location
decision of firms and workers in several ways.
Better infrastructure is likely to enhance the amenity value of a region that in turn
makes the region more attractive to firms and households. These amenities manifested in
reduced travel time and costs may include an efficient transportation system such as a good
highway system, airports, railroad and mass transit, public parks, and, recreational
facilities in the region. An efficient transportation infrastructure may attract firms to
regions which provide the highest rate of return and which have lower production costs.
The reduction in production costs of firms may arise from reduced transportation costs as
well as reduced labor costs. Similarly, firms may not have to offer premiums to workers.
Empirically, Beeson and Eberts (1987), show that wages are lower in areas that have a
large bundle of amenities and a good transportation system.
Some studies also attempt to measure the relationship between firm locational

6
choice and amenity factors. While evaluating the firms’s location decisions, amenity
factors are often ignored as they are assumed to attract only workers but not firms.
However, Gottlieb (1995) argues that amenities not only attract workers but also attract
firms. Using a sample of municipalities in northern New Jersey in a firm location model,
Gottlieb (1995) argues that firms evaluate business factors as well as certain amenities
with respect to the likely residential location of their employees. His study finds that
amenities such as better transportation infrastructure, traffic congestion, public education,
crime, recreation and public services is significantly related with employment in SIC
category 87, engineering and management services.
If regional development specialists are to increase the comparative advantage of a
region relative to other regions, they should focus on policies that make the region a
profitable location for firms. Arsen (1997) argues that for a site advantage for business
location, a region must either provide distinctive and attractive services or, more likely,
offer standard public-capital services. In other words, regional development specialists
should focus on policies that lower costs of doing business in the region. These policies
may include investment in transportation infrastructure, subsidizing firms, and, lowering
business taxes and fees in the region.
Although infrastructure services can serve as important “inputs” to the firms’
production process, the effectiveness of such infrastructure services as a location incentive
for firms depends on the burden of infrastructure services on firms. If the cost of
infrastructure services is transferred to firms as business taxes and fees, even better
infrastructure may not be successful to lure new business firms to the region. Eberts
(1989) and Munnell (1990) provide some empirical evidence for this argument. Their
studies examine the relationship between changes in metropolitan area capital stock and
firm openings. They find that along with investment in infrastructure, total state and local
tax is one of the significant factors that determines firms’ openings and employment growth
in the region. Their studies also find that cost, availability and quality of labor in a given
state play a central role in the location decision and employment growth of firms.
Similarly, higher energy costs tend to discourage the establishment of new firms and inhibit
employment growth. Munnell (1990) finds that states with warmer climates tend to have
greater employment growth, and, energy costs have a negative effect on employment
growth.

7
Depending on the type of firm, the value of transportation infrastructure to the firm
could be very significant. For instance, a large steel company in Pittsburgh estimated that
it paid at least $1million a year in additional costs to detour its trucks 18 miles around a
major bridge closed by the state for lack of repair (Eberts, 1991). Similarly, Keeler and
Ying (1988) find that public investment on the highway system significantly improves the
productivity of the trucking industry. Some other studies have attempted to model
infrastructures such as interstate highways, in-county railroad lines and airports in firms’
location choice. Fox and Murray (1990) use pooled time series-cross-section data on
firms’ entries into the 95 Tennessee counties for the period 1980 to 1986 to evaluate the
effects of local public policies on the location of business activity. They find that interstate
highways are statistically significant for the location of firms, as the entry rate of firms is
higher in locations close to interstate highways. However, they also argue that this
relationship may not be interpreted as indicating that many new firms would be attracted to
the state or new firms started in the state if another interstate highway were built. Rather,
the new interstate highways may shift the location of economic activity from one place to
another in the region. Similarly, they also find that an in-county railroad line is related
with higher entry rates for small firms. However, Fox and Murray did not find access to an
airport to be a significant variable in locating firms. It is important though to keep the
limitations of their study in mind in interpreting this result. It is likely that the limited
geography (one state) and the short time period (six years) used are insufficient to draw a
reliable conclusion on this matter. A 1999 study by Freidheim and Hansson for Booz-
Allen & Hamilton Associates describe how airports have fuelled regional economic
growth. Over the past two decades, the airline industry has developed from point-to-point
air travel to hub-and-spoke operations, where a high volume of air traffic is concentrated
in a few large hub airports with spoke connections to many lower-volume destinations.
This has benefited almost all parties involved. Airlines have gained economic benefits of
scope and scale; consumers have obtained a greater choice of flights and destinations,
lowering of related costs and greater flexibility; and local economies of hub cities have
profited through increased employment, more visitors who spend locally, and business
location. According to Freidheim and Hansson, “Airports are magnets for business and
trade. Extensive and frequent air services are critical to attracting trade shows, and play a
major role in the location of corporate and regional headquarters, service companies,

8
research and development facilities and manufacturing sites.” (1999, p.3) Major airports
that have gained such benefits include Amsterdam and Singapore. They point out that
smaller airports located close to existing hubs can contribute significantly to the local
economy and encourage price competition. Midway Airport, for example, which is
Chicago’s second airport, focuses on local point-to-point, not connecting, air travel
demand. Lower-priced airlines such as Southwest that base their operations at Midway
stimulate such demand and impose price discipline on Chicago’s O’Hare Airport. A
Booz-Allen & Hamilton study on Chicago’s airports recommends that the city continue to
develop point-to-point traffic by adding capacity at Midway and other regional airports
(1999, p.7).
Santini (1978) did an early study of transportation infrastructure as a determinant of
residential and employment relocation. He expands a theoretical model to include the
accessibility to transportation and tests it in the Chicago and Gary-Hammond urbanized
areas. He finds that adding accessibility to water and air transportation improves the
model’s estimates of employment locations and levels. Rail transportation, which is
mostly used for non-manufacturing employee work trips to the Chicago business district,
played a significant role in household and employment relocation decisions. The results
from these studies suggest that the decline in highway infrastructure spending is a leading
cause of the nation’s diminished economic growth (Harmutuck, 1996).
Erickson and Wasylenko (1980) develop a model of the site choice decision of
relocating firms in seven, single-digit SIC industries, which have moved from Milwaukee
to its suburbs between 1964 and 1974. The firms belong to seven industries: construction,
manufacturing, transportation, communications and public utilities, wholesale and retail
trade, finance, insurance, and real estate and services. They find that most firms are
attracted to regions that have a high concentration of firms in the same industry clustering
and which have an available supply of labor. Similarly, firms in construction, wholesale,
and to some extent, transportation, retail trade, finance, and services seem to relocate on
sites that are farther from the central city. However, their results show that manufacturing
firms relocate to regions that are near highways and have a relatively high proportion of
vacant land. Their results show that firms in retail trade, finance, and services tend to
agglomerate and do not appear to relocate with respect to local market potential. Thus, the
empirical evidence suggests that high quality transportation infrastructure is complementary

9
to the production process of many types of firms and improves the amenity value of regions
for households.
Of several transportation infrastructures such as airports, ports, highways,
railroads, the high-speed train, the fastest mode of ground transportation, has been
extremely popular in Japan and Europe. Because of its success in Europe and Japan, the
United States will be introducing a high-speed train in different parts of the country1. As a
result, there has been increasing interest among regional planners in potential economic
impact of a high-speed train in regional economic development. The next section focuses
on the high-speed train and discusses its potential economic impact on a regional economy.
1 Florida did an extensive analysis in preparation for high-speed rail service. The newly elected governor killed theproject in 1999.

10
THE HIGH SPEED TRAIN: A MAJOR TRANSPORTATION INFRASTRUCTURE
OF THE 21ST CENTURY
The High Speed Train (HST) is a major innovation in ground transportation that
directly competes with air and auto transportation. The HST not only competes for existing
passengers with other modes of transportation, but it has a tremendous potential to induce
its own demand. Moreover, the HST can also serve as a major catalyst for the economic
development and revitalization of a region. It can also increase the competitiveness of a
region by enhancing its transportation. The contribution of the HST to economic
development of a region arises primarily from increases in economic and business
activities in the region that are directly or indirectly related to the HST.
The HST is the fastest mode of ground transportation that carries passengers from
one city to another at speeds of up to 200 miles per hour. The HST links major cities that
are between 100 and 500 miles apart. Japan was the first to introduce HST in 1964. In
Europe, France introduced the HST in 1981. Japan and France have the most successful
HST operation in the world. Following France, other European countries such as
Germany, Britain, Italy, Spain, Belgium, and Netherlands also have launched HST. Other
countries that have already launched or are planning to launch HST include Australia,
Korea, and Taiwan.
The United States is no exception. The United States is well underway to introduce
HST in different parts of the country in the near future. The HST has been proposed in
California along the North-South corridor (Los Angeles-San Diego), the Chicago Hub
(Chicago-Detroit, Milwaukee, and St. Louis), the Florida corridor (Tampa-Orlando-
Miami), the Northeast corridor (Washington-New York-Boston), the Pacific Northwest
corridor (Seattle-Vancouver), and, the Texas Triangle (Dallas-Houston-San Antonio).
Among these proposed plans, Amtrak has recently unveiled its plan to launch the
ultramodern, high-speed train service called Acela in late 1999 in the Northeast Corridor.
The proposed HST in the Northeast corridor will have speeds of 150 mph which reduces
the New York-Washington trip to two and half hours and New York- Boston to three hours.
If HST succeeds in the Northeast corridor, Amtrak is likely to implement proposed HST
plans in other parts of the country.

11
The HST not only reduces travel time between cities, however, it could have
significant impact on the economic development and revitalization of a region. The
potential economic impacts of HST connections on the regional economy have drawn the
attention of local regional economic planners. Economic planners often question whether
HST connections could have any significant economic impact on the regional economy.
What are the kinds of economic impacts of HST on the local economy? Which sectors of
the regional economy are the HST connections most likely to affect? What are the spillover
effects of HST on other sectors of the local economy? What are the costs and benefits of
HST for a region? This study will attempt to address these issues by an extensive literature
review of the economic impact of HST. The objective of this review is to provide some
insight to local regional economic planners in terms of the potential of HST connections in
economic revitalization and development of a region. Initially, the literature review will
provide brief discussions of high-speed trains in France, Japan, Germany, Italy, and Spain
and then shift the focus to the economic impacts of HST on the Connecticut regional
economy.
France: TGV
The French high-speed train called the TGV (Train a Grande Vitesse) was opened
to the public in 1981. The TGV operation is one of the most successful and profitable
railroad operations in the world. Within a decade, it not only earned a significant amount
of profit, but also covered its original costs of construction. The TGV earned net profit
margins of 22% - 38% in its first full year of operation. France has developed a genuine
network approach to high-speed rail. The French system has three major lines radiating
out of Paris which ultimately connect to locations all over Europe. Among these, Paris-
Lyon is the ideal route for a high-speed line. To some extent, it has the character of a long
distance commuter line. The French TGV Paris-Lyon was financed entirely by the French
government on the basis of an expected minimum financial rate of return of 12% which has
already been surpassed. The early success of TGV lines spurred the construction of more
lines: TGV Sud Est, and, TGV-Atlantic in France. Because of the explicit recognition of
TGV potential for regional development, the French government contributed 30% to the
construction of TGV-Atlantic in 1990. There have been more proposals for developing a

12
European high-speed rail network that would link different countries and cities in Europe.
Japan: ShinkansenJapan is one of the most densely populated countries in the world, especially on
habitable land. The three largest metropolitan areas, Tokyo, Osaka, and Nagoya account
for over 45% of the population. The Japanese high-speed train system, developed in the
1960s, mainly connects the other cities of Japan to these three metropolitan areas. The
Japanese high-speed rail line, Shinkansen, is characterized by shorter distances between
stations relative to the European routes, and higher frequency of train trips (one every 6
minutes or less in Tokyo during rush hours)2. This can be attributed to the structure of
cities in Japan. Many core cities in Japan are located fairly close to one another (approx.
35km or 21.7 miles), and the population density is very large in these cities. As in Europe,
railway transportation in general is very popular in Japan. In Japan, railway transportation
accounts for approximately 30% of the entire transportation volume.
The construction cost for the Japanese Shinkansen was much higher than that of the
French TGV lines and other European rapid-transit lines. The higher costs of construction
of high-speed rail lines in Japan arise primarily from the higher civil engineering costs.
The civil engineering costs (building bridges, digging tunnels and banking or elevating
tracks) usually account for approximately 70% of the total construction costs of high-speed
rail lines. The Japanese system was therefore more expensive because it required more
tunnels due to its mountainous topography (30.8% of total lines are in tunnels), more
elevated tracks, and, higher costs for sound pollution-reducing measures.
Germany: ICE
The introduction of high-speed train in Germany aims at overcoming particular
bottlenecks in its existing railroad network. Unlike in France, the railroad system in
Germany involves mix of upgrading and new construction. There have been several
improved routes in addition to new railway lines. Germany is also planning to introduce
magnetic levitation system, Maglev3, which requires a completely new infrastructure that is
incompatible with the existing rail lines.
2 The frequency indicates the number of trains that depart from a station in a given time period.3 Maglev is an advanced transport technology in which magnetic forces lift, propel, and guide a vehicle over a speciallydesigned guideway. It eliminates the need for wheels and many other mechanical parts, thereby minimizing resistanceand permitting excellent acceleration, with cruising speeds on the order of 300 mph or more.

13
As in Japan, because of difficult terrain, and the requirement of more tunnels, the
new railway lines in Germany have been more expensive than in France. Moreover, the
new railway lines in Germany have been designed for multi-purpose use. The new railway
lines can operate different kinds of trains such as, very high speed ICE trains at 250km/hr,
traditional IC trains running at 200km/hr, and freight trains running at lower speeds.
Italy: Direttissima
As in Germany, Italy’s new investment in railway lines aims to overcome
particularly difficult stretches of their rail route. Initially, Italy tried to use an active tilting
train, ETR 450/460, Pendolino, which enables higher speeds on existing track. This kind
of train was used to overcome the need for constructing new lines. However, due to
technical problems and discomfort for passengers, this system has been abandoned.
Instead, Italy constructed new tracks for the high-speed train ETR500.
Britain and Switzerland also tried active tilting technology in the 1970s to overcome the
construction of new lines. This technology turned out to be troublesome because of more
frequent and tighter curve routes.
Spain: AVE
Spain introduced AVE, a single high-speed rail route between Madrid and Sevilla
in 1992. The AVE has substantially reduced the distance between Madrid and Sevilla
because of the more direct route than existing routes. As in Germany, the new route in
Spain is used by conventional trains running at 200km/hr (134 mph), as well as the new
high-speed train AVE, running at 280 km/hr (174 mph). There have been more proposals
for the construction of new railway lines for the high-speed train between Madrid and
Barcelona.
THE ECONOMIC IMPACTS OF HIGH-SPEED TRAIN: PAST EXPERIENCE AND
FUTURE POTENTIAL
Apparently, the major impacts of HST are the reduction in travel time, and traffic
diversion from conventional modes, and induced new travelers. However, the economic
impacts of HST, and its potential to revitalize the regional economy are equally important.
The major contributions of HST to the regional economy are increases in efficiency,

14
productivity and employment, an increase in economic activity in the region, and the
spillover effects on different sectors of the regional economy. The economic impacts of
HST in a particular region are measured by the change in the level of employment, wages,
income and output, and, tax revenues in that region.
One of the major impacts of HST is an increase in amenity value. The amenity
value includes the value of time saved, reduction in car use, reduction in traffic accidents,
road congestion, and environmental impacts. The literature review addresses the
economic impacts of HST on the regional economy in different parts of the world,
primarily Europe and Japan. This review focuses on the impacts of HST on employment,
income, production, tax revenues, regional competitiveness, amenity values, and, the
potential for revitalization and redevelopment of a region.
(1) Impacts on Employment, Production, and Population
The HST could have significant impact on the level of employment in a region. The
HST creates not only short-term employment during its construction phase but also
considerable amount of long-term employment. The long-term employment from HST
comes from maintenance and daily operation of the trains and related services. Other than
the direct HST related employment, HST is also likely to have spillover effects on
employment in different sectors by inducing different kinds of economic activities which
may not be directly related to HST. The HST may contribute to employment in the region
by inducing new business activities such as retail sales, service industries, and back office
operations, which include sales, marketing, framing, printing and satellite operations.
The employment generation from HST comes from mainly two sources: the
construction phase, and daily maintenance and operation. The French experience shows
that, during the construction of TGV, the HST is estimated to have created 3500 to 4000
short-term jobs over six years, which was, however, lower than the projection. On the
operational side, the number of employees required to operate HST is lower than for the
traditional train. Similarly, the Japanese experience from Shinkansen shows that currently,
about 15,000 employees operate 275 trains a day over a total distance of 112,599 miles.
The impact of HST can be observed by comparing the employment level in high-
speed station locations and non-station locations. Because of the increase in business

15
activities, it is reasonable to assume that the high-speed route of the train generates higher
employment in station locations than in non-station locations. However, in the ex-coal
town of Le Creusot (85 min from Paris), a new TGV station had almost no local economic
impact in terms of new jobs, firms or commercial expansion. This is attributed to its
isolated station location, poor road access and historical change.
Haynes (1997) provides a summary of some earlier studies on the impact of high-
speed train Shinkansen in Japan. The Shinkansen experience show that population growth
is higher on the route of high-speed train station than on the non-station routes (Amano and
Nakagawa, 1990). Brotchie (1991) records that the population in station locations along
the high-speed train route was 22 percent higher than in non-HST station locations.
However, a heavy concentration in manufacturing industry and an aged population tend to
limit local urban growth. On the other hand, presence of information exchange industry
such as business services, banking and real estate development, access to higher education
and expressway access are the key variables for local urban growth (Nakamura and Ueda,
1989).
The Shinkansen experience shows that employment in retail, construction and
wholesaling is 16 percent to 34 percent higher in HST station than in non-HST station
locations (Hirota, 1984). Similarly, Amano and Nakagawa (1990) find that employment
growth in food and accommodation sectors is 26 percent higher in Shinkansen station than
in non- Shinkansen station locations (1.8 to 1.3 percent respectively).
Nakamura and Udea (1989) compare the economic effects of the high-speed train
and expressways on per capita income, employment in retail, and information industry
growth. They show that per capita income increased by 2.6 percent due to station location
effects, 6.4 percent due to expressway effects, and 9.5 percent due to combined effects.
Similarly, total employment rose by 0.4 percent due to station location effects, 1.2 percent
due to expressway effects and 2.8 percent due to combined effects. On the other hand, the
employment growth in the information industry sector was up by 22 percent for the
combined station location and expressway effects and 7 percent for expressways only
(Haynes, 1997).
(2) Types of Business stimulated by HST

16
While the HST can significantly contribute to increased levels of employment, and
population growth in the region, its ability to attract new businesses, and the expansion and
retention of existing businesses are of the paramount importance. The potential increase in
business activities in the region is the strongest justification for investing in HST.
Because the profitability of a firm largely depends upon its market proximity and
accessibility, its location choice becomes quite important. Any location with a better
transportation network such as access to highways, airports, railroads, and ports is likely
to attract firms over other locations with very limited transportation networks and
accessibility. The high-speed train provides a crucial transportation linkage and its
presence is likely to attract more new businesses in the region. The types of businesses the
HST is likely to attract to the region are primarily travel-time sensitive industries and
service industries. Similarly, the presence of the HST connection also has the potential to
attract retail and wholesale businesses to the region.
(i) Service Industries
In particular, the HST is likely to attract businesses such as retail sales, financial firms,
insurance companies, banking firms, and retail sales. These industries benefit directly by
the increased inflows and outflows of people to the region. The need for more garages,
hotels and convention centers can be included in service industry growth. Similarly, an
increase in population in the region due to the presence of HST may spur more service-
oriented business activities in the region.
The French experience with TGV shows that an increase in consultancy business
activities in the region is the predominant impact of the HST. In France, the proportion of
journeys with the object of purchasing or selling services rose from 18 percent to 22
percent during in 1980-1985 as a result of TGV (Bonnafus, 1987). The French experience
also shows that more diversified enterprises, rather than specialized industries have
benefited more from TGV. Similarly, the experience with the Japanese HST, Shinkansen,
has shown that the HST also has potential to attract large department stores, urban hotels,
and convention centers to the region. Both intermediate stations and termination stations
showed significant growth in food and accommodation sectors (Brotchie 1991, Hirota
1984).

17
(ii) Travel and Tourism Industry
The introduction of the high-speed train is likely to have a significant impact on the
travel and tourism industry. Because the tourism industry is sensitive to accessibility and
travel time, the HST can contribute to the industry in a particular region by further reducing
travel time to and increasing the accessibility of the region. However, the HST is likely to
have two contradictory effects on tourism. First, because of the reduction in travel time
and increase in accessibility, the presence of HST is likely to increase the number of
tourists in the region. Secondly, it also reduces the number of overnight stays in hotels as
HST makes more day-return journeys possible. From the Japanese experience, the rise in
tourism had mixed effects for HST station locations. Overnight stays at local stations did
not increase proportionately for intermediate stops due to the expansion of same-day travel
(Obate, 1979). Similarly, the TGV in France resulted in an expansion of summer tourism,
but overnight stays dropped due to same-day travel and winter tourism levels did not
change (Haynes, 1997). The presence of TGV in France resulted in increased in business
travel by 56 percent and services travel by 112 percent (Pieda, 1991). Similarly, TGV
seems to have had no significant effect on winter sports tourism.
(iii) Real Estate Market
The high-speed train is likely to have a significant impact on land values and the
real estate market. Increases in population growth and business activities put pressure on
the real estate market. Ernst and Young (1990) find that accessibility to a high-speed train
would cause a localized increase in land values in the areas close to HST stations. This is
due to increased demand for services such as hotels and restaurants, and partly due to
increased demand for residential property. In Japan, Shinkansen has increased
commercial land values by 67 percent while the expressway alone increased the land
values by 42 percent in high-speed train station locations (Haynes, 1997). Similarly, in
France, land values rose markedly and office space declined due to access-related demand
that rose by over 43 percent between 1983-1990 (5.2 percent per year). Le Mans on TGV
Atlantic was already an active center (55 min from Paris) with an expanded business base,
and, complementary transport highway investment was expected in 1996 to link it to
Belgium. Land values, raw and built, increased 100 percent in three years in Le Mans.

18
Similarly, Vendome also on TGV Atlantic is 42 min from Paris (vs 2hr and 15 min)
showed only marginal pre-TGV growth. After TGV, the property values increased by 35
percent and real estate exchanges have increased by 22 percent with an indication that
Vendome may become a Paris commuter suburb. Nantes, another connecting point on TGV
Atlantic, from which travel time to Paris was reduced to 3 hr from 2 hr, already had a
strong and diversified local economy and played a dominant regional role. It had good
transport links, a ring road, tramlines, and a strong publicly assisted business location
program. Some relocation from Paris to Nantes has occurred at both the business
production and headquarters levels. Similarly, since the start of the operation of the high-
speed train in Germany, with magnetic levitation technology (Maglev) in 1992, office
demand and retail space increased by 20 percent in Kassel-Wilhelmshone station which is
located on the Hannover-Wurzburg segment.

19
(3) Impact on Tax Revenues
The HST may not have significant impact on government revenues. However, there
are two competing effects of HST on tax revenues. Local governments may have increases
in total tax revenues if HST significantly increases business activity, and promotes inflows
of people into the region. The increase in tax revenue for the government is likely to result
from the increase in spending in the tourism industry, and in the service and retail trades
such as, hotels, and entertainment. On the contrary, the possible traffic diversion from air
and auto may decrease consumption of gasoline and reduce related the tax revenues.
Because of this offsetting effect, HST may not largely affect government net tax revenue.
(4) Impact on Amenity Values
With respect to amenity values, time saving and the increase in efficiency are the
most valuable and direct impacts of HST. If the saved time is converted to production
time, the value of time saved is enormous. Sanuki (1979) estimates that in between 1964-
1976, Shinkansen saved in aggregate 2246 million hours and if this time were allocated to
working the effect would be to create one full year of work-time for 1.22 million people
with two days off per week.
Some studies compute the value of time by estimating the time wasted by airline
delays. Chicago's O'Hare Airport alone tallied more than 12 million hours of passenger
delays annually which is equivalent to 1400 people standing idle 24 hours a day for an
entire year (Reistrup, 1986, Johnson, 1990). The costs of air delays for passenger and
airlines nationwide in the U.S. has been estimated at $5 billion in 1986, of which $2
billion (7 percent of the airline's total operating costs) was spent on extra fuel and labor.
Unlike airlines, HST would be virtually immune to adverse weather that is the single
largest cause of airline delays. The benefits of HST in terms of timesaving can come
through reduction in travel in ground transportation and the potential decrease in air travel
delays.
The cost of social impacts due to the lack of reduction in road and air congestion
could be significant in the absence of HST. Thompson and Bawden (1992) argue that car
trips in Southern California are expected to jump by 42 percent, and the cost of rush hour
20
congestion in that area will soar to $26 billion - most in lost production - by the year 2010.
Similarly, the Federal Railroad Administration (FRA, 1990) estimates that nationwide
two billion production hours per annum are lost already because of highway congestion,
costing about $80 billion per year.
High-speed trains have a positive and noticeable effect on air pollution reduction.
High-speed trains create pollution approximately 1/6 of the pollution per person
transported by a car. However, there are increased concerns about the noise pollution of
HST. Despite availability of new technologies to reduce noise pollution, the cost of noise
pollution reduction is extremely high. In Japan, because of the proximity of railway lines
to residential areas, civil engineering costs were significantly higher to account for
increased noise pollution reduction measures.
The presence of HST is also likely to affect the welfare of a local community. In
general, communities with large service sectors would benefit the most, although Hagiwara
(1982) notes that the impact on medium-sized communities would be larger than the impact
on large cities on the route. Hagiwara (1982) finds that the high-speed rail system is “a
system which joins smaller communities to larger communities, rather than the reverse”.
For this reason, it is most likely that the impact would be larger on smaller communities
than on larger ones. However, Hagiwara (1982) notes that in small communities that are
already very close to a large community, the impact would be very small.
(6) Diverted Travelers and Induced Travelers
Demand for high-speed rail primarily arises from two sources: transfers of
passengers from other modes of transportation, and new passengers. Specifically, high-
speed rail demand can be separated into three groups: (1) passengers who switch from
commuter air trips to high-speed rail; (2) automobile and bus passengers who switch to the
high speed rail; and, (3) induced demand, that is, those who would not have traveled in the
absence of the high-speed rail.
Traffic diversion has been one of the major and important impacts of HST
connections. Diverted traffic not only positively affects the environment but also
contributes to economic growth by releasing resources to produce things elsewhere in the
economy. Because it directly competes with auto and air travel, the HST is likely to divert

21
a significant amount of traffic depending on the relative fare, travel time, and quality of
service of HST. Similarly, new travelers or “induced travelers” largely contribute to the
increases in the number of travelers. The increase in the number of travelers, however,
depends on the reduction in travel time, increased accessibility, and relative costs of
traveling.
Vickerman (1997) examines the impact of French TGV on traffic diversion and trip
generation. In France, the total rail passengers on the Paris-Lyon corridor increased from
12.5 million in 1980 to 22.9 million in 1992, of which 18.9 million were TGV passengers.
Most of the increase came in the first few years with 20 million rail passengers (15
million by TGV) by 1985. Most of the diverted passengers came from air traffic. Paris-
Lyon air traffic halved between 1980 and 1984, and Paris-Geneva air traffic fell by around
20 percent. The air traffic on Paris-Sud Est in general grew at less than half the rate of
other radial routes from Paris.
In France, the impact of HST on the growth of traffic volume in other transportation
modes has been significant. All transportation experienced a general slow- down in traffic
volume growth from 1989 onwards. The overall increase in train traffic between French
cities is attributed to the TGV lines. Bonnafus (1987) estimates that 51 percent of the total
increase in train traffic in France can be attributed to diverted traffic of which 33 percent
comes from airplanes and 18 percent from roads, and 49 percent to induced traffic.
The HST affected the traffic volume significantly in the other parts of Europe as
well. In Germany, during the first five years of its operation, ICE induced a significant
number of passengers to travel by HST. ICE passengers more than doubled, from just over
10 million to nearly 23 million over the first five year period, of which some 12 percent of
the traffic is estimated to be diverted from road and air. Similarly, the ICE traffic accounts
for 28 percent of long-distance passenger revenues. In Spain, the high-speed train (AVE)
has been remarkably successful in diverting and inducing new traffic. Within diverted
traffic, about 32 percent of travelers is estimated to have come from air transport, and 25
percent from the roads. About 26 percent of the total travelers has been considered as
newly generated (i.e., induced). Existing train services have suffered from the presence of
AVE. About 14 percent of AVE passengers are considered to come from existing train
service.

22
(5) Potential Urban Redevelopment, and Revitalization
Past experience shows that HST can play a significant role in the redevelopment of
an urban area. The Japanese experience in Kakegawa, midway between Tokyo and Osaka,
has proved that the HST has tremendous potential to revitalize urban areas. Okada (1994)
discusses the redevelopment of Kakegawa, which is on the Tokaido Shinkansen line and
has a population of approximately 72 thousand. Initially, Kakegawa did not have a
Shinkansen connection. In 1988, a station was built in Kakegawa. The Shinkansen
connection in Kakegawa led to an increase in urban hotels, conference centers, and
convenience stores. Since the connection of Shinkansen, Kakegawa has experienced
increases in employment, production, sales, the number of tourists, and the number of
conferences. Okada (1994) argues that the impact of Shinkansen on urban growth was
further supported by the presence of an information exchange industry. This industry
includes business services, banking and real estate development, access to higher
education (universities), and expressway access (Nakamura and Ueda, 1989).
(i) Relocation of Firms and Economic Growth
Relocation of firms due to the presence of HST is another important impact of the
high-speed train. For firms in larger urban regions with land consuming activities, a new
high-speed train line may make it profitable to relocate business activities to one of the
smaller, outlying regions within the corridor that now has higher accessibility. The HST
connection makes it possible for firms to keep personal contact with many of their existing
suppliers and customers. At the same time, they can take advantage of cheaper land and
lower wages in such regions. In this case, the smaller outlying region might gain
employment while the larger region loses employment. This implies that the establishment
of the high-speed train link may change the mix of inputs for firms. Similarly, firms can
extend their markets and relocate activities to advantageous regions within the corridor.
The relocation of firms due to the presence of the high-speed train connection is likely to
stimulate production and increase economic growth in the high-speed train corridor.
Similarly, HST might contribute to regional economic growth by giving rise to an
inflow of firms from other regions outside the corridor. If HST connects corridor regions

23
with international airports, seaports and highways, the corridor becomes even more
attractive for firms outside the region.
(ii) Improved Accessibility and Economic Growth
The HST can substantially increase the economic growth of a region by improving
the accessibility of the region. The HST addresses accessibility problems in two ways.
First, where a point to point link is dominant, each train is a potential substitute for an air
connection between two cities, that is, it connects cities at long distance with a direct train
connection. The HST can directly compete with air transportation by supplying a large
number of trips in more efficient, more comfortable and more environmentally friendly
ways, and, without regard for the weather.
Second, HST binds cities together and creates a new region formed like a string of
pearls. This type of region is known as a functional region4 (Haynes, 1997). Such a band
of cities connected by HST and combined with a highway is expected to have a higher
competitive advantage over other, more isolated regions.
Improved accessibility favors firms as well as workers. The improved
accessibility leads to a widening of regional labor markets, and allows firms to recruit
labor with more suitable competence profiles. It also provides larger contacts with other
firms, suppliers, and customers. While firms can search for labor in wider circles, people
in the labor force can also supply their labor within a larger geographical area. The larger
labor market created by HST connections implies more frequent and longer commuting
trips. Moreover, improved accessibility also gives rise to increased business trips. The
increase in travel intensity as a result of extension of the labor or service market, and more
business trips would stimulate economic growth in the region. Some studies show that a
corridor with a combination of highway linkage and high-speed train access, and well-
functioning feeder systems, has higher potential for economic growth than regions lacking
such infrastructure (Cheshire, 1995).
(7) Prospect of HST in Northeast Corridor
The success of HST depends upon its ability to attract new travelers as well as to
4 A Functional Region is a geographical area that shares a common labor market and a common market for household

24
divert travelers from other modes. Most importantly, the ability of HST to compete with
other modes of transportation could largely determine the success or failure of HST in the
Northeast corridor. If HST provides competitive fares, better quality of service, more
trips, and reduces travel time significantly relative to other modes of transportation, the
HST can succeed in the Northeast corridor. The population density is significantly higher
in the Northeast relative to other parts of the country. The Northeast corridor could be an
appropriate market for HST as it consists of total population over 35.8 million and several
large metropolitan areas, Washington, Baltimore, Philadelphia, New York, and Boston.
The U.S. Department of Transportation has projected that passenger-miles in the
Northeast corridor will be over 1.3 billion for 1997. The revenues are projected to cover
all expenses, continuing investment, and over half of the initial infrastructure investment.
Similarly, in terms of traffic diversion, the National Railroad Passenger Corporation
estimates that the HST could attract 1.6 million highway travelers and 1.4 million air
travelers in Northeast corridor alone.
There is, however, also some skepticism about the success of HST in the United
States. Because of other competitive transportation modes, and lower population density
in the Northeast relative to Japan and France, the impact of HST on traffic volume may not
be as high as in Japan and France. Moreover, because travelers in the U.S. are more
dependent on automobiles, the relatively cheaper gasoline prices in the U.S. compared to
Europe and Japan may provide less incentive for travelers to switch from automobiles to
HST.
(8) Prospects for Greater New Haven
The introduction of HST in the Northeast corridor and infrastructure improvements
in New Haven could have a significant impact on the revitalization of the New Haven area
and its vicinity. The other infrastructure improvements include construction of Pearl
Harbor Memorial Bridge, parking garages, Church Street bridge, and enhancement of
Metro-North and Shore Line East rail services. Following the completion of these
projects, New Haven is likely to be a prime location for business expansion and
relocation. Because the proposed HST is expected to cut the current travel time between
and business services.

25
New York and New Haven, and, Boston and New Haven significantly, business activities
that are sensitive to travel time will most likely be attracted to New Haven. Moreover,
because of the existing infrastructure such as Tweed Airport, seaports, its proximity to
New York, Boston, and Hartford, these improvements may attract a diversity of businesses
to New Haven. Similarly, quicker access to New York and Boston, and relatively lower
costs of doing business in the New Haven area may persuade some businesses to locate in
the corridor rather than at the end points.
Similarly, the tourism industry is also likely to flourish in the New Haven area
following the HST connection. Because of reduced travel time increase in accessibility,
the number of tourists in Connecticut is likely to increase significantly. Mystic Aquarium
and Seaport, and, Foxwoods Resort and the Mohegan Sun Casinos draw large numbers of
tourists from Boston, New York and other parts of the Northeast. Cultural tourism will
benefit as Connecticut’s museums and New Haven’s arts and cultural activities grow.
Cultural tourists usually stay longer and spend more money than recreational tourists.

26
TRANSPORTATION SECTOR IMPROVEMENTS IN NEW HAVEN COUNTY:
AN ECONOMIC IMPACT AND BUILD-OUT ANALYSIS
Introduction
This report presents the results of a dynamic analysis of the economic impact of
ongoing and proposed enhanced infrastructure developments in New Haven County. This
analysis covers investments in Connecticut’s infrastructure, including improvements to the
State’s commuter railway system (Metro-North and Shore Line East), its highway system
(I-95), and the introduction of high-speed train service linking Connecticut to Boston and
New York, and subsequent developments in the County in the professional services and
biotechnology sectors. The Regional Growth Partnership requested the Connecticut Center
for Economic Analysis (CCEA) at the University of Connecticut to conduct this study. The
Center houses the State Economic Model, (the REMI model), a sophisticated 53-sector
replication of the State’s economic structure that can project economic impacts out to the
year 2035. The analysis presented here looks at the impacts over a period of thirty-two
years, with the year 1999 as the starting point. The objective is to determine the net
benefits to New Haven County, in terms of increased employment, gross regional product
(GRP), personal income, and net tax revenues, as these investments in the County’s
infrastructure take place.
This analysis focuses on both the construction of new infrastructure and on potential
benefits such as business expansion and attraction that may accrue once the new
infrastructure is in place. The construction phase is based on available data on current
and future highway and rail development projects. The potential business expansions are
modeled on the availability of land suited for development. The latter phase is essentially
a “build-out” approach based on the area of land available, in which five possible
scenarios are considered; a “maximum build-out”, a “minimum build-out”, an “moderate
build-out”, a "current office space growth trend", and a "new 2.5 million square feet lab
space" scenario. These are explained in detail below.
PHASE I: INFRASTRUCTURE CONSTRUCTION PHASE

27
The construction projects included here come from two sources: the Connecticut
Department of Transportation (ConnDOT) and Amtrak. The analysis looks only at ongoing
and future investments; completed projects are not included. Table I below lists the
construction projects and their estimated costs.
TABLE I: PROSPECTIVE PROJECTS Estimated CostMillions of Nominal $
ConnDOT projectsPearl Harbor Memorial Bridge (Q Bridge) recommended actiondesign/reconstruction projects
$979
Church Street South Extension $ 33 Shore Line East Station Enhancements: Westbrook $2.6*
Guilford $2.6*
Madison $2**
Branford $3.4**
Amtrak Projects Guilford Sidings $13 New Haven Yard Modernization $75*station only **
station and parking
These investments include both the construction of new facilities and the
enhancement of existing facilities. For instance, they include new stations (e.g., a new
passenger station on State Street in New Haven as a component of the Pearl Harbor
Memorial Bridge development package), and the improvement of existing ones (e.g.,
Shore Line East stations). They include the construction of new rail lines as well as
improvements to existing ones. And they include the construction of new roads and bridges
(e.g., the new Pearl Harbor Memorial Bridge (Q Bridge) in New Haven) and the
enhancement of existing roads and bridges (e.g., widening portions of I-95 under the Pearl
Harbor Memorial Bridge (Q Bridge) project). Amtrak, the federal government, and the
State’s transportation fund will presumably provide funding for these projects, resulting in
no extraordinary State spending.
The infrastructure investments considered in this study fall into three main
categories; railroads, railway stations, and roads and highways4. Chart 1 shows funding
for each category as a fraction of the whole.
4 The new State Street Station is included in the Pearl Harbor Memorial Bridge (Q Bridge) Development constructionas separate estimates are not available at this point.
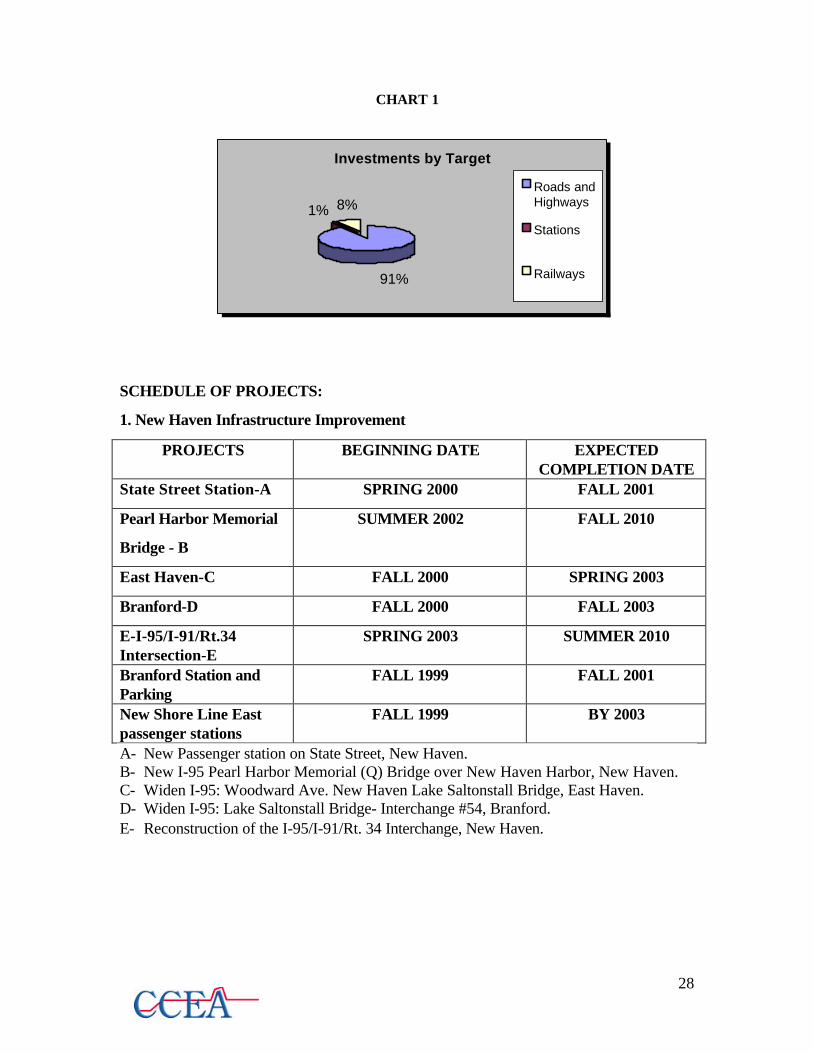
28
CHART 1
SCHEDULE OF PROJECTS:
1. New Haven Infrastructure Improvement
PROJECTS BEGINNING DATE EXPECTEDCOMPLETION DATE
State Street Station-A SPRING 2000 FALL 2001
Pearl Harbor Memorial
Bridge - B
SUMMER 2002 FALL 2010
East Haven-C FALL 2000 SPRING 2003
Branford-D FALL 2000 FALL 2003
E-I-95/I-91/Rt.34Intersection-E
SPRING 2003 SUMMER 2010
Branford Station andParking
FALL 1999 FALL 2001
New Shore Line Eastpassenger stations
FALL 1999 BY 2003
A- New Passenger station on State Street, New Haven.B- New I-95 Pearl Harbor Memorial (Q) Bridge over New Haven Harbor, New Haven.C- Widen I-95: Woodward Ave. New Haven Lake Saltonstall Bridge, East Haven.D- Widen I-95: Lake Saltonstall Bridge- Interchange #54, Branford.E- Reconstruction of the I-95/I-91/Rt. 34 Interchange, New Haven.
Investments by Target
91%
1% 8%Roads andHighways
Stations
Railways

29
2. Amtrak Investments in Connecticut
PRJOECTSAMOUNT OFINVESTMENT
(Mill. $)
EXPECTEDCOMPLETION YEAR
New Haven Yard Modernization $75 In progressStamford Center Island Platform $35 In progressTrack 2 (Norwalk-Devon) and Other NH-NY Border Improvements
$27 In progress- 2000
Old Saybrook Center Island Platform andFreight Improvements
$20 In progress
New London Station and Platforms $8 2001Guilford Sidings $13 2002Clinton Sidings $2 CompletedPine Orchard Sidings $6 CompletedTilcon Sidings $1 CompletedNiantic River Bridge Replacement $35 2003Connecticut River Draw Upgrades $10 CompletedBridges/Rail/Track/Signal Upgrades NH-NL
$75 Completed
Thames River Draw Span Replacement $30 2001Bridges/Rail/Track/Signal upgrades NL-Westerly
$60 Completed
CT Electrification $150 CompletedTOTAL INVESTMENT $545
PHASE II: POTENTIAL EXPANSION PHASE
Phase II models the potential developments following the infrastructure
improvements of Phase I. Two sectors were considered as candidates for expansion –
professional services and biotechnology. Accordingly, the land is used for the construction
of offices and laboratories. We needed two estimates to be used as inputs to the REMI
model – the total construction and equipment costs for the buildings, and the potential
employment that results from the completed projects. Our assumptions and estimates are
explained in detail below.
The total amount of land likely developable based on RGP estimates in New Haven
County was the starting point for the “maximum build-out”, “minimum build-out”, and
“moderate build-out” strategies. The total available land area was first converted from

30
acres into square feet (at 40,000 square feet per builder’s acre). Of the total, 30% was
regarded as potential land for Class A office space and laboratories (after allowing for
roads, driveways, parking lots and gardens). This area is divided into 60% Class A office
space and 40% laboratory buildings. Each building has a maximum of three floors (for the
maximum build-out, with one and two floors for the minimum and moderate build-outs,
respectively), and on each floor, 60% is designated "work space". The remaining space
(40% of the total building area) allows for hallways, stairways, storage space and
conference areas. Construction costs of $122.50 per square foot of Class A office space5
and $290 per square foot of lab space6 were used to estimate total construction costs.
Equipment costs were obtained by using $20.38 per square foot for office fixtures and
furniture, $9.73 per square foot for computers for office space, and $60 per square foot for
lab machinery and equipment. We assume 300 square feet per office worker and 500
square feet per lab worker to estimate potential employment in each sector. All fractions
above and the number of floors are parameters that are easily changed for alternative
scenarios.
The "maximum build-out" scenario assumes three-story buildings on 40% of the
available land. The “minimum build-out” scenario assumes one-story buildings, thereby
reducing the construction and equipment costs and employment to one-third of the above
values. The “moderate build-out” scenario assumes two-story buildings, hence the costs
and employment values amount to two-thirds of the maximum values. In all these cases the
construction and equipment of the offices and labs take place over ten years beginning in
2001, and the employment of workers in these offices and labs take place over the next 10
years, beginning in 2011.
The "current office space growth trend" scenario takes into consideration the
growth of class A office space in New Haven Country during the last five years, which
amounted to an annual growth rate of 1.92% from 1994-1999. Potential expansion of
office and lab space is then based on this growth rate, using the available office space in
1999 as the starting point. As before, 60% of the expansion will be new office space, and
40% will be new lab space. Construction takes place over ten years beginning in 2001,
5 Source: www.Saylor.com6 Source: UConn Chemistry Building

31
and employment opportunities are filled over ten years beginning in 2003. Employment is
estimated based on the area of office and lab space using the same numbers as above.
The "new 2.5 million square feet of lab space” scenario assumes the construction
of a total of 2.5 million square feet of lab space in New Haven County over five years
beginning in 2001. Employment opportunities are filled over five years beginning in 2003.
Equipment costs for the labs are estimated using the same number as above, as is the
estimated employment.
In each of the above scenarios we included the construction of 700 new hotel
rooms and 200,000 square feet of convention and entertainment space in New Haven
County. The construction of the new hotels is estimated to cost $180.4 million, beginning
in 2002 and completed by 2004. Once completed, we assume an occupancy rate of 70%
that generates $31.5 million in sales per year. The convention and entertainment space is
estimated to cost $51.7 million to construct, beginning in 2002 and ending in 2004.
Beyond that, these centers will incur operating costs of $3 million per year. We assume
that attendance at the centers will equal 210,375 event days (number of events * number of
participants) and each visitor will spend an average of $200 per day while in the New
Haven area. This amounts to $42.075 million new spending per year. All estimates for
hotels and convention/entertainment centers were based on calculations obtained for
similar construction proposals under the Adriaen’s Landing project in Hartford, and scaled
up or down according to size.
All estimates are listed in Table IIA and IIB, with the actual inputs used in the
model in bold text.

32
TABLE II A - INPUT DATA MaximumBuild-out
MinimumBuild-out
ModerateBuild-out
Current OfficeSpace GrowthTrend
2.5 M Sq. FeetAdditional LabSpace
Total available land 114,350,800 sq. ft. 114,350,800 sq. ft. 114,350,800 sq. ft.Total building area (outside space) (30% of total land)includes 160,000 sq. ft. pre-designated fordevelopment
34,465,240 sq. ft. 34,465,240 sq. ft. 34,465,240 sq. ft. 183,689 sq. ft*
Three-story buildings One-story buildings Two-story buildings
Total Class A office space (60% of total building area) 62,037,432 sq. ft. 20,679,144 sq. ft 41,358,288 sq. ft 110,213 sq. ftTotal Lab space (40% of total building area) 41,358,288 sq. ft. 13,786,096 sq. ft 27,572,192 sq. ft 73,475 sq. ftConstruction costs of Office space ($122.50/sq.ft) $7,599,585,420 $2,533,195,140 $5,066,390,280 $13,501,123Construction costs of Lab space ($290/sq.ft) $11,993,903,520 $3,997,967,840 $7,995,935,680 $21,307,894 $725,000,000
Total Building Construction Costs $19,593,488,940 $6,531,162,980 $13,062,325,960 $34,809,017 $725,000,000
Furniture and Fixture costs for Offices($20.83/sq.ft)
$ 775,343,825 $258,447,941 $516,895,883 $2,295,742 -
Computers and Elec. Equipment costs for Offices($9.73/sq.ft)
$ 362,174,528 $120,724,842 $241,449,685 $1,072,375 -
Machinery and Equipment for Labs ($60/sq.ft) $1,488,898,368 $496,299,456 $992,598,912 $4,408,530 $150,000,000
Space available for Office workers (60% of officespace)
37,222,459 sq. ft 12,407,486 sq. ft 24,814,973 sq. ft 110,213 sq. ft -
Number of Office workers (300 sq. ft/worker) 124,075 41,358 82,717 5,367 -
Space available for Lab workers (40% of lab space) 24,814,973 sq. ft. 8,271,658 sq. ft 16,543,315 73,475 sq. ft -Number of Lab workers (500 sq. ft/ worker) 49,630 16,543 33,087 2,147 5000
Total Number of Workers 173,705 57,901 115,803 7,513 5000
* Net new space projected for year 2000 using 1.92 % annual growth of Office Space.

33
TABLE II B - INPUT
Hotel and Convention Center: Included in All Scenarios
Construction Cost of Hotels – 700 rooms ($257,671 per room) $180,369,700Total Construction Costs for Hotels $180.369,700Hotel Sales per Year (70% room occupancy) $31,500,000Construction Cost for Convention/Entertainment Centers ($258.52/sq.ft) $51,700,000Total Construction Costs for Convention/Entertainment Centers $51,700,000Operating Costs for Convention/Entertainment Centers per Year $3,000,000Event Days per Year (Number of Events * Number of Participants) 210,375Spending per Day per Visitor $200New Spending by Visitors per Year $42,075,000
Methodology
The lack of data for some of the projects limits the analysis. Even for the
construction phase, most of the available data is lump sum funding allocated for an entire
project, not broken down into estimated expenses by category, for instance equipment
purchases or miscellaneous professional services. Data for some projects, such as planned
parking garages, is not yet available, and thus could not be included in the analysis.
This study therefore must be viewed keeping the following conditions in mind:
♦ It incorporates investments (construction and enhancement) in three main
transportation components - roads and highways, railways, and railway stations -
and estimates of subsequent investments in the professional services and
biotechnology sectors.
♦ The investments are timed using their estimated costs and duration of construction,
often simply estimated by dividing the total cost equally among the number of years
designated for the project except in the cases where more detailed data is available.
Most of these investments occur from 1999-2002, with the Pearl Harbor Memorial
Bridge expansion continuing until 2010. The subsequent investments are timed such
that the construction takes place over ten years beginning in 2001, after which
employment is gradually phased in over ten years beginning in 2011.
♦ The results reflect the estimated benefits of construction only in the case of rail and
highway improvements, and not the returns from the operation of the investments
once they are in place. This should be kept in mind when interpreting the results. A

34
drop in employment, for example, will typically reflect completion of a construction
project, not a negative longer run economic impact of the project itself.
♦ CCEA assumed all funding for these projects is “external”. This is because
presumably the investments in the transportation sector are funded federally or by
Amtrak, along with contributions from the State’s “Special Transportation Fund”.
We assume that subsequent investments are funded by the private sector. This
implies that the State does not cut spending elsewhere, raise taxes, or issue bonds to
pay for its share of expenses for these projects.
Results
This analysis identifies the impact of the proposed construction projects and
subsequent developments on a variety of economic variables, of which the most significant
are employment, gross regional product (GRP), personal income and population. The
following tables present the results for each of these variables in terms of their net impact
on the New Haven County economy over the period 2000-2030 under each investment
scenario. The tables that depict net increases in selected economic variables show the
average of the annual increases (or decreases) of these aggregate levels that flow directly
and indirectly from the proposed investment over thirty-two years compared to a baseline
(status quo) forecast of the (County) economy’s performance.

35
Scenario I - Maximum Build-out
TABLE III: Net Increases in Selected Economic Variables for New Haven CountyMaximum Build-out Strategy
2000-2030Average
Incremental LevelChange over
Baseline
AveragePercentageChange over
Baseline
Average BaselineLevel
Employment (Thousands) 145.01 28.70% 487.766GRP (Billions Nominal $) $20.28 28.47% $56.187Personal Income (Billions Nominal $) $15.86 25.82% $49.653Population (Thousands) 163.73 18.84% 834.514Future Housing Demand (Bill Nominal $) $6.58 0.72% $10.371
Each of the values in Table III shows the change in the relevant variable that flows
from completion of all components shown in Tables I and II compared to a baseline
forecast of the County’s economy. According to the maximum build-out approach adopted
in this analysis, the average annual increase in employment in New Haven County above
the status quo forecast due to the investments in transportation, professional services and
biotech industries is about 145,010 jobs. Figure 1, which shows the annual changes of the
above variables, illustrates how employment picks up in year 2000 when the construction
of the Pearl Harbor Memorial Bridge and the industrial complexes begin. Employment
gradually decreases as the construction projects are completed, then increases sharply from
2011 to 2020 as the employment opportunities created by the construction expansion are
filled. It peaks in year 2020 then settles to a stable level of approximately 266,000 jobs
above the baseline forecast. Thus at the end of the thirty-year period New Haven County
would have 270,000 additional permanent jobs in this scenario. Therefore, on average,
each year approximately 9,000 jobs are added cumulatively to the economy for thirty-two
years.
The average annual increase in GRP is $20.28 billion. Personal income in the
County increases by an average of $15.86 billion, and the average annual increase in the
County’s population over the thirty years is 163,732 people. GRP follows the same pattern
as employment - it first increases then decreases slightly as construction winds down,
before rising again with new employment. Personal income follows the GRP movement as

36
well, as workers are hired as construction increases, then furloughed as it is gradually
completed, before employment rises again in the expanded sectors. Population in the
County increases as the State’s new infrastructure and employment opportunities attracts
more residents. Future housing demand rises to a peak of $15.78 billion in 2020 as
employment in the County increases, and then decreases as employment stabilizes beyond
that as shown in Figure 1.
The study also evaluated the effects of the proposed investments in New Haven
County on State and local tax revenues. State taxes consist of income taxes, sales and use
taxes, and corporate profit taxes. Local property taxes are in New Haven County. Table
IV shows the average annual increase in tax revenues for the State and local governments
for the thirty one-year period beginning in 2000.
TABLE IV: Average Changes in Tax Revenues for New Haven CountyMaximum Build-out Strategy
(Millions Nominal $)2000-2030
Average Tax Revenue Change
Average New State Tax Revenue $923.74
Average New Local Property Taxes $519.92
Average Total New Taxes $1,443.66
State taxes increase by an annual average of $924 million due to the proposed
infrastructure developments and potential industry expansions. Local property taxes
increase by an average of $520 million. This is likely reflects the increase in population
as the improved transportation infrastructure, increased job opportunities, and increasing
investment in biotech industries attract more residents to the County. Figure 2 shows the
annual increases in tax revenues over the relevant time period, and that total tax revenue
follows the pattern of employment during the construction and expansion phase. To look at
the net gains in taxes for the State, total taxes are offset against induced government
spending. Induced government spending includes any expenses the State or Connecticut
towns incur as a result of the proposed investments. The most common reason for such
expenses is the increased spending for public services that arises because of an increase in
the County’s population. As expected, induced government spending closely follows the
population change pattern during the period of the study, resulting in a gradual decline in

37
net returns to the State as the County's population increases.
The net gains to the State can also be evaluated using the present values of the tax
revenues offset against the present value of net expenditures. Table V gives the present
values of both future tax collections and induced spending (over thirty-two years). The
present value of new taxes includes future income taxes, sales and use taxes, corporate
profit taxes, and local property taxes, which the project generates directly and indirectly.
These are then offset against the present value of induced government spending to compute
net tax revenues.
TABLE V: Present Value of New Tax Revenues and New ExpendituresMaximum Build-out Strategy
(Billions Nominal $)
REVENUES AND RELATED EXPENDITURES PRESENT VALUEPRESENT VALUE OF TOTAL NEW TAXES $14.09
PRESENT VALUE OF INDUCED NEW GOVT. SPENDING $9.62
PRESENT VALUE OF NET NEW TAXES $4.47
Because of the potential investments that can occur once the necessary
infrastructure is in place, the State benefits overall with the implementation of these
projects. Any additional spending induced by an increase in the County's population is
accounted for in the form of new tax revenues. The State thus earns net taxes with a present
value of $4.47 billion over the thirty-year period studied in this first scenario.

38
Scenario II - Minimum Build-out
TABLE VI: Net Increases in Selected Economic Variables for New Haven CountyMinimum Build-out Strategy
2000-2030Average
Incremental LevelChange over
Baseline
AveragePercentage
Change OverBaseline
AverageBaseline
Level
Employment (Thousands) 47.77 9.46% 487.766GRP (Billions Nominal $) $6.21 9.12% $56.187Personal Income (Billions Nominal $) $4.81 7.88% $49.653Population (Thousands) 51.14 5.89% 834.514Future Housing Demand (Bill Nominal $) $1.95 0.22% $10.371
Each of the values in Table VI shows the change in the relevant variable that flows
from completion of all components shown in Tables I and II compared to a baseline
forecast of the County’s economy. According to the minimum build-out approach adopted
in this analysis, the average increase in employment in New Haven County above the status
quo forecast due to the investments in transportation, professional services and biotech
industries is about 47,766 jobs. Figure 3 shows the annual changes of the above variables
and that there is an initial increase in employment that peaks in 2002, which is when most
construction projects are underway. This is followed by a gradual decline until 2010 as
most of these projects are completed. Starting in 2011 there is a steady rise in
employment, which reflects the newly created jobs in the professional services and
biotechnology sectors. Employment peaks in 2020 then declines to a stable level when all
construction is complete, settling at an average of 87,000 jobs over the baseline forecast.
Thus at the end of the thirty-two year period New Haven County would have 87,850
additional permanent jobs in this scenario. Therefore, on average, each year
approximately 2,834 jobs are added to the economy for thirty-one years.
The average increase in GRP is $6.21 billion. Personal income in the County
increases by an average of $4.81 billion, and the average increase in the County’s
population is 51,142 people. GRP follows the same pattern as employment - it first
increases then decreases slightly as construction winds down, before rising with new
employment. Personal income follows the GRP movement as well, as workers are hired

39
as construction increases, then furloughed as it is gradually completed, before employment
rises again with the expanded sectors. Population in the County increases as the State’s
new infrastructure and employment opportunities attract more residents. Demand for
housing follows the same pattern as employment as the new workers seek residences in the
County, peaking at $4.54 billion over the baseline then decreasing to $3.12 billion by
2030.
We evaluated the effects of the proposed investments in New Haven County on
state and local tax revenues for the minimum build-out scenario. State taxes and local
taxes are as above. Table VII shows the average annual increase (above the status quo
forecast) in tax revenues for the State and local governments for the thirty one-year period
beginning in 2000.
TABLE VII: Average Changes in Tax Revenues for New Haven CountyMinimum Build-out Strategy
(Millions Nominal $)2000-2030
Average Tax Revenue Change
Average New State Tax Revenue $281.68
Average New Local Property Taxes $161.39
Average Total New Taxes $443.07
State taxes increase by an average of $282 million due to the proposed
infrastructure developments and potential industry expansions. Local property taxes
increase by an average of $161 million. This is likely to reflect the increase in population
as the improved transportation infrastructure, increased job opportunities, and increasing
investment in biotech industries attract more residents to the County. Figure 4 shows the
annual change in tax revenues over the relevant time period and that total tax revenue
follows the pattern of employment during the construction and expansion phase. To look at
the net gains in taxes for the State, total taxes are offset against induced government
spending. Induced government spending includes any expenses the State or Connecticut
towns incur as a result of the proposed investments. The most common reason for such
expenses is the increased spending that arises because of an increase in the County’s
population. As expected, induced government spending closely follows the population

40
change pattern during the period of the study, resulting in a gradual decline in net returns to
the State as the County's population increases.
The net gains to the State can be evaluated using the present values of the tax
revenues offset against the present value of net expenditures. Table VIII gives the present
values of both future tax collections and induced spending (over thirty-one years). The
present value of new taxes includes future income taxes, sales and use taxes, corporate
profit taxes, and local property taxes, which the project generates directly and indirectly.
These are then offset against the present value of induced government spending to compute
net tax revenues.
TABLE VIII: Present Value of New Tax Revenues and New ExpendituresMinimum Build-out Strategy
(Billions Nominal $)
REVENUES AND RELATED EXPENDITURES PRESENT VALUEPRESENT VALUE OF TOTAL NEW TAXES $4.46
PRESENT VALUE OF INDUCED NEW GOVT. SPENDING $2.98
PRESENT VALUE OF NET NEW TAXES $1.49
As a result of the potential investments that can occur once the necessary
infrastructure is in place, the State benefits overall with the implementation of these
projects in the minimum build-out scenario. Any additional spending induced by an
increase in the County's population is accounted for in the form of new tax revenues. The
State thus earns net taxes with a present value of $1.49 billion over the thirty one-year
period studied in this scenario.

41
Scenario III - Moderate Build-out
TABLE IX: Net Increases in Selected Economic Variables for New Haven CountyModerate Build-out Strategy
2000-2030Average IncrementalChange over Baseline
AveragePercentage
Change OverBaseline
AverageBaseline Level
Employment (Thousands) 96.63 19.13% 487.766GRP (Billions Nominal $) $13.04 18.71% $56.187Personal Income (Billions Nominal $) $10.16 16.56% $49.653Population (Thousands) 106.80 12.29% 834.514
Future Housing Demand (Bill Nominal $) $4.24 4.34% $10.371
Each of the values in Table IX shows the average annual change in the relevant
variable that flows from completion of all components shown in Tables I and II compared
to a baseline (status quo) forecast of the County’s economy. According to the moderate
build-out approach adopted in this analysis, the average increase in employment in New
Haven County above the status quo forecast due to the investments in transportation,
professional services and biotech industries is about 96,630 jobs. Figure 5 shows the
annual changes of the above variables and shows that there is an initial increase in
employment that peaks in 2002, which is when most construction projects are underway.
This is followed by a gradual decline until 2010 as these projects are completed. Starting
in 2011 there is a steady rise in employment, which reflects the newly created jobs in the
professional services and biotechnology sectors. Employment peaks in 2020 then declines
to a stable level when all construction is complete, settling at an average increase of
178,000 jobs over the baseline. Thus at the end of the study period New Haven County
would have nearly 181,000 permanent new jobs. Therefore, on average, each year
approximately 5,839 jobs are added to the economy for thirty-one years.
The average annual increase in GRP is $13.04 billion. Personal income in the
County increases by an average of $10.16 billion, and the average increase in the County’s
population is 106,800 people. GRP follows the same pattern as employment - it first
increases then decreases slightly as construction winds down, before rising with the new
employment level. Personal income follows the GRP movement as well, as workers are

42
hired as construction increases, then furloughed as it is gradually completed, before
employment rises again with the expanded sectors. Population in the County increases as
the State’s new infrastructure and employment opportunities attracts more residents.
Demand for housing follows the same pattern as employment as the new workers seek
residences in the County, peaking at $9.97 billion over the baseline then decreasing to
$6.82 billion by 2030.
We evaluated the effects of the proposed investments in New Haven County on
State and local tax revenues as above. Table X shows the average annual increase in tax
revenues for the State and local governments for the thirty one-year period beginning in
2000.
TABLE X: Average Changes in Tax Revenues for New Haven CountyModerate Build-out Strategy
(Millions Nominal $)2000-2030
Average Tax Revenue Changes
Average New State Tax Revenue $592.80
Average New Local Property Taxes $338.76
Average Total New Taxes $931.56
State taxes increase by an average of $592.8 million due to the proposed
infrastructure developments and potential industry expansion. Local property taxes
increase by an average of $338.8 million. This is likely to reflect the increased
population as the improved transportation infrastructure, increased job opportunities, and
increasing investment in biotech industries attract more residents to the County. Figure 6
shows that total tax revenues follow the pattern of employment during the construction and
expansion phase. Total taxes offset against induced government yield net gains in taxes for
the State. Induced government spending includes any expenses the State or Connecticut
towns incur as a result of the proposed investments. The most common reason for such
expenses is the increased spending that arises because of an increase in the County’s
population. As expected, induced government spending closely follows the population
change pattern during the period of the study, resulting in a gradual decline in net returns to
the State as the County's population increases.

43
The net gains to the State can be evaluated using the present values of the tax
revenues offset against the present value of net expenditures as above. Table XI gives the
present values of both future tax collections and induced spending (over thirty-one years).
The present value of new taxes includes future income taxes, sales and use taxes, corporate
profit taxes, and local property taxes, which the project generates directly and indirectly.
These are then offset against the present value of induced government spending to compute
net tax revenues.
TABLE XI: Present Value of New Tax Revenues and New ExpendituresModerate Build-out Strategy
(Billions Nominal $)
REVENUES AND RELATED EXPENDITURES PRESENT VALUEPRESENT VALUE OF TOTAL NEW TAXES $9.31
PRESENT VALUE OF INDUCED NEW GOVT. SPENDING $6.30
PRESENT VALUE OF NET NEW TAXES $3.02
Because of the potential investments that can occur once the necessary
infrastructure is in place, the State again benefits overall with the implementation of these
projects. Any additional spending induced by an increase in the County's population is
accounted for in the form of new tax revenues. The State thus earns net taxes with a
present value of $3.02 billion over the thirty-year period studied in this scenario.

44
Scenario IV - Current Office Space Growth Trend
TABLE XII: Net Increases in Selected Economic Variables for New Haven CountyCurrent Office Space Growth Trend
2000-2030Average Incremental
Change overBaseline
AveragePercentage
Change OverBaseline
AverageBaseline Level
Employment (Thousands) 9.75 0.123% 487.766GRP (Billions Nominal $) $1.06 0.087% $56.187Personal Income (Billions Nominal $) $0.86 0.171% $49.653Population (Thousands) 11.84 0.134% 834.514Future Housing Demand (Bill Nominal $) $0.27 0.031% $10.371
Each of the values in Table XII shows the average annual change in the relevant
variable that flows from completion of all components shown in Tables I and II compared
to a baseline (status quo) forecast of the County’s economy. According to the current
office space growth trend approach adopted in this analysis, the average increase in
employment in New Haven County above the status quo forecast due to the investments in
transportation, professional services and biotech industries is about 9,750 jobs. Figure 7
shows the annual changes of the above variables and shows that starting in 2000 there is a
steady rise in employment that peaks in 2010 and drops off indicating the completion of the
Pearl Harbor Memorial Bridge project in that year. Employment increases again in 2012
and remains stable through the end of the study period. Thus in 2030 New Haven County
would have nearly 12,030 permanent new jobs. Therefore, on average, each year
approximately 388 jobs are added to the economy for thirty-one years.
The average increase in GRP is $1.06 billion. Personal income in the County
increases by an average of $0.86 billion, and the average increase in the County’s
population is 11,841 people. GRP follows the same pattern as employment. Personal
income follows the GRP movement as well, as workers are hired as construction
increases, then furloughed as it is completed, before employment rises again with the
expanded office and lab space. Population in the County increases as the State’s new
infrastructure and employment opportunities attract more residents. Housing demand

45
increases to a peak of $360 million in 2012 and remains stable after that, reflecting the
stable employment patterns generated by the expanded professional and biotech sectors.
We evaluated the effects of the proposed investments in New Haven County on
State and local tax revenues as above. Table XIII shows the average annual increase in tax
revenues for the State and local governments for the thirty one-year period beginning in
2000.
TABLE XIII: Average Changes in Tax Revenues for New Haven CountyCurrent Office Space Growth Trend
(Millions Nominal $)2000-2030
Average Tax Revenue Changes
Average New State Tax Revenue $49.15
Average New Local Property Taxes $33.64
Average Total New Taxes $82.79
State taxes increase by an average of $49.15 million due to the proposed
infrastructure developments and potential industry expansion. Local property taxes
increase by an average of $33.64 million. This reflects the increased population as the
improved transportation infrastructure, and increased job opportunities attract more
residents to the County. Figure 8 shows that total tax revenue follow the pattern of
employment during the construction phase then continues to increase. Total taxes offset
against induced government yield net gains in taxes for the State. Induced government
spending includes any expenses the State or Connecticut towns incur as a result of the
proposed investments. The most common reason for such expenses is the increased
spending that arises because of an increase in the County’s population. As expected,
induced government spending closely follows the population change pattern during the
period of the study. As a result of increasing tax revenues net taxes remain stable in the
State with only slight increases and decreases periodically.
The net gains to the State can be evaluated using the present values of the tax
revenues offset against the present value of net expenditures as above. Table XIV gives the
present values of both future tax collections and induced spending (over thirty-one years).
The present value of new taxes includes future income taxes, sales and use taxes, corporate
profit taxes, and local property taxes, which the project generates directly and indirectly.

46
These are then offset against the present value of induced government spending to compute
net tax revenues.
TABLE XIV: Present Value of New Tax Revenues and New ExpendituresCurrent Office Space Growth Trend
(Billions Nominal $)
REVENUES AND RELATED EXPENDITURES PRESENT VALUEPRESENT VALUE OF TOTAL NEW TAXES $1.01
PRESENT VALUE OF INDUCED NEW GOVT. SPENDING $0.74
PRESENT VALUE OF NET NEW TAXES $0.27
The State benefits overall if the current growth trend continues with the
infrastructure investments. Any additional spending induced by an increase in the County's
population is accounted for in the form of new tax revenues. The State thus earns net taxes
with a present value of $268 million over the thirty one-year period studied in this
scenario.
Scenario V - 2.5 Million Square Feet Lab Space
TABLE XV: Net Increases in Selected Economic Variables for New Haven County2.5 Million Sq. Ft. Lab Space Strategy
2000-2030Average IncrementalChange over Baseline
AveragePercentage
ChangeOver
Baseline
AverageBaseline
Level
Employment (Thousands) 10.72 0.205% 487.766GRP (Billions Nominal $) $1.89 0.151% $56.187Personal Income (Billions Nominal $) $0.97 0.244% $49.653Population (Thousands) 11.93 0.196% 834.514Future Housing Demand (Bill Nominal $) $0.30 0.04% $10.371
Each of the values in Table XV shows the average annual change in the relevant
variable that flows from completion of all components shown in Tables I and II compared
to a baseline (status quo) forecast of the County’s economy. According to the additional
2.5 million square feet lab space approach adopted in this analysis, the average increase
in employment in New Haven County above the status quo forecast due to the investments

47
in transportation and biotech industries is about 10,720 jobs. Figure 9 shows the annual
changes of the above variables and shows that there is an initial increase in employment
that peaks at 13,380 in 2007, after which there is a gradual decline until 2011, when the
Pearl Harbor Memorial Bridge is completed. Employment remains stable and gradually
increases after 2011. Thus at the end of the study period New Haven County would have
nearly 12,890 permanent new jobs. Therefore, on average, each year approximately 416
jobs are added to the economy for thirty-one years.
The average annual increase in GRP is $1.89 billion. Personal income in the
County increases by an average of $0.97 billion, and the average increase in the County’s
population is 11,930 people. GRP follows the same pattern as employment through 2011,
after which it increases to $3.5 billion in 2030. Personal income follows the GRP
movement as well, rising as the biotech sector expands. Population in the County increases
as the State’s new infrastructure and employment opportunities attracts more residents.
Housing demand closely follows the employment trend as workers new to the state seek
residences, and it reaches a level of $352 million in 2030.
We evaluated the effects of the proposed investments in New Haven County on
State and local tax revenues as above. Table XVI shows the average annual increase in tax
revenues for the State and local governments for the thirty one-year period beginning in
2000.
TABLE XVI: Average Changes in Tax Revenues for New Haven County2.5 Million Sq. Ft. Lab Space Strategy
(Millions Nominal $)2000-2030
Average Tax Revenue Changes
Average New State Tax Revenue $72.33
Average New Local Property Taxes $33.20
Average Total New Taxes $105.53
State taxes increase by an average of $72.33 million due to the proposed
infrastructure developments and potential industry expansion. Local property taxes
increase by an average of $33.2 million. This is likely to reflect the increased population
as the improved transportation infrastructure, increased job opportunities, and increasing
investment in biotech industries attract more residents to the County. Figure 10 shows that

48
total tax revenues follow the pattern of employment during the initial construction and
expansion phase. Total taxes offset against induced government yield net gains in taxes for
the State. Induced government spending includes any expenses the State or Connecticut
towns incur as a result of the proposed investments. The most common reason for such
expenses is the increased spending that arises because of an increase in the County’s
population. As expected, induced government spending closely follows the population
change pattern during the period of the study. As a result of increasing tax revenues net
taxes remain stable in the State with only slight increases and decreases periodically.
The net gains to the State can be evaluated using the present values of the tax
revenues offset against the present value of net expenditures as above. Table XVII gives
the present values of both future tax collections and induced spending (over thirty-one
years). The present value of new taxes includes future income taxes, sales and use taxes,
corporate profit taxes, and local property taxes, which the project generates directly and
indirectly. These are then offset against the present value of induced government spending
to compute net tax revenues.
TABLE XI: Present Value of New Tax Revenues and New Expenditures2.5 Million Sq. Ft. Lab Space Strategy
(Billions Nominal $)
REVENUES AND RELATED EXPENDITURES PRESENT VALUEPRESENT VALUE OF TOTAL NEW TAXES $1.318
PRESENT VALUE OF INDUCED NEW GOVT. SPENDING $755.5
PRESENT VALUE OF NET NEW TAXES $562.3
Because of the potential investments that can occur once the necessary
infrastructure is in place, the State again benefits overall with the implementation of these
projects. Any additional spending induced by an increase in the County's population is
accounted for in the form of new tax revenues. The State thus earns net taxes with a present
value of $562.3 million over the thirty-year period studied in this scenario.

49
SPILLOVER EFFECTS OF INFRASTRUCTURE DEVELOPMENTS IN NEW
HAVEN REGION
This analysis also presents the economic impacts of infrastructure improvements on
the local area of New Haven and its surrounding towns under each scenario mentioned
above. Based on the commuter share of each town in total employment in New Haven
weighted by per capita income in each town, this analysis computes the spillover effect of
infrastructure improvements in New Haven on the towns of Hamden, West Haven, East
Haven, North Haven, Branford, Guilford, Wallingford, and, Milford. These eight towns
were selected as they have the largest number of workers commuting into New Haven City
of all the fifteen towns in the County. The spillover effects are measured in terms of
employment, GRP, personal income, population, and housing demand in each town. The
following tables present the spillover effects under the five different scenarios.
(1) Maximum Build-out Scenario
Table 1: Net Changes in Selected Economic VariablesMaximum Build-out Scenario
Average Change over Baseline (2000-2030)
New HavenLocal
Hamden WestHaven
EastHaven
NorthHaven
Branford Guilford Wallingford Milford
Employment
(Thousands)
5.1471 1.8080 1.0699 0.7818 0.4736 1.0086 0.6113 0.3821 0.3349
GRP
(Mill. Nom $)
719.8 252.8 149.6 109.3 66.2 141.0 85.5 53.4 46.8
Personal Income
(Mill. Nom $)
563.0 197.7 117.0 85.5 51.8 110.3 66.9 41.8 36.6
Population
(Thousands)
5.8117 2.0414 1.2080 0.8827 0.5347 1.1388 0.6902 0.4314 0.3781
Housing Demand
(Mill Nom $)
233.6 82.1 48.6 35.5 21.5 45.8 27.7 17.3 15.2
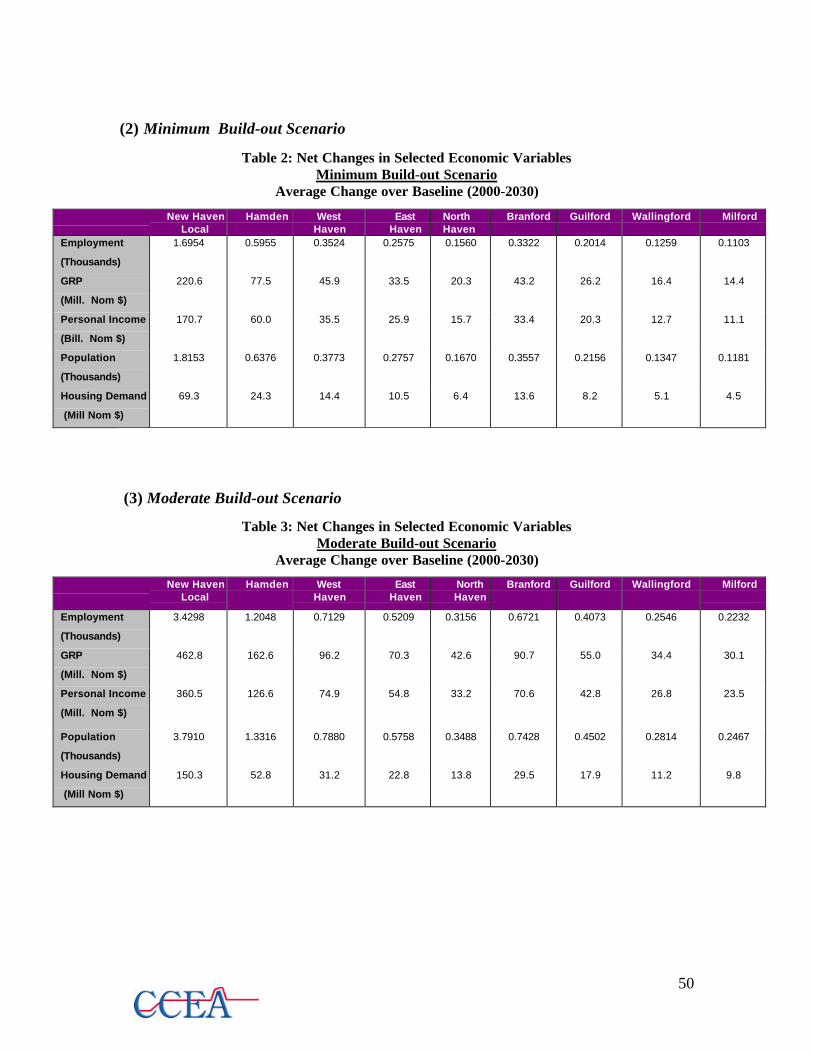
50
(2) Minimum Build-out Scenario
Table 2: Net Changes in Selected Economic VariablesMinimum Build-out Scenario
Average Change over Baseline (2000-2030)
New HavenLocal
Hamden WestHaven
EastHaven
NorthHaven
Branford Guilford Wallingford Milford
Employment
(Thousands)
1.6954 0.5955 0.3524 0.2575 0.1560 0.3322 0.2014 0.1259 0.1103
GRP
(Mill. Nom $)
220.6 77.5 45.9 33.5 20.3 43.2 26.2 16.4 14.4
Personal Income
(Bill. Nom $)
170.7 60.0 35.5 25.9 15.7 33.4 20.3 12.7 11.1
Population
(Thousands)
1.8153 0.6376 0.3773 0.2757 0.1670 0.3557 0.2156 0.1347 0.1181
Housing Demand
(Mill Nom $)
69.3 24.3 14.4 10.5 6.4 13.6 8.2 5.1 4.5
(3) Moderate Build-out Scenario
Table 3: Net Changes in Selected Economic VariablesModerate Build-out Scenario
Average Change over Baseline (2000-2030)
New HavenLocal
Hamden WestHaven
EastHaven
NorthHaven
Branford Guilford Wallingford Milford
Employment
(Thousands)
3.4298 1.2048 0.7129 0.5209 0.3156 0.6721 0.4073 0.2546 0.2232
GRP
(Mill. Nom $)
462.8 162.6 96.2 70.3 42.6 90.7 55.0 34.4 30.1
Personal Income
(Mill. Nom $)
360.5 126.6 74.9 54.8 33.2 70.6 42.8 26.8 23.5
Population
(Thousands)
3.7910 1.3316 0.7880 0.5758 0.3488 0.7428 0.4502 0.2814 0.2467
Housing Demand
(Mill Nom $)
150.3 52.8 31.2 22.8 13.8 29.5 17.9 11.2 9.8
51
(4) Current Office Space Growth Trend Approach
Table 4: Net Changes in Selected Economic VariablesCurrent Office Space Growth Trend ApproachAverage Change over Baseline (2000-2030) e
New HavenLocal
Hamden WestHaven
EastHaven
NorthHaven
Branford Guilford Wallingford Milford
Employment
(Thousands)
0.3462 0.1216 0.0720 0.0526 0.0318 0.0678 0.0411 0.0257 0.0225
GRP
(Mill. Nom $)
37.8 13.3 7.9 5.7 3.5 7.4 4.5 2.8 2.5
Personal Income
(Mill. Nom $)
30.4 10.7 6.3 4.6 2.8 6.0 3.6 2.3 2.0
Population
(Thousands)
0.4203 0.1476 0.0874 0.0638 0.0387 0.0824 0.0499 0.0312 0.0273
Housing Demand
(Mill Nom $)
9.4 3.3 2.0 1.4 0.9 1.8 1.1 0.7 0.6
(5) 2.5 Million Square Feet Lab Space Approach
Table 5: Net Changes in Selected Economic Variables2.5 Million Square Feet Lab Space ApproachAverage Change over Baseline (2000-2030))
New HavenLocal
Hamden WestHaven
EastHaven
NorthHaven
Branford Guilford Wallingford Milford
Employment
(Thousands)
0.3806 0.1337 0.0791 0.0578 0.0350 0.0746 0.0452 0.0283 0.0248
GRP
(Mill. Nom $)
67.1 23.6 14.0 10.2 6.2 13.2 8.0 5.0 4.4
Personal Income
(Mill. Nom $)
34.3 12.1 7.1 5.2 3.2 6.7 4.1 2.5 2.2
Population
(Thousands)
0.4236 0.1488 0.0880 0.0643 0.0390 0.0830 0.0503 0.0314 0.0276
Housing Demand
(Mill Nom $)
10.6 3.7 2.2 1.6 1.0 2.1 1.3 0.8 0.7

52
IMPACT OF ENHANCED RAIL SERVICE ON TRAIN RIDERSHIP IN
CONNECTICUT
The next step of the analysis is to project the change in commuter rail ridership in
Connecticut induced by the increased investment in rail infrastructure in New Haven
County. The ridership projection is based on the assumptions that the infrastructure
improvement in New Haven County would improve the quality of service, travel time, and
frequency of trips of all three rail service providers; Shore Line East, Metro-North, and
Amtrak. It is reasonable to assume that improvement in rail service and frequency of train
trips would stimulate additional demand for rail service in Connecticut.
In order to estimate the potential change in train ridership in Connecticut following
the completion of rail infrastructure improvements in New Haven County, we take into
account primarily three factors: change in travel time; additional number of trains or
frequency of service; and rail fares. Using an elasticity of ridership with respect to train
speed, fares, and the number of trains (frequency), CCEA projects the change in ridership
for Amtrak, Metro-North and Shore Line East7. CCEA also projects the increase in train
ridership in Connecticut in the short and long runs. The short run forecast is considered to
be within the first two years after completion of all rail infrastructure development projects
in New Haven County. The long run can be considered as the period beyond the first two
years after completion of the projects. Estimated train ridership in Connecticut is based on
the following assumptions.
Assumptions:
(1) Shore Line East will increase the current number of trains by 25%. This information
was provided by Shore Line East Rail Operation. Similarly, Metro-North will
increase the number of trains by 6.5% and Amtrak will double the current number of
trains from 9 (7 Northeast direct and 2 Acela Express) to 17 (7 Northeast and 10 Acela
Express). Any changes in these numbers will change the ridership estimates.
(2) Following the rail infrastructure improvements in New Haven County, the speed of
Shore Line East trains will increase their current average speed from 50 to 55 mph.
Similarly, the average speed of Metro-North will increase from 80 mph to 90 mph.
7 The computation of elasticity for the number of trains, speed, and fare is based on Voith (1995).

53
The average speed of Amtrak trains will increase from 80 mph to 120 mph, primarily
due to Acela.
(3) Finally, this analysis assumes that there will be an average increase in the fares of all
the three train services by 3%.
Table A below shows the short run results of infrastructure improvements on ridership
based on Voith (1995). Table B depicts the long run results. Charts 1 through 3 show the
ridership forecasts for Shore Line East, Metro-North and Amtrak.
Table. ASHORT RUN (first 2 years) Ridership Forecast
VariablesElasticity Current
LevelProjected(Change
%)
CurrentRidership
Level
ProjectedRidership
Level
ProjectedChange inRidership
(%)SHORE LINE EASTNo. of Trains(Units) 0.184 8 10 (25%)Speed (MPH) 0.123 50 55 (10%)Round Trip Fare -0.592 $ 7.75 $7.98 (3%)
272,624 283,695 + 4.06%
METRO-NORTHNo. of Trains(Units) 0.184 244 260 (6.5%)Speed (MPH) 0.123 80 90 (12.5%)Round Trip Fare -0.592 $22.5 $23.20 (3%)
35,000,000 35,340,584 + 0.90%
AMTRAKNo. of Trains(Units) 0.184 9 17 (89%)Speed (MPH) 0.123 80 120 (50%)Round Trip Fare -0.592 NA 3%
884,860 1,068, 593 +20.07%
Table. B
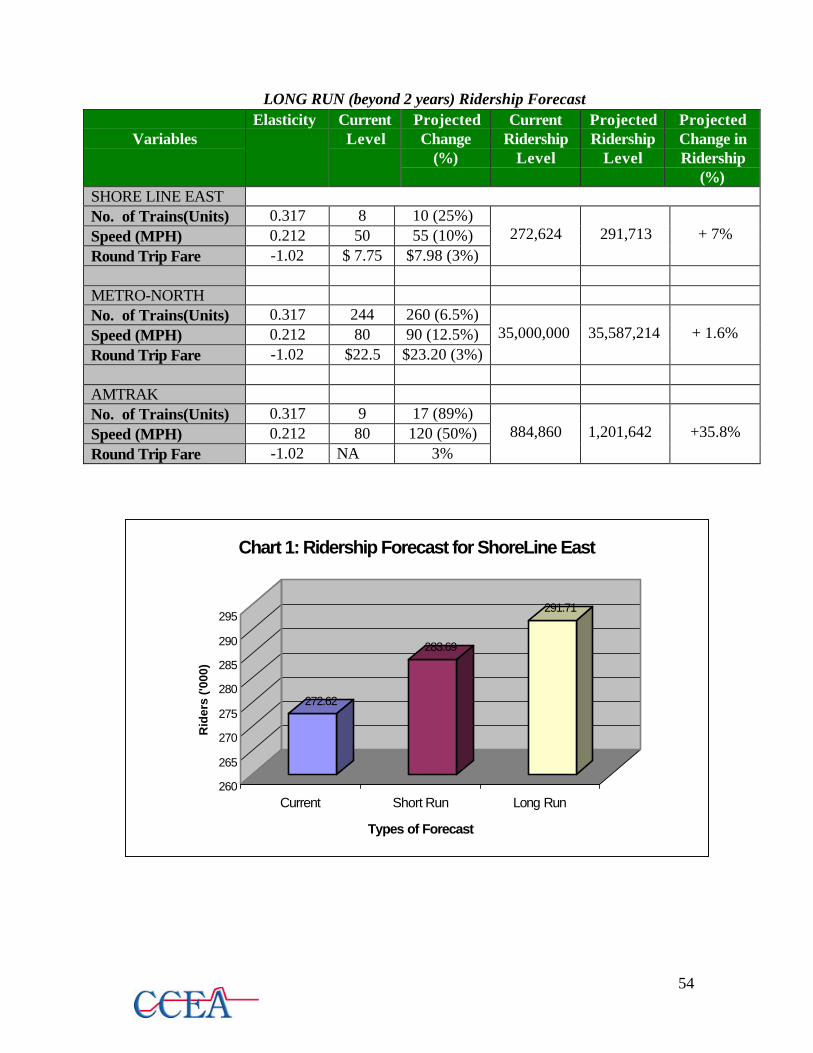
54
LONG RUN (beyond 2 years) Ridership Forecast
VariablesElasticity Current
LevelProjectedChange
(%)
CurrentRidership
Level
ProjectedRidership
Level
ProjectedChange inRidership
(%)SHORE LINE EASTNo. of Trains(Units) 0.317 8 10 (25%)Speed (MPH) 0.212 50 55 (10%)Round Trip Fare -1.02 $ 7.75 $7.98 (3%)
272,624 291,713 + 7%
METRO-NORTHNo. of Trains(Units) 0.317 244 260 (6.5%)Speed (MPH) 0.212 80 90 (12.5%)Round Trip Fare -1.02 $22.5 $23.20 (3%)
35,000,000 35,587,214 + 1.6%
AMTRAKNo. of Trains(Units) 0.317 9 17 (89%)Speed (MPH) 0.212 80 120 (50%)Round Trip Fare -1.02 NA 3%
884,860 1,201,642 +35.8%
272.62
283.69
291.71
260
265
270
275
280
285
290
295
Rid
ers
('000
)
Current Short Run Long Run
Types of Forecast
Chart 1: Ridership Forecast for ShoreLine East

55
35000
35341
35587
34700
34800
34900
35000
35100
35200
35300
35400
35500
35600
No
. of
Rid
ers
('000
)
Current Short Run Long Run
Types of Forecast
Chart 2: Ridership Forecast for MetroNorth
884 .86
1 0 6 91 2 0 2
0
200
400
600
800
1 0 0 0
1 2 0 0
1 4 0 0
No
. of
Rid
ers
('000
)
C u r r e n t S h o r t R u n L o n g R u n
T y p e s o f F o r e c a s t
Char t 3 : R i d e r s h i p F o r e c a s t f o r A m t r a k

56
IMPACT OF ENHANCED RAIL SERVICE AND BUILD-OUT SCENARIOS ON
TRAIN RIDERSHIP IN NEW HAVEN COUNTY
The estimates of increased train ridership in the above section are based on the
improvements to rail service in New Haven County without respect of the build-out
scenarios. The ridership estimates in this section account for the increases in employment
that result from the five build-out scenarios. In each case, ridership is assumed to increase
in proportion to the increases in employment. The baseline is the long-run projected
ridership level that results from the enhanced rail service listed in Table B above.
Table C: Rail Ridership Consequences of Build-out Scenarios
Maximum Build- outScenario
Minimum Build-outScenario
Moderate Build-outScenario
Current OfficeSpace Scenario
2.5M additional OfficeSpace Scenario
Rail ServiceProvider(BaselineRidership)
%Change
ProjectedRidership
%Change
ProjectedRidership
%Change
ProjectedRidership
%Change
ProjectedRidership
%Change
ProjectedRidership
Shore LineEast(291,713) 28.70% 375,435 9.46% 319,309 19.13% 347,518 0.123% 292,072 0.205% 292,311Metro-North
(35,587,214) 28.70% 45,800,744 9.46% 38,953,764 19.13% 42,395,048 0.123% 35,630,986 0.205% 35,660,168Amtrak
(1,201,642) 28.70% 1,546,513 9.46% 1,315,317 19.13% 1,431,516 0.123% 1,203,120 0.205% 1,204,105
RESULTS:
Our analysis estimates that the total train ridership in Connecticut will increase by
535,389 in the short run and 923,084 in the long run following the completion of
infrastructure improvements in New Haven County. Of the total increase, the ridership on
Shore Line East will increase by 4.06% from current annual ridership of 272,624 to
283,695 in the short run. In the long run, the ridership on Shore Line East will increase by
7%. The estimates show that the total annual ridership for Shore Line East will be
approximately 291,713 in the long run. Under the five build-out scenarios, long run
ridership on Shore Line East increases to a minimum level of 292,072 under the “current
office space growth trend” scenario, to a maximum level of 375, 435 under the “maximum
build-out” scenario. As mentioned earlier, these results are based on the assumption that

57
Shore Line East increases its speed from 50 mph to 55 mph. In addition, we assume Shore
Line East also increases the frequency of trips by increasing the current number of trains
from 8 trains to 10 trains per day.
Our estimates show that the train ridership of Metro-North will increase by 0.90%
in the short run currently from 35 million to 35.4 million. In the long run, Metro-North’s
ridership will increase by 1.6% to approximately 35.587 million per year. Under the five
build-out scenarios, long run ridership on Metro-North increases to a minimum level of
35,630,986 under the “current office space growth trend” scenario, to a maximum level of
45,800,744 under the “maximum build-out” scenario. These estimates are based on the
assumptions that the infrastructure improvements in New Haven will allow Metro-North to
increase its current speed of 80 mph to 90 mph and to increase the number of trains from
244 to 260 per day.
Our estimate also shows that the infrastructure improvements in New Haven have a
significant impact on Amtrak’s ridership. Our analysis shows that Amtrak’s ridership will
increase from the current level of 884,860 to 1.068 million in the short run, or
approximately 20%. Similarly, in the long run, Amtrak’s ridership of Amtrak will
increase almost by 36% to 1,201,642. Under the five build-out scenarios, long run
ridership on Amtrak increases to a minimum level of 1,203,120 under the “current office
space growth trend” scenario, to a maximum level of 1,546,513 under the “maximum build-
out” scenario. This relatively higher increase in Amtrak’s ridership can be attributed to
Amtrak’s plan to increase the number of trains and the speed relatively higher than that of
Shore Line East and Metro-North. Amtrak plans to double the number of trains from 9 to
17 and increase the speed almost by 50% from 80 mph to 120 mph in near future.

58
TRANSPORTATION AND LOCAL ECONOMIC DEVELOPMENT
This section looks at whether transportation sector improvements serve as an
engine of growth for economic development. There are a number of empirical studies that
have been undertaken to examine the effects of the transportation sector on local economic
developments, and Button, Leitham, McQuaid and Nelson (1995) summarize several of
these studies. Based mainly in the United Kingdom and the United States, these studies
cover many types of transportation improvements, ranging from expansions on existing
highways to high-speed rail. The results are mixed, and range from little or no significant
effects to some increases in employment and positive effects on real estate and firm
location decisions. For example, Eagle and Stephanedes (1987) found no increase in
employment in their study on new highway expenditures in eighty-seven U.S. counties.
Langley (1981) found that highway corridors devalued residential property in the area,
compared to residential property located further from the highway. His study was based
on residential property in North Springfield, Virginia, and it concluded that highway-
originated environmental externalities were the major cause of an inverse relationship
between increases in North Springfield property resale values and proximity to I-495. On
the other hand, Forrest et al (1992) found that light rapid transit developments in
metropolitan areas in the U.S. stimulated urban renewal. Pickett (1984) found that light
rapid transit developments in local districts in the U.K. benefited properties in the area.
Hansen (1965) argued that the impacts of transportation sector improvements
depend on the type of area under consideration. He classifies regions into three categories
in terms of the level of benefits they are likely to obtain. Infrastructure spending has the
greatest potential to improve conditions in areas he terms “intermediate”. These are areas
that already have other development characteristics in place and operating, and lack only
adequate infrastructure. Transportation sector improvements in such areas are therefore
likely to benefit the local economy by increasing efficiency without incurring high
congestion costs. Areas he terms “congested” can see some improvement, mostly in terms
of higher productivity or increased local incomes during construction, but will also
increase population and congestion, so the benefits must outweigh these costs. He terms
areas that will benefit the least from infrastructure developments as “lagging” regions.

59
These are areas that lack a variety of other components needed for economic development,
such as a skilled labor force and proximity to markets. Transportation sector
improvements are unlikely to be enough to overcome these inadequacies and therefore will
have a minimal impact on the local economy.
While it is appealing to classify regions into one of these three categories to gauge
possible impacts before undertaking any infrastructure developments, it is difficult to tell
with certainty what category a region may fall in to. It is also hard to define the size of the
appropriate region in the first place. Another limit to this theory is that it does not
acknowledge some types of investment that may attract missing development components to
an area that is lacking them, or ease congestion in an already congested area. High-speed
rail can be an example of such an investment (Thompson and Bawden, 1992). Some
transportation sector improvements may therefore break through restrictions in the area
under consideration, such as congestion or underdevelopment, and result in higher-than-
expected economic growth.
Princeton Corridor Economic Development
The Route 1 highway in New Jersey that connects New Brunswick to Trenton
through Princeton, also known as the Princeton Corridor, is an example of an area that has
seen major transportation improvements in recent years. This stretch of highway covers
approximately 30 miles. Most improvements in this area have been in highway access,
with little rail development. The region has seen a large number of firms locate along the
improved highway, including retail, commercial office space and the pharmaceutical
sector, with many more pending. A partial list of these developments in Mercer County
(which includes Princeton and Trenton) is shown in the table below.

60
Name of Development Type Size(square feet)
Status
The Square at West Windsor Shopping Center 216,700 Proposed
Carnegie Center II Building502 for Raytheon Corp.
Office Park 106,500 Built
Carnegie Center West Building901
Office Park 130,000 Approved
Marriott Towne Place Suites Hotel 143 rooms Approved
Other developments include a proposed hotel on Route 1, the Lawrence Auto Mall
(includes three large auto campuses featuring three auto companies), four existing shopping
centers, and the proposed 500,000 square foot expansion of an existing office park into
seven floors.

61
CONCLUSIONS
This study is an analysis of the economic impact of the railway and highway
infrastructure developments and industry investments, specifically in biotech and
professional services, for the State of Connecticut and New Haven County. The
developments in the professional services and biotechnology sectors serve to illustrate the
economic potential of such investments and the benefits to the State and County once they
are in place.
Once completed, the enhanced rail and highway system will dramatically improve
Connecticut’s infrastructure. The economic benefits of an improved transportation system
will be numerous. For example, highway developments will increase trucking efficiency,
reduce commuter travel time and congestion, and reduce accidents and pollution. Rail
investments will decrease travel time and costs by diverting passengers from auto and air
travel, increase productivity, and reduce air and road congestion and pollution. Overall,
improvements in the existing transportation system will create job opportunities, encourage
tourism, increase transportation capacity, and create an environment more inviting to
business retention, expansion and the attraction of new businesses to New Haven County.
The subsequent investments included in this report demonstrate this potential.

62
APPENDIX
Spillover Effect Methodology
More than fifty percent of employees in New Haven consists of commuters from its
surrounding towns. These towns include Hamden, West Haven, East Haven, Branford,
North Haven, Guilford, North Haven, Wallingford, Milford, and, North Branford. This
analysis presents a simple methodology to measure the spillover effects of railroad
infrastructure improvement in New Haven on its neighboring towns. The change in income
of a town may reflect the spillover effect or economic impact in that town induced by any
external or internal economic shocks. This analysis uses commuter share of each town in
the total employment in New Haven as a basis to measure the spillover effects in that town.
To avoid income bias, the share of each town in total employment in New Haven is
weighted by per capita income of that town.
Mathematically,
where,
∆Yi = Spillover effect in town i represented by change in income
∆YNH = Change in income in New HavenSi = Commuter share of town i in total employment in New HavenSj = Commuter share of town j in total employment in New HavenYi = Per capita income in town iYj = Per capita income in town j
NHY
YjS
YSY
jj
iii ∆=∆
∑*
)*(
*

63
REFERENCES
Arduin, Jean-Pierre (1994), “Development and Economic Evaluation of High Speed in
France,” Japan Railway and Transport Review, October, No. 3
Aschauer, D. (1989), “Is Public Expenditure Productive?”, Journal of Monetary
Economics, 23 (2), March, pp. 177-200.
Aschauer, D. (1990), “Why is Infrastructure Important?” in Is there a Shortfall in Public
Capital Investment? Proceedings of a conference, Federal Reserve Bank of
Boston.
Arsen, David (1997), “Is there Really an Infrastructure/Economic Development Link?” in
R. Bingham and R. Mier eds, Dilemmas of Urban Economic Development, Urban
Affairs Annual Reviews 47, Sage Publications.
Amano K, Nakagawa, D (1990), Study on Urbanization Impacts by New Stations of High
Speed Railway. Conference of Korean Transportation Association, Dejeon City.
Bonnafus, A. (1987), “The Regional Impact of the TGV”, Transportation, 14(2),
pp.127-137.
Brotchie, J. (1991), Fast Rail Networks and Socioeconomic Impacts in Brotchie, Batty,
Hall, and Newton (eds.) Cities of the 21st Century: New Technologies and Spatial
Systems, Longman Cheshire, New York, pp. 25-37.
Button, K. J., Leitham, S., McQuaid, R.W., and Nelson, J.D. (1995) “Transport and
Industrial Commercial Location”, The Annals of Regional Science, 29:189-206.

64
Cheshire, P. (1995), The Spatial Implications of Motor way and Train Corridors in
Europe, Paper presented at workshop on Regional and Urban effects of High
Speed Trains organized by Jonkoping International Business School.
Eagle, D., and Stephanedes, Y.J. (1987), “Dynamic Highway Impacts on Economic
Development”, Transportation Research Records 1116:56-62.
Eberts, R. (1991), “Some empirical evidence on the linkage between public
infrastructure and local economic development,” in H. Herzog and A.
Schlottmand (eds.), Industrial Location and Public Policy (pp. 83-96).
Knoxville:University of Tennessee Press.
Erickson, R., and Wasylenko, M., (1980), “Firm Relocation and Site Selection in
Suburban Municipalities”, Journal of Urban Economics, Vol. 8, pp. 69-85.
Federal Highway Administration, (1992), Assessing the Relationship Between
Transportation Infrastructure and Productivity, Policy Discussion Series No. 4
(August), Washington DC.
Federal Railroad Administration (1990), Moving America-New Direction, New
Opportunities: Assessment of the Potential for Magnetic Levitation
Transportation in the U.S. A Report to Congress, U.S Department of
Transportation Federal Railroad Administration, June.
Forrest, D., Glen, J. and Ward, R. (1992), “Both Sides of the Track are Wrong: A Study on
the Effect of an Urban Railway System on the Pattern of House Prices”, Proceeds
of the UTSG 24th Annual Conference, University of Newcastle-upon-Tyne.

65
Fox, W. and Murray, M. (1990), “The Effects of Local Government Public Policies on
the Location of Business Activity,” in H. Herzog and A. Schlottmand (eds.),
Industrial Location and Public Policy (pp. 97-119). Knoxville:University of
Tennessee Press.
Freidheim, Cyrus F. Jr, and Hansson, B. Thomas (1999), “Airports as Engines of
Economic Development”, Booz-Allen & Hamilton Inc., http://www.strategy-
business.com/policy/99308/
Garcia-Mila, T., and McGuire, T. (1992). “The contribution of publicly provided inputs
to the states’ economies,” Review of Economics and Statistics, pp. 47-58.
Hagiwara, Shun’chi, (1982), “Impacts of a Regional High-Speed Intercity Passenger
Train System on Small Metropolitan Communities: A Case Study- The Lansing
Metropolitan Area, Michigan,” Doctoral Dissertation, Michigan State University,
March 15.
Hansen, N. (1965), “Unbalanced Growth and Regional Development”, Western Economic
Journal, (Fall, 1965), 4:3-14.
Harmatuck, D. (1996) “The Influence of Transportation Infrastructure on Economic
Development”, Logistics and Transportation Review, Vol. 32, March pages 63-
76.
Haynes, K., (1997), "Labor Market and regional transportation improvements: the case of
high-speed trains" Annals of Regional Science, Vol. 31. pp. 57-76.
Hirota, R. (1984), Present situation and Effects of the Shinkansen. Paper presented to the
International Seminar on High-Speed Trains, Paris, November.

66
Johnson, L. (1990), "Putting Maglev on Track," Issues in Science and Technology,
Spring, pp. 71-76.
Keeler, T. and Ying, J.S., (1992), “Measuring Benefits of Large Public Investment: The
case of the U.S. Federal-Aid Highway System,” Journal of Public Economics,
36,pp. 69-85.
Langley, C. J. (1981), “Highways and Property Values: The Washington Beltway
Revisited”, Transportation Research Records 812:16-21.
Morrison, C., and Schwartz, E., (1996), “State Infrastructure and Productive
Performance", The American Economic Review, December, pp.1095-1111.
Munnell, A. (1990), “How Does Public Infrastructure Affect Regional Economic
Performance”, in Is there a Shortfall in Public Capital Investment?, Proceedings
of a conference, Federal Reserve Bank of Boston.
Nakamura, H., and Ueda, T. (1989), “The Impacts of Shinkansen on Regional
Development, in The Fifth World Conference on Transport Research,
Yokohama, Vol. III. Western Periodicals, Ventura, California.
Okabe, S. (1979), Impact of Shinkansen on Local communities, in Straszak A, Tuch R
(eds.) The Shinkansen High-Speed Rail Networks of Japan (Proceedings IIASA
Conf. 1977) pp. 11-20.
Okada, Hiroshi, (1994), “Features and Economic and Social Effects of the Shinkansen,”
Japan Railway and Transport Review, October, No. 3.

67
Peida (Planning, Economic and Development Consultants), (1991) Rail Link Project: A
Comparative Appraisal of Socio-Economic and Development Impacts of
Alternative Routes Reading. (Pieda, May)
Reistrup, P. (1986), “High Speed Rail: Answer to Gridlock Problem in the U.S.,” Atlanta
Constitution, October 7.
Santini, D., (1978) “An Econometric Model of Transportation Infrastructure as a
Determinant of Intraurban Location”, Journal of Regional Science, 18(1), April
pages 73-86.
Sanuki, T., (1979), “The Shinkansen and the Future Images of Japan,” in The Shinkansen
High Speed Rail Network of Japan, A. Strazak and R. Tuch (eds.), Proceedings of
IIASA Conference, June 27-30.
Thompson, C. and Bawden, T. (1992), “What are the Potential Economic Development
Impacts of High-Speed Rail?” Economic Development Quarterly, Vol. 6 No. 3,
August, pp. 297-319.