INFORMATION FROM RELATIONSHIP LENDING: EVIDENCE FROM LOAN …/media/Documents/research/... · ·...
42
INFORMATION FROM RELATIONSHIP LENDING: EVIDENCE FROM LOAN DEFAULTS IN CHINA * Chun Chang Shanghai Advanced Institute of Finance (SAIF) Shanghai Jiaotong University [email protected] Guanmin Liao School of Accountancy Central University of Finance and Economics [email protected] Xiaoyun Yu † Department of Finance Indiana University [email protected] Zheng Ni Gao Hua Securities Company Limited [email protected] This version: February, 2013 * We thank Sumit Agarwal, Utpal Bhattacharya, Dion Bongaerts, Martin Brown, Hans Degryse, Robert DeYoung (the editor), Joseph Fan, Nandini Gupta, Charles Kahn, Paolo Emilio Mistrulli, Steven Ongena, Zacharias Sautner, Greg Udell, Marc Umber, two anonymous referees, and seminar participants at Australian National University, Chinese University of Hong Kong, City University of Hong Kong, Indiana University, National University of Singapore, Renmin University, Shanghai Jiaotong University, Shanghai University of Finance and Economics, Tsinghua University, Xiamen University, University of Minnesota, the Shanghai Winter Finance Conference, the 3 rd CAF-FIC-SIFR Emerging Market Conference (Hyderabad), the 2 nd Swiss Conference on Banking and Financial Intermediation (Hasliberg), the European Financial Management Association Annual Meeting (Milan), and the Risk Management Conference at Singapore National University for helpful comments. We thank Nicholas Korsakov for editorial assistance. This project was supported by the National Natural Science Foundation of China, Grant # 70773122 and # 71172127. † Contacting author. Address: Department of Finance, Kelley School of Business, Indiana University, 1309 East 10 th Street, Bloomington, Indiana 47405. Telephone: (812) 855-3521.
-
Upload
hoangduong -
Category
Documents
-
view
216 -
download
1
Transcript of INFORMATION FROM RELATIONSHIP LENDING: EVIDENCE FROM LOAN …/media/Documents/research/... · ·...
INFORMATION FROM RELATIONSHIP LENDING: EVIDENCE
FROM LOAN DEFAULTS IN CHINA*
Chun Chang Shanghai Advanced Institute of Finance (SAIF)
Shanghai Jiaotong University [email protected]
Guanmin Liao
School of Accountancy Central University of Finance and Economics
Xiaoyun Yu† Department of Finance
Indiana University [email protected]
Zheng Ni
Gao Hua Securities Company Limited [email protected]
This version: February, 2013
* We thank Sumit Agarwal, Utpal Bhattacharya, Dion Bongaerts, Martin Brown, Hans Degryse, Robert DeYoung (the editor), Joseph Fan, Nandini Gupta, Charles Kahn, Paolo Emilio Mistrulli, Steven Ongena, Zacharias Sautner, Greg Udell, Marc Umber, two anonymous referees, and seminar participants at Australian National University, Chinese University of Hong Kong, City University of Hong Kong, Indiana University, National University of Singapore, Renmin University, Shanghai Jiaotong University, Shanghai University of Finance and Economics, Tsinghua University, Xiamen University, University of Minnesota, the Shanghai Winter Finance Conference, the 3rd CAF-FIC-SIFR Emerging Market Conference (Hyderabad), the 2nd Swiss Conference on Banking and Financial Intermediation (Hasliberg), the European Financial Management Association Annual Meeting (Milan), and the Risk Management Conference at Singapore National University for helpful comments. We thank Nicholas Korsakov for editorial assistance. This project was supported by the National Natural Science Foundation of China, Grant # 70773122 and # 71172127. † Contacting author. Address: Department of Finance, Kelley School of Business, Indiana University, 1309 East 10th Street, Bloomington, Indiana 47405. Telephone: (812) 855-3521.
INFORMATION FROM RELATIONSHIP LENDING: EVIDENCE
FROM LOAN DEFAULTS IN CHINA
ABSTRACT
Using a proprietary database from one of the largest state-owned commercial banks in
China, we examine whether information evolved from banking relationships helps to
predict loan default by industrial firms. We find that the bank’s relationship information is
significantly linked to the incidence of default, and that the overall improvement in
prediction accuracy due to this information is much larger than that due to any hard
information. When evaluating loan delinquency, the economic effect of relationship
information is significantly stronger among firms that have a more sustained banking
relationship. Our findings indicate that, at least in the emerging markets, a bank’s
relationship information still matters for large firms, despite the fact that hard information
for such firms is abundant.
Key words: Debt default, internal credit ratings, credit risk, relationship information,
relationship lending, hard and soft information
JEL Classification: G21, D81, D82, D83, F34
1
INFORMATION FROM RELATIONSHIP LENDING: EVIDENCE FROM
LOAN DEFAULTS IN CHINA
1. INTRODUCTION
The theoretical literature on financial intermediation has long recognized the superior
ability of banks in acquiring information or knowledge beyond that which is available to ordinary
financial market participants (e.g., Ramakrishnan and Thakor 1984, Diamond 1984, Boyd and
Prescott 1986, and Dow and Gorton 1997). In contrast to the “hard” information derived from
firms’ financial statements or industrial data, most researchers attribute this special knowledge to
relationship lending (e.g., Boot 2000 and Petersen 2004): due to its interactions with borrowing
firms over time and/or across products, a bank develops certain information that is difficult to
verify by an independent third party.
Existing empirical literature has established the importance of this “relationship
information” for small firms and consumers (e.g., Petersen and Rajan 1994, Berger and Udell
1995, Agarwal et al. 2010, and Puri et al. 2012). While a bank’s information production makes the
most sense where firms are the most opaque, these firms also have only restricted access to public
securities markets and almost exclusively rely on bank financing and private intermediated
markets. Less obvious and largely remaining unanswered, therefore, is whether banks still
possesses such information and whether such information still matters for industrial firms that are
more transparent, that have more hard information, and whose characteristics do not rely on
personal traits of individuals—such as owners or managers.
In this paper we examine this question by investigating to what extent a bank’s relationship
information predicts defaults on commercial loans. Our analyses are based on a proprietary dataset
from a major Chinese state-owned bank containing information on all loans offered to firms in the
five largest manufacturing industries in China between 2003 and 2006. China as a research setting
offers several unique advantages; in particular, it allows us to directly assess the importance of
banks’ private information—obtained through a lending relationship fostered exogenously rather
than endogenously—for large firms and industrial loans, which is usually absent from the
literature.
We document a substantial decline in loan defaults after the implementation of an internal
credit rating system by the bank in 2004. Internal credit ratings are significantly related to the
2
commonly used firm-specific financial factors in predictable ways, and changes in these financial
factors lead to changes in credit ratings. These findings suggest that, at least with regard to credit
ratings, loan decisions by Chinese banks are based on commercial principles instead of
government policies, which may have contributed to the overall performance improvement of
Chinese banks in recent years.1
Furthermore, our analysis reveals that the bank’s internal credit ratings largely subsume
firm-specific hard information, as the majority of the commonly used financial factors are no
longer significant in predicting loan defaults after including these ratings. More importantly, the
bank’s internal credit ratings contain useful information beyond that which is conveyed by the
commonly used financial and industrial variables. Therefore, we next investigate to what extent
the improvement in default prediction is due to the bank’s private information, arising from
extensive lending relationships, instead of relying on firm-specific hard information.
Since firm-specific relationship information is not observable, we follow Agarwal and
Hauswald (2012) and orthogonalize the bank’s private credit rating score with the firm’s financial
factors. We postulate that the residual component of the internal rating score captures the
proprietary information that the bank develops over time and/or through their repeated interaction
with the borrowing firms. We highlight that this relationship information is shared private
information and can be either quantifiable or non-quantifiable.
We find that the bank’s relationship information is statistically and economically
significant in forecasting loan defaults. Using the Receiver Operating Characteristics (ROC)
approach, we explicitly compare the effects between relationship information and hard
information. The bank’s relationship information contributes the most significant improvement in
default prediction, more than four times larger than the improvement arising from any proxy for
firm-specific hard information. By contrast, firm-specific hard information proxies tend to
contribute a smaller, sometimes insignificant, role to default prediction improvement.
The unique nature of relationship information is that it is pertinent to relationship lending.
We construct three proxies to identify the depth of banking relationship. Our first proxy is based
1 Since 2002, major state-owned commercial banks in China have embarked on a series of reforms, which have generally gone through the following four stages: financial reorganization, injection of new capital by the state, introduction of foreign strategic investors, and eventual IPOs. Amid the banks’ financial reorganization efforts is the introduction of an internal credit rating system. Concurrently, the average non-performing loan (NPL) ratio of the major commercial banks in China decreased from 17.9% in 2003 to 6.7% in 2007. See Internet Appendices B and C for a detailed description.
3
on how frequently a firm borrows from the bank. Our second proxy is based on how long a firm
has maintained its relationship with the bank. Our last proxy is based on a firm’s ownership, in
which we classify a firm as either state-owned or non-state-owned. Different from the measures
based on lending frequency and duration, the ownership proxy is exogenous because a state bank’s
lending relationship with state-owned firms is historically mandated by the Chinese government.
Consequently, it mitigates the endogeneity inherent in matching a firm and its bank that typically
affects such studies (see, e.g., Berger, Miller, Petersen, Rajan, and Stein 2005 for a discussion).
We conduct two sets of tests examining explicitly how lending relationship affects the role
of relationship information in predicting loan default. In a probit regression framework, our first
set of tests reveal that while relationship information significantly predicts loan default, its effect
is stronger for firms that borrow more frequently from the bank, have a longer term banking
relationship, or are state-owned firms. In addition, for firms that borrow less frequently from the
bank, have a shorter period of banking relationship, or are non-state-owned, more proxies for hard
information remain significant even in the presence of the bank’s relationship information. Our
findings indicate that the extent to which the bank’s relationship information dominates hard
information depends on the depth of the lending relationship, and that an extensive lending
relationship allows such information to substitute for, rather than complement, the role of hard
information in evaluating loan delinquency.
In our second test, we employ an ROC approach and focus on the overall improvement in
default prediction. We show that the effect of relationship information on default prediction
improvement is much more pronounced among firms that have a more sustained lending
relationship.
Our evidence thus suggests that the bank’s relationship information plays a crucial role in
predicting loan defaults by large firms, and that its effect depends on the depth of the lending
relationship. These findings are robust to various sample restrictions, alternative proxies for
relationship lending, firm-specific hard and relationship information, alternative estimation
specifications, implicit loan rollovers, and alternative definitions of default.
Our paper contributes to the finance literature that analyzes the role of hard and soft
information in bank lending. 2 Existing theoretical literature establishes that informational
frictions—asymmetric and proprietary information—“provide the most fundamental explanation
2 See Gorton and Winton (2003) for a survey on this literature.
4
for the existence of (financial) intermediaries” (Bhattacharya and Thakor 1993). The access to
information is inherently linked to relationship banking and may point to a comparative advantage
of banks (Boot 2000). Most of existing empirical studies have found support for the above theories
in the context of loan underwriting or pricing for small businesses (e.g., Petersen and Rajan 1994,
Berger and Udell 1995, Scott 2004, Uchida, Udell and Yamori 2007, and Cerqueiro, Degryse and
Ongena 2008). By contrast, we study the role of banks’ private information in the context of loan
defaults. Our research design and unique dataset allow us to focus on the information that is
gathered through lending relationships driven neither by bank competition and relative size, nor by
geographical proximity. In addition, we provide direct evidence on the importance of banks’
relationship information for large firms and industrial loans. We thus find support for the
theoretical arguments in a broader context.
There are a number of empirical studies linking banks’ information to loan default
prediction. For example, Grunert, Norden, and Weber (2005) show that a combination of non-
financial factors in internal credit ratings (a firm’s product market position and management
quality) and financial factors predicts loan defaults by German firms more accurately than either
of the two types of factors alone. Agarwal and Hauswald (2012) document that the soft
information component of a credit rating predicts loan defaults by small firms.
An emerging literature focuses on the importance of retail banking relationships. Puri and
Rocholl (2008) find that banks convey private information to their retail investors to ensure greater
demand for better issues. Using a unique, comprehensive dataset of loans by savings banks in
Germany, Puri, Rocholl, and Steffen (2012) study the role of relationship information in loan
application and default prediction. They find that retail customers who have a relationship with
their savings bank prior to applying for a loan, default significantly less than customers without
such a prior relationship. They show that relationships of all kinds have inherent private
information and are valuable in screening, monitoring, and reducing consumers’ incentives to
default. Agarwal et al. (2010) and Agarwal et al. (2011) find that consumer-lender relationships
help predict the default behavior of credit card accounts in the United States, and that for credit
card customers, monitoring—and thus the availability of information on the changes in customer
behavior—results in an advantage for relationship banking.
By focusing on the importance of bank relationships for industrial firms, our paper differs
from these studies in several ways. First, hard information of small firms or consumers differs

5
from that of large firms, as the former tends to be more correlated with the characteristics of
owners and managers. Since firm-specific hard information for small firms is relatively scarce,
many studies rely more on the credit information of their owners. Nevertheless, the default
decision by small firms and individuals is largely determined by the personal traits of these
individuals, which are difficult to observe and quantify, and which, by definition, should be
captured by the bank’s soft information. While the role of soft information in loan pricing and
default is well recognized for small firms and consumers, the importance of relationship lending
and the significance of relationship information for large firms remain to be explored. Our results
complement the above studies by indicating that a bank’s private information can still play an
important role for industrial firms and commercial loans, despite the fact that there tends to be
much more hard information about large firms. Second, we focus on how the effect of relationship
information varies with the strength of the banking relationship and the quality of hard
information in an emerging market setting. We show that an extensive lending relationship allows
relationship information to significantly improve default prediction. Lastly, as described in
Internet Appendix B, the institutional features of the Chinese banking system offer a clean setting
for the research questions in our study; in particular, they enable us to construct a unique proxy for
the intensity of banking relationship that does not suffer the well-known endogeneity problem
between banking relationship and loan defaults.
Our paper is also related to the literature analyzing how financial and industrial factors
predict corporate bankruptcy (e.g., Altman 1968). Instead, we focus on loan default. Our study
complements this literature by indicating that hard information, derived from a firm’s financial
statements, predicts not only a firm’s likelihood of bankruptcy but also its likelihood of short-term
loan delinquency.
The rest of the paper is organized as follows. Section 2 describes our sources of data.
Sections 3 and 4 present the empirical findings. Section 5 summarizes various robustness checks.
Section 6 concludes. Appendix I describes the bank’s internal credit rating system. Appendix II
describes variable constructions. In Internet Appendices A through C, we present all the
robustness tests and extensions. We also discuss the institutional details of China’s banking
system, the banking reforms, and the uniqueness of our research setting.
6
2. DATA DESCRIPTION
2.1 Data Sources
We obtain a large dataset from one of the big-four state-owned commercial banks in China,
whose lending scope and practices have concentrated on manufacturing industries. The dataset
consists of year-end information on all the outstanding loans (40,740 loans) made to 4,624
Chinese firms from five largest manufacturing industries between 2003 and 2006.3 The industry
classification system used by the bank is similar to the Industrial Classification for National
Economic Activities from the Bureau of Statistics of China.
For each loan outstanding, our dataset contains information on its principal amount,
maturity date, the province in which the loan was originated, interest rate, the borrowing firm’s
financial statements, ownership classification, industry, as well as the repayment status if the loan
is due during the year. Specifically, the bank will note the repayment status of a given loan at the
end of the following year in one of the three categories: repaid, unpaid, or written off.
Starting in 2004, the bank implemented an internal credit rating system.4 For each year, the
bank follows an internal set of guidelines and assigns a credit score to a borrowing firm at the time
that it applies for the first loan of that year. The bank then rates the borrower based on its credit
score. The credit rating ranks from B to AAA, with B being the lowest (poorest credit quality) and
AAA the highest (highest credit quality). Our dataset thus also contains the annual rating
information between 2004 and 2006 for the sample firms. In Appendix I, we provide a detailed
description of this internal credit rating system. As Appendix I indicates, a borrowing firm’s
internal credit rating reflects both objective and subjective evaluations from the bank.
2.2 Loan Default
To ensure the conservativeness of our analysis, we consider a loan in the default stage if
the principal is unpaid or written off by the due date. Therefore, our definition of loan default is 3 The five manufacturing industries are: Steel, Automobiles and Transportation Equipment, Paper, Non-ferrous Metals, and Construction Materials and Manufacturing. 4 Most banks in the United States have had internal credit rating systems since at least the 1980s (see, e.g., English and Nelson 1999 for a description). Note also that internal credit rating differs from credit scoring. Small business credit scoring (SBCS) in the United States was introduced in 1995 and applies to only micro business loans. By basically adapting consumer lending practices to micro business lending, credit scoring is mostly focused on using mercantile ratings and consumer credit bureau reports on the entrepreneur. It is best viewed as a subset of internally rated loans. In the case of SBCS, the entire loan underwriting process is limited to the score. Several studies have shown that the implementation of SBCS improves small business lending (e.g., Frame, Srinivasan, and Wooseley 2001 and Berger, Frame and Miller 2005). China introduced the internal credit rating system to its banks following economic reforms. However, there is still a lack of development of credit scoring for small businesses and consumers.
7
essentially restricted to whether the loan is repaid on time, which is narrow in the sense that other
violations of loan covenants are not considered as default.
Note that explicit loan rollovers based on traditional definitions are rare in China. This is
because after the banking system reform, Chinese firms in need of extending their loans are
required to physically repay their loan obligations so that banks can close the related record before
any new loans can be originated, even if the principal and terms of the new loan remain exactly
the same, which in fact constitutes an implicit loan rollover. We are unable to identify loan
rollovers in our sample. As a result, if some of the loans were implicitly rolled over in order to
avoid default, the default rate might be underestimated. 5 Nevertheless, as will become clear later,
underestimating default works against us in finding the results. In Internet Appendix A, we also
conduct a robust test explicitly taking into account possible implicit loan rollovers.
2.3 Sample Selection
We extract a sample of firms and loans they borrowed between 2004 and 2006 from the
dataset.6 The initial sample thus consists of 4,624 firms and 40,740 loans. We then apply the
following filtering criteria.
There are 13 ownership categories for the borrowing firms in our sample, including: state-
owned, collectively-owned, state-controlled (in which the state has a controlling stake),
collectively-controlled (in which a collectively-owned entity has a controlling stake), foreign-
owned and joint ventures, privately-owned, proprietorship, and joint-stock companies. We remove
107 firms with missing information on ownership (183 firm-year observations, 627 loans) and 403
collectively-owned or collectively-controlled firms (636 firm-year observations, 2,040 loans) due
to their ambiguous nature.7 We also remove 4 firms whose ownership changed within a given
sample year (4 firm-year observations, 82 loans).
5 Our definition of loan default is unlikely to underestimate actual default also because in China, a loan officer of a state-owned bank is penalized in the event of default on loans that he/she originates even if he/she no longer works in loan origination or has transferred to a different department within the bank. If a loan default occurs due to poor judgment, bonus, salary, and/or future promotion of the loan officer are affected. If multiple loan defaults occur that trigger a corruption investigation, the loan officer is also subject to legal penalty. 6 Since our sample begins in 2003 and the bank’s internal rating is implemented in 2004, firms borrowing from the bank in 2003 do not have an assigned internal credit rating. As a result, our sample spans 2004-2006. 7 The ambiguous nature of collectively-owned firms and their unique ownership arrangements are discussed and analyzed in Chang and Wang (1994).
8
Next, we exclude 2,780 firm-year observations (15,112 loans) with missing information on
internal rating scores. We further eliminate, sequentially, 503 firm-year observations (1,143 loans)
with missing financial statement information such as assets, sales, and net income, 4 firm-year
observations (12 loans) with negative equity, and 20 firm-year observations (33 loans) with zero
value associated with Plant, Property and Equipment (PP&E).
Loans initiated in 2006 require payment information in 2007 for us to judge whether or not
a default has occurred. However, our loan sample ends in 2006. Therefore, we remove 8,005 such
loans that were originated in 2006 borrowed by 2,057 unique firms.
For the purpose of our analysis, we focus on defaults on short-term loans (maturity of one
year or less). This is because to identify the default status for medium and long-term loans would
require information extending beyond one year. 8 We thus exclude 557 loans whose maturity
exceeds one year (borrowed by 149 unique firms).
With only year-end information available, our database does not include short-term loans
made and repaid within the same calendar year. That is, short-term loans originated and matured
within the same calendar year will appear in the database only if they are past-due (default). Thus,
to avoid over-estimating the default rate, we restrict to loans initiated in year 2004 or in 2005 that
mature in the following year. This allows us to explicitly identify their subsequent default status in
2005 and 2006, respectively. In particular, for loans that were originated in March 2004, we look
at those whose maturity exceeds 9 months so that their payment status will appear in the 2005
record; for loans originated in April 2004, we look at those with maturity exceeding 8 months; for
loans borrowed in May 2004, we look at those with maturity exceeding 7 months, and so on. This
approach ensures a bias-free sample for our analysis because our database will indicate the
status—default or not—of these loans at year-end. This filtering criterion further excludes 121
loans (borrowed by 53 firms).
Our final sample thus contains 13,008 loans from 2,072 unique firms, and 2,876 firm-year
observations.9
8 However, concentrating on short-term loans does not bias our analysis. As Internet Appendix C indicates, short-term loans constitute the major source of funding for Chinese firms. In fact, 95% of loans in our dataset have a maturity of one year or less, accounting for 85% of aggregate outstanding principals. In addition, for short-term loans, default more likely arises from failing to repay principal rather than from violating other loan covenants; our definition of loan default—whether or not the principal is repaid on time—thus matches this focus well. 9 Most studies on the role of relationship information focus on loan underwriting or pricing for small firms. With a few exceptions such as Agarwal and Hauswald (2012), many look at booked loans and thus may face the sample selection problem arising from the fact that only granted loans and related characteristics of the loans and borrowing
9
2.4 Descriptive Statistics of Sample Firms
Table 1 summarizes the characteristics between firms that defaulted on their loans and
those that did not. The unit of analysis is firm-year observations. The detailed variable
descriptions are provided in Appendix II.
Table 1 reveals that our sample is dominated by large manufacturing firms. An average
sample firm has 1,996 employees, with an annual total assets of RMB 930 million (book value)
and annual sales of RMB 711 million, corresponding to approximately $115.7 million and $88.4
million, respectively. 10 In comparison, the 2003 classification guidelines, issued by the State-
owned Assets Supervision and Administration Commission of the State Council (SASAC) of
China, classifies a firm as a “large” industrial firm if its assets exceed RMB 400 million, sales
exceed RMB 300 million, and/or employees exceed 2,000. Unlike small businesses analyzed by
the majority of previous studies, our sample firms have a relatively large operating scale and asset
base.
More importantly, our sample is not dominated by micro-loans. The average outstanding
loan principal per sample firm is RMB 47.7 million ($5.93 million). Our study therefore sheds
light on the characteristics and economic impact of relationship lending associated with
commercial loans and large industrial firms.
We observe from Table 1 that the bank’s internal credit rating about a sample firm is lower
when the loans borrowed by the firm are subsequently in the default stage. For example, among
loans initiated in 2004, the borrowers whose loans were in default stage in 2005 had an average
internal credit score of 5.24, compared to the average score of 8.20 for those whose loans were not
in default. Firms defaulting on their loans also have a significantly higher degree of leverage,
poorer profitability (measured by return on equity, or ROE), lower asset turnover, and smaller
cash reserves.11 State-owned firms more likely default on their loans than non-state-owned firms.
firms are observable. By contrast, we study the role of banks’ private information in the context of loan default. Our analysis is less subject to the sample selection problem because loan default occurs only subsequently within all the booked loans. In other words, among booked loans we observe both those that are defaulted and those that are in good standing. The only potential bias in our setting arises from the fact that our dataset contains year-end information. Short-term loans originated and due within the same year will appear in the dataset only if there is a default. To prevent over-estimating default rate, we impose a sequence of restriction criteria as described above to ensure that our analysis is conducted upon a bias-free sample. 10 Based on an average exchange rate between 2003 and 2006 of $1 = RMB 8.04. 11 Though not reported, the observed default characteristics are similar between state-owned firms and non-state-owned firms. This suggests that most of the firm-specific fundamental factors that affect loan default are relatively universal across Chinese firms.
10
3. LOAN DEFAULT AND INTERNAL CREDIT RATING
To evaluate the economic role of the bank’s information on loan default prediction, we
first identify firm-specific factors that can potentially affect the incentive to default. Next, we
investigate whether credit rating scores have additional predictive power after controlling for firm-
specific factors known to affect default propensity. We then explore the information content of the
bank’s internal credit rating by examining whether these ratings take into account a firm’s
fundamentals.
As discussed in Appendix I, a credit rating score is assigned to a borrowing firm when it
applies for its first loan of the year. Since the bank’s internal credit rating is assigned to the
borrower instead of to individual loans, we conduct our regressions at firm-level. For each year,
we define a firm to be in a default stage if at least one of its previously borrowed short-term loans
is written off or unpaid. This definition includes firms that default on some, but not all, of their
loans. Among the 2,876 firm-year observations, 230 firm-year observations are classified as
default. 165 out of 230 (72%) involve firms that default on all of their loans, whereas 28% involve
firms that default on some of their loans.12
3.1 Determinants of Loan Default
In a probit regression framework, we identify the relationship between firm-specific hard
information and the subsequent loan defaults as follows:
𝑃𝑟𝑜𝑏(𝐷𝑒𝑓𝑎𝑢𝑙𝑡) = 𝑓(𝐻𝑎𝑟𝑑 𝐼𝑛𝑓𝑜𝑟𝑚𝑎𝑡𝑖𝑜𝑛 𝑃𝑟𝑜𝑥𝑖𝑒𝑠, 𝐼𝑛𝑑𝑢𝑠𝑡𝑟𝑦 𝐹𝐸,𝑌𝑒𝑎𝑟 𝐹𝐸,𝑅𝑒𝑔𝑖𝑜𝑛 𝐹𝐸) (1)
Our dependent variable is a dummy equal to one if a firm defaults on its loan, and zero
otherwise. We include key financial statement information that is considered explicitly by the
bank when evaluating the borrower’s quality as described in Appendix I: short-term solvency
(Cash), long-term solvency (Leverage), profitability (ROE), operating performance (Sales Growth
and Asset Turnover). Since Sales Growth contains many missing values, which could potentially
bias our findings, we include a dummy for whether Sales Growth is missing, and re-define Sales
Growth to zero when a missing value occurs. We include hard information proxies known to affect
default, such as size, average loan maturity, whether the firm is publicly listed, state-owned,13 and
12 In Internet Appendix A, we discuss the robustness test results based on the loan-level analyses and based on alternative definitions of loan default. 13 There are 13 firms that changed their ownership from state-owned in 2004 to non-state-owned in 2005. Excluding these 13 firms does not alter our findings.
11
having defaulted on loans previously. All the key independent variables are lagged. To control for
potential clustering of bank branches and borrowing firms based on local economic conditions and
industrial structures, we include time-varying log(GDP) of the province where the bank branch is
located, as well as region fixed effects, where regions are classified based on the conventional six
economic regions within mainland China (Northern, Northeastern, Eastern, Central Southern,
Southwestern, and Northwestern regions). Lastly, we control for industry and year fixed-effects.
Table 2 Column 1 reports both the coefficient estimates and marginal effects (reported
before and after “/”) from the probit analysis. Controlling for industry, year, and region fixed
effects, firms with a larger asset base, lower leverage, higher profitability, faster asset turnover,
and operating in more economically advanced regions tend to have a lower default propensity.
Firms that previously defaulted on their loans also tend to default on current loans.
Columns 2 and 3 of Table 2 report the coefficient estimates and marginal effects from
regressing the default propensity on the bank’s international credit rating. We observe that internal
credit rating, implemented nation-wide for all its branches, is significantly negatively related to the
probability of default. For example, Column 3 shows that the bank’s internal credit rating has
additional predictive power for loan default in the presence of hard information. The marginal
effect associated with internal credit rating score indicates that one level increase in the internal
credit rating leads to a 1.2 percentage point lower probability of default. To illustrate the economic
significance, the probability of default for a firm whose other variables are set to their mean levels
decreases from 2.2% to 1.2% if the internal credit rating increases one level from its mean level.
This amounts to a 45% decrease in loan default propensity.
More importantly, Column 3 reveals that once the internal credit rating is included, most of
the proxies for firm-specific hard information, such as firm size, leverage, profitability, asset
turnover, and previous default records, either are no longer statistically significant or become
statistically weaker. This suggests that internal credit rating scores subsume the effect of these
factors.
3.2 The Information Content of Internal Credit Rating
The results from Table 2 show that most of the fundamental factors are no longer
significant after including the internal rating scores, which suggests that these scores incorporate
the majority, if not all, of firm-specific hard information. We now verify this empirically. Table 3
12
Column 1 reports the OLS results. There is evidence that the bank’s internal credit rating scores do
take into account firm-specific fundamental factors expected to affect subsequent loan default: a
larger asset base, lower leverage, greater profitability, higher level of cash reserve and sales
growth, being a listed firm, and a previous non-default record lead to better credit quality and a
more favorable credit score.
In Table 3 Columns 2 and 3, we examine whether a change in firm-specific hard
information leads to a subsequent change in the internal credit rating. In the OLS regression
(Column 2), the dependent variable is the change in the internal credit rating. In the ordered probit
regression (Column 3), the dependent variable takes a value of 1 if a firm’s internal credit rating
improves from 2004 to 2005 or from 2005 to 2006, -1 if it deteriorates, and 0 otherwise. Both the
OLS and ordered probit results show that a change in size, leverage, profitability, and/or asset
turnover is significantly linked to a subsequent change in internal credit rating. In particular, an
increase in size, profitability and asset turnover leads to a higher internal credit rating, while an
increase in leverage leads to a lower likelihood of favorable rating (Column 3). Results from Table
3 thus indicate that the bank’s internal credit rating takes into account firm-specific hard
information, such as fundamental factors previously identified to predict loan default.
4. THE ROLE OF RELATIONSHIP INFORMATION
Results from Table 2 indicate that most known fundamental factors are no longer
statistically significantly in predicting loan default once the internal rating scores are included in
the probit regression. Table 3 Column 1 reveals that, being able to explain about 40% of the
internal credit rating, firm-specific hard information—captured by firms’ fundamentals—is not the
sole determinant of the bank’s internal credit rating. This suggests that the bank possesses superior
informational advantage when evaluating loan defaults.
In this section we explore the relative importance of the information arising from bank’s
relationship with the borrowing firms. We proceed as follows. In Section 4.1 we describe a proxy
for relationship information. In Section 4.2, we examine whether and how the bank’s relationship
information predicts loan default in the presence of firm-specific hard information. Since a bank’s
relationship information evolves from its lending relationship with the firm, we further investigate
to what extent the role of this information differs depending on the depth of lending relationship in
Sections 4.3 through 4.5.
13
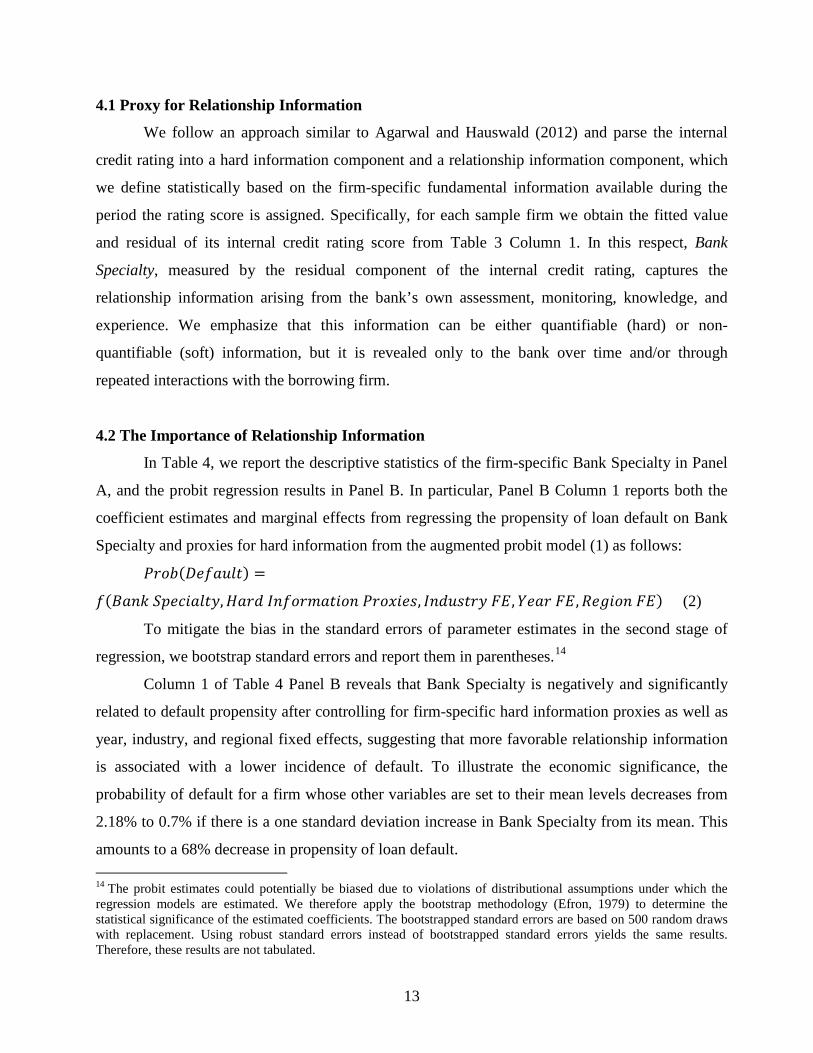
4.1 Proxy for Relationship Information
We follow an approach similar to Agarwal and Hauswald (2012) and parse the internal
credit rating into a hard information component and a relationship information component, which
we define statistically based on the firm-specific fundamental information available during the
period the rating score is assigned. Specifically, for each sample firm we obtain the fitted value
and residual of its internal credit rating score from Table 3 Column 1. In this respect, Bank
Specialty, measured by the residual component of the internal credit rating, captures the
relationship information arising from the bank’s own assessment, monitoring, knowledge, and
experience. We emphasize that this information can be either quantifiable (hard) or non-
quantifiable (soft) information, but it is revealed only to the bank over time and/or through
repeated interactions with the borrowing firm.
4.2 The Importance of Relationship Information
In Table 4, we report the descriptive statistics of the firm-specific Bank Specialty in Panel
A, and the probit regression results in Panel B. In particular, Panel B Column 1 reports both the
coefficient estimates and marginal effects from regressing the propensity of loan default on Bank
Specialty and proxies for hard information from the augmented probit model (1) as follows:
𝑃𝑟𝑜𝑏(𝐷𝑒𝑓𝑎𝑢𝑙𝑡) =
𝑓(𝐵𝑎𝑛𝑘 𝑆𝑝𝑒𝑐𝑖𝑎𝑙𝑡𝑦,𝐻𝑎𝑟𝑑 𝐼𝑛𝑓𝑜𝑟𝑚𝑎𝑡𝑖𝑜𝑛 𝑃𝑟𝑜𝑥𝑖𝑒𝑠, 𝐼𝑛𝑑𝑢𝑠𝑡𝑟𝑦 𝐹𝐸,𝑌𝑒𝑎𝑟 𝐹𝐸,𝑅𝑒𝑔𝑖𝑜𝑛 𝐹𝐸) (2)
To mitigate the bias in the standard errors of parameter estimates in the second stage of
regression, we bootstrap standard errors and report them in parentheses.14
Column 1 of Table 4 Panel B reveals that Bank Specialty is negatively and significantly
related to default propensity after controlling for firm-specific hard information proxies as well as
year, industry, and regional fixed effects, suggesting that more favorable relationship information
is associated with a lower incidence of default. To illustrate the economic significance, the
probability of default for a firm whose other variables are set to their mean levels decreases from
2.18% to 0.7% if there is a one standard deviation increase in Bank Specialty from its mean. This
amounts to a 68% decrease in propensity of loan default. 14 The probit estimates could potentially be biased due to violations of distributional assumptions under which the regression models are estimated. We therefore apply the bootstrap methodology (Efron, 1979) to determine the statistical significance of the estimated coefficients. The bootstrapped standard errors are based on 500 random draws with replacement. Using robust standard errors instead of bootstrapped standard errors yields the same results. Therefore, these results are not tabulated.
14
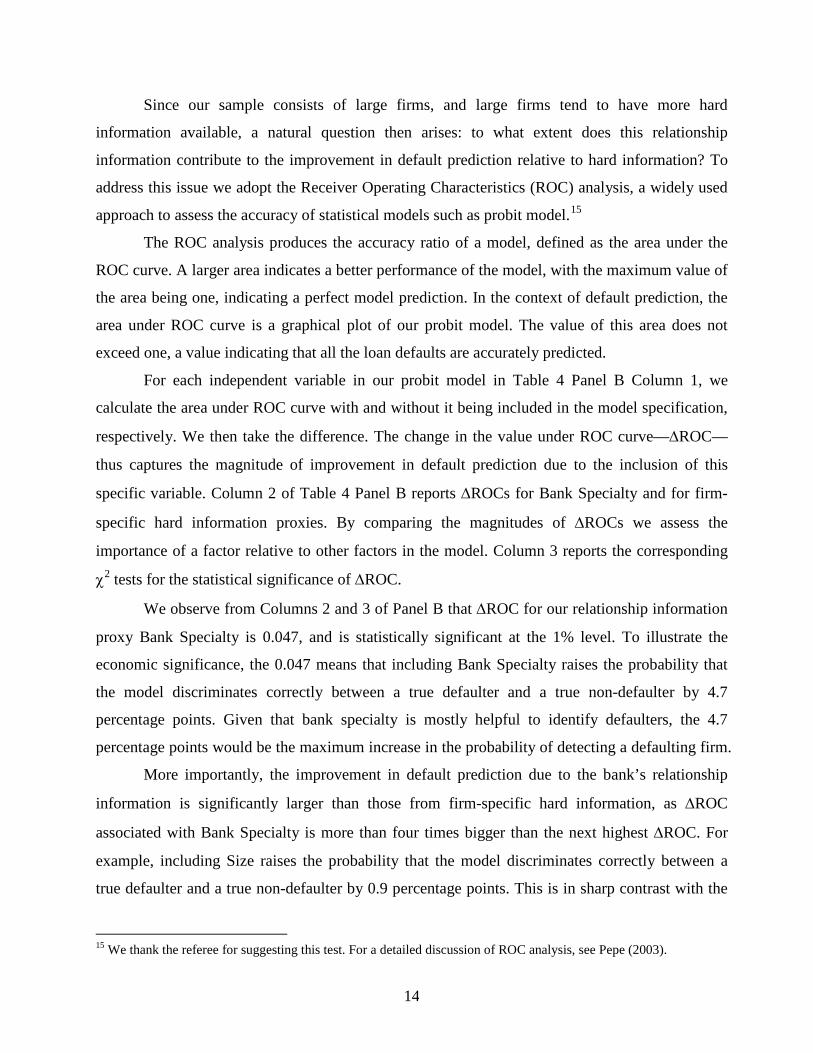
Since our sample consists of large firms, and large firms tend to have more hard
information available, a natural question then arises: to what extent does this relationship
information contribute to the improvement in default prediction relative to hard information? To
address this issue we adopt the Receiver Operating Characteristics (ROC) analysis, a widely used
approach to assess the accuracy of statistical models such as probit model.15
The ROC analysis produces the accuracy ratio of a model, defined as the area under the
ROC curve. A larger area indicates a better performance of the model, with the maximum value of
the area being one, indicating a perfect model prediction. In the context of default prediction, the
area under ROC curve is a graphical plot of our probit model. The value of this area does not
exceed one, a value indicating that all the loan defaults are accurately predicted.
For each independent variable in our probit model in Table 4 Panel B Column 1, we
calculate the area under ROC curve with and without it being included in the model specification,
respectively. We then take the difference. The change in the value under ROC curve—∆ROC—
thus captures the magnitude of improvement in default prediction due to the inclusion of this
specific variable. Column 2 of Table 4 Panel B reports ∆ROCs for Bank Specialty and for firm-
specific hard information proxies. By comparing the magnitudes of ∆ROCs we assess the
importance of a factor relative to other factors in the model. Column 3 reports the corresponding
χ2 tests for the statistical significance of ∆ROC.
We observe from Columns 2 and 3 of Panel B that ∆ROC for our relationship information
proxy Bank Specialty is 0.047, and is statistically significant at the 1% level. To illustrate the
economic significance, the 0.047 means that including Bank Specialty raises the probability that
the model discriminates correctly between a true defaulter and a true non-defaulter by 4.7
percentage points. Given that bank specialty is mostly helpful to identify defaulters, the 4.7
percentage points would be the maximum increase in the probability of detecting a defaulting firm.
More importantly, the improvement in default prediction due to the bank’s relationship
information is significantly larger than those from firm-specific hard information, as ∆ROC
associated with Bank Specialty is more than four times bigger than the next highest ∆ROC. For
example, including Size raises the probability that the model discriminates correctly between a
true defaulter and a true non-defaulter by 0.9 percentage points. This is in sharp contrast with the
15 We thank the referee for suggesting this test. For a detailed discussion of ROC analysis, see Pepe (2003).
15
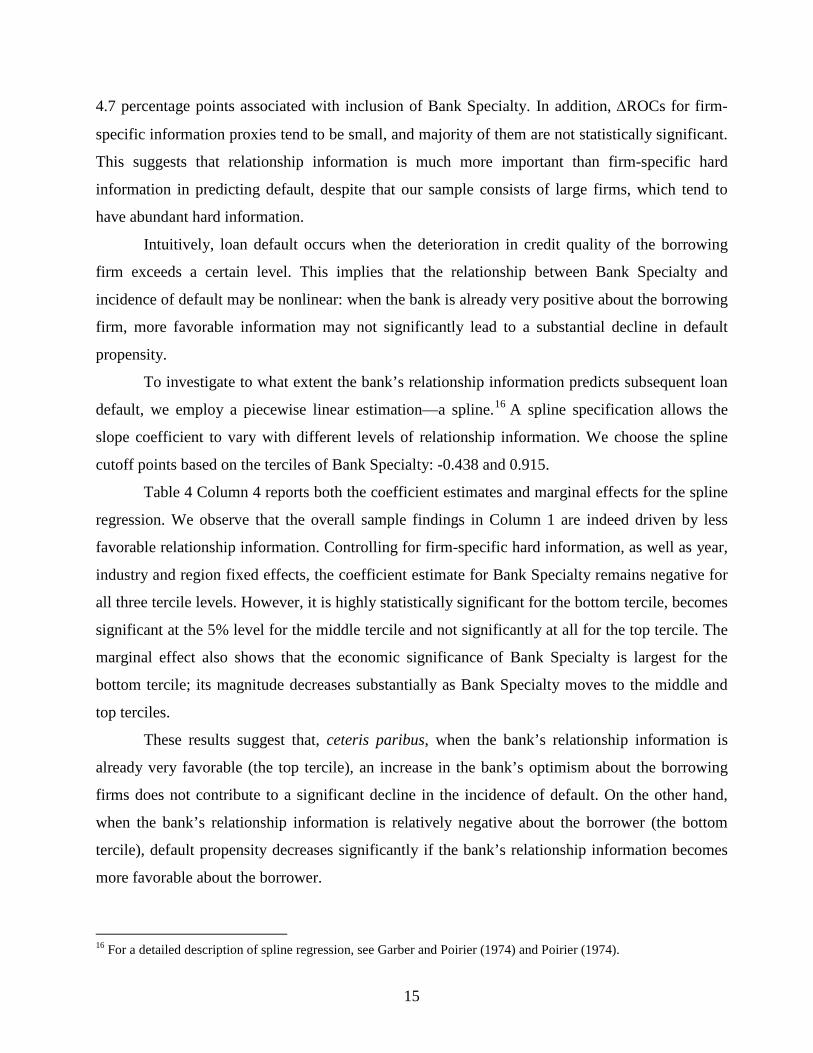
4.7 percentage points associated with inclusion of Bank Specialty. In addition, ∆ROCs for firm-
specific information proxies tend to be small, and majority of them are not statistically significant.
This suggests that relationship information is much more important than firm-specific hard
information in predicting default, despite that our sample consists of large firms, which tend to
have abundant hard information.
Intuitively, loan default occurs when the deterioration in credit quality of the borrowing
firm exceeds a certain level. This implies that the relationship between Bank Specialty and
incidence of default may be nonlinear: when the bank is already very positive about the borrowing
firm, more favorable information may not significantly lead to a substantial decline in default
propensity.
To investigate to what extent the bank’s relationship information predicts subsequent loan
default, we employ a piecewise linear estimation—a spline.16 A spline specification allows the
slope coefficient to vary with different levels of relationship information. We choose the spline
cutoff points based on the terciles of Bank Specialty: -0.438 and 0.915.
Table 4 Column 4 reports both the coefficient estimates and marginal effects for the spline
regression. We observe that the overall sample findings in Column 1 are indeed driven by less
favorable relationship information. Controlling for firm-specific hard information, as well as year,
industry and region fixed effects, the coefficient estimate for Bank Specialty remains negative for
all three tercile levels. However, it is highly statistically significant for the bottom tercile, becomes
significant at the 5% level for the middle tercile and not significantly at all for the top tercile. The
marginal effect also shows that the economic significance of Bank Specialty is largest for the
bottom tercile; its magnitude decreases substantially as Bank Specialty moves to the middle and
top terciles.
These results suggest that, ceteris paribus, when the bank’s relationship information is
already very favorable (the top tercile), an increase in the bank’s optimism about the borrowing
firms does not contribute to a significant decline in the incidence of default. On the other hand,
when the bank’s relationship information is relatively negative about the borrower (the bottom
tercile), default propensity decreases significantly if the bank’s relationship information becomes
more favorable about the borrower.
16 For a detailed description of spline regression, see Garber and Poirier (1974) and Poirier (1974).
16
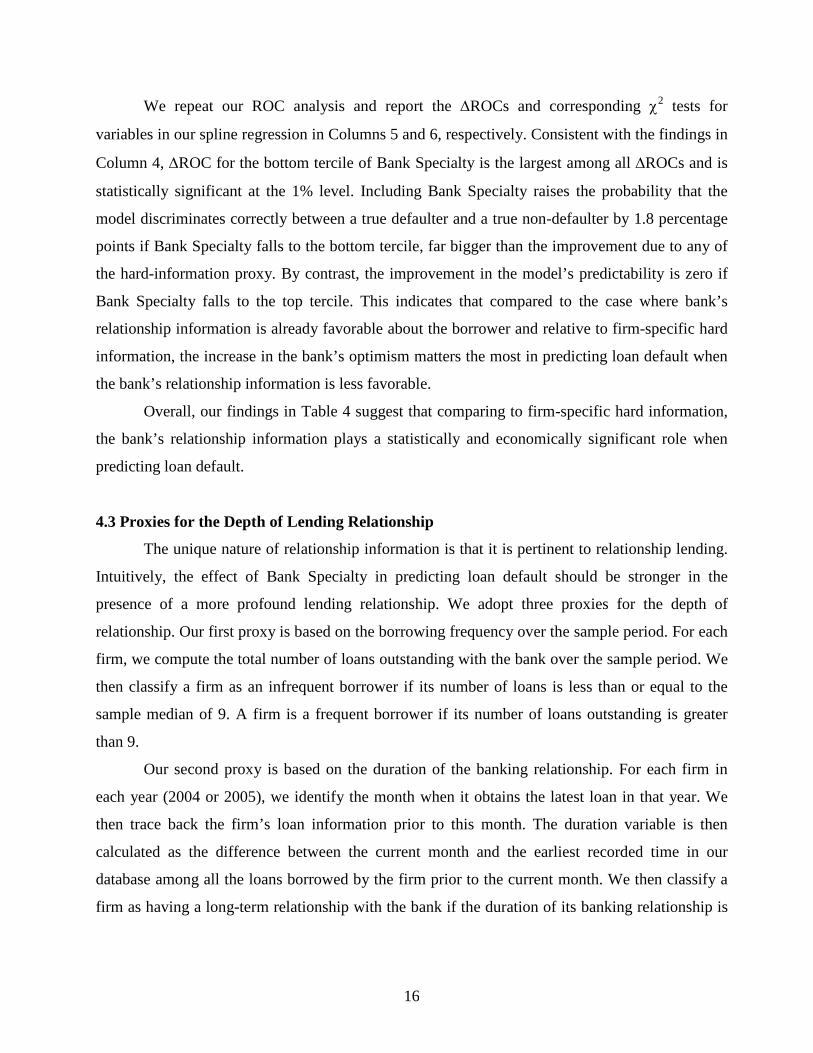
We repeat our ROC analysis and report the ∆ROCs and corresponding χ2 tests for
variables in our spline regression in Columns 5 and 6, respectively. Consistent with the findings in
Column 4, ∆ROC for the bottom tercile of Bank Specialty is the largest among all ∆ROCs and is
statistically significant at the 1% level. Including Bank Specialty raises the probability that the
model discriminates correctly between a true defaulter and a true non-defaulter by 1.8 percentage
points if Bank Specialty falls to the bottom tercile, far bigger than the improvement due to any of
the hard-information proxy. By contrast, the improvement in the model’s predictability is zero if
Bank Specialty falls to the top tercile. This indicates that compared to the case where bank’s
relationship information is already favorable about the borrower and relative to firm-specific hard
information, the increase in the bank’s optimism matters the most in predicting loan default when
the bank’s relationship information is less favorable.
Overall, our findings in Table 4 suggest that comparing to firm-specific hard information,
the bank’s relationship information plays a statistically and economically significant role when
predicting loan default.
4.3 Proxies for the Depth of Lending Relationship
The unique nature of relationship information is that it is pertinent to relationship lending.
Intuitively, the effect of Bank Specialty in predicting loan default should be stronger in the
presence of a more profound lending relationship. We adopt three proxies for the depth of
relationship. Our first proxy is based on the borrowing frequency over the sample period. For each
firm, we compute the total number of loans outstanding with the bank over the sample period. We
then classify a firm as an infrequent borrower if its number of loans is less than or equal to the
sample median of 9. A firm is a frequent borrower if its number of loans outstanding is greater
than 9.
Our second proxy is based on the duration of the banking relationship. For each firm in
each year (2004 or 2005), we identify the month when it obtains the latest loan in that year. We
then trace back the firm’s loan information prior to this month. The duration variable is then
calculated as the difference between the current month and the earliest recorded time in our
database among all the loans borrowed by the firm prior to the current month. We then classify a
firm as having a long-term relationship with the bank if the duration of its banking relationship is
17
more than 19 months (sample median). Otherwise, the firm is classified as having a short-term
banking relationship.17
Our last proxy is based on whether a firm is owned or controlled by the state. Since the
Chinese government historically mandates the banking relationship with state-owned firms, the
bank has more interaction with state-owned firms than with non-state-owned firms. More
importantly, this relationship is forged exogenously and is therefore, not subject to the doubt-
matching endogeneity problem commonly seen in the existing literature.18 On the other hand,
since our focus is loan default instead of loan origination, the results with respect to this proxy for
lending relationship are not affected by whether loans are originated for commercial principles ex
ante.
If the bank’s firm-specific information arises from its lending relationship with the firm,
then the role of Bank Specialty in predicting default may vary between firms that have and that
lack a sustained banking relationship. On the other hand, if Bank Specialty simply captures
omitted firm-specific hard information, then we should not expect its role to vary with the depth of
lending relationship.
4.4 Relationship Information and the Depth of Lending Relationship
We now examine explicitly to what extent the presence of a sustained lending relationship
affects the role of Bank Specialty in predicting loan default, using the three proxies for the depth
17 Alternative cutoff based on the median for the subsample period of 2004-2005 yields similar results and the results are thus not reported. Note that this proxy is measured against the short sample period; it tends to be noisier in capturing the interaction between the firm and the bank than the other two proxies. A firm might have secured loans from the bank prior to the beginning of our sample period and beyond the records that are traceable, and had little borrowing activities since then. It is possible that such firms are classified as being associated with a short-term banking relationship. However, this type of misclassification works against us in finding the difference between firms of short-term and long-term banking relationships. In addition, our focus on short-term lending activities, instead of long-term loans, helps to mitigate the concern for this potential misclassification. 18 Prior to the banking system reforms in China beginning in the mid-1980s, the relationships between state-owned banks and state-owned enterprises (SOEs) had been mandated by the government. Firms normally apply for loans only from the bank serving the sector to which the firm belongs, and the bank is limited on which firms it can fund. Loans granted to the SOEs are often based on political and policy considerations instead of being driven by commercial principles. To this extent, we highlight that the relationship between state-owned banks and state-owned firms is forged exogenously. Nevertheless, as described in Internet Appendix B, the subsequent system-wide banking reforms have greatly affected banks’ incentives to collect firm-specific information to improve operating performance. Even if loans may still be granted to the SOEs, banks’ information collection efforts help them to mitigate losses from non-performing loans by discriminating among SOEs through loan terms—such as collateral requirements, interest rates, and additional covenants. With a significant amount of effort being exerted to reduce non-performing loans during the course of the reform, banks can even decline loan applications. It became more difficult for deadbeat SOEs to secure new loans.
18
of lending relationship. We first re-run the probit regression model (2), but include two additional
independent variables: the depth of a firm’s borrowing relationship with the bank, and the
interaction term between Bank Specialty and an indicator variable for a profound lending
relationship.
𝑃𝑟𝑜𝑏(𝑑𝑒𝑓𝑎𝑢𝑙𝑡) = 𝑓 �𝐵𝑎𝑛𝑘 𝑆𝑝𝑒𝑐𝑖𝑎𝑙𝑡𝑦, 𝐷𝑒𝑝𝑡ℎ 𝑜𝑓 𝐿𝑒𝑛𝑑𝑖𝑛𝑔 𝑅𝑒𝑙𝑎𝑡𝑖𝑜𝑛𝑠ℎ𝑖𝑝
𝐵𝑎𝑛𝑘 𝑆𝑝𝑒𝑐𝑖𝑎𝑙𝑡𝑦 × 𝐷𝑢𝑚𝑚𝑦 𝑓𝑜𝑟 𝑃𝑟𝑜𝑓𝑜𝑢𝑛𝑑 𝐿𝑒𝑛𝑑𝑖𝑛𝑔 𝑅𝑒𝑙𝑎𝑡𝑖𝑜𝑛𝑠ℎ𝑖𝑝,𝐻𝑎𝑟𝑑 𝐼𝑛𝑓𝑜𝑟𝑚𝑎𝑡𝑖𝑜𝑛 𝑃𝑟𝑜𝑥𝑖𝑒𝑠, 𝐼𝑛𝑑𝑢𝑠𝑡𝑟𝑦 𝐹𝐸,𝑌𝑒𝑎𝑟 𝐹𝐸,𝑅𝑒𝑔𝑖𝑜𝑛 𝐹𝐸
� (3)
Columns 1 of Panels A through B of Table 5 report the coefficient estimates and marginal
effects for the probit regression model (3), using borrowing frequency, duration, and state
ownership as a measure for the depth of lending relationship, respectively. We also report
corresponding sample default rates at the bottom of each panel.
Column 1 of Panel A reveals that Bank Specialty is negatively related to default propensity,
suggesting that more favorable relationship information leads to a lower probability of default.
More importantly, the effect of relationship information on default prediction is stronger in the
presence of a more profound lending relationship, as the interaction term between Bank Specialty
and the dummy for frequent borrower is negative and significant.
We also observe that the relationship variable itself is statistically and economically
insignificant. This is also the case when a different relationship proxy is used in each of Panels B
and C. The lack of significance is intuitive: if there is no relationship information, the nature of the
relationship should not matter in predicting loan default.
Next, we split the sample based on whether or not the sample firm is a frequent borrower
and re-run probit regression model (2) for each of the two sub-samples. Bank Specialty continues
to be negatively and significantly related to default propensity, regardless whether a firm is an
infrequent borrower (Column 2) or a frequent borrower (Column 3). More importantly, the
marginal effects associated with Bank Specialty in Columns 2 and 3 indicate that the role of
relationship information relative to hard information varies depending on the depth of the lending
relationship: The marginal effect of Bank Specialty for frequent borrowers is -0.016, more than
twice the size of the marginal effect for infrequent borrowers (-0.007).
In Panel B of Table 5, we repeat the tests in Panel A but measure the depth of lending
relationship by how long a sample firm has been interacting with the bank. In Column 1, we
observe that Bank Specialty remains negatively and significantly related to the incidence of loan
default, and the interaction between the dummy for long banking relationship and Bank Specialty
19
is negative and significant. This suggests that the role of relationship information is more
significant in predicting default in the presence of a longer-term banking relationship. Similarly, in
Columns 2 and 3, we re-run the probit regression model (2) for each sub-sample split based on the
duration of banking relationship. The marginal effect associated with Bank Specialty is nearly
three times larger for long-term borrowers (-0.019) than for short-term borrowers (-0.005).
In Panel C, we verify the results in Panels A and B using state ownership as a proxy for
lending relationship. Since non-state-owned firms may differ from state-owned firms in operation
and industry, we match each state-owned firm with a non-state-owned firm based on industry and
size.19 We repeat the same set of regressions and find similar results: Bank Specialty continues to
be negatively related to the incidence of default, for the overall sample, and for the two
subsamples of state- and non-state-owned firms. The marginal effect associated with Bank
Specialty is significantly larger for state-owned firms than that for non-state-owned firms. The
interaction term between Bank Specialty and a dummy for state-owned firm, while remains
negative, becomes statistically insignificant.
Columns 2 and 3 of Panels A through C also show that compared to those for firms that
have a sustained banking relationship, more hard information proxies remain significant even in
the presence of relationship information for firms that lack a sustained banking relationship. This
is despite the fact that their default rate is lower than that of firms having such a relationship. For
example, ROE, a hard information measure that is easily manipulated by Chinese firms,
consistently remains insignificant for firms that have a sustained banking relationship, but is
statistically significant for firms lacking a profound banking relationship. This highlights the
importance of a bank’s relationship information in replacing the type of hard information that is
subject to easy manipulation.
To summarize, Table 5 indicates that the economic and statistical significance of the
bank’s relationship information in predicting default depends on the extent of the relationship
between the bank and the borrowing firm. Bank Specialty is more likely to prevail over hard
information in the presence of a profound lending relationship.
Next, we further explore the economic significance of internal credit rating and Bank
Specialty in the context of odds ratios. In Table 6 Column 1, we repeat the analysis specified in
19 According to Hale and Long (2010), the large non-state-owned firms in China face less constraints than small ones, and have access to finances that are more equal to their SOE counterparts.
20
Table 2 Column 3 using logit model instead of probit model, and report the odds ratio for Rating.
In Columns 2 through 7, we report the odds ratios for Bank Specialty when we re-run Table 5 in a
logit regression framework. For brevity, control variables used in Tables 2 and 5 are included in
the logit regressions but not tabulated.
Column 1 reveals that the odds ratio for Rating is 0.639. This indicates that, for a one level
increase in internal credit rating, the odds ratio in favor of defaulting on loans in the following
year decreases to 63.9% of what it was before. Columns 2 through 7 reveal that the odds ratios
associated with Bank Specialty are lower than one, and are smaller among firms with a sustained
borrowing relationship. This indicates that more favorable relationship information leads to a
lower default probability, and the effect of relationship information is greater for firms with a
sustained borrowing relationship. To illustrate, the odds ratio for Bank Specialty is 0.679 for firms
that do not borrow frequently with the bank. This suggests that for a one unit increase in Bank
Specialty, the odds ratio in favor of defaulting on loans in the following year is 67.9% of what it
was before. By contrast, for firms that borrow frequently with the bank, the odds ratio in favor of
defaulting on loans is 59.8% of what was before, nearly 12% lower.
4.5 The Effect of Banking Relationship on Improvement in Default Prediction
So far we have shown that the impact of relationship information is both statistically and
economically greater for firms with a more sustained lending relationship. We now explore to
what extent the improvement in default prediction varies with the depth of banking relationship.
We adopt the ROC analysis similarly to the one used in Section 4.2. We first split the
sample based on whether or not a firm has a sustained relationship with the bank. Then for each
sub-sample, we calculate the areas under the ROC curve before and after including Bank Specialty,
respectively. The difference between the areas, ∆ROC, captures the magnitude of overall
improvement in default prediction due to the inclusion of the bank’s relationship information.
We repeat the calculation for each of the relationship proxies, and report the results in
Table 7. We observe that, consistent with our findings in previous sections, ∆ROC is statistically
significant for all sub-samples, indicating that the inclusion of the bank’s relationship information
significantly improves default predictability. More importantly, the magnitude of ∆ROC is always
much larger for firms that have a sustained banking relationship than for firms that lack such a
relationship. For example, when borrowing frequency is used to measure the depth of banking
21
relationship, ∆ROC is 0.059 for frequent borrowers, indicating that including Bank Specialty
raises the probability that the model discriminates correctly between a true defaulter and a true
non-defaulter by 5.9 percentage points. This is over twice the size of ∆ROC for infrequent
borrowers, whereas including Bank Specialty improves the model predictability by 2.6 percentage
points. These results indicate that the bank’s relationship information plays a much more
important role in improving default prediction if the bank has a more sustained relationship with
the borrowing firms.
Lastly, we attempt to explore whether the difference in the change in ROC is statistically
significant between firms with or without a profound borrowing relationship with the bank. We
proceed as follows: we first compute the percentage increase in ROC area by scaling ∆ROC
(Column 4) by ROC prior to the inclusion of this relationship information variable (Column 2).
We repeat this percentage increase in ROC area for each of the subsamples for all three proxies
measuring the depth of lending relationship. We then test the difference between the two
percentage changes using bootstrapped standard errors. To illustrate, consider borrowing
frequency as a proxy for banking relationship. Among firms with frequent borrowing activities
with the bank, the inclusion of Bank Specialty leads to a 6.99% increase in the area under the
ROC curve. This is in contrast to firms without frequent borrowing activities, in which case the
inclusion of Bank Specialty leads to only a 2.94% increase in the area under the ROC curve. The
difference between the two—4.05%—is statistically significant at the 5% level. We observe
similar results when using duration as a proxy for banking relationship, with the difference being
significant at the 10% level (p = 0.085). For state ownership proxy, where the results are based on
a matched sample, the percentage increase in ROC is larger for state-owned firms than for non-
state-owned firms, albeit the difference is not statistically significant.
5. ROBUSTNESS
As described in detail in Internet Appendix A of this paper, our results are robust to
alternative definitions of loan default, the bank’s relationship information, and the depth of
banking relationship, as well as alternative sample specifications such as loan-level analysis,
exclusion of implicit loan rollovers, and large firm subsample. We also re-estimate our results
using alternative model specifications exploring the nonlinear relationship between hard
information and credit rating, including province fixed effects, and using OLS specification
22
instead of probit specification. We find generally consistent evidence in support of our main
findings.
6. CONCLUSION
In this paper we study the nature and role of banks’ information, which evolved from
sustained lending relationships with firms, in the context of loan default. Using a proprietary
database from one of the largest state-owned commercial banks in China, we first document that
proxies for firm-specific hard information, such as financial ratios derived from firms’ financial
statements, are significantly related to the probability of loan default, and that the bank’s internal
credit rating scores play an important role in predicting default.
Further analysis reveals that while the internal credit rating incorporates firm-specific hard
information, it is the information component arising from the bank’s lending relationship that
contributes to the improvement in assessing credit quality. More importantly, the extent that
relationship information improves default prediction depends on the depth of the lending
relationship and the quality of hard information. When evaluating loan delinquency, the bank’s
relationship information plays an economically and statistically stronger role in the presence of a
more sustained lending relationship. Our findings are consistent with the theoretical implications
regarding relationship lending in the existing literature. Our findings also shed light on the
economic impact of relationship information on large firms and commercial loans, which is
usually absent from the literature.
Lastly, while the Chinese commercial banks still face various operating and governance
inefficiencies, our findings suggest that, at least with regard to credit ratings, loan decisions by
Chinese banks are based on commercial principles instead of government policies. This may have
contributed to the overall performance improvement of Chinese banks in recent years.
23
REFERENCES
Agarwal, Sumit, and Robert Hauswald, 2012, Distance and private information in lending,
Review of Financial Studies 23, 2757-2788.
Agarwal, Sumit, Souphala Chomsisengphet, Chunlin Liu, and Nicholas S. Souleles, 2010,
Benefits of relationship banking: Evidence from consumer credit markets. Working Paper,
University of Pennsylvania.
Agarwal, Sumit, Brent Ambrose, Souphala Chomsisengphet, and Chunlin Liu, 2011, The role of
soft information in a dynamic contract setting: Evidence from the home equity credit
market, Journal of Money, Credit, and Banking 43, 633-655.
Altman, Edward, I., 1968, Financial ratios, discriminant analysis and the prediction of corporate
bankruptcy, Journal of Finance 23, 589-609.
Berger, Allen, N., and Gregory Udell, 1995, Relationship lending and lines of credit in small
firm finance, Journal of Business 68, 351-382.
Berger, Allen, N., W. Scott Frame, and Nathan H. Miller, 2005, Credit scoring and the
availability, price, and risk of small business credit, Journal of Money, Banking, and
Credit 37, 191-222.
Berger, Allen N., Nathan H. Miller, Mitchell A. Petersen, Raghuram G. Rajan, Jeremy C. Stein,
2005, Does function follow organizational form? Evidence from the lending practices of
large and small banks, Journal of Financial Economics 76, 237-269.
Berger, Allen N., and Gregory F. Udell, 1995, Relationship lending and lines of credit in small
firm finance, Journal of Business 68, 351-381.
Bhattacharaya, Sudipto, and Anjan V. Thakor, 1993, Contemporary banking theory, Journal of
Financial Intermediation 3, 2-50.
Boot, Arnoud, 2000, Relationship banking: What do we know? Journal of Financial
Intermediation 9, 7-25.
Boyd, John H., and Edward C. Prescott, 1986, Financial intermediary-coalitions, Journal of
Economic Theory 38, 211-232.
Cerqueiro, Geraldo, Hans Degryse, and Steven Ongena, 2008, Rules versus discretion in loan
rate setting, Working Paper, Tilburg University.
24
Chang, Chun, and Yijiang Wang, 1994, The nature of township-village enterprises, Journal of
Comparative Economics 19, 434-452.
Czarnitzki, Dirk, and Kornelius Kraft, 2001, Are credit ratings valuable information? ZEW
Discussion Paper No. 04-07, Center for European Economic Research.
Diamond, Douglas, 1984, Financial intermediation and delegated monitoring, Review of
Economic Studies 51, 393-414.
Dow, James, and Gary Gorton, 1997, Stock market efficiency and economic efficiency: Is there a
connection? Journal of Finance 52, 1087-1129.
Efron, B. 1979, Bootstrap methods: Another look at the jackknife, Annals of Statistics 7, 1-26.
English, William B., and William R. Nelson, 1999, Bank risk rating of business loans. In
Proceedings of the 35th Annual Conference on Bank Structure and Competition.
Frame, W. Scott, Aruna Srinivasan, and Lynn Wooseley, 2001, The effect of credit scoring on
small-business lending, Journal of Money, Banking, and Credit 33, 813-825.
Garber, Steven G., and Dale J. Poirier, 1974, The determinants of aerospace profit rates,
Southern Economic Journal 41, 228-238.
Gorton, Gary, and Andrew Winton, 2003, Financial intermediation, In G. Constantinides, M.
Harris, and R. Stulz (eds.), Handbooks in the Economics of Finance, Volume 1A:
Corporate Finance, Elsevier Science.
García-Herrero, Alicia, Sergio Gavilá, and Daniel Santabárbara, 2006, China’s banking reform:
An assessment of its evolution and possible impact, CESifo Economic Studies 52, 304-
363.
Grunert, Jens, Lars Norden, and Martin Weber, 2005, The role of non-financial factors in
internal credit ratings, Journal of Banking and Finance 29, 509-531.
Hale, Galina, and Cheryl Long, 2010, What are the sources of financing of the Chinese firms?
Working Paper, Federal Reserve Bank of San Francisco.
Hart, Oliver, and Bengt Holmstrom, 1987, The Theory of Contracts in T. Bewley, ed., Advances
in Economic Theory, Fifth World Congress, Cambridge University Press.
Pepe, Margaret S., 2003, The Statistical Evaluation of Medical Tests for Classification and
Prediction, Oxford University Press, New York, USA.
Petersen, Mitchell A. 2004. Information: Hard and soft, Working Paper, Northwestern University.
25
Petersen, Mitchell A., and Raghuram G. Rajan, 1994, The benefits of lending relationship:
Evidence from small business data, Journal of Finance 49, 3-37.
Poirier, Dale J., 1974. The Econometrics of Structural Change, Amsterdam: North Holland.
Puri, Manju, and Jörg Rocholl, 2008, On the importance of retail banking relationships, Journal
of Financial Economics 89, 253-267.
Puri, Manju, Jörg Rocholl, and Sascha Steffen, 2012, On the importance of prior relationships in
bank loans to retail customers, Working Paper, Duke University.
Ramakrishnan, Ram, T. S., and Anjan V. Thakor, 1984, Information reliability and a theory of
financial intermediation, Review of Economic Studies 51, 415-432.
Scott, Jonathan A., 2004, Small business and the value of community financial institutions,
Journal of Financial Services Research 25, 207-230.
Uchida, Hirofumi, Gregory F. Udell, and Nobuyoshi Yamori, 2007, SME financing and the
deployment of lending technologies in Japan, Working Paper, Indiana University.
26
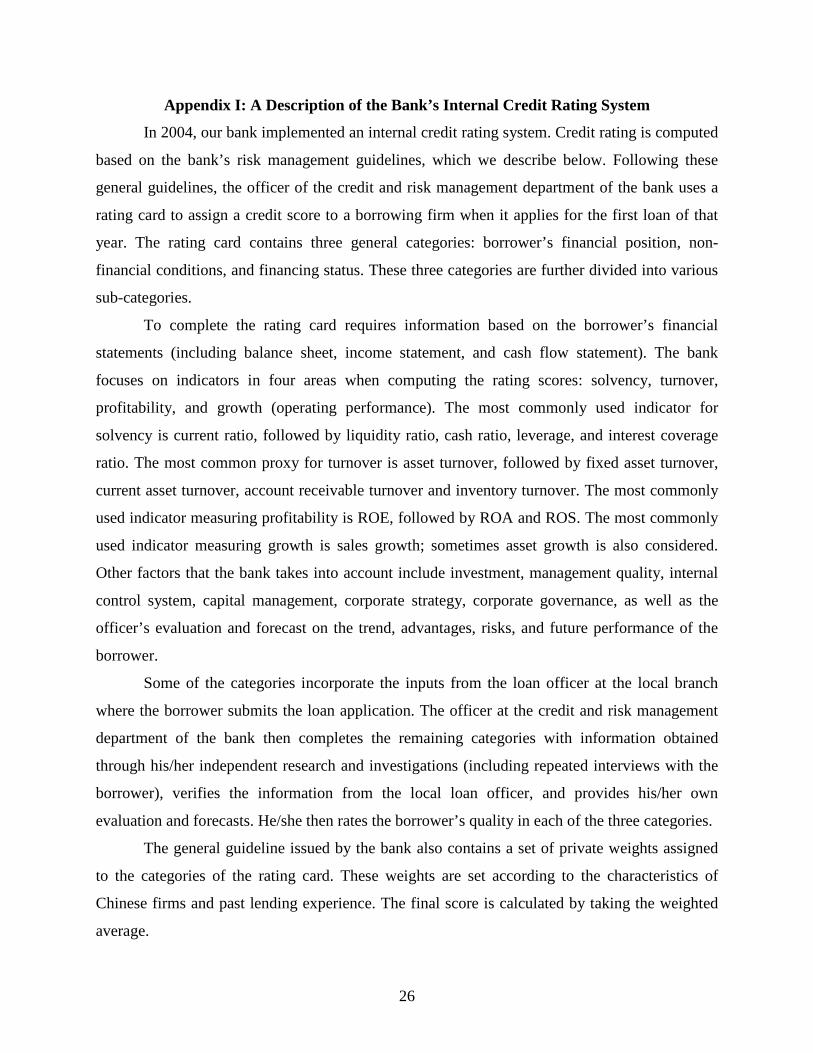
Appendix I: A Description of the Bank’s Internal Credit Rating System
In 2004, our bank implemented an internal credit rating system. Credit rating is computed
based on the bank’s risk management guidelines, which we describe below. Following these
general guidelines, the officer of the credit and risk management department of the bank uses a
rating card to assign a credit score to a borrowing firm when it applies for the first loan of that
year. The rating card contains three general categories: borrower’s financial position, non-
financial conditions, and financing status. These three categories are further divided into various
sub-categories.
To complete the rating card requires information based on the borrower’s financial
statements (including balance sheet, income statement, and cash flow statement). The bank
focuses on indicators in four areas when computing the rating scores: solvency, turnover,
profitability, and growth (operating performance). The most commonly used indicator for
solvency is current ratio, followed by liquidity ratio, cash ratio, leverage, and interest coverage
ratio. The most common proxy for turnover is asset turnover, followed by fixed asset turnover,
current asset turnover, account receivable turnover and inventory turnover. The most commonly
used indicator measuring profitability is ROE, followed by ROA and ROS. The most commonly
used indicator measuring growth is sales growth; sometimes asset growth is also considered.
Other factors that the bank takes into account include investment, management quality, internal
control system, capital management, corporate strategy, corporate governance, as well as the
officer’s evaluation and forecast on the trend, advantages, risks, and future performance of the
borrower.
Some of the categories incorporate the inputs from the loan officer at the local branch
where the borrower submits the loan application. The officer at the credit and risk management
department of the bank then completes the remaining categories with information obtained
through his/her independent research and investigations (including repeated interviews with the
borrower), verifies the information from the local loan officer, and provides his/her own
evaluation and forecasts. He/she then rates the borrower’s quality in each of the three categories.
The general guideline issued by the bank also contains a set of private weights assigned
to the categories of the rating card. These weights are set according to the characteristics of
Chinese firms and past lending experience. The final score is calculated by taking the weighted
average.
27
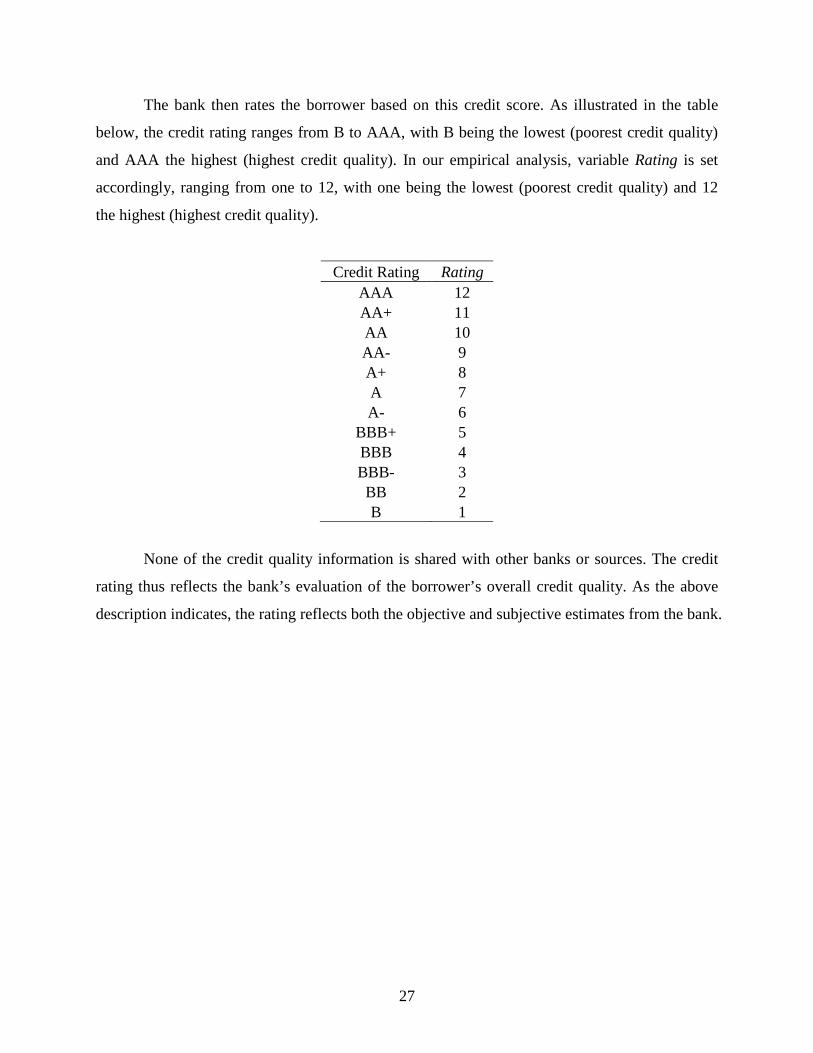
The bank then rates the borrower based on this credit score. As illustrated in the table
below, the credit rating ranges from B to AAA, with B being the lowest (poorest credit quality)
and AAA the highest (highest credit quality). In our empirical analysis, variable Rating is set
accordingly, ranging from one to 12, with one being the lowest (poorest credit quality) and 12
the highest (highest credit quality).
Credit Rating Rating AAA 12 AA+ 11 AA 10 AA- 9 A+ 8 A 7 A- 6
BBB+ 5 BBB 4 BBB- 3 BB 2 B 1
None of the credit quality information is shared with other banks or sources. The credit
rating thus reflects the bank’s evaluation of the borrower’s overall credit quality. As the above
description indicates, the rating reflects both the objective and subjective estimates from the bank.

28
Appendix II: Variable Definitions
Variables Definition Measured as of Year
Default A dummy variable that equals one if a firm defaults on its short-term loans and zero otherwise. Default occurs if a short-term loan is unpaid or written off at the end of the following year.
This variable is measured at one year after the year when the loan is originated.
Rating Numerical score for the bank’s internal credit rating. The score is 12 for a firm with the highest credit rating of AAA, and 11 for the second highest credit rating of AA, and so on. It is 1 for the lowest credit rating of B.
This variable is measured as of the year when the loan is originated.
Listed Firm A dummy variable equal to one if a firm is publicly traded, and zero otherwise.
Size The natural log of book value of total assets at the end of year.
This variable is measured at one year before the year when the loan is originated.
Leverage Calculated as total liabilities divided by total assets at the end of year.
ROE Return on equity, calculated as net income divided by shareholders’ equity.
Asset Turnover Calculated as total sales divided by the net value of Plant, Property and Equipment (PP&E).
Cash Calculated as current assets divided by total assets at the end of year.
Sales Growth Sales growth is calculated as the difference in the sales between current year and previous year divided by the sales in previous year. It is coded as zero for missing value.
D(Sales Growth) A dummy variable equal to one if the initial sales growth is missing, and zero otherwise.
Previous Default A dummy variable equal to one if a firm has defaulted on loans before, and zero otherwise.
This variable is measured as of the year when the loan is originated.
Maturity Weighted average of short-term loan maturities borrowed by a firm in year. The weight is based on loan principals.
Log(GDP) The natural log of GDP per capita of the province where the loan is originated.
State A dummy variable equal to one if a firm is owned or controlled by the state, and zero otherwise.
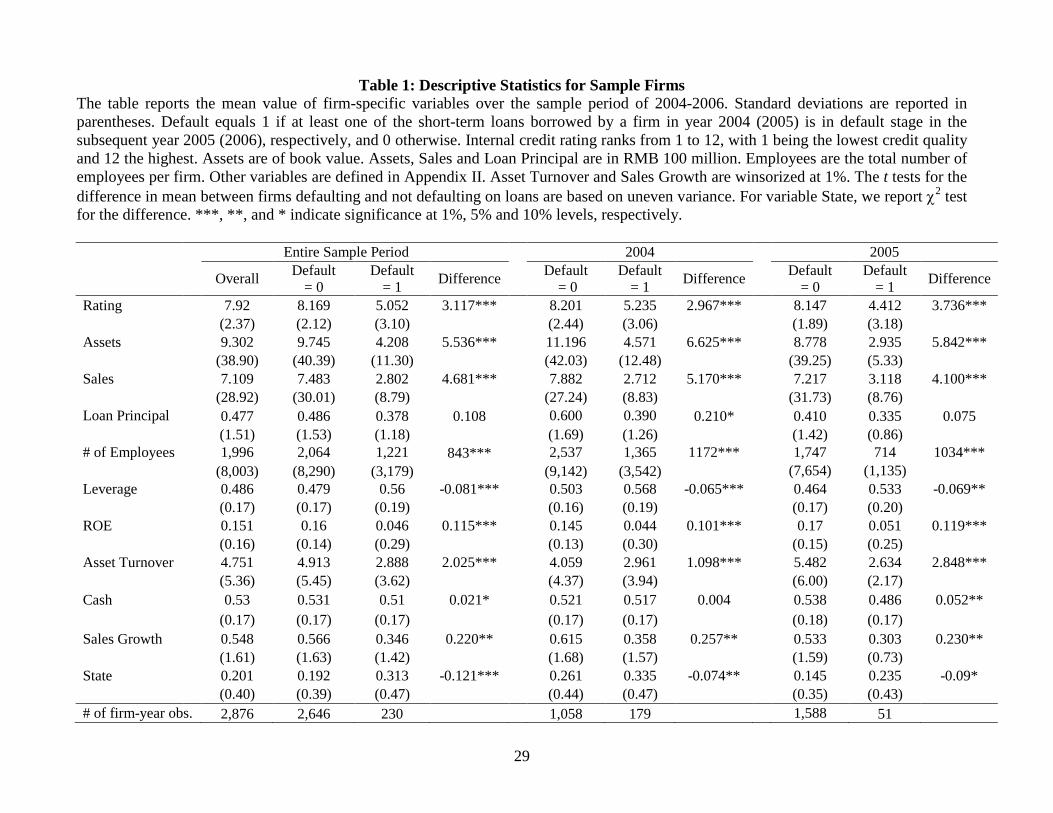
29
Table 1: Descriptive Statistics for Sample Firms The table reports the mean value of firm-specific variables over the sample period of 2004-2006. Standard deviations are reported in parentheses. Default equals 1 if at least one of the short-term loans borrowed by a firm in year 2004 (2005) is in default stage in the subsequent year 2005 (2006), respectively, and 0 otherwise. Internal credit rating ranks from 1 to 12, with 1 being the lowest credit quality and 12 the highest. Assets are of book value. Assets, Sales and Loan Principal are in RMB 100 million. Employees are the total number of employees per firm. Other variables are defined in Appendix II. Asset Turnover and Sales Growth are winsorized at 1%. The t tests for the difference in mean between firms defaulting and not defaulting on loans are based on uneven variance. For variable State, we report χ2 test for the difference. ***, **, and * indicate significance at 1%, 5% and 10% levels, respectively. Entire Sample Period 2004 2005
Overall Default = 0
Default = 1 Difference Default
= 0 Default
= 1 Difference Default = 0
Default = 1 Difference
Rating 7.92 8.169 5.052 3.117*** 8.201 5.235 2.967*** 8.147 4.412 3.736***
(2.37) (2.12) (3.10) (2.44) (3.06) (1.89) (3.18) Assets 9.302 9.745 4.208 5.536*** 11.196 4.571 6.625*** 8.778 2.935 5.842***
(38.90) (40.39) (11.30) (42.03) (12.48) (39.25) (5.33) Sales 7.109 7.483 2.802 4.681*** 7.882 2.712 5.170*** 7.217 3.118 4.100***
(28.92) (30.01) (8.79) (27.24) (8.83) (31.73) (8.76) Loan Principal 0.477 0.486 0.378 0.108 0.600 0.390 0.210* 0.410 0.335 0.075
(1.51) (1.53) (1.18) (1.69) (1.26) (1.42) (0.86)
# of Employees 1,996 2,064 1,221 843*** 2,537 1,365 1172*** 1,747 714 1034***
(8,003) (8,290) (3,179) (9,142) (3,542) (7,654) (1,135)
Leverage 0.486 0.479 0.56 -0.081*** 0.503 0.568 -0.065*** 0.464 0.533 -0.069**
(0.17) (0.17) (0.19) (0.16) (0.19) (0.17) (0.20) ROE 0.151 0.16 0.046 0.115*** 0.145 0.044 0.101*** 0.17 0.051 0.119***
(0.16) (0.14) (0.29) (0.13) (0.30) (0.15) (0.25) Asset Turnover 4.751 4.913 2.888 2.025*** 4.059 2.961 1.098*** 5.482 2.634 2.848***
(5.36) (5.45) (3.62) (4.37) (3.94) (6.00) (2.17) Cash 0.53 0.531 0.51 0.021* 0.521 0.517 0.004 0.538 0.486 0.052**
(0.17) (0.17) (0.17) (0.17) (0.17) (0.18) (0.17) Sales Growth 0.548 0.566 0.346 0.220** 0.615 0.358 0.257** 0.533 0.303 0.230** (1.61) (1.63) (1.42) (1.68) (1.57) (1.59) (0.73) State 0.201 0.192 0.313 -0.121*** 0.261 0.335 -0.074** 0.145 0.235 -0.09*
(0.40) (0.39) (0.47) (0.44) (0.47) (0.35) (0.43) # of firm-year obs. 2,876 2,646 230 1,058 179 1,588 51
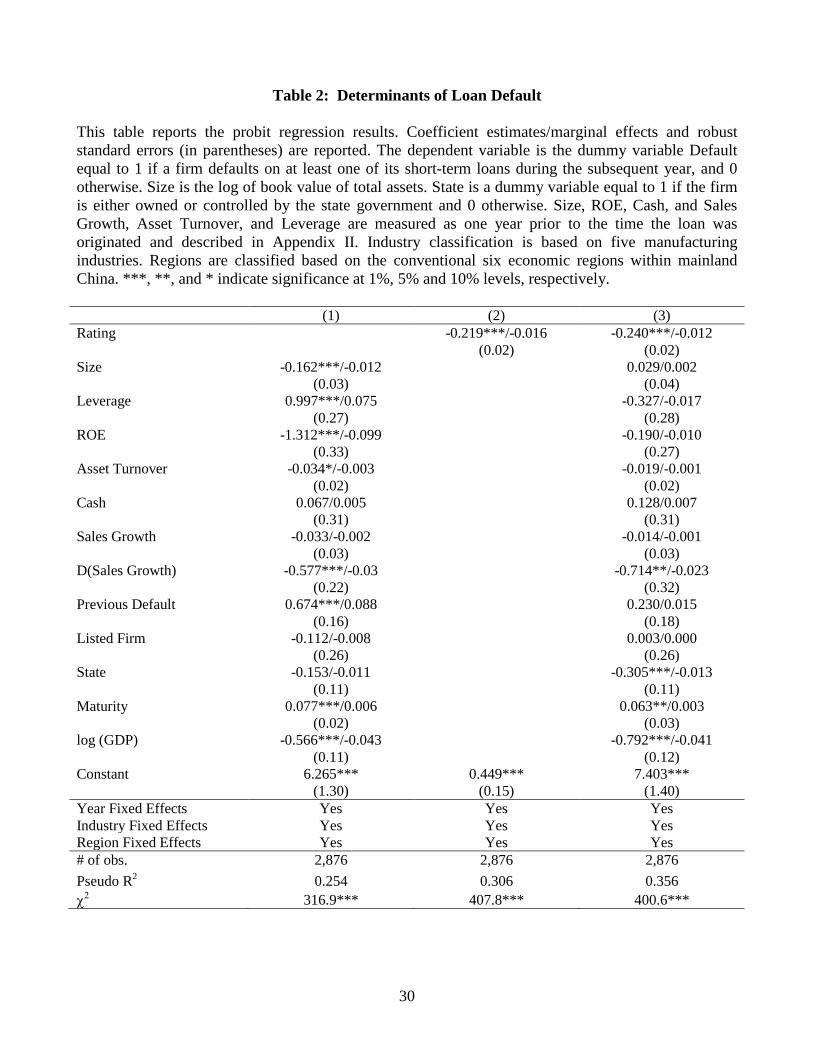
30
Table 2: Determinants of Loan Default This table reports the probit regression results. Coefficient estimates/marginal effects and robust standard errors (in parentheses) are reported. The dependent variable is the dummy variable Default equal to 1 if a firm defaults on at least one of its short-term loans during the subsequent year, and 0 otherwise. Size is the log of book value of total assets. State is a dummy variable equal to 1 if the firm is either owned or controlled by the state government and 0 otherwise. Size, ROE, Cash, and Sales Growth, Asset Turnover, and Leverage are measured as one year prior to the time the loan was originated and described in Appendix II. Industry classification is based on five manufacturing industries. Regions are classified based on the conventional six economic regions within mainland China. ***, **, and * indicate significance at 1%, 5% and 10% levels, respectively. (1) (2) (3) Rating
-0.219***/-0.016 -0.240***/-0.012
(0.02) (0.02)
Size -0.162***/-0.012
0.029/0.002
(0.03)
(0.04)
Leverage 0.997***/0.075
-0.327/-0.017
(0.27)
(0.28)
ROE -1.312***/-0.099
-0.190/-0.010
(0.33)
(0.27)
Asset Turnover -0.034*/-0.003
-0.019/-0.001
(0.02)
(0.02)
Cash 0.067/0.005
0.128/0.007
(0.31)
(0.31)
Sales Growth -0.033/-0.002
-0.014/-0.001
(0.03)
(0.03)
D(Sales Growth) -0.577***/-0.03
-0.714**/-0.023
(0.22)
(0.32)
Previous Default 0.674***/0.088
0.230/0.015
(0.16)
(0.18)
Listed Firm -0.112/-0.008
0.003/0.000
(0.26)
(0.26)
State -0.153/-0.011
-0.305***/-0.013
(0.11)
(0.11)
Maturity 0.077***/0.006
0.063**/0.003
(0.02)
(0.03)
log (GDP) -0.566***/-0.043
-0.792***/-0.041
(0.11)
(0.12)
Constant 6.265*** 0.449*** 7.403*** (1.30) (0.15) (1.40) Year Fixed Effects Yes Yes Yes Industry Fixed Effects Yes Yes Yes Region Fixed Effects Yes Yes Yes # of obs. 2,876 2,876 2,876 Pseudo R2 0.254 0.306 0.356 χ2 316.9*** 407.8*** 400.6***
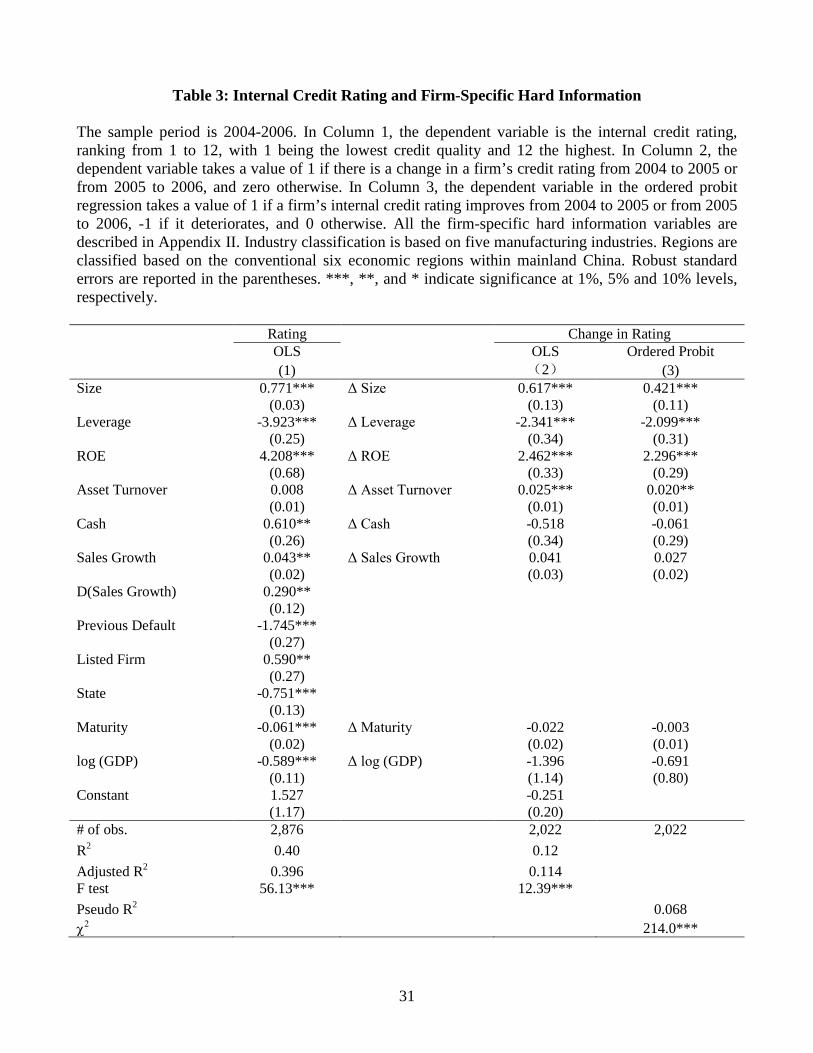
31
Table 3: Internal Credit Rating and Firm-Specific Hard Information The sample period is 2004-2006. In Column 1, the dependent variable is the internal credit rating, ranking from 1 to 12, with 1 being the lowest credit quality and 12 the highest. In Column 2, the dependent variable takes a value of 1 if there is a change in a firm’s credit rating from 2004 to 2005 or from 2005 to 2006, and zero otherwise. In Column 3, the dependent variable in the ordered probit regression takes a value of 1 if a firm’s internal credit rating improves from 2004 to 2005 or from 2005 to 2006, -1 if it deteriorates, and 0 otherwise. All the firm-specific hard information variables are described in Appendix II. Industry classification is based on five manufacturing industries. Regions are classified based on the conventional six economic regions within mainland China. Robust standard errors are reported in the parentheses. ***, **, and * indicate significance at 1%, 5% and 10% levels, respectively. Rating Change in Rating
OLS
OLS Ordered Probit
(1) (2) (3) Size 0.771*** Δ Size 0.617*** 0.421***
(0.03)
(0.13) (0.11)
Leverage -3.923*** Δ Leverage -2.341*** -2.099***
(0.25)
(0.34) (0.31)
ROE 4.208*** Δ ROE 2.462*** 2.296***
(0.68)
(0.33) (0.29)
Asset Turnover 0.008 Δ Asset Turnover 0.025*** 0.020**
(0.01)
(0.01) (0.01)
Cash 0.610** Δ Cash -0.518 -0.061
(0.26)
(0.34) (0.29)
Sales Growth 0.043** Δ Sales Growth 0.041 0.027
(0.02)
(0.03) (0.02)
D(Sales Growth) 0.290**
(0.12)
Previous Default -1.745***
(0.27)
Listed Firm 0.590**
(0.27)
State -0.751***
(0.13)
Maturity -0.061*** Δ Maturity -0.022 -0.003
(0.02)
(0.02) (0.01)
log (GDP) -0.589*** Δ log (GDP) -1.396 -0.691
(0.11)
(1.14) (0.80)
Constant 1.527
-0.251 (1.17) (0.20)
# of obs. 2,876
2,022 2,022 R2 0.40
0.12
Adjusted R2 0.396
0.114 F test 56.13***
12.39***
Pseudo R2
0.068 χ2 214.0***
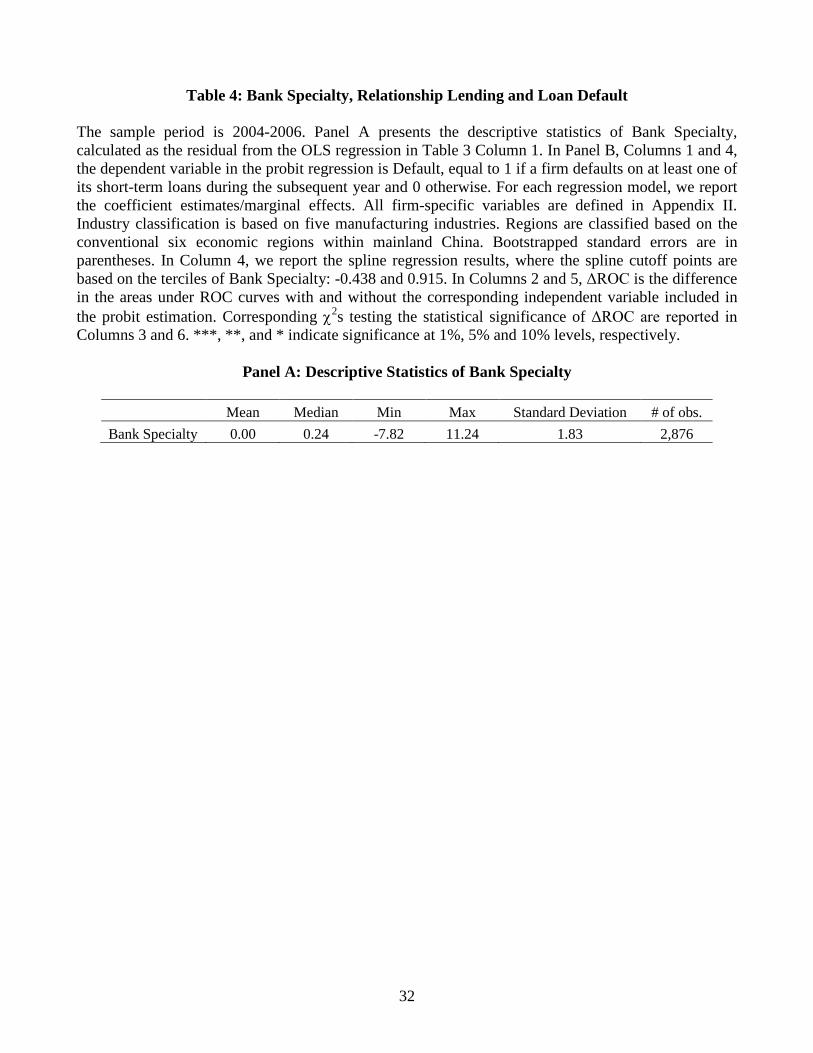
32
Table 4: Bank Specialty, Relationship Lending and Loan Default The sample period is 2004-2006. Panel A presents the descriptive statistics of Bank Specialty, calculated as the residual from the OLS regression in Table 3 Column 1. In Panel B, Columns 1 and 4, the dependent variable in the probit regression is Default, equal to 1 if a firm defaults on at least one of its short-term loans during the subsequent year and 0 otherwise. For each regression model, we report the coefficient estimates/marginal effects. All firm-specific variables are defined in Appendix II. Industry classification is based on five manufacturing industries. Regions are classified based on the conventional six economic regions within mainland China. Bootstrapped standard errors are in parentheses. In Column 4, we report the spline regression results, where the spline cutoff points are based on the terciles of Bank Specialty: -0.438 and 0.915. In Columns 2 and 5, ΔROC is the difference in the areas under ROC curves with and without the corresponding independent variable included in the probit estimation. Corresponding χ2s testing the statistical significance of ΔROC are reported in Columns 3 and 6. ***, **, and * indicate significance at 1%, 5% and 10% levels, respectively.
Panel A: Descriptive Statistics of Bank Specialty
Mean Median Min Max Standard Deviation # of obs. Bank Specialty 0.00 0.24 -7.82 11.24 1.83 2,876
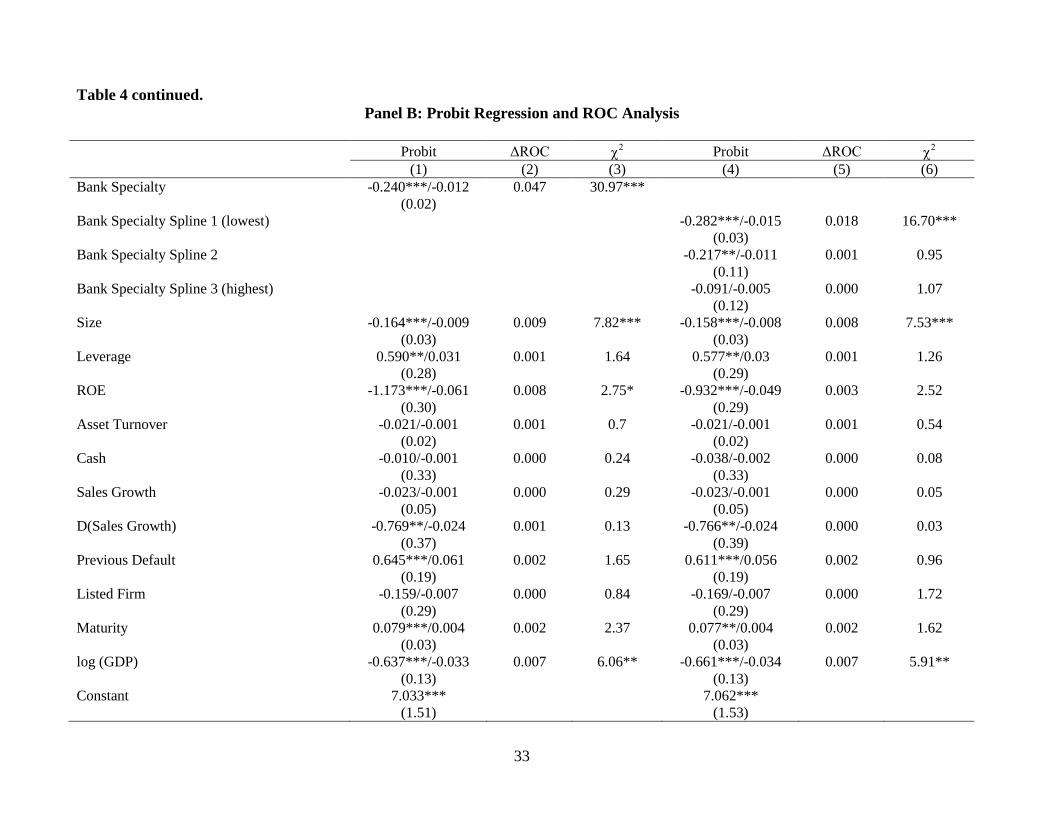
33
Table 4 continued. Panel B: Probit Regression and ROC Analysis
Probit ΔROC χ2 Probit ΔROC χ2 (1) (2) (3) (4) (5) (6) Bank Specialty -0.240***/-0.012 0.047 30.97***
(0.02) Bank Specialty Spline 1 (lowest)
-0.282***/-0.015 0.018 16.70***
(0.03)
Bank Specialty Spline 2
-0.217**/-0.011 0.001 0.95
(0.11)
Bank Specialty Spline 3 (highest)
-0.091/-0.005 0.000 1.07
(0.12)
Size -0.164***/-0.009 0.009 7.82*** -0.158***/-0.008 0.008 7.53***
(0.03)
(0.03)
Leverage 0.590**/0.031 0.001 1.64 0.577**/0.03 0.001 1.26
(0.28)
(0.29)
ROE -1.173***/-0.061 0.008 2.75* -0.932***/-0.049 0.003 2.52
(0.30)
(0.29)
Asset Turnover -0.021/-0.001 0.001 0.7 -0.021/-0.001 0.001 0.54
(0.02)
(0.02)
Cash -0.010/-0.001 0.000 0.24 -0.038/-0.002 0.000 0.08
(0.33)
(0.33)
Sales Growth -0.023/-0.001 0.000 0.29 -0.023/-0.001 0.000 0.05
(0.05)
(0.05)
D(Sales Growth) -0.769**/-0.024 0.001 0.13 -0.766**/-0.024 0.000 0.03
(0.37)
(0.39)
Previous Default 0.645***/0.061 0.002 1.65 0.611***/0.056 0.002 0.96
(0.19)
(0.19)
Listed Firm -0.159/-0.007 0.000 0.84 -0.169/-0.007 0.000 1.72
(0.29)
(0.29)
Maturity 0.079***/0.004 0.002 2.37 0.077**/0.004 0.002 1.62
(0.03)
(0.03)
log (GDP) -0.637***/-0.033 0.007 6.06** -0.661***/-0.034 0.007 5.91**
(0.13)
(0.13)
Constant 7.033***
7.062***
(1.51)
(1.53)
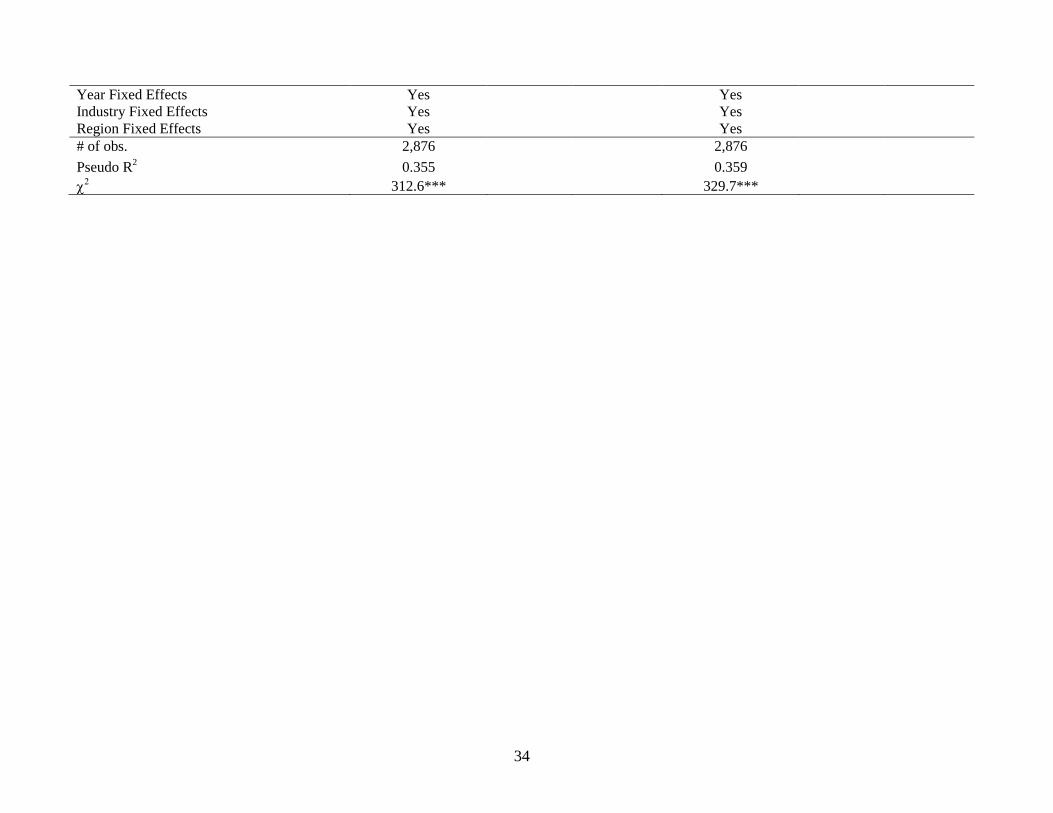
34
Year Fixed Effects Yes
Yes Industry Fixed Effects Yes
Yes
Region Fixed Effects Yes Yes # of obs. 2,876
2,876
Pseudo R2 0.355
0.359 χ2 312.6*** 329.7***

35
Table 5: Depth of Lending Relationship and the Role of Relationship Information In this table we report the probit regression results relating to the proxies for the depth of lending relationship. The dependent variable in the probit regression is Default, equal to 1 if a firm defaults on at least one of its short-term loans during the subsequent year and 0 otherwise. A firm is classified as a frequent (infrequent) borrower if it has borrowed from the bank more than (less than or equal to) 9 times (sample median). For a given firm in a given year, duration is computed as the difference between the month that the firm obtained its last loan in that year and the earliest recorded time of its previous loans in the dataset prior to that month. A firm is classified as having a long- (short-) term relationship with the bank if the duration is greater than (less than or equal to) 19 months (sample median). A firm is stated-owned if it is owned or controlled by the state government. Bank Specialty is the residual from the OLS regression in Table 3 Column 1. The regressions in Panels A and B use the entire sample. The regressions in Panel C use a matched sample where a state-owned firm is matched by industry and size with a non-state-owned firm. For each regression model, we report the coefficient estimates/marginal effects. All firm-specific variables are defined in Appendix II. Industry classification is based on five manufacturing industries. Regions are classified based on the conventional six economic regions within mainland China. Bootstrapped standard errors are in parentheses. ***, **, and * indicate significance at 1%, 5% and 10% levels, respectively.
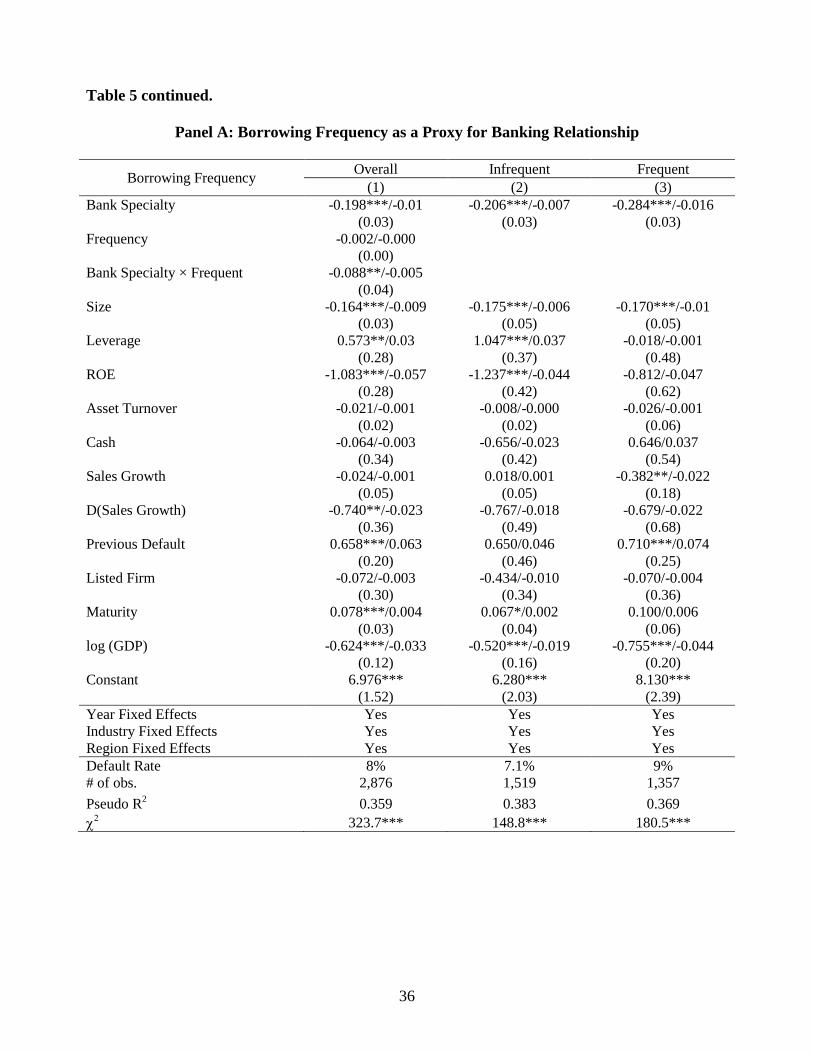
36
Table 5 continued.
Panel A: Borrowing Frequency as a Proxy for Banking Relationship
Borrowing Frequency Overall Infrequent Frequent (1) (2) (3)
Bank Specialty -0.198***/-0.01 -0.206***/-0.007 -0.284***/-0.016
(0.03) (0.03) (0.03)
Frequency -0.002/-0.000
(0.00)
Bank Specialty × Frequent -0.088**/-0.005
(0.04)
Size -0.164***/-0.009 -0.175***/-0.006 -0.170***/-0.01
(0.03) (0.05) (0.05)
Leverage 0.573**/0.03 1.047***/0.037 -0.018/-0.001
(0.28) (0.37) (0.48)
ROE -1.083***/-0.057 -1.237***/-0.044 -0.812/-0.047
(0.28) (0.42) (0.62)
Asset Turnover -0.021/-0.001 -0.008/-0.000 -0.026/-0.001
(0.02) (0.02) (0.06)
Cash -0.064/-0.003 -0.656/-0.023 0.646/0.037
(0.34) (0.42) (0.54)
Sales Growth -0.024/-0.001 0.018/0.001 -0.382**/-0.022
(0.05) (0.05) (0.18)
D(Sales Growth) -0.740**/-0.023 -0.767/-0.018 -0.679/-0.022
(0.36) (0.49) (0.68)
Previous Default 0.658***/0.063 0.650/0.046 0.710***/0.074
(0.20) (0.46) (0.25)
Listed Firm -0.072/-0.003 -0.434/-0.010 -0.070/-0.004
(0.30) (0.34) (0.36)
Maturity 0.078***/0.004 0.067*/0.002 0.100/0.006
(0.03) (0.04) (0.06)
log (GDP) -0.624***/-0.033 -0.520***/-0.019 -0.755***/-0.044
(0.12) (0.16) (0.20)
Constant 6.976*** 6.280*** 8.130*** (1.52) (2.03) (2.39) Year Fixed Effects Yes Yes Yes Industry Fixed Effects Yes Yes Yes Region Fixed Effects Yes Yes Yes Default Rate 8% 7.1% 9% # of obs. 2,876 1,519 1,357 Pseudo R2 0.359 0.383 0.369 χ2 323.7*** 148.8*** 180.5***
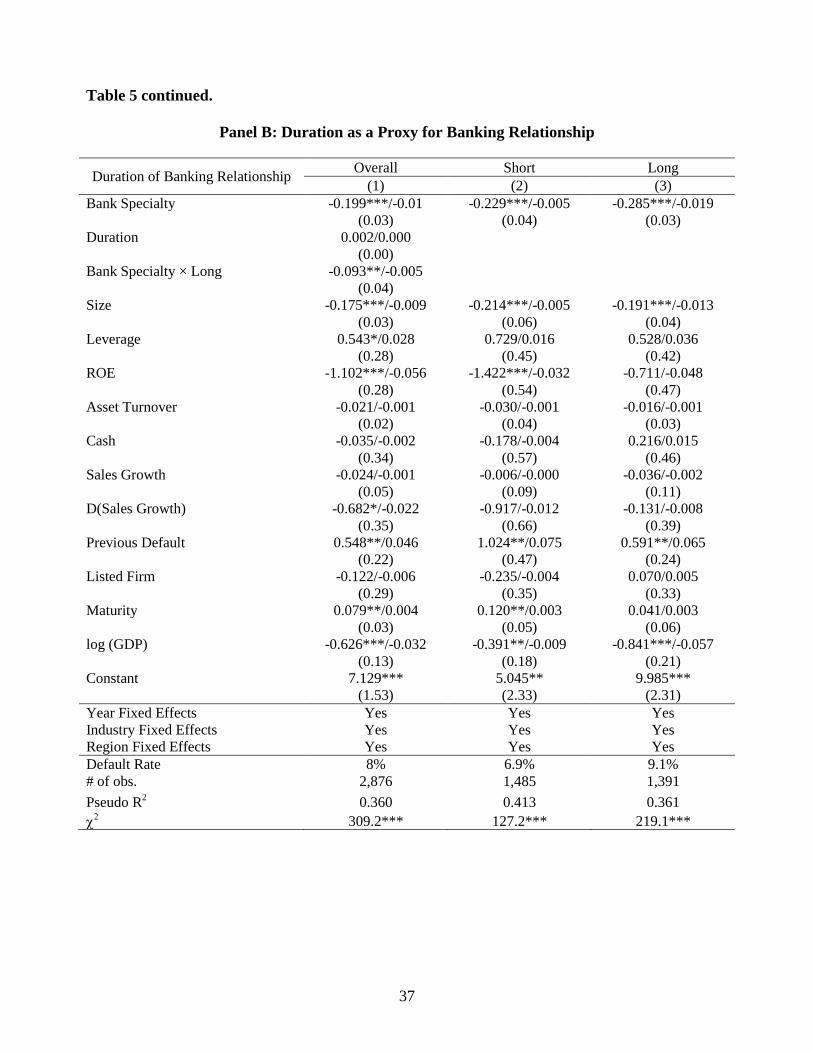
37
Table 5 continued.
Panel B: Duration as a Proxy for Banking Relationship
Duration of Banking Relationship Overall Short Long (1) (2) (3)
Bank Specialty -0.199***/-0.01 -0.229***/-0.005 -0.285***/-0.019
(0.03) (0.04) (0.03)
Duration 0.002/0.000
(0.00)
Bank Specialty × Long -0.093**/-0.005
(0.04)
Size -0.175***/-0.009 -0.214***/-0.005 -0.191***/-0.013
(0.03) (0.06) (0.04)
Leverage 0.543*/0.028 0.729/0.016 0.528/0.036
(0.28) (0.45) (0.42)
ROE -1.102***/-0.056 -1.422***/-0.032 -0.711/-0.048
(0.28) (0.54) (0.47)
Asset Turnover -0.021/-0.001 -0.030/-0.001 -0.016/-0.001
(0.02) (0.04) (0.03)
Cash -0.035/-0.002 -0.178/-0.004 0.216/0.015
(0.34) (0.57) (0.46)
Sales Growth -0.024/-0.001 -0.006/-0.000 -0.036/-0.002
(0.05) (0.09) (0.11)
D(Sales Growth) -0.682*/-0.022 -0.917/-0.012 -0.131/-0.008
(0.35) (0.66) (0.39)
Previous Default 0.548**/0.046 1.024**/0.075 0.591**/0.065
(0.22) (0.47) (0.24)
Listed Firm -0.122/-0.006 -0.235/-0.004 0.070/0.005
(0.29) (0.35) (0.33)
Maturity 0.079**/0.004 0.120**/0.003 0.041/0.003
(0.03) (0.05) (0.06)
log (GDP) -0.626***/-0.032 -0.391**/-0.009 -0.841***/-0.057
(0.13) (0.18) (0.21)
Constant 7.129*** 5.045** 9.985*** (1.53) (2.33) (2.31) Year Fixed Effects Yes Yes Yes Industry Fixed Effects Yes Yes Yes Region Fixed Effects Yes Yes Yes Default Rate 8% 6.9% 9.1% # of obs. 2,876 1,485 1,391 Pseudo R2 0.360 0.413 0.361 χ2 309.2*** 127.2*** 219.1***
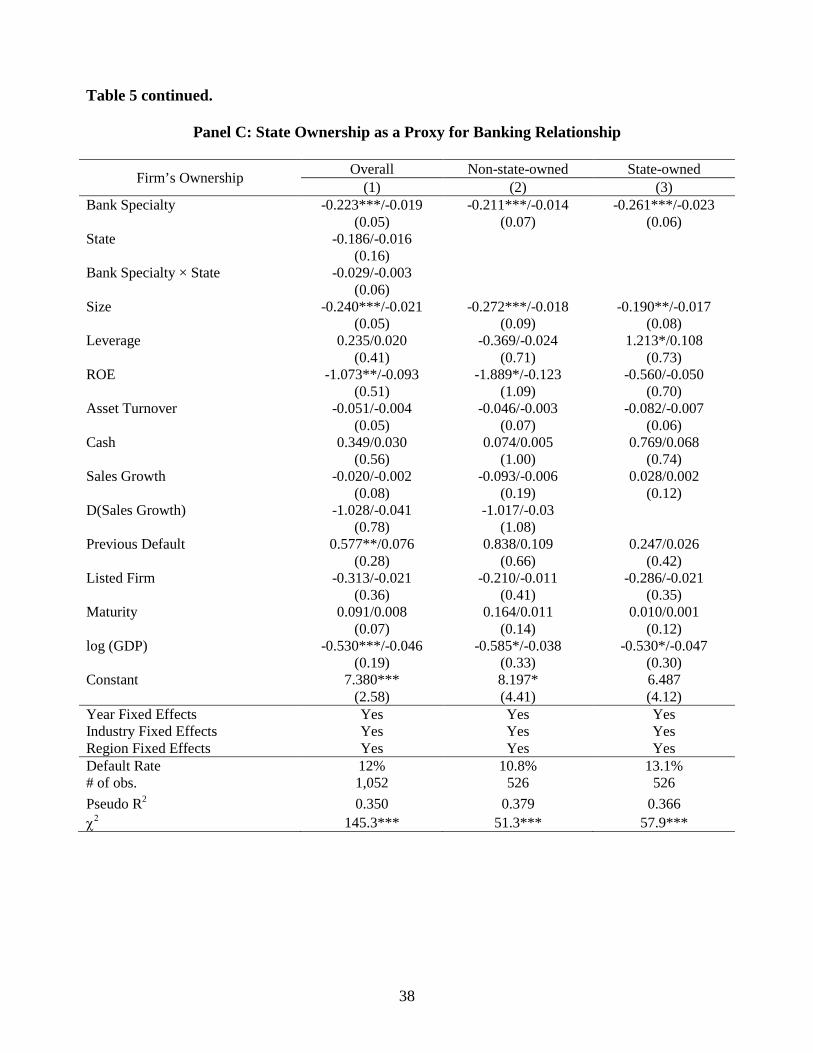
38
Table 5 continued.
Panel C: State Ownership as a Proxy for Banking Relationship
Firm’s Ownership Overall Non-state-owned State-owned (1) (2) (3)
Bank Specialty -0.223***/-0.019 -0.211***/-0.014 -0.261***/-0.023
(0.05) (0.07) (0.06)
State -0.186/-0.016
(0.16)
Bank Specialty × State -0.029/-0.003
(0.06)
Size -0.240***/-0.021 -0.272***/-0.018 -0.190**/-0.017
(0.05) (0.09) (0.08)
Leverage 0.235/0.020 -0.369/-0.024 1.213*/0.108
(0.41) (0.71) (0.73)
ROE -1.073**/-0.093 -1.889*/-0.123 -0.560/-0.050
(0.51) (1.09) (0.70)
Asset Turnover -0.051/-0.004 -0.046/-0.003 -0.082/-0.007
(0.05) (0.07) (0.06)
Cash 0.349/0.030 0.074/0.005 0.769/0.068
(0.56) (1.00) (0.74)
Sales Growth -0.020/-0.002 -0.093/-0.006 0.028/0.002
(0.08) (0.19) (0.12)
D(Sales Growth) -1.028/-0.041 -1.017/-0.03
(0.78) (1.08)
Previous Default 0.577**/0.076 0.838/0.109 0.247/0.026
(0.28) (0.66) (0.42)
Listed Firm -0.313/-0.021 -0.210/-0.011 -0.286/-0.021
(0.36) (0.41) (0.35)
Maturity 0.091/0.008 0.164/0.011 0.010/0.001
(0.07) (0.14) (0.12)
log (GDP) -0.530***/-0.046 -0.585*/-0.038 -0.530*/-0.047
(0.19) (0.33) (0.30)
Constant 7.380*** 8.197* 6.487
(2.58) (4.41) (4.12)
Year Fixed Effects Yes Yes Yes Industry Fixed Effects Yes Yes Yes Region Fixed Effects Yes Yes Yes Default Rate 12% 10.8% 13.1% # of obs. 1,052 526 526 Pseudo R2 0.350 0.379 0.366 χ2 145.3*** 51.3*** 57.9***
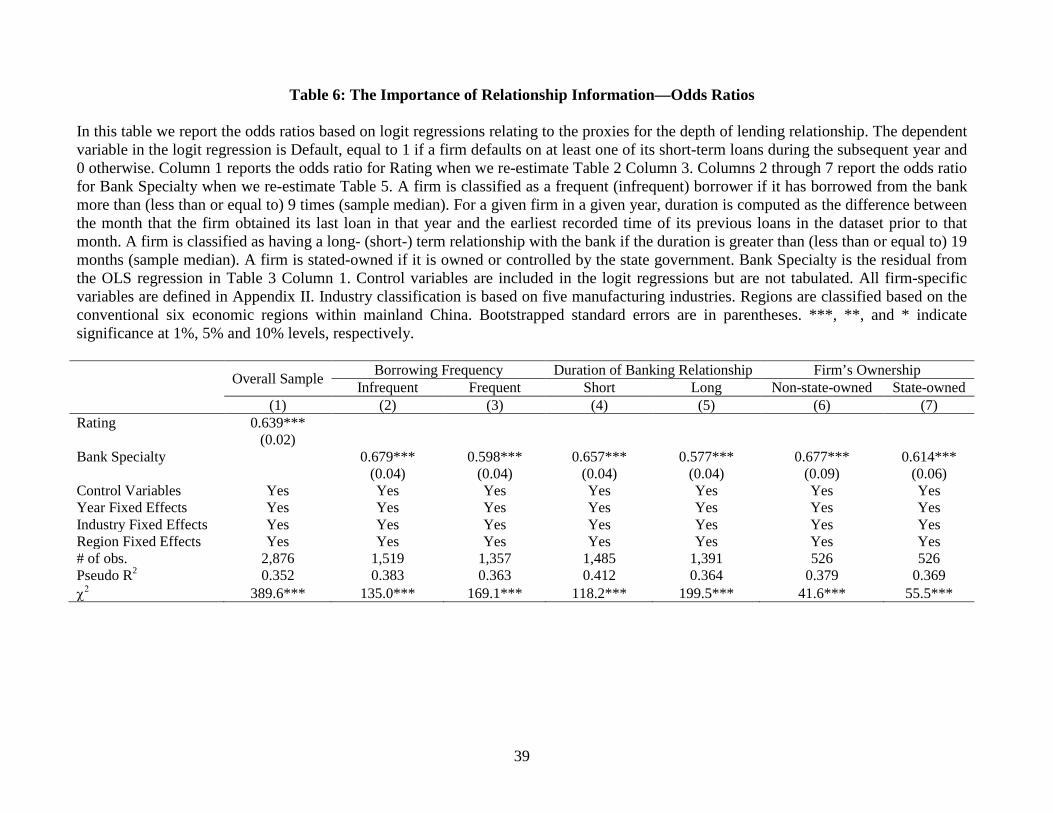
39
Table 6: The Importance of Relationship Information—Odds Ratios In this table we report the odds ratios based on logit regressions relating to the proxies for the depth of lending relationship. The dependent variable in the logit regression is Default, equal to 1 if a firm defaults on at least one of its short-term loans during the subsequent year and 0 otherwise. Column 1 reports the odds ratio for Rating when we re-estimate Table 2 Column 3. Columns 2 through 7 report the odds ratio for Bank Specialty when we re-estimate Table 5. A firm is classified as a frequent (infrequent) borrower if it has borrowed from the bank more than (less than or equal to) 9 times (sample median). For a given firm in a given year, duration is computed as the difference between the month that the firm obtained its last loan in that year and the earliest recorded time of its previous loans in the dataset prior to that month. A firm is classified as having a long- (short-) term relationship with the bank if the duration is greater than (less than or equal to) 19 months (sample median). A firm is stated-owned if it is owned or controlled by the state government. Bank Specialty is the residual from the OLS regression in Table 3 Column 1. Control variables are included in the logit regressions but are not tabulated. All firm-specific variables are defined in Appendix II. Industry classification is based on five manufacturing industries. Regions are classified based on the conventional six economic regions within mainland China. Bootstrapped standard errors are in parentheses. ***, **, and * indicate significance at 1%, 5% and 10% levels, respectively. Overall Sample Borrowing Frequency Duration of Banking Relationship Firm’s Ownership
Infrequent Frequent Short Long Non-state-owned State-owned (1) (2) (3) (4) (5) (6) (7)
Rating 0.639*** (0.02) Bank Specialty
0.679*** 0.598*** 0.657*** 0.577*** 0.677*** 0.614***
(0.04) (0.04) (0.04) (0.04) (0.09) (0.06)
Control Variables Yes Yes Yes Yes Yes Yes Yes Year Fixed Effects Yes Yes Yes Yes Yes Yes Yes Industry Fixed Effects Yes Yes Yes Yes Yes Yes Yes Region Fixed Effects Yes Yes Yes Yes Yes Yes Yes # of obs. 2,876 1,519 1,357 1,485 1,391 526 526 Pseudo R2 0.352 0.383 0.363 0.412 0.364 0.379 0.369 χ2 389.6*** 135.0*** 169.1*** 118.2*** 199.5*** 41.6*** 55.5***
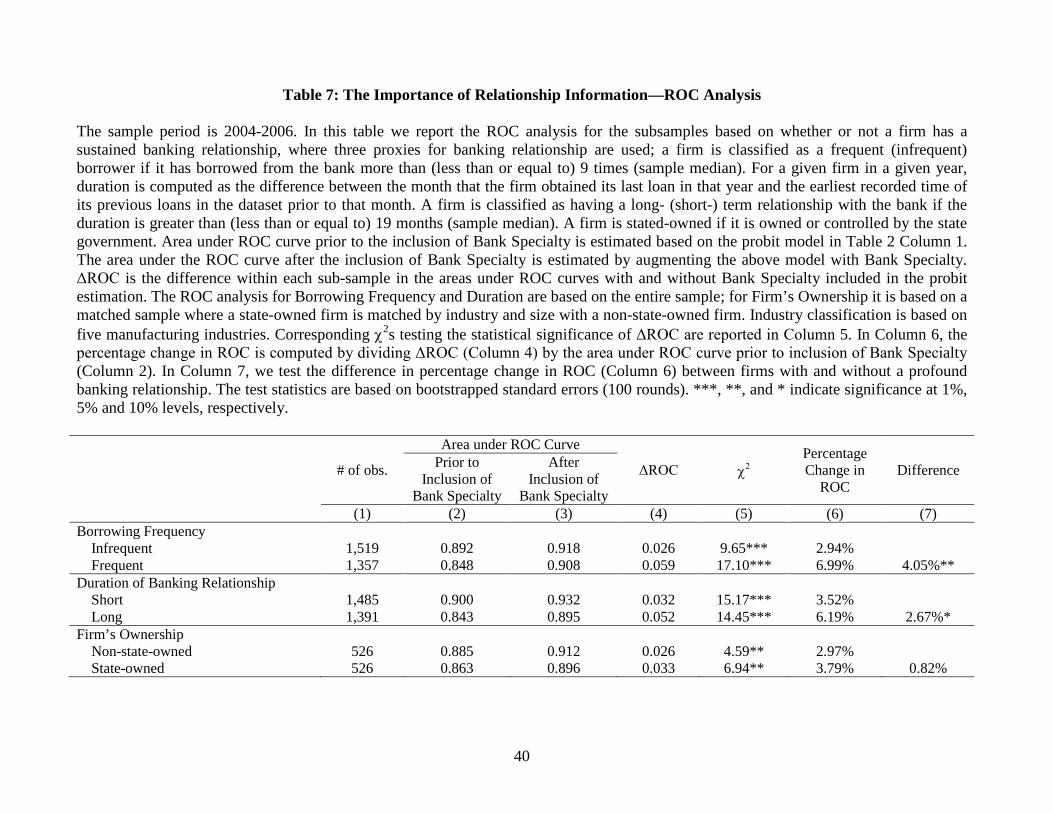
40
Table 7: The Importance of Relationship Information—ROC Analysis The sample period is 2004-2006. In this table we report the ROC analysis for the subsamples based on whether or not a firm has a sustained banking relationship, where three proxies for banking relationship are used; a firm is classified as a frequent (infrequent) borrower if it has borrowed from the bank more than (less than or equal to) 9 times (sample median). For a given firm in a given year, duration is computed as the difference between the month that the firm obtained its last loan in that year and the earliest recorded time of its previous loans in the dataset prior to that month. A firm is classified as having a long- (short-) term relationship with the bank if the duration is greater than (less than or equal to) 19 months (sample median). A firm is stated-owned if it is owned or controlled by the state government. Area under ROC curve prior to the inclusion of Bank Specialty is estimated based on the probit model in Table 2 Column 1. The area under the ROC curve after the inclusion of Bank Specialty is estimated by augmenting the above model with Bank Specialty. ΔROC is the difference within each sub-sample in the areas under ROC curves with and without Bank Specialty included in the probit estimation. The ROC analysis for Borrowing Frequency and Duration are based on the entire sample; for Firm’s Ownership it is based on a matched sample where a state-owned firm is matched by industry and size with a non-state-owned firm. Industry classification is based on five manufacturing industries. Corresponding χ2s testing the statistical significance of ΔROC are reported in Column 5. In Column 6, the percentage change in ROC is computed by dividing ΔROC (Column 4) by the area under ROC curve prior to inclusion of Bank Specialty (Column 2). In Column 7, we test the difference in percentage change in ROC (Column 6) between firms with and without a profound banking relationship. The test statistics are based on bootstrapped standard errors (100 rounds). ***, **, and * indicate significance at 1%, 5% and 10% levels, respectively.
# of obs.
Area under ROC Curve
ΔROC χ2 Percentage Change in
ROC Difference Prior to
Inclusion of Bank Specialty
After Inclusion of
Bank Specialty (1) (2) (3) (4) (5) (6) (7)
Borrowing Frequency Infrequent 1,519 0.892 0.918 0.026 9.65*** 2.94%
Frequent 1,357 0.848 0.908 0.059 17.10*** 6.99% 4.05%** Duration of Banking Relationship
Short 1,485 0.900 0.932 0.032 15.17*** 3.52% Long 1,391 0.843 0.895 0.052 14.45*** 6.19% 2.67%*
Firm’s Ownership Non-state-owned 526 0.885 0.912 0.026 4.59** 2.97%
State-owned 526 0.863 0.896 0.033 6.94** 3.79% 0.82%