
Competition and Relationship Lending: Friends or Foes? · Competition and Relationship Lending:...
41
Competition and Relationship Lending: Friends or Foes? Andrea F. Presbitero * Alberto Zazzaro February 23, 2010 Abstract Recent empirical findings by Elsas (2005) and Degryse and Ongena (2007) doc- ument a U-shaped effect of market concentration on relationship lending which cannot be easily accommodated by the investment and strategic theories of re- lationship lending. In this paper, we suggest that this non-monotonicity can be explained by looking at the organizational structure of local credit markets. We provide evidence that marginal increases in interbank competition are detrimen- tal to relationship lending in markets where large and out-of-market banks are predominant. On the contrary, where relational-based lending technologies are al- ready widely in use in the market by a large group of small mutual banks, an increase in competition may drive banks to further cultivate their extensive ties with customers. JEL Classification: G21, L11 Key words: interbank competition, market organizational structure, relationship lending. * Corresponding Author, Department of Economics – Universit` a Politecnica delle Marche (Italy), Money and Finance Research group (MoFiR) and Centre for Macroeconomic and Finance Research (Ce- MaFiR). E-mail: [email protected]; personal webpage: http://utenti.dea.univpm.it/presbitero/. Alberto Zazzaro is affiliated at the Department of Economics – Universit` a Politecnica delle Marche (Italy), Money and Finance Research group (MoFiR) and CFEPSR. E-mail: [email protected]; per- sonal webpage: http://utenti.dea.univpm.it/zazzaro/. We warmly thank Philip Strahan and two anony- mous referees for very constructive comments on a previous version of the paper. We also wish to thank Iftekar Hasan, Francesco Trivieri and participants at the “XVIII International Tor Vergata Conference on Banking and Finance” (Rome) for helpful suggestions. 1
Transcript of Competition and Relationship Lending: Friends or Foes? · Competition and Relationship Lending:...

Competition and Relationship Lending:Friends or Foes?
Andrea F. Presbitero∗ Alberto Zazzaro
February 23, 2010
Abstract
Recent empirical findings by Elsas (2005) and Degryse and Ongena (2007) doc-ument a U-shaped effect of market concentration on relationship lending whichcannot be easily accommodated by the investment and strategic theories of re-lationship lending. In this paper, we suggest that this non-monotonicity can beexplained by looking at the organizational structure of local credit markets. Weprovide evidence that marginal increases in interbank competition are detrimen-tal to relationship lending in markets where large and out-of-market banks arepredominant. On the contrary, where relational-based lending technologies are al-ready widely in use in the market by a large group of small mutual banks, anincrease in competition may drive banks to further cultivate their extensive tieswith customers.
JEL Classification: G21, L11
Key words: interbank competition, market organizational structure, relationshiplending.
∗Corresponding Author, Department of Economics – Universita Politecnica delle Marche (Italy),Money and Finance Research group (MoFiR) and Centre for Macroeconomic and Finance Research (Ce-MaFiR). E-mail: [email protected]; personal webpage: http://utenti.dea.univpm.it/presbitero/.Alberto Zazzaro is affiliated at the Department of Economics – Universita Politecnica delle Marche(Italy), Money and Finance Research group (MoFiR) and CFEPSR. E-mail: [email protected]; per-sonal webpage: http://utenti.dea.univpm.it/zazzaro/. We warmly thank Philip Strahan and two anony-mous referees for very constructive comments on a previous version of the paper. We also wish to thankIftekar Hasan, Francesco Trivieri and participants at the “XVIII International Tor Vergata Conferenceon Banking and Finance” (Rome) for helpful suggestions.
1

1 Introduction
Even if the banking industry is going global, relationship lending is still perceived as anessential feature of small business finance, not only in the European or Japanese bank-based system, but also in market-oriented systems, such as the US. The bulk of theliterature focuses on the effects of exclusive bank-firm ties on lending conditions, whilerelatively few contributions have investigated what influences relationship lending, andparticularly how credit market competition affects bank orientation (transactional versusrelational lending).
On the theoretical level, the effect of competition on bank orientation is ambiguous.For those who emphasize the investment nature of relationship lending it is natural toargue that competition and relational lending are die-hard foes. Market power is a neces-sary condition for banks to extract the informational rent generated by investing specificresources in the relationship with borrowers. Only when exit options for borrowers arelimited may banks have an incentive to acquire costly private information on their clients,since they could share surpluses intertemporally, subsidizing credit-constrained firms atthe beginning of the relationship and extracting the rent later (Sharpe, 1990; Rajan, 1992;Petersen and Rajan, 1995; von Thadden, 2004; Ogura, 2009). The empirical predictionsof the investment theory of relationship lending are that extensive bank-firm ties andrelational-based lending to small businesses are more commonly found when the localcredit market is more concentrated, regardless of the type of locally-operating banks.
By contrast, once one abandons the assumption of homogeneity of banks or lendingtechnologies and considers the strategic nature of relationship lending, competition andrelational lending may be proved to be friends. Fierce competition from out-of-marketbanks (or in the arm’s length market) may steer local banks to orientate their activi-ties towards small, proximate and informationally opaque borrowers, boosting relationallending. In this way they can create a competitive edge that helps insulate themselvesfrom pure price competition of outside banks (Boot and Thakor, 2000; Yafeh and Yosha,2001; Dell’Ariccia and Marquez, 2004; Hauswald and Marquez, 2006). The empiricalimplications of the strategic theory of relationship lending is that greater competition inlocal credit markets can strengthen the exclusive ties between banks and firms and drivebanks to increase loans to opaque borrowers, especially when competition is led by largebanks, headquartered at a distance from the market.
The applied literature on the effects of interbank competition on bank orientationis somewhat limited and inconclusive. Empirical support for the investment theory ofrelationship lending is provided, for example, by Petersen and Rajan (1995), Fischer(2000) and recently by Ogura (2007, 2009). The former, using data on the US smallfirms, found that young firms in concentrated markets receive more credit and pay lowerinterest rates than similar firms in competitive markets, with these differences vanishingas firms get older. In a similar vein, Ogura (2009) found that inside banks in the USA(banks holding the majority of a firm’s total checking account balances for more thanone year) are willing to charge lower interest rates to young firms only if they operate inconcentrated credit markets, thereby having the opportunity to establish an informationaladvantage over rivals. Such findings were broadly confirmed by Fischer (2000) for theGerman case, suggesting that competitive pressures in local credit markets discouragebanks from acquiring costly information on opaque borrowers. More direct evidence is
2

provided by Ogura (2007) who found that, in Japan, the number of competing banksand other measures of market competition are negatively correlated with the likelihoodof lending on a relational basis which in turn increases credit availability for new firms.
By contrast, Neuberger et al. (2008) found only a weak or insignificant correlationbetween market concentration and relationship lending for Swiss small firms, while, con-sistent with the strategic theory of relationship lending, Memmel et al. (2007) found that,in Germany, competition in local credit markets is positively associated with relationshiplending and that small banks are more likely to act as a relationship lender.
None of these studies, however, investigates the possibility that interbank competitionhas heterogeneous effects on relationship lending, depending on the structure of the localcredit market. Influential steps in this direction were recently made by Elsas (2005) andDegryse and Ongena (2007), who explicitly allow for non-monotonic effects of market con-centration on relationship lending. Elsas (2005) considers a sample of 122 large Germanfirms borrowing from five major German banks, and considers a bank-firm rapport beingrelational on the basis of the banks’ self-assessment of the Hausbank status. His findingsindicate the existence of a U-shaped relationship between the Herfindahl-Hirschman in-dex (HHI) of the local credit market at the registered head office of a firm (computedin terms of bank branches) and the likelihood of a relational bank-firm tie. Where theconcentration of the credit market is low, the probability of a bank assuming Hausbankstatus decreases with a marginal increase in concentration. By contrast, where marketsare very concentrated, a further increase in HHI raises the probability of a bank beingthe firm’s Hausbank.
Degryse and Ongena (2007) build on the Elsas study, but adopt more objective mea-sures of bank orientation, which reflect the duration and scope of the relationship, andrely on a much larger dataset of Belgian SMEs borrowing from a large national bank.Their findings confirm the U-shaped relationship between market concentration and thelikelihood of bank branches engaging in relationship lending, although the vast majorityof firms in their sample are located in postal zones where the correlation is negative.Moreover, the non-monotonic effect of market concentration is robust to control for thepresence in the local credit market of banks with multiple contacts across other locationsand for the distance of borrowers from both the lending branch and rival banks.
However, neither the investment nor the strategic theory of relationship lending pre-dicts a U-shaped effect of market concentration (or competition) on the relational orien-tation of banks1. Moreover, Elsas (2005) and Degryse and Ongena (2007) fail to devise acomplete explanation of why the strategic theory of relationship lending would hold forpoorly concentrated market while the investment theory would hold for highly concen-trated markets.
In this paper, we suggest that the non-monotonic effect of market concentration onrelationship lending is not due to the degree of concentration per se, but to the interplaybetween market concentration and the type of competitors operating in the local creditmarket. More precisely, our research hypothesis is that what prevails between the in-vestment and the strategic theories of relationship lending depends on the organizationalstructure of the local banking system. When the credit market is dominated by highly
1On the contrary, the models developed by Dinc (2000) and Yafeh and Yosha (2001) predict thatbanks’ investments in relationship lending reach their maximum with an intermediate number of banksand an intermediate level of competition.
3

hierarchical (large and functionally distant2) banks, market concentration favors closeand extensive bank-firm ties. On the contrary, when the majority of branches belong tosmall, non-hierarchical local banks, it is stronger interbank competition (i.e., lower mar-ket concentration) which promotes relationship lending. The intuition for this conjectureis simple and has to do with the comparative advantages hierarchical and non-hierarchicalbanks can exploit when competition is tough (Berger and Udell, 2006). The former type ofinstitution has a comparative advantage in transaction-oriented lending technologies, likefinancial statement lending, credit scoring or asset-based lending, due to scale economiesin collecting, processing and assessing hard information, while it is disadvantaged at re-lationship lending due to organizational diseconomies in dealing with soft information.For opposite reasons, small institutions with few layers of management are comparativelyadvantaged at using subjective and non-codified information and establishing close lend-ing relationships with information-intensive borrowers. In this view, greater interbankcompetition should encourage or discourage the use of relational-oriented technologiesdepending on the type of lending institution which predominates in the local market.
In what follows, we provide evidence for a large sample of small and medium sizedItalian manufacturing firms, consistent with our hypothesis reconciling the investmentand the strategic theories of relationship lending. Once we introduce in a regressionmodel of relationship lending the interaction terms between market concentration anddifferent measures of size, localism and distance of locally-operating bank branches, theU-shaped effect of HHI vanishes, while the non-linear effect of competition is driven bythe organizational structure of the local banking system: competition and relationshiplending are friends or foes according to who are the major competitors, small cooperativebanks or large and distant banks.
The rest of the paper is organized as follows. In the next section, we discuss thetheory laying behind the interplay of competition and organizational structure of bankingsystems in shaping bank-firm relationships. In Section 3, we describe our dataset, theestimation methodology and the variables. In Sections 4 and 5, we discuss the econometricresults for the basic model and various robustness exercises. Finally, in Section 6 we drawsome concluding remarks.
2 Bank organization, competition and orientation:
background theory and evidence
Well received theoretical arguments indicate that bank size and organizational designinfluence its lending orientation and asset allocation (soft-information-based versus hard-information-based activities). The idea is that large and geographically dispersed banksare highly hierachized institutions, and that hierarchiness is associated with organiza-tional diseconomies which place these banks at a disadvantage with respect to small,local banks in lending to information-intensive borrowers on a relational basis (Bergeret al., 1999; Berger and Udell, 2002; Stein, 2002). To the extent that relationship lendingrelies heavily on non-codified information, only available to opportunistic loan officersat the local level, the use of this lending technology entails serious communication and
2By functional distance, we mean the distance between local branches (or subsidiaries) and the deci-sional centre (typically the headquarter) of their parent bank (Alessandrini et al., 2005).
4
agency problems across the bank organizational layers which may advise large and dis-tant banks against it (Aghion and Tirole, 1997; Garicano, 2000; Scharfstein and Stein,2000). On the one hand, a career-conscious loan officer anticipates that bank managersat the parent bank are unable to properly appreciate soft information he/she may gainduring the relationship with borrowers and reduces his/her effort in producing it, whileoverinvesting in hard and verifiable information (Milbourn et al., 2001). On the otherhand, in order to avoid the formation of information rent and mitigate agency problems,loan officers are frequently asked to rotate within large banks and are discouraged frombasing lending decisions on soft information (Hertzberg et al., 2009).
Empirical evidence is broadly consistent with such theoretical predictions. A greatnumber of studies, concerning different countries, document that big banks devote tosmall business lending a lower share of their resources (Berger and Udell, 1996; Sapienza,2002; Degryse et al., 2009b) and that, in turn, small firms are more likely to borrowfrom small banks (Berger et al., 2005; Uchida et al., 2008). Other studies show thatfunctionally distant banks tend to pick up informationally transparent firms and are lessprone to assist firms facing financial distress (Carter and McNulty, 2005; Mian, 2006;Alessandrini et al., 2008; Canales and Nanda, 2008; Benvenuti et al., 2009; Micucci andRossi, 2009). Moreover, small firms located in markets with predominantly functionallydistant banks are more likely to be credit-rationed and less inclined to introduce newtechnologies and products (Alessandrini et al., 2009a,b).
A relatively small number of studies focus on the effect of bank size, distance andownership structure on the lending technology. Cole et al. (2004) and Scott (2004) foundthat large banks in the USA rely heavily on hard information about firm financial state-ments in deciding on loan approvals, while small banks base their decisions also on softinformation informally gathered through repeated face-to-face contacts with borrowers.In this vein, Frame et al. (2001) and Akhavein et al. (2005) reported that large, central-ized banking organizations are more likely to use automated credit scoring technologiesin small business lending, while Berger et al. (2005) found that small banks are betterat using soft information as they lend at a lower distance and are more likely to employpersonal modes of communication with their borrowers. The role of hierachical distancein influencing the importance of soft information in lending approval decisions is docu-mented by Liberti and Mian (2009). In particular, focusing on the case-study of a largemultinational bank operating in Argentina, they found that the soft-information sensi-tivity of credit facility is significantly lower when the credit line is approved at higherhierarchical levels, geographically distant from the office that collected information on theborrower. Finally, Angelini et al. (1998) and Delgado et al. (2007) showed that the banklending orientation is influenced by its ownership structure, as savings and cooperativebanks tend to specialize in small borrowers.
Looking directly at relationship lending, Berger et al. (2005) documented that creditrelationships are longer-lasting and more exclusive when the lending bank is small-sized.Uchida et al. (2008) validated these results in the Japanese context, by showing thatsmall banks tend to have closer ties and repeated contacts with their borrowers and lendat a shorter distance than large banks. Lastly, Angelini et al. (1998), Uzzi (1999) andNeuberger et al. (2008) found that localism and cooperative ownership is also positivelyassociated with the relational orientation of banks due to the deepply embedded ties withthe local economy, and the peer nexus between lenders and borrowers.
5
If it is true that hierarchical and non-hierarchical banks have a comparative advantagein transactional and relational lending, respectively, then it is conceivable to expect thatthey will react to stronger competition by concentrating efforts and resources on theirfavorite lending technology. Therefore, if the local credit market is predominantly pop-ulated by hierarchical (large and distant) banks, interbank competition and relationshiplending should be observed to be negatively associated. On the contrary, if the organi-zational structure of the local credit market is made up by non-hierarchical (small, localand cooperative banks), relationship lending should increase with competition. However,as far as we know, empirical evidence on the effects of the interplay of bank organiza-tional structure and interbank competition in determining lending orientation is virtuallylacking. Partial exceptions are Brevoort and Hannan (2004), Canales and Nanda (2008),Carbo-Valverde et al. (2009) and Degryse et al. (2009a) who provide some useful indica-tions consistent with the strategic use of bank orientation.
Brevoort and Hannan (2004) documented that the importance of physical proximitybetween banks and borrowers located in the US metropolitan areas has increased over theyears 1997 to 2001, immediately after the Interstate Banking and Branching EfficiencyAct was passed to remove interstate branching restrictions to banks and bank holdingsand increase interbank competition (Rice and Strahan, 2009). If physical proximityentails informational proximity, Brevoort and Hannan (2004, p. 25) note, this finding is“consistent with the notion that as competition increases from lenders located outside themarket, local lenders reallocate resources toward loans in which they enjoy a locationaladvantage”.
In a similar vein, Degryse et al. (2009a) showed that the more rival banks are hier-archically organized and the more competitors’ branches have real authority, the loweris the geographical reach of the lending branches and the greater is their orientation tophysically proximate borrowers.
Finally, more in line with our empirical approach, Canales and Nanda (2008) inves-tigate how centralized and decentralized (in terms of branch managers autonomy) banksin Mexico respond to interbank competition in local credit markets. The results theyreport indicate that where competition is harsher, decentralized banks tend to reallocateresources in favor of small and micro enterprises by reducing interest rates and increasingloans to this category of borrower. Similarly, Carbo-Valverde et al. (2009) found thatwhen local credit markets are more contestable (i.e. the entrance of new competitorsis greater) the negative impact of competition on credit availability to small businessesdecreases.
3 Empirical setup
3.1 Data
The analysis is carried out on the eighth and ninth waves of the Survey on Manufactur-ing Firms (“Indagine sulle Imprese Manifatturiere”) published by the Unicredit Group(formerly Capitalia). The Unicredit surveys collect a large set of information on a rep-resentative sample (stratified by firm size, industry sector and firm location) of ItalianSMEs with 11–500 employees and the universe of firms with more than 500 employeesover the period 1998-2003. From the original sample of 8,969 firms we exclude a number
6

of observations for which there are missing values for relevant variables, such as location,industry and number of employees. We also control for consistency in some answers, es-pecially concerning the number of banking relationships and the share of banking creditsupplied by the main bank. Finally, we focus on SMEs, so that we drop from the samplevery large firms with more than 500 employees. Thus, we end up with 4,121 observations.
Firm-level data are merged with indicators of credit market structure at the provinciallevel measured in the first year of the survey and calculated using Bank of Italy data onthe number and geographical diffusion of bank branches3. Taking the province as theappropriate size of local credit markets is consistent with recent literature on the Italianbanking system (Herrera and Minetti, 2007; Benfratello et al., 2008; Alessandrini et al.,2009b), given that, according to the Bank of Italy data, more than 90 percent of creditgranted involves banks and firms located in the same province.
Finally, information on the asset size of banks was taken from Bilbank, a data setproduced by the Italian Association of Bankers (ABI) collecting the balance sheets ofItalian banks, while data on provincial value added and population are drawn from theNational Institute of Statistics (ISTAT) database.
3.2 Empirical models and methodology
Relationship lending is a complex phenomenon, difficult to measure. In the empiricalliterature it has been proxied by different aspects, such as the firms’ number of banks,the length and scope of the relationship, the share of loans supplied by the main bankand the lender’s status of Hausbank.
Unlike Elsas (2005) and Degryse and Ongena (2007), our dataset is at the firm leveland therefore we cannot use the Hausbank status as a measure of relationship lending.However, referring to the German case, Elsas (2005) showed that the bank’s share offirm’s total debt is significantly associated with the bank being a relationship lender,that is, with the self-assessment of the bank being a Hausbank, with good access toexclusive information about the firm and a good capacity to influence its management.By contrast, the duration of the bank-firm relationship is not related to the Hausbankstatus, while the number of banks seems to negatively affect the availability of informationabout the firm.
Following this indication, in this paper we measure relationship lending by the shareof banking credit supplied to the firm by its main bank (FINSHARE)4. Moreover, as ro-bustness, we also build a yes-or-no indicator of banks’ relational orientation, RELBANK,that assumes the value of one if the firm obtains at least one fifth of bank credit fromits main bank and has credit lines with no more than five banks, and the value of zerootherwise (see section 5.2)5.
3Italy is currently divided into 107 provinces, which are grouped into 20 administrative regions.However, since some provinces were recently constituted, we use the old classification of 95 provinces.
4As a referee has noticed, not only banks decide on their orientation towards relationship lending, butfirms do so as well. In this vein, FINSHARE might capture the firm rather than the bank orientation.While this ambigiguity poses interpretation problems, broadly shared across the literaure on relationshiplending, in our model the problem of endogeneity is mitigated by the fact that the key dependent variablesare at the market level.
5The exact questions posed to firms in the Unicredit Survey re: (i) ”‘Considering the bank debtequal to 100 at the end of (the last year of the survey), what was the share held by the main bank?”’;
7

The impact of competition on the intensity of bank-firm ties is expressed as a func-tion of firm-specific characteristics, the degree of concentration and the organizationalstructure of local credit markets, and some features of local economies. We model thenon-monotonic effects of market concentration on relationship lending, augmenting themodel with the squared term of market concentration and with the interaction termsbetween market concentration and other indicators of credit market organizational struc-ture:
FINSHAREij = f(HHIj, HHI2j , ORGMKTSTRCj,
HHI ×ORGMKTSTRCj, F IRMi, PROVj) (1)
where subscripts i and j indicate respectively the firm and the province where it is offi-cially headquartered; HHI is the Herfindahl-Hirschman index; ORGMKTSTRC are themarket organizational structure variables; FIRM and PROV are firm- and provincial-level control variables.
We estimate equation (1) by using the fractional logit estimator. Indeed, since theshare of debt borrowed from the main bank is bounded between zero and one, the OLSlinear regression is unsuitable for the FINSHARE model because it cannot guaranteethat the predicted values lie in the unit interval, like for binary data models. The standardsolution of applying a logistic transformation to the dependent variable presents twomain drawbacks. First, a linear model on the log-odds ratio could be estimated onlywhen the dependent variables is strictly between zero and one6. Second, once the logistictransformation is applied, intensive computation is required to calculate E(y|x). Analternative solution we follow in this paper, which does not require data adjustmentsand allows for direct estimation of the conditional expectation, is the fractional logitmodel proposed by Papke and Wooldridge (1996). The fractional logit model consists inmodeling the expected values of the share of the firm’s debt held by the main bank asfollows:
E(FINSHAREi|Xi) =exp(Xiβ)
[1 + exp(Xiβ)]
where Xi is the vector of explanatory variables, including firm-specific characteristicsand banking market indicators. The parameters are estimated maximizing the Bernoullilog-likelihood function in order to get the consistent Bernoulli quasi-maximum likelihoodestimator β7.
Despite the limitations stated above, for robustness we estimate equation (1) alsowith the simpler linear model, which has the advantage of allowing for the interpretationof estimated coefficients as marginal effects.
Since our dependent variable is at the firm level, while key explanatory variables (i.e.,interbank competition and organizational structure of banking systems) are at the market
(ii) ”‘State the number of banks with which the firm had a credit relationship in (the last year of thesurvey)”’ (Capitalia, 2005).
6If y = 1 or y = 0, log[y/(1− y)] does not exist, and any procedure to adjust for the extreme valuespresents serious problems of approximation.
7For applications of the fractional logit model to firm-level data see, amongst others, Hausman andLeonard (1997) and Wagner (2001).
8

level, the assumption of independently distributed disturbances is not appropriate. Inparticular, under the more realistic assumption that the relationship lending indicator andthe residual are independent across firms but are correlated across observations in thesame province, the OLS standard errors can be proved to be biased downwards (Moulton,1990; Petersen, 2009). Hence, we correct the variance-covariance matrix by clustering thestandard errors at the provincial level 8.
3.3 Variables
3.3.1 Market concentration and organisational structure variables
We use four different measures of the structure of local credit markets at the provin-cial level. The degree of concentration of provincial credit markets is measured by thestandard Herfindhal-Hirschman index (HHI) calculated as the sum of the squared shareof bank branches owned by each bank operating in the province9. Although the HHIindex is not the only possible measure of market concentration, it remains the one mostcommonly used by both economists and antitrust regulators all around the world (Ce-torelli, 1999; Cetorelli and Strahan, 2006), and its adoption allows us to directly compareour findings with the existing literature on competition and relationship banking (Elsas,2005; Degryse and Ongena, 2007). However, the new empirical industrial organizationliterature has cast doubts on structural market concentration indexes as a measure of in-terfirm competition and suggests the use of model-based indicators, like the Lerner indexor the Panzar-Rosse H statistic (Panzar and Rosse, 1987; Bresnahan, 1989), which takeinto account the observed firms’ behavior. Therefore, for robustness we also reproduceour results using the H -statistic built at the provincial level (see Section 5.4).
The size and organizational structure of credit markets is measured by three differentindicators which should capture the propensity of locally-operating banks to engage inrelationship lending:
1. the functional distance of the local banking system from the local borrowers, com-puted as the number of branches in province weighted by the logarithm of 1plus the kilometric distance between the province of the branch and the provincewhere the parent bank is headquartered, over the total of branches in province(F −DISTANCE)10;
2. the size structure of the local banking system, computed as the ratio of branchesowned by large banks to the total, non-weighted number of branches operating in
8For robustness, we replicated all regressions with robust standard errors for heteroskedasticity ex-cluding correction for cluster correlation and we found virtually identical results (they are available uponrequest).
9The index is standardized between 0 and 10 in order to have more readable coefficients.10More precisely, the functional distance of the banking system from province j is reckoned as:
F −DISTANCEj =
∑Bj
b=1[Branchesj,b × ln(1 + KMj,zb)]∑Bj
b=1 Branchesj,b
where Bj is the number of banks operating in province j, Branchesj,b is the number of branches belongingto bank b in province j, and zb is the province where the headquarter of bank b is located (Alessandriniet al., 2009b).
9

each province (LARGE BANKS), where a bank is classified as large if its totalassets are more than 26 billion euros at 2003 prices11;
3. the share of branches held by mutual banks in each province, which is a measureof the degree of localism and social embeddedness of provincial credit markets(MUTUAL BANKS).
We build banking system variables using information on the geographical distributionof branches of all the Italian banks. To partially take into consideration possible issues ofreverse causality, they are calculated in the first year of each survey12. In 1998, there were926 banks operating in Italy with a network of 26,301 branches; in 2001 these numberswere 834 and 29,300, respectively. Of these branches, in 1998 (2001), 11,528 (11,951)belonged to out-of-province banks, 9,295 (11,128) to large banks and 2,800 (3,083) tomutual banks.
At the aggregate level, we expect the coefficients on the interaction terms HHI ×F − DISTANCE and HHI×LARGE BANKS to be positive. Following the invest-ment theory of relationship lending, the intuition is that a low interbank competitionis a necessary condition to orientate large and functionally distant banks to lend on arelational basis. These types of banks have a competitive advantage in offering transac-tional products with respect to small, local banks, while they are at a disadvantage inrelationship lending (Berger and Udell, 2002). Therefore they find it rewarding to engagein relationship lending only if market power allows them to extract additional future rentsfrom investing resources in building extensive ties with borrowers.
However, by increasing the incidence of small mutual banks with a local vocation andcomparative advantages in using soft information, it is more likely that, at the aggregatelevel, competition goes hand-in-hand with more relationship lending (i.e., the coefficientson the interaction terms between HHI and MUTUAL BANKS are expected to benegative), consistently with the strategic theory of relationship lending (Dell’Ariccia andMarquez, 2004; Hauswald and Marquez, 2006).
3.3.2 Control variables
In model (1) we include a set of standard firm-specific characteristics and indicators ofprovincial economic development. In particular, we control for: (i) firm’s age and agesquared, measured by (one plus) the logarithm of the years from its inception (AGE); (ii)the number of workers employed in the firm, divided into four categories (SIZE); (iii) theriskiness of the firm, measured by the one-year probability of default as computed by theRiskCalcTM Italy model developed by Moody’s KMV (RISK)13; (iv) the efficiency of itsproduction process, proxied by a dichotomous variable equal to one for firms which have
11This is the official definition of large banks adopted by the Bank of Italy. According to the Italiancentral banks, major banks have assets of over 60 billion euros, while medium banks have assets ofbetween 9 and 26 billion euros. For robustness, we construct alternative measures of LARGE BANKSincluding also medium banks or limiting the definition to the major banks. See Section 5.3
12We check the robustness of our findings taking the credit market variables in the year before thethree-year period covered by each survey (results available upon request).
13The RiskCalcTM model for one-year risk of default combines firm’s financial statement ratios con-cerning profitability, leverage, debt coverage, growth, liquidity, activity ratios, size (Dwyer et al., 2004).We thank Toni Riti of Unicredit for kindly providing us with the RISK rating variable.
10
received the international standard ISO 9000 for quality management systems (ISO9000);(v) the firm’s degree of innovativeness, measured by a dummy variable which is equalto one for firms that made expenditures on R&D in the three-year period covered byeach survey and zero otherwise (R&D); (vi) the firm’s degree of internationalization,measured by two dummy variables: EXPORT , equal to one when the firm sells part ofits production abroad, and OFFSHORE, equal to one for firms realizing part of theirproduction abroad.
Then we add the logarithm of the provincial real per capita value added in the firstyear of the survey (V ALUE ADDED) as a control variable at the provincial level.Since economic and local financial development has proved to be highly correlated inItaly (Lucchetti et al., 2001; Guiso et al., 2004a), the introduction of V ALUE ADDEDallows us to identify the true effect of the credit market structure on relationship lending.Finally, in all regressions we include wave and industry dummies to control for possibletime and industry-specific effects on relationship lending.
4 Results
4.1 Descriptive analysis
In Table 1 we report the definition and the sample statistics of the variables used in theregression analysis, while in Figure 1 we plot the kernel density of FINSHARE andthe sample distribution of the number of firms’ banking relationships, on the basis ofwhich we build the other dependent variable, RELBANK. Both the distributions arepositively skewed. FINSHARE (Panel (a)) has its mode in correspondence of firmscollecting around one third of their total bank debt from the main bank. Only 114 firms(1.6 percent of the sample) borrow at least 90 percent of credit from the main bank,while the average (median) share of total debt funded by the main bank is 0.41 (0.35).Consistently, and in line with the standard evidence on Italy (Ongena and Smith, 2000),Panel (b) shows that multiple lending is a very frequent phenomenon in our sample, whilesingle-bank relationships are very uncommon. Less than one percent of surveyed firmsmaintain an exclusive relation with a bank, eight percent of firms have credit relationshipswith two banks, 40 percent with no more than four banks and 42 percent with more thanfive banks. Finally, the dummy variable RELBANK assumes the value of 1 for 57.2percent of firms in our sample which, at the same time, collect no less than 20 percent ofcredit from the main bank and have contacts with no more than 5 banks.
The univariate relationship between market concentration and the two alternativemeasures of relationship lending is clearly non-monotonic. The share of credit suppliedto the firm by its main bank and the likelihood of relationship lending (RELBANK = 1)is greater for companies headquartered in provinces where local credit markets exhibit alow or high degree of concentration (Table 2), although the average shares of debt withthe main bank across the HHI distribution are not very dissimilar in magnitude.
Finally, in Table 3 we report correlations between the provincial values of HHI andof the organizational structure of the local banking system. As expected, the level ofcredit market concentration is positively correlated with the presence of out-of-marketbanks in the market and negatively correlated with the presence of small, mutual banksheadquartered in the same province. By contrast, local market concentration is not
11

significantly correlated with the share of large banks in the province. Although somewhatsurprising, this result is driven by provinces in a single region (Sardinia) where a singlelocal bank (Banco di Sardegna), not included in the group of large banks, opened andacquired a large number of branches during the sample period, thereby increasing HHIand decreasing LARGE BANKS.
4.2 The basic model
In Table 4 we report regression results for our preferred models. Both the fractionallogit (columns 1 to 5) and linear (columns 6 to 10) estimates provide qualitatively andquantitatively similar results. The coefficient of the former can be directly interpreted asmarginal effects. In the following we will discuss separately the effects of control variablesand, in greater depth, of the key banking variables.
4.2.1 Control variables
In all specifications, regardless of the econometric methodology we use, coefficients oncontrol variables are fairly robust in sign, value and statistical significance and hence wecan comment on them once and for all.
As we expected, the exclusivity of ties with the main bank significantly decreases withthe size of the firm as well as with the efficiency of the production process (ISO9000),which could be both considered as proxy of the firm informational transparency. Accord-ing to the estimates reported in column 1, for very small enterprises (employing between11 and 20 workers) almost half (45%) of their banking credit is granted by their mainbank, while this share shrinks to about 33% for medium firms employing between 260and 500 workers. Firms whose production process is ISO 9000 certified have, all elseequal, a value of FINSHARE one percentage point smaller than non-certified firms. Bycontrast, AGE and AGE2 are not statistically associated with the share of firm debt heldby the main bank.
Consistent with the descriptive analysis of our sample, companies which invest inR&D receive a 1.4 percent smaller share of their credit from the main bank14. In thesame way, firms that operate abroad producing (OFFSHORE) or selling (EXPORT )part of their output raise a lower share of their total debt from their main bank. Theeffect is somewhat larger for offshoring firms, for which the decrease in FINSHARE isequal to 2.5 percentage points, than for exporting firms. A similar negative impact onthe exclusiveness of the bank relationship is produced also by firm’s riskiness, even if theeconomic effect is quite small: FINSHARE for a risky firm (at the third quartile of thesample distribution of RISK) is 0.4% smaller than for a safe firm (at the third quartileof the sample distribution of RISK). These results are partially at odds with predictionsof the literature on relatioship lending. Theoretically, more risky, innovative and abroad-oriented companies should benefit most from close bank ties and intertemporal loancontract design. Moreover, there is evidence showing that relationship lending fostersfims’ innovation adoption (Herrera and Minetti, 2007) and internazionalization (De Boniset al., 2008). However, our findings are consistent with the idea that firms that either
14Firms investing (not investing) in R&D have a value of FINSHARE equal to 38 (42) percent, andthe difference is statistically significant at the 1 percent level of confidence.
12

engage in R&D or are active in international markets consist predominantly of solid andtransparent firms who are less interested in maintaining exclusive relationships with asingle bank (Bond et al., 2003; Alessandrini et al., 2009a), and with the evidence thatriskier firms are more likely to mantain long-lasting and wide-ranging relationship withtheir bank (Degryse and Ongena, 2007) and tend to borrow from a greater number ofbanks (Cosci and Meliciani, 2002; Guiso and Minetti, 2004).
Finally, as expected, transactional lending is more frequent in richer provinces, wherethe soundness of the economic and socio-economic structure increases firms’ transparency(Ferri and Messori, 2000).
4.2.2 Market concentration and organizational structure variables
As regards the variables of interest, in the first and sixth columns we estimate a simplemodel in which, as in Elsas (2005), the only credit market indicator is the Herfindahl-Hirschman index of local credit market concentration, added both linearly and squaredto allow for possible non-monotonicity. In fact, even after controlling for provincial realvalue added, we are able to replicate the results found by Elsas (2005) and Degryseand Ongena (2007). The coefficients on HHI and HHI2 are jointly significant and, asFigure 2 displays, the relationship between market concentration and FINSHARE isU-shaped, obtaining a minimum at an HHI of 1.37 and 1.38 in the case of, respectively,fractional logit and linear estimations, between the sixth and the seventh decile of itsdistribution and well below the threshold of 1.8 typically used by the antitrust authoritiesto identify concentrated markets (Cetorelli, 1999). However, this relationship tends tolose significance once we include other organizational market structure variables (columns2 and 7). When jointly considered, the linear and quadratic terms are significant, butthe U-curve has a minimum at HHI = 0.38 (0.40 in the case of the linear model),a value below the fifth percentile of the provincial distribution of HHI and well belowthe threshold of 1 identifying competitive markets. This implies that the relationshipbetween HHI and FINSHARE can be considered as almost strictly positive, supportingthe investment theory of relationship lending. The coefficients on F − DISTANCEand MUTUAL BANK have the expected negative and positive signs but they are notsignificant, probably because of multicollinearity. Finally, LARGE BANK has a positiveand significant coefficient. Although somewhat surprising, these findings confirm the ideathat size per se is not sufficient to explain the banks’ preference for lending technologiesand that the profitability of lending to small, opaque borrowers on a relational base isstrongly affected by the competitive, institutional and social environments in which largeor small banks operate (Berger and Udell, 2006; Berger et al., 2007).
The sensitivity of the effects of market concentration on relationship lending to orga-nizational structure variables clearly indicates that the non-monotonicity of HHI mighthide a different sort of heterogeneity due to the type of banks operating locally. Hence,in columns 3-5 and 8-10 we add the interaction terms between HHI and, alternatively,the three indicators of market organizational structure. On the whole, our results sug-gest that a marginal increase in credit market concentration can positively affect therelational orientation of banks only when the local market is populated by a sufficientlylarge number of branches owned by large and functionally distant banks, which are at adisadvantage in relationship lending. By contrast, the strong presence of mutual banks,
13

which largely adopt relationship-based lending technologies, makes further concentrationinimical to relationship lending. These findings reconcile the investment and strategictheory of relationship lending or, rather, they indicate that extensive bank-firm ties tendto develop either where transaction lenders gain enough market power to informationallycapture their customers or where relational-based loans can be used as a competitive edgein markets patrolled by local banks.
Going into details, when we interact HHI with F − DISTANCE, the coefficienton the squared term of market concentration loses statistical significance in favor of theinteraction term while the coefficient on F−DISTANCE assumes statistical significance(columns 3 and 8). In provinces where the value of F −DISTANCE is above (below)2.8, a value close to the fourth decile of its provincial distribution, the effect of marketconcentration on FINSHARE is positive (negative). On the contrary, after interactingHHI with MUTUAL BANKS (column 5), the marginal impact of concentration onFINSHARE appears to be positive only in provinces where the market share of mutualbanks is less than 7 percent, which is true in 41 out of 95 provinces over the sample period(it is worth noting that more than half of the firms in the sample are headquartered inthose provinces), while it proves negative as long as the degree of localism increases.
Unlike the previous results, the inclusion of the interaction between HHI and theshare of large banks (columns 4 and 9) does not wipe out the statistical significance of thequadratic term of market concentration, even if the point estimates provide evidence fora differentiated impact of competition on relationship lending according to the presenceof large banks. In fact, in markets where the share of branches owned by large bank isaround 15 per cent (the first quartile of the provincial distribution of LARGE BANKS)the convex curve has a minimum in correspondence of a very high value of HHI (2.16,above the 90◦ percentile), such that the basic relation can be considered negative. On thecontrary, for firms located in provinces with a great presence of large banks (29 percent,which corresponds to the third quartile of the distribution of LARGE BANKS) therelation between HHI and FINSHARE is still U-shaped, since the minimum of theU-curve is for a value of HHI (1.33) which is very close to its median. A similar resultholds also when LARGE BANKS assumes its average value 24%. However, when weconsider provinces where the market share of large banks is sufficiently high – greaterthan 46 percent, as in Turin or Rome (it is worth noting that in our sample one fourth offirms operate in such a market) – the relationship between concentration and relationshiplending is strictly positive, since the minimum of the curve occurs for a value of HHIlower than the minimum of its sample distribution.
The results of specifications (3)-(5) are represented in Figure 3. In left-hand diagramswe plot the relation between HHI and FINSHARE when the organizational structurevariables are taken at the first quartile of their provincial distribution, while the right-hand diagrams are plotted by fixing the value of the organizational structure variablesat the third quartile of their distribution. As we stated, once we take into account thetype of locally-operating banks, the U-shaped relation between HHI and FINSHAREfound by Elsas (2005) and Degryse and Ongena (2007) tends to vanish. Only in panel(d), when we consider the share of large banks’ branches in the province and where thisis great, does the effect of a marginal decrease in market concentration depend on theinitial level of concentration in the province. However, as we have already underlined,this relationship becomes monotone and positive where LARGE BANKS is sufficiently
14
high, and this happens for a significant number of firms.To gain some additional insights on the economic significance of the interplay between
market concentration and the organizational structure of the local banking system, con-sider the effect of a shift from competition to concentration in local credit markets on theintensity of relationship lending. In provinces where the banking system is functionallyclose (F −DISTANCE equal to the first quartile of its provincial distribution), a theo-retical shift from the average competitive market (HHI < 1) to the average concentratedone (HHI > 1.8) lowers the share of credit supplied by the main bank from 40.8 to 39.2percent15. By contrast, the same variation of HHI in provinces whose credit markets aredominated by functionally distant banks (F −DISTANCE equal to the third quartileof its provincial distribution) increases the likelihood of strong bank-firm ties from 39.8%to 43.2%. A similar, but somewhat lower, effect happens when considering bank size.Moving from a competitive to a concentrated credit market reduces the FINSHAREfrom 40.4 to 39.1 percent in markets with a limited presence of large banks. On the con-trary, when large banks predominate (LARGE BANKS equal to the third quartile of itsprovincial distribution), a shift from competition to concentration would be associatedto an increase in the measure of relationship lending from 40.5 to 42 percent. Finally, inlocal markets where MUTUAL BANKS is equal to 4% (15%) a shift from competitiveto concentrated markets increases (reduces) FINSHARE from 40.5 (40.7) to 41.9 (39.6)percent.
5 Robustness
We control the validity of our main findings undertaking a number of robustness checks.First, results do not change significantly across different samples and on changing theset of firm-specific control variables. Namely, we limited our analysis to SMEs with lessthan 250 employees and we controlled for the firms’ return on assets, volume of sales,alternative measures of propensity to innovate, juridical status and affiliation to interfirmgroups and consortia. On the top of that, we addressed more specific concerns regardingthe econometric methodology, the dependent variable, the bank organizational variablesand the measure of market competition.
5.1 Alternative testing for non-linearities
Throughout the paper we modeled the non-monotonic effect of credit market concentra-tion on relationship lending by adding a quadratic term for HHI. However, imposing aquadratic functional form could lead to erroneously accept the hypothesis of a U-shapedrelationship, because the estimated minimum point can be outside the data-range and,especially, because the significance of the quadratic term may be driven by a few extremevalues. Therefore, we address these concerns in two alternative ways. Firstly, we adopt aless parametric approach, estimating a linear spline with one discontinuity point (Marshand Cormier, 2002):
15Recall that HHI is scaled between 0 and 10, such that the reported variations correspond to theactual threshold of HHI = 1000 and HHI = 1800 identified by antitrust authorities to discriminatebetween competitive, moderately concentrated and concentrated markets.
15

Yij = f(HHIj, (HHIj −HHIT )× IT , ORGMKTSTRCj,
F IRMi, PROVj) (2)
where IT is an indicator function such that:
IT = 0 if HHIj < HHIT and IT = 1 if HHIj > HHIT (3)
In order to avoid any arbitrariness we chose the threshold HHIT estimating equation(2) by OLS with all possible discontinuity points of HHI and retaining the one whichmaximizes the overall adjusted R2. Following this approach, we can set HHIT at 0.975,very close to the antitrust threshold separating competitive and concentrated marketsand somewhat smaller than the minimum of the U-shaped curve estimated in Table 4.As illustrated by columns 1 and 3 in Table 5, consistent with results from quadraticspecification, in competitive markets, fiercer interbank competition is associated with anincrease in relationship banking, while in moderately concentrated and in concentratedmarkets interbank competition is associated with lower values of FINSHARE.
Further confirmation of the presence of a U-shaped relationship between market con-centration and our measure of relationship lending is provided by the estimation of afractional polynomial model with two power terms of HHI (Royston and Sauerbrei,2008). As reported in Table 5 (columns 2 and 4), among the 44 possible combinations,the best-fitting fractional polynomial powers of HHI are -2 and +216. Figure 4 mapsthe resulting fit and the 95% confidence interval, both for the fractional logit (panel(a)) and for the linear model (panel (b)). The inspection of regression results and thediagrams clearly confirm the presence and significance of a U-shaped relation betweenmarket concentration and relationship lending.
5.2 An alternative measure for relationship lending
In Table 6 we display estimation results of probit and linear probability models by usingthe indicator variable RELBANK as a measure of bank orientation. RELBANK isequal to one when the firm maintains at least 20% of its bank debt with the main bankand borrows from five or less banks, while it assumes the value of zero when at leastone of these conditions are not met. Reported coefficients are the average partial effects(APEs) of exogenous variables. Given the problems related to estimating the marginaleffects in non-linear models in which interactions are included, we calculate the correctAPE for the interaction terms following the procedure outlined by Ai and Norton (2003)and implemented by Norton et al. (2004).
Our previous findings on FINSHARE are all broadly confirmed. Control variablesmaintain their sign and significance, except for the coefficient on the provincial valueadded that in some specifications is no longer significantly different from zero. Moreimportantly, once we control for the organizational structure of the local banking system,the non-monotonic effect of HHI on the probability of firms borrowing on a relational
16We also estimated a fractional polynomial of degree three, but the results did not significantly differfrom those reported with two power terms.
16

base tends to vanish. Fiercer interbank competition is beneficial to relationship lendingonly when small, mutual banks are significantly present in the local credit market. Con-versely, the predominance of large and functionally distant banks may not be at oddswith the use of relationship lending technology only if competition in the credit marketis sufficiently low (i.e. HHI > 1).
5.3 Alternative measures for credit market variables
Beside bank size and organization, the theoretical and empirical literature has suggestedother characteristics of local credit markets as possible drivers of bank orientation. Inparticular, bank interaction across local credit markets would be a factor facilitating coor-dination amongst rival banks and restraining price undercutting competition (Heggestadand Rhoades, 1976; Bernheim and Whinston, 1990)17. If this is true, then, following therationale of the investment theory of relationship banking, banks may have incentives toinvest in relation-specific assets in order to establish exclusive ties with borrowers (Anandand Galetovic, 2006).
Recently, Degryse and Ongena (2007) corroborated this theoretical prediction findingthat multiple contacts of banks across markets are positively associated with the prob-ability of relationship lending. We therefore augmented model (1) with the inclusionof a provincial measure of multi-market contacts (MMC) that, for reasons of compa-rability, exactly follows Degryse and Ongena (2007, pp. 408-409)18. MMC is stronglycorrelated with market concentration and with the organizational variables: correlationindexes computed by provinces are 0.56 with HHI, 0.16 with F − DISTANCE, 0.46with LARGE BANKS and -0.48 with MUTUAL BANKS, all statistically significantat the 5 percent level.
For the sake of space, we only report results for the basic specification, without inter-action terms (Table 7, columns 1 and 4). The effect of of MMC on relationship lendingis not statistically different from zero and its inclusion does not affect the other coeffi-cients19. Even if in contrast with the evidence discussed by Degryse and Ongena (2007),this result is consistent with the lack of evidence supporting the multi-market contacthypothesis in the Italian banking market (De Bonis and Ferrando, 2000).
Further robustness checks concern the definitions of functional distance and size struc-ture of the local banking system. So far, we have assumed that agency problems inside the
17Multi-market contacts may also have pro-competitive effects, because banks may strategically decideto lend more than the optimal level in one market to reduce competition in others (Mester, 1987) orbecause of their funding advantages (Park and Pennacchi, 2009).
18In their turn, Degryse and Ongena follow Evans and Kessides (1994), who suggest calculating MCCas the sum of all bank pairs in the borrower’s credit market (in our case the province) weighted by therelative frequency of their bilateral contacts in other markets (provinces):
MMCj =2
95 · fj · (fj − 1)
B∑k=1
B∑l=k+1
ak,lDk,jDl,j
where i = 1, ..., B are the banks, j = 1, ..., 95 are the provinces, fj is the number of banks operating in
province j, Di,j = 1 if bank i operates in province j, and ak,l =∑B
j=1 Dk,jDl,j .19This is also true when we include interactions between HHI and bank organizational variables and
even when we consider the interacted term HHI × MMC.
17

bank organization which makes relationship lending more costly increases with physicaldistance between the loan officer and the headquarter. However, organizational disec-onomies also depend on the branch-headquarter cultural distance, i.e., on trust, normsand cultural affinities between local loan officers and bank’s managers at the parent bank(Alessandrini et al., 2008). In this view, we build an alternative measure of functionaldistance (F −DISTANCE SC) according to which bank branches are weighted by thedifference in social capital between the provinces where the branch and its headquarterare located (Alessandrini et al., 2009b)20.
A second refinement relates to the bank-asset threshold used to define the size struc-ture of the local banking system. In particular, we replicate regressions substitutingLARGE BANKS with MEDIUM BANKS, the share of branches in the provinceowned by medium-sized banks, where a bank is classified as medium if its total assets aremore than 9 billion euros at 2003 prices (see above footnote 11).
As shown in Table 7, columns 2-3 and 5-6, estimation results are virtually unchangedwith regard both to the banking and the firm-specific variables. It is worth noting, how-ever, that the importance of functional distance of the local banking system in promotingrelationship lending and in shaping the effect of market concentration is higher when itis measured in terms of social capital rather than in terms of kilometers. By contrast,the effects of the size of the local banking system on relationship lending are found to belower when we include medium banks in the size index.
.
5.4 An alternative measure for market competition
By measuring market rivalry with the Herfindhal-Hirschmann index, we have implicitlyespoused a structural approach to competition on the track of the structure-conduct-performance paradigm. In reaction to the theoretical flaws of this paradigm, the so-calledNew Empirical Industrial Organization literature has suggested measuring the degree ofcompetition in the market by looking at the (estimated) behavior of firms. In particular,a widely used non-structural measure of competition is the H -statistic introduced byPanzar and Rosse (1987)21.
The H -statistic is the sum of the elasticities of a bank’s revenues (R) with respect tom input prices (w),
H =m∑k=1
∂R
∂wk
wk
R
and, on real data, it is calculated by summing the estimated coefficients of a log-logreduced form revenue equation. Under the assumption that the market is in a long-run equilibrium, Panzar and Rosse (1987) prove that values of the statistic H ≤ 0 are
20To be precise, social capital is computed as the average voter turnout at the 21 referenda held inItaly in 1993, 1995 and 2001 as published by the Home Department. The same results hold if we usethe number of blood bags per million population voluntarily donated in each province to the ItalianAssociation of Blood Donors (AVIS) in 1995 (Guiso et al., 2004b).
21In the banking literature, the H -statistic has been recently employed, amongst others, by Bikker andHaaf (1998), Claessens and Laeven (2005), and, with regard to Italy, by Agostino and Trivieri (2009)and Coccorese (2009).
18

consistent with the case of firms operating as monopolists or under a monopolistic cartel,values 0 < H < 1 are consistent with the case of monopolistic competition and H = 1with the case of perfect competition.
In this paper we draw the H -statistic (H − STAT ) at the provincial level in 1998and 2001 from Agostino and Trivieri (2009)22. Then, we build three dummy variables forperfectly competitive, imperfectly competitive and monopolistic credit markets, respec-tively: (i) H−STATPC which assumes the value of 1 when we cannot reject the null thatthe sum of price elasticities is equal to one; (ii) H − STATMC which assumes the valueof 1 when we reject at 10% level of confidence the null hypotheses that the sum of theestimated price elasticities of revenue is equal to zero (i.e., H − STAT = 0) and equalto one (i.e., H − STAT = 1); (iii) H − STATM which assumes the value of 1 when wecannot reject the null that the sum of price elasticities is equal to zero23.
Estimation results are reported in Table 8, whereH−STATPC is taken as the referencecategory. First, the stability of all our findings relative to control and bank organizationalvariables testifies that our model of relationship banking is robust to the measure ofinterbank competition. Second, the coefficients on H − STATMC and H − STATM areboth positive, highly significant and virtually identical in magnitude (columns 1 and5). Consistent with the investment theory of relationship lending, this result indicatesthat interbank competition reduces the possibility and/or the convenience of establishingexclusive ties with borrowers and lend on a relational base. However, when we considerthe interplay between competition and the organizational structure of the local bankingsystem (columns 2-4 and 6-8), we also have clear confirmation that the beneficial impactof bank market power on relationship lending only holds in markets where the presenceof large and functionally distant banks predominates (the interaction terms between theH − STATM dummy and MUTUAL BANKS has the right negative sign but is notstatistically significant). On average, the share of credit supplied by the main bank is 2.5percentage points larger in monopolistic than in competitive markets. This effect vanishesin local credit markets with a small share (15%) of branches owned by large banks andwhere banks are functionally close, while it is twice as large in credit markets with adominant share of branches belonging to large banks (46%) or to functionally distantbanks (F −DISTANCE equal to the third quartile of its provincial distribution).
6 Concluding remarks
The current global financial crisis is affecting the structure of local credit markets, viagovernment interventions and bank mergers and acquisitions, and it is bringing exclusiveand stable lending relationships with borrowers back to the center of banks’ businessmodels. Relationship-based technologies appear to be of great value both for banks,
22We thank Mariarosaria Agostino and Francesco Trivieri for sharing their dataset and estimationprocedure generously with us. Refer to their paper for details on the revenue equations at the provinciallevel and on the statistical validation of the long-run equilibrium assumption.
23On the base of the Vesala’s (1995) demonstration that the H-statistic is increasing with demandelasticities, in the few cases in which the F-statistics did not reject both the hypotheses of equality toone and equality to zero of price elasticities, we considered the provincial credit market as perfectlycompetitive, imperfectly competitive or monopolistic according to whether H − STAT < 0.25, 0.25 ≤H − STAT ≥ 0.75, or H − STAT > 0.75.
19

which are refocusing their activities on their core business, and for small-medium enter-prises (SMEs), whose financial needs are more urgent in times of widespread distress24.However, deregulation and improvement in communication technologies has also madecredit markets more competitive, the incidence of large and geographically dispersedbanks more pervasive and transactional lending more profitable. Is relationship lendinggoing to survive these changes? How does interbank competition and the organizationalstructure of local banking systems affect the exclusiveness of bank-firm relationships?
Theoretical predictions on the impact of interbank competition on relationship lendingare contrasting. According to the investment theory of relationship lending, as the creditmarket concentration increases, the firms’ borrowing options shrink, giving banks theopportunity to recoup in the course of the lending relationship the specific investmentsneeded to build extensive ties with a firm. On the other hand, following the strategictheory of relationship lending, fiercer interbank competition drives local lenders to takeadvantage of their specific knowledge of local economies as a competitive edge, reorientingtheir lending activity towards relational-based loans to small, local firms.
Hence, to establish whether relationship lending can survive competition is essentiallyan empirical matter. In two recent papers, Elsas (2005) and Degryse and Ongena (2007)documented a non-linear U-shaped effect of market concentration on relationship lendingwhich cannot be easily accommodated with theory. In this paper we show that this non-monotonicity can be explained by the organizational structure of local credit markets.Marginal increases in interbank competition are detrimental to relationship lending inmarkets where large and out-of-market banks are predominant. On the contrary, whererelational-based lending technologies are already widely in use in the market by a largegroup of small mutual banks, an increase in competition may drive banks to furthercultivate their extensive ties with customers.
References
Aghion, P. and Tirole, J. (1997). Formal and real authority in organizations. Journal ofPolitical Economy, 105(1), 1–29.
Agostino, M. and Trivieri, F. (2009). Is banking competition beneficial to smes? anempirical study based on Italian data. Small Business Economics, forthcoming.
Ai, C. and Norton, E. C. (2003). Interaction terms in logit and probit models. EconomicsLetters, 80(1), 123–129.
Akhavein, J., Frame, W., and White, L. J. (2005). The diffusion of financial innovations:An examination of the adoption of small business credit scoring by large bankingorganizations. Journal of Business, 78(2), 577–596.
Alessandrini, P., Croci, M., and Zazzaro, A. (2005). The geography of banking power:the role of functional distance. BNL Quarterly Review, LVIII(235), 129–67.
24On the value of relationship lending on Korean SMEs during the 1997 financial crisis, see Ferri et al.(2001).
20

Alessandrini, P., Calcagnini, G., and Zazzaro, A. (2008). Asset restructuring strategies inbank acquisitions: Does distance between dealing partners matter? Journal of Banking& Finance, 32(5), 699–713.
Alessandrini, P., Presbitero, A. F., and Zazzaro, A. (2009a). Bank Size or Distance:What Hampers Innovation Adoption by SMEs? Journal of Economic Geography,forthcoming.
Alessandrini, P., Presbitero, A. F., and Zazzaro, A. (2009b). Banks, distances and firms’financing constraints. Review of Finance, 13(2), 261–307.
Anand, B. N. and Galetovic, A. (2006). Relationships, competition and the structure ofinvestment banking markets. Journal of Industrial Economics, 54(2), 151–199.
Angelini, P., Di Salvo, R., and Ferri, G. (1998). Availability and cost of credit for smallbusinesses: Customer relationships and credit cooperatives. Journal of Banking &Finance, 22(6-8), 925–954.
Benfratello, L., Schiantarelli, F., and Sembenelli, A. (2008). Banks and innovation: Mi-croeconometric evidence on Italian firms. Journal of Financial Economics, 90, 197–217.
Benvenuti, M., Casolaro, L., Del Prete, S., and Mistrulli, P. E. (2009). Loan officerauthority and small business lending. evidence from a survey. paper presented at theMoFiR conference ”‘The Changing Geography of Money, Banking and Finance in aPost-Crisis World”’ (Ancona), available at http://changingeography09.univpm.it/.
Berger, A. N. and Udell, G. F. (1996). Universal banking and the future of small businesslending. In A. Saunders and I. Walter, editors, Universal Banking: Financial SystemDesign Reconsidered. Irwin, Burr Ridge, IL.
Berger, A. N. and Udell, G. F. (2002). Small business credit availability and relationshiplending: The importance of bank organisational structure. The Economic Journal,112(477), F32–F53.
Berger, A. N. and Udell, G. F. (2006). A more complete conceptual framework for smefinance. Journal of Banking & Finance, 30(477), 2945–2966.
Berger, A. N., Demsetz, R. S., and Strahan, P. E. (1999). The consolidation of the finan-cial services industry: Causes, consequences, and implications for the future. Journalof Banking & Finance, 23(2-4), 135–194.
Berger, A. N., Miller, N. H., Petersen, M. A., Rajan, R. G., and Stein, J. C. (2005). Doesfunction follow organizational form? Evidence from the lending practices of large andsmall banks. Journal of Financial Economics, 76(2), 237–269.
Berger, A. N., Rosen, R. J., and Udell, G. F. (2007). Does market size structure affectcompetition? The case of small business lending. Journal of Banking & Finance, 31(1),11–33.
Bernheim, B. D. and Whinston, M. D. (1990). Multimarket contact and collusive behav-ior. RAND Journal of Economics, 21(1), 1–26.
21
Bikker, J. A. and Haaf, K. (1998). Competition, concentration and their relationship:An empirical analysis of the banking industry. Journal of Banking & Finance, 26(11),2192–2214.
Bond, S., Harhoff, D., and Van Reenen, J. (2003). Investment, R&D and financial con-straints in britain and germany. CEP Discussion Papers dp0595, Centre for EconomicPerformance, LSE.
Boot, A. W. A. and Thakor, A. V. (2000). Can relationship banking survive competition?Journal of Finance, 55(2), 679–713.
Bresnahan, T. F. (1989). Empirical studies of industries with market power. InR. Schmalensee and R. Willig, editors, Handbook of Industrial Organization, volume 2of Handbook of Industrial Organization, chapter 17, pages 1011–1057. Elsevier.
Brevoort, K. P. and Hannan, T. H. (2004). Commercial lending and distance: evidencefrom Community Reinvestment Act data. Finance and Economics Discussion Series 24,Federal Reserve Board.
Canales, R. and Nanda, R. (2008). Bank structure and terms of lending to small firms.Working Paper 8, Harvard Business School.
Capitalia (2005). Indagine sulle imprese manifatturiere. Nono Rapporto sull’industriaitaliana e sulla politica industriale. Capitalia, Roma.
Carbo-Valverde, S., Rodrıguez-Fernandez, F., and Udell, G. F. (2009). Bank marketpower and sme financing constraints. Review of Finance, 13(2), 309–340.
Carter, D. A. and McNulty, J. E. (2005). Deregulation, technological change, and thebusiness-lending performance of large and small banks. Journal of Banking & Finance,29(5), 1113–1130.
Cetorelli, N. (1999). Competitive analysis in banking: appraisal of the methodologies.Federal Reserve Bank of Chicago Economic Perspectives, (Q I), 2–15.
Cetorelli, N. and Strahan, P. E. (2006). Finance as a barrier to entry: Bank competitionand industry structure in local u.s. markets. Journal of Finance, 61(1), 437–461.
Claessens, S. and Laeven, L. (2005). Financial development, banking sector competition,and economic growth. Journal of the European Economic Association, 3(1), 179–207.
Coccorese, P. (2009). Market power in local banking monopolies. Journal of Banking &Finance, 33(7), 1196–1210.
Cole, R. A., Goldberg, L. G., and White, L. J. (2004). Cookie-cutter versus character:The micro structure of small business lending by large and small banks. Journal ofFinancial and Quantitative Analysis, 39(2), 227–251.
Cosci, S. and Meliciani, V. (2002). Multiple banking relationships: evidence from theitalian experience. The Manchester School, 70(0), 37–54.
22

De Bonis, R. and Ferrando, A. (2000). The italian banking structure in the 1990s: Testingthe multimarket contact hypothesis. Economic Notes, 29(2), 215–241.
De Bonis, R., Ferri, G., and Rotondi, Z. (2008). Firms’ internationalization and relation-ship with banks. In G. Bracchi and D. Masciandaro, editors, Banche italiane e governodei rischi. Imprese, famiglie, regole. Bancaria Editrice, Roma.
Degryse, H. and Ongena, S. (2007). The impact of competition on bank orientation.Journal of Financial Intermediation, 16(3), 399–424.
Degryse, H., Laeven, L., and Ongena, S. (2009a). The impact of organizational structureand lending technology on banking competition. Review of Finance, 13(1), 225–259.
Degryse, H., Masschelein, N., and Mitchell, J. (2009b). Staying, dropping, or switching:the impacts of bank mergers on small firms. Review of Financial Studies, forthcoming.
Delgado, J., Salas, V., and Saurina, J. (2007). Joint size and ownership specialization inbank lending. Journal of Banking & Finance, 31(12), 3563–3583.
Dell’Ariccia, G. and Marquez, R. (2004). Information and bank credit allocation. Journalof Financial Economics, 72(1), 185–214.
Dinc, I. S. (2000). Bank reputation, bank commitment, and the effects of competition incredit markets. Review of Financial Studies, 13(5), 781–812.
Dwyer, D. W., Kocagil, A. E., and Stein, R. M. (2004). Moody’s KMV RISKCALCTM
v3.1 Model. Next-generation technology for predicting private firm credit risk. Availableat http : //www.moodyskmv.com/products/files/riskcalc v3 1 model.pdf , Moody’sKMV.
Elsas, R. (2005). Empirical determinants of relationship lending. Journal of FinancialIntermediation, 14(1), 32–57.
Evans, W. N. and Kessides, I. N. (1994). Living by the ”golden rule”: Multimarketcontact in the US airline industry. Quarterly Journal of Economics, 109(2), 341–366.
Ferri, G. and Messori, M. (2000). Bank-firm relationships and allocative efficiency innortheastern and central Italy and in the south. Journal of Banking & Finance, 24(6),1067–1095.
Ferri, G., Kang, T. S., and Kim, I.-J. (2001). The value of relationship banking duringfinancial crises : evidence from the republic of korea. Policy Research Working PaperSeries 2553, The World Bank.
Fischer, K.-H. (2000). Acquisition of information in loan markets and bank market power- An empirical investigation. Goethe University Frankfurt.
Frame, W., Srinivasan, A., and Woosley, L. (2001). The effect of credit scoring on smallbusiness lending. Journal of Money Credit and Banking, 33(3), 813–825.
23
Garicano, L. (2000). Hierarchies and the organization of knowledge in production. Journalof Political Economy, 108(5), 874–904.
Guiso, L. and Minetti, R. (2004). Multiple creditors and information rights: theory andevidence from us firms. CEPR Discussion Paper 4278, CEPR.
Guiso, L., Sapienza, P., and Zingales, L. (2004a). Does local financial developmentmatter? The Quarterly Journal of Economics, 119(3), 929–969.
Guiso, L., Sapienza, P., and Zingales, L. (2004b). The role of social capital in financialdevelopment. The American Economic Review, 94(3), 526–556.
Hausman, J. A. and Leonard, G. K. (1997). Superstars in the national basketball asso-ciation: Economic value and policy. Journal of Labor Economics, 15(4), 586–624.
Hauswald, R. and Marquez, R. (2006). Competition and Strategic Information Acquisi-tion in Credit Markets. Review of Financial Studies, 19(3), 967–1000.
Heggestad, A. A. and Rhoades, S. A. (1976). Concentration and firm stability in com-mercial banking. The Review of Economics and Statistics, 58(4), 443–52.
Herrera, A. M. and Minetti, R. (2007). Informed finance and technological change: Evi-dence from credit relationships. Journal of Financial Economics, 83(1), 223–269.
Hertzberg, A., Liberti, J. M., and Paravisini, D. (2009). Information and incentives insidethe firm: Evidence from loan officer rotation. Journal of Finance, forthcoming.
Liberti, J. M. and Mian, A. R. (2009). Estimating the effect of hierarchies on informationuse. Review of Financial Studies, 22(10), 4057–4090.
Lucchetti, R., Papi, L., and Zazzaro, A. (2001). Banks’ inefficiency and economic growth:A micro-macro approach. The Scottish Journal of Political Economy, 48(4), 400–424.
Marsh, L. C. and Cormier, D. R. (2002). Spline Regression Models. Quantitative Appli-cations in the Social Sciences. Sage Publications, Thousand Oaks.
Memmel, C., Schmieder, C., and Stein, I. (2007). Relationship lending: empirical evidencefor Germany. Discussion Paper Series 2: Banking and Financial Studies 14, DeutscheBundesbank.
Mester, L. J. (1987). Multiple market contact between savings and loans: A note. Journalof Money, Credit and Banking, 19(4), 538–49.
Mian, A. (2006). Distance constraints: The limits of foreign lending in poor economies.The Journal of Finance, LXI(3), 1465–1505.
Micucci, G. and Rossi, P. (2009). Debt restructuring and the role of lending tech-nologies. paper presented at the MoFiR conference ”‘The Changing Geographyof Money, Banking and Finance in a Post-Crisis World”’ (Ancona), available athttp://changingeography09.univpm.it/.
24

Milbourn, T. T., Shockley, R. L., and Thakor, A. V. (2001). Managerial career concernsand investments in information. RAND Journal of Economics, 32(2), 334–51.
Moulton, B. R. (1990). An illustration of a pitfall in estimating the effects of aggregatevariables on micro unit. The Review of Economics and Statistics, 72(2), 334–38.
Neuberger, D., Pedergnana, M., and Rathke-Doppner, S. (2008). Concentration of bank-ing relationships in Switzerland: The result of firm structure or banking market struc-ture? Journal of Financial Services Research, 33(2), 101–126.
Norton, E. C., Wang, H., and Ai, C. (2004). Computing interaction effects and standarderrors in logit and probit models. Stata Journal, 4(2), 154–167.
Ogura, Y. (2007). Lending competition, relationship banking, and credit availability forentrepreneurs. Discussion papers 07036, Research Institute of Economy, Trade andIndustry (RIETI).
Ogura, Y. (2009). Interbank competition and information production: Evi-dence from the interest rate difference. Journal of Financial Intermediation,doi:10.1016/j.jfi.2009.09.001.
Ongena, S. and Smith, D. C. (2000). What determines the number of bank relationships?Cross-country evidence. Journal of Financial Intermediation, 9(1), 26–56.
Panzar, J. C. and Rosse, J. N. (1987). Testing for ”Monopoly” Equilibrium. Journal ofIndustrial Economics, 35(4), 443–56.
Papke, L. E. and Wooldridge, J. M. (1996). Econometric methods for fractional responsevariables with an application to 401(k) plan participation rates. Journal of AppliedEconometrics, 11(6), 619–32.
Park, K. and Pennacchi, G. (2009). Harming depositors and helping borrowers: Thedisparate impact of bank consolidation. Review of Financial Studies, 22(1), 1–40.
Petersen, M. A. (2009). Estimating standard errors in finance panel data sets: Comparingapproaches. Review of Financial Studies, 22(1), 435–480.
Petersen, M. A. and Rajan, R. G. (1995). The effect of credit market competition onlending relationships. The Quarterly Journal of Economics, 110(2), 407–43.
Rajan, R. G. (1992). Insiders and outsiders: The choice between informed and arm’s-length debt. Journal of Finance, 47(4), 1367–400.
Rice, T. and Strahan, P. E. (2009). Does credit competition affect small-firm finance?Journal of Finance, forthcoming.
Royston, P. and Sauerbrei, W. (2008). Multivariable Model-building: A Pragmatic Ap-proach to Regression Analysis Based on Fractional Polynomials for Modelling Contin-uous Variables. Wiley, Chichester, UK.
25

Sapienza, P. (2002). The effects of banking mergers on loan contracts. Journal of Finance,57(1), 329–367.
Scharfstein, D. S. and Stein, J. C. (2000). The dark side of internal capital markets:Divisional rent-seeking and inefficient investment. Journal of Finance, 55(6), 2537–2564.
Scott, J. (2004). Small business and the value of community financial institutions. Journalof Financial Services Research, 25(2), 207–230.
Sharpe, S. A. (1990). Asymmetric information, bank lending, and implicit contracts: Astylized model of customer relationships. Journal of Finance, 45(4), 1069–87.
Stein, J. C. (2002). Information production and capital allocation: Decentralized versushierarchical firms. Journal of Finance, 57(5), 1891–1921.
Uchida, H., Udell, G. F., and Watanabe, W. (2008). Bank size and lending relationshipsin Japan. Journal of the Japanese and International Economies, 22(2), 242–267.
Uzzi, B. (1999). Embeddedness in the making of financial capital: How social relationsand networks benefit firms seeking financing. American Sociological Review, 64(9),481–505.
Vesala, J. (1995). Testing for competition in banking: behavioural evidence from Finland.Working paper E:1, Bank of Finland.
von Thadden, E.-L. (2004). Asymmetric information, bank lending and implicit contracts:the winner’s curse. Finance Research Letters, 1(1), 11–23.
Wagner, J. (2001). A note on the firm size-export relationship. Small Business Economics,17(4), 229–37.
Yafeh, Y. and Yosha, O. (2001). Industrial Organization of Financial Systems and Strate-gic Use of Relationship Banking. European Finance Review, 5(1-2), 63–78.
26

A Tables
27
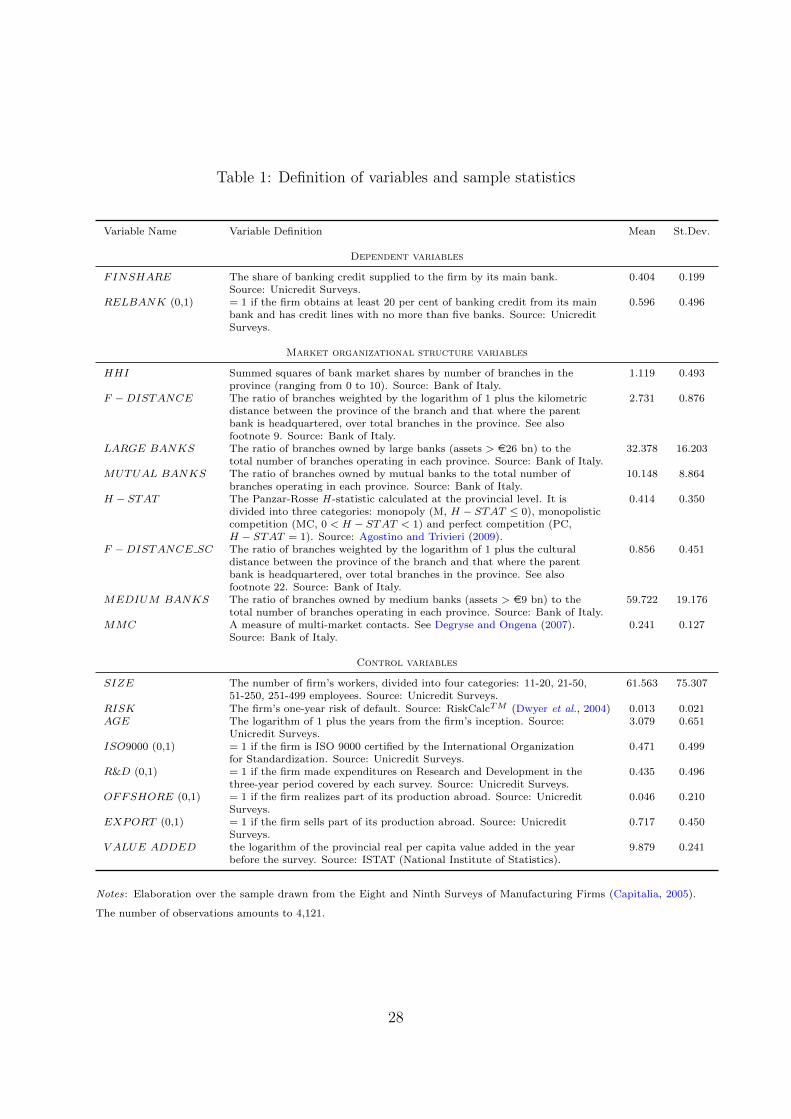
Table 1: Definition of variables and sample statistics
Variable Name Variable Definition Mean St.Dev.
Dependent variables
FINSHARE The share of banking credit supplied to the firm by its main bank. 0.404 0.199Source: Unicredit Surveys.
RELBANK (0,1) = 1 if the firm obtains at least 20 per cent of banking credit from its main 0.596 0.496bank and has credit lines with no more than five banks. Source: UnicreditSurveys.
Market organizational structure variables
HHI Summed squares of bank market shares by number of branches in the 1.119 0.493province (ranging from 0 to 10). Source: Bank of Italy.
F −DISTANCE The ratio of branches weighted by the logarithm of 1 plus the kilometric 2.731 0.876distance between the province of the branch and that where the parentbank is headquartered, over total branches in the province. See alsofootnote 9. Source: Bank of Italy.
LARGE BANKS The ratio of branches owned by large banks (assets > e26 bn) to the 32.378 16.203total number of branches operating in each province. Source: Bank of Italy.
MUTUAL BANKS The ratio of branches owned by mutual banks to the total number of 10.148 8.864branches operating in each province. Source: Bank of Italy.
H − STAT The Panzar-Rosse H -statistic calculated at the provincial level. It is 0.414 0.350divided into three categories: monopoly (M, H − STAT ≤ 0), monopolisticcompetition (MC, 0 < H − STAT < 1) and perfect competition (PC,H − STAT = 1). Source: Agostino and Trivieri (2009).
F −DISTANCE SC The ratio of branches weighted by the logarithm of 1 plus the cultural 0.856 0.451distance between the province of the branch and that where the parentbank is headquartered, over total branches in the province. See alsofootnote 22. Source: Bank of Italy.
MEDIUM BANKS The ratio of branches owned by medium banks (assets > e9 bn) to the 59.722 19.176total number of branches operating in each province. Source: Bank of Italy.
MMC A measure of multi-market contacts. See Degryse and Ongena (2007). 0.241 0.127Source: Bank of Italy.
Control variables
SIZE The number of firm’s workers, divided into four categories: 11-20, 21-50, 61.563 75.30751-250, 251-499 employees. Source: Unicredit Surveys.
RISK The firm’s one-year risk of default. Source: RiskCalcTM (Dwyer et al., 2004) 0.013 0.021AGE The logarithm of 1 plus the years from the firm’s inception. Source: 3.079 0.651
Unicredit Surveys.ISO9000 (0,1) = 1 if the firm is ISO 9000 certified by the International Organization 0.471 0.499
for Standardization. Source: Unicredit Surveys.R&D (0,1) = 1 if the firm made expenditures on Research and Development in the 0.435 0.496
three-year period covered by each survey. Source: Unicredit Surveys.OFFSHORE (0,1) = 1 if the firm realizes part of its production abroad. Source: Unicredit 0.046 0.210
Surveys.EXPORT (0,1) = 1 if the firm sells part of its production abroad. Source: Unicredit 0.717 0.450
Surveys.V ALUE ADDED the logarithm of the provincial real per capita value added in the year 9.879 0.241
before the survey. Source: ISTAT (National Institute of Statistics).
Notes: Elaboration over the sample drawn from the Eight and Ninth Surveys of Manufacturing Firms (Capitalia, 2005).
The number of observations amounts to 4,121.
28

Table 2: Distribution of FINSHARE and RELBANK across HHI
FINSHARE RELBANK Obs.
HHI = 1◦ quintile 0.407 0.590 830HHI = 2◦ quintile 0.396 0.521** 856HHI = 3◦ quintile 0.398 0.543* 808HHI = 4◦ quintile 0.402 0.565 823HHI = 5◦ quintile 0.429* 0.641* 804
Whole sample 0.406 0.571 4,121
Notes: Numbers are obtained considering the sample of 4,121 firms used in the regression analysis. FINSHARE is
the share of bank credit supplied to the firm by its main bank. RELBANK is a dummy variable which identifies firms
that borrow at least 20 percent of credit from the main bank and have contacts with no more than 5 banks. (**) (*)
indicate statistical significance at the 1% (5%) level of a two-tailed test of the null that the values of the 2◦-5◦ quintiles of
FINSHARE and RELBANK are equal to their values at the first quintile of the HHI distribution.
Table 3: Pairwise correlation
HHI LARGE BANKS F −DISTANCE MUTUAL BANKS
HHI 1.000LARGE BANKS -0.039 1.000F −DISTANCE 0.179* 0.350* 1.000MUTUAL BANKS -0.312* -0.262* -0.394* 1.000
Notes: Elaboration over the sample of 95 provinces and the sample period 1998-2003. (*) indicates statistical significance
at the 5% level.
29

Tab
le4:
Det
erm
inan
tsof
rela
tion
ship
lendin
g–FINSHARE
Dep
.V
ar.
:FINSHARE
Fra
ctio
nal
Logit
Lin
ear
Mod
el
12
34
56
78
910
Mark
etst
ruct
ure
vari
ab
les
HHI
-0.0
57
-0.0
13
-0.1
61**
-0.2
18**
0.0
10
-0.0
14
-0.0
03
-0.0
39**
-0.0
53**
0.0
02
[0.0
54]
[0.0
64]
[0.0
70]
[0.0
97]
[0.0
71]
[0.0
13]
[0.0
15]
[0.0
17]
[0.0
23]
[0.0
17]
HHI2
0.0
21**
0.0
17*
-0.0
10
0.0
36***
0.0
11
0.0
05**
0.0
04*
-0.0
02
0.0
09***
0.0
03
[0.0
09]
[0.0
09]
[0.0
16]
[0.0
11]
[0.0
11]
[0.0
02]
[0.0
02]
[0.0
04]
[0.0
03]
[0.0
03]
F−
DISTANCE
-0.0
11
-0.0
79*
-0.0
03
-0.0
19*
[0.0
22]
[0.0
42]
[0.0
05]
[0.0
10]
HHI×
F−
DISTANCE
0.0
66**
0.0
16**
[0.0
29]
[0.0
07]
LARGE
BANKS
0.0
03**
-0.0
03
0.0
01**
-0.0
01
[0.0
01]
[0.0
03]
[0.0
00]
[0.0
01]
HHI×
LARGE
BANKS
0.0
04**
0.0
01**
[0.0
02]
[0.0
00]
MUTUAL
BANKS
0.0
02
0.0
05**
0.0
01
0.0
01**
[0.0
02]
[0.0
02]
[0.0
01]
[0.0
01]
HHI×
MUTUAL
BANKS
-0.0
05*
-0.0
01*
[0.0
03]
[0.0
01]
Controlvariables
SIZE
21−50
-0.1
34***
-0.1
34***
-0.1
36***
-0.1
34***
-0.1
33***
-0.0
33***
-0.0
33***
-0.0
33***
-0.0
33***
-0.0
33***
[0.0
31]
[0.0
31]
[0.0
32]
[0.0
31]
[0.0
31]
[0.0
08]
[0.0
08]
[0.0
08]
[0.0
08]
[0.0
08]
SIZE
51−250
-0.3
35***
-0.3
35***
-0.3
38***
-0.3
35***
-0.3
35***
-0.0
80***
-0.0
80***
-0.0
81***
-0.0
80***
-0.0
80***
[0.0
32]
[0.0
31]
[0.0
32]
[0.0
32]
[0.0
31]
[0.0
08]
[0.0
08]
[0.0
08]
[0.0
08]
[0.0
08]
SIZE
251−500
-0.4
76***
-0.4
75***
-0.4
76***
-0.4
73***
-0.4
73***
-0.1
12***
-0.1
11***
-0.1
12***
-0.1
11***
-0.1
11***
[0.0
86]
[0.0
87]
[0.0
87]
[0.0
86]
[0.0
87]
[0.0
19]
[0.0
19]
[0.0
19]
[0.0
19]
[0.0
19]
AGE
-0.1
29
-0.1
36
-0.1
19
-0.1
26
-0.0
31
-0.0
27
-0.0
33
-0.0
29
-0.0
30
[0.1
16]
-0.1
12
[0.1
17]
[0.1
14]
[0.1
18]
[0.0
28]
[0.0
27]
[0.0
28]
[0.0
27]
[0.0
28]
AGE
20.0
25
[0.1
14]
0.0
26
0.0
23
0.0
24
0.0
06
0.0
05
0.0
06
0.0
05
0.0
06
[0.0
18]
0.0
22
[0.0
18]
[0.0
18]
[0.0
19]
[0.0
04]
[0.0
04]
[0.0
04]
[0.0
04]
[0.0
04]
RISK
-1.2
28**
[0.0
18]
-1.2
05**
-1.2
50**
-1.2
22**
-0.2
91**
-0.3
02***
-0.2
86**
-0.2
97**
-0.2
90**
[0.4
94]
[0.4
84]
[0.4
91]
[0.4
89]
[0.4
94]
[0.1
15]
[0.1
13]
[0.1
15]
[0.1
14]
[0.1
15]
R&D
(0,1
)-0
.064**
-0.0
63**
-0.0
64**
-0.0
63**
-0.0
64**
-0.0
15**
-0.0
15**
-0.0
15**
-0.0
15**
-0.0
15**
[0.0
28]
[0.0
29]
[0.0
29]
[0.0
29]
[0.0
29]
[0.0
07]
[0.0
07]
[0.0
07]
[0.0
07]
[0.0
07]
ISO
9000
(0,1
)-0
.046*
-0.0
51**
-0.0
47**
-0.0
50**
-0.0
45*
-0.0
11*
-0.0
12**
-0.0
11*
-0.0
12**
-0.0
11*
[0.0
24]
[0.0
24]
[0.0
24]
[0.0
24]
[0.0
24]
[0.0
06]
[0.0
06]
[0.0
06]
[0.0
06]
[0.0
06]
OFFSHORE
(0,1
)-0
.110*
-0.1
06*
-0.1
12*
-0.1
09*
-0.1
08*
-0.0
25*
-0.0
24*
-0.0
26*
-0.0
25*
-0.0
25*
[0.0
59]
[0.0
58]
[0.0
58]
[0.0
59]
[0.0
59]
[0.0
13]
[0.0
13]
[0.0
13]
[0.0
14]
[0.0
13]
EXPORT
(0,1
)-0
.085**
-0.0
83**
-0.0
82**
-0.0
83**
-0.0
86***
-0.0
21**
-0.0
20**
-0.0
20**
-0.0
20**
-0.0
21**
[0.0
33]
[0.0
33]
[0.0
33]
[0.0
33]
[0.0
33]
[0.0
08]
[0.0
08]
[0.0
08]
[0.0
08]
[0.0
08]
VALUE
ADDED
-0.2
43***
-0.2
01**
-0.2
77***
-0.1
77**
-0.2
37***
-0.0
58***
-0.0
48**
-0.0
67***
-0.0
42**
-0.0
57***
[0.0
65]
[0.0
97]
[0.0
92]
[0.0
73]
[0.0
66]
[0.0
16]
[0.0
23]
[0.0
22]
[0.0
17]
[0.0
16]
Ob
serv
ati
on
s4121
4121
4121
4121
4121
4121
4121
4121
4121
4121
R2
..
..
0.0
53
0.0
54
0.0
54
0.0
55
0.0
53
30

Notes to Table 4: The table reports regression coefficients and, in brackets, the associated standard errors, clustered
at provincial level. * significant at 10%; ** significant at 5%; *** significant at 1%. The model is estimated by fractional
logit, using the Stata 10 SE package with GLM command, in columns (1-5) and by OLS, using the Stata 10 SE package
with REG command, in columns (6-10). The dependent variable is the share of bank credit supplied to the firm by its main
bank (FINSHARE). The variable SIZE is split into four categories, with the reference category being 11–20 employees.
All regressions include industry and time dummies and a constant, not reported for reasons of space.
31
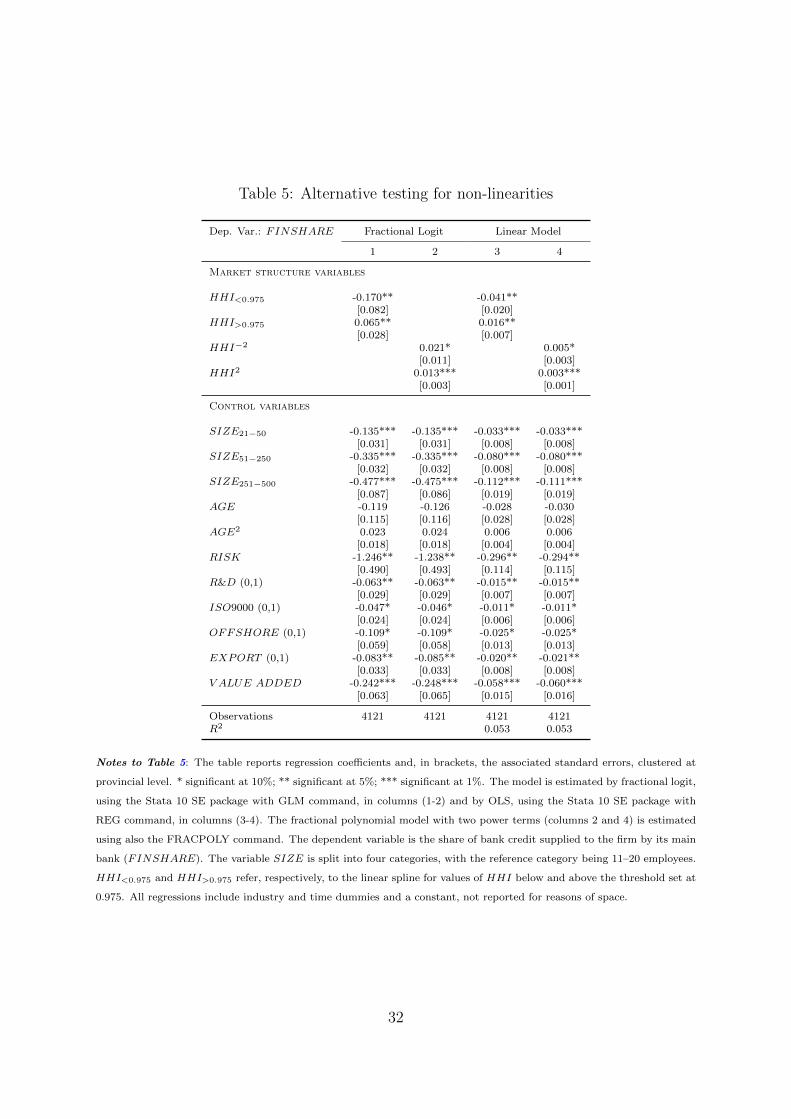
Table 5: Alternative testing for non-linearities
Dep. Var.: FINSHARE Fractional Logit Linear Model
1 2 3 4
Market structure variables
HHI<0.975 -0.170** -0.041**[0.082] [0.020]
HHI>0.975 0.065** 0.016**[0.028] [0.007]
HHI−2 0.021* 0.005*[0.011] [0.003]
HHI2 0.013*** 0.003***[0.003] [0.001]
Control variables
SIZE21−50 -0.135*** -0.135*** -0.033*** -0.033***[0.031] [0.031] [0.008] [0.008]
SIZE51−250 -0.335*** -0.335*** -0.080*** -0.080***[0.032] [0.032] [0.008] [0.008]
SIZE251−500 -0.477*** -0.475*** -0.112*** -0.111***[0.087] [0.086] [0.019] [0.019]
AGE -0.119 -0.126 -0.028 -0.030[0.115] [0.116] [0.028] [0.028]
AGE2 0.023 0.024 0.006 0.006[0.018] [0.018] [0.004] [0.004]
RISK -1.246** -1.238** -0.296** -0.294**[0.490] [0.493] [0.114] [0.115]
R&D (0,1) -0.063** -0.063** -0.015** -0.015**[0.029] [0.029] [0.007] [0.007]
ISO9000 (0,1) -0.047* -0.046* -0.011* -0.011*[0.024] [0.024] [0.006] [0.006]
OFFSHORE (0,1) -0.109* -0.109* -0.025* -0.025*[0.059] [0.058] [0.013] [0.013]
EXPORT (0,1) -0.083** -0.085** -0.020** -0.021**[0.033] [0.033] [0.008] [0.008]
V ALUE ADDED -0.242*** -0.248*** -0.058*** -0.060***[0.063] [0.065] [0.015] [0.016]
Observations 4121 4121 4121 4121R2 0.053 0.053
Notes to Table 5: The table reports regression coefficients and, in brackets, the associated standard errors, clustered at
provincial level. * significant at 10%; ** significant at 5%; *** significant at 1%. The model is estimated by fractional logit,
using the Stata 10 SE package with GLM command, in columns (1-2) and by OLS, using the Stata 10 SE package with
REG command, in columns (3-4). The fractional polynomial model with two power terms (columns 2 and 4) is estimated
using also the FRACPOLY command. The dependent variable is the share of bank credit supplied to the firm by its main
bank (FINSHARE). The variable SIZE is split into four categories, with the reference category being 11–20 employees.
HHI<0.975 and HHI>0.975 refer, respectively, to the linear spline for values of HHI below and above the threshold set at
0.975. All regressions include industry and time dummies and a constant, not reported for reasons of space.
32

Tab
le6:
Det
erm
inan
tsof
rela
tion
ship
lendin
g–RELBANK
Dep
.V
ar.
:P
r(R
EL
BA
NK
)P
rob
itL
inea
rP
rob
ab
ilit
yM
od
el
12
34
56
78
910
Marketst
ructurevariables
HHI
-0.0
51
0.0
26
-0.1
08*
-0.1
69**
0.0
05
-0.0
34
0.0
35
-0.0
92*
-0.1
43**
0.0
20
[0.0
48]
[0.0
44]
[0.0
59]
[0.0
73]
[0.0
57]
[0.0
41]
[0.0
39]
[0.0
53]
[0.0
71]
[0.0
50]
HHI2
0.0
24**
0.0
15*
0.0
04
0.0
35***
0.0
16
0.0
17***
0.0
10*
-0.0
02
0.0
28***
0.0
10
[0.0
10]
[0.0
09]
[0.0
13]
[0.0
11]
[0.0
11]
[0.0
07]
[0.0
06]
[0.0
10]
[0.0
08]
[0.0
08]
F−
DISTANCE
0.0
03
-0.0
41
0.0
03
-0.0
41
[0.0
16]
[0.0
27]
[0.0
15]
[0.0
27]
HHI×
F−
DISTANCE
0.0
40**
0.0
40**
[0.0
20]
[0.0
19]
LARGE
BANKS
0.0
03***
-0.0
02
0.0
03***
-0.0
02
[0.0
01]
[0.0
02]
[0.0
01]
[0.0
02]
HHI×
LARGE
BANKS
0.0
03***
0.0
03**
[0.0
01]
[0.0
01]
MUTUAL
BANKS
0.0
04***
0.0
04***
0.0
04***
0.0
04***
[0.0
01]
[0.0
01]
[0.0
01]
[0.0
01]
HHI×
MUTUAL
BANKS
-0.0
04**
-0.0
04**
[0.0
02]
[0.0
02]
Controlvariables
SIZE
21−50
-0.0
79***
-0.0
79***
-0.0
80***
-0.0
78***
-0.0
79***
-0.0
85***
-0.0
86***
-0.0
86***
-0.0
84***
-0.0
85***
[0.0
19]
[0.0
19]
[0.0
19]
[0.0
19]
[0.0
19]
[0.0
19]
[0.0
19]
[0.0
19]
[0.0
19]
[0.0
19]
SIZE
51−250
-0.3
03***
-0.3
00***
-0.3
05***
-0.3
00***
-0.3
05***
-0.3
10***
-0.3
10***
-0.3
11***
-0.3
08***
-0.3
10***
[0.0
24]
[0.0
24]
[0.0
24]
[0.0
24]
[0.0
23]
[0.0
21]
[0.0
21]
[0.0
22]
[0.0
22]
[0.0
21]
SIZE
251−500
-0.4
89***
-0.4
84***
-0.4
88***
-0.4
84***
-0.4
88***
-0.4
66***
-0.4
65***
-0.4
66***
-0.4
63***
-0.4
65***
[0.0
43]
[0.0
45]
[0.0
43]
[0.0
44]
[0.0
43]
[0.0
36]
[0.0
37]
[0.0
36]
[0.0
36]
[0.0
36]
AGE
-0.0
93
-0.0
79
-0.0
97
-0.0
81
-0.0
92
-0.0
97
-0.0
81
-0.1
01
-0.0
84
-0.0
97
[0.0
78]
[0.0
76]
[0.0
78]
[0.0
78]
[0.0
78]
[0.0
79]
[0.0
77]
[0.0
79]
[0.0
78]
[0.0
79]
AGE
20.0
16
0.0
13
0.0
17
0.0
14
0.0
16
0.0
17
0.0
13
0.0
17
0.0
14
0.0
17
[0.0
13]
[0.0
13]
[0.0
13]
[0.0
13]
[0.0
13]
[0.0
13]
[0.0
13]
[0.0
13]
[0.0
13]
[0.0
13]
RISK
-0.8
02**
-0.8
58***
-0.7
90**
-0.8
32***
-0.7
92**
-0.7
88**
-0.8
43**
-0.7
80**
-0.8
23**
-0.7
78**
[0.3
14]
[0.3
15]
[0.3
14]
[0.3
15]
[0.3
14]
[0.3
25]
[0.3
28]
[0.3
26]
[0.3
28]
[0.3
27]
R&D
(0,1
)-0
.088***
-0.0
85***
-0.0
89***
-0.0
86***
-0.0
88***
-0.0
98***
-0.0
96***
-0.0
98***
-0.0
97***
-0.0
98***
[0.0
17]
[0.0
17]
[0.0
18]
[0.0
17]
[0.0
18]
[0.0
18]
[0.0
18]
[0.0
18]
[0.0
18]
[0.0
18]
ISO
9000
(0,1
)-0
.062***
-0.0
65***
-0.0
63***
-0.0
65***
-0.0
62***
-0.0
68***
-0.0
73***
-0.0
69***
-0.0
72***
-0.0
67***
[0.0
15]
[0.0
14]
[0.0
15]
[0.0
15]
[0.0
15]
[0.0
16]
[0.0
16]
[0.0
16]
[0.0
15]
[0.0
16]
OFFSHORE
(0,1
)-0
.124***
-0.1
15***
-0.1
25***
-0.1
19***
-0.1
23***
-0.1
26***
-0.1
21***
-0.1
27***
-0.1
24***
-0.1
25***
[0.0
35]
[0.0
34]
[0.0
35]
[0.0
35]
[0.0
35]
[0.0
32]
[0.0
32]
[0.0
32]
[0.0
32]
[0.0
32]
EXPORT
(0,1
)-0
.075***
-0.0
71***
-0.0
74***
-0.0
72***
-0.0
76***
-0.0
81***
-0.0
78***
-0.0
79***
-0.0
78***
-0.0
81***
[0.0
17]
[0.0
17]
[0.0
17]
[0.0
17]
[0.0
17]
[0.0
17]
[0.0
17]
[0.0
17]
[0.0
17]
[0.0
17]
VALUE
ADDED
-0.0
85*
0.0
02
-0.0
87
-0.0
18
-0.0
80*
-0.0
88**
-0.0
00
-0.0
92
-0.0
21
-0.0
82*
[0.0
43]
[0.0
56]
[0.0
57]
[0.0
42]
[0.0
45]
[0.0
44]
[0.0
55]
[0.0
57]
[0.0
43]
[0.0
46]
Ob
serv
ati
on
s4121
4121
4121
4121
4121
4121
4121
4121
4121
4121
R2
0.1
49
0.1
55
0.1
50
0.1
54
0.1
50
33

Notes to Table 6: The table reports average partial effects in columns (1-5) and regression coefficients in columns (6-
10) The associated standard errors, in brackets, are clustered at provincial level. * significant at 10%; ** significant at 5%;
*** significant at 1%. The model is estimated by probit, using the Stata 10 SE package with PROBIT command, in columns
(1-5) and by OLS, using the Stata 10 SE package with REG command, in columns (6-10). The average partial effects
reported in columns (1-4) are computed at sample means using the MARGEFF command, while the marginal effects of
the interaction terms (columns 2-4) are computed by the INTEFF command (Norton et al., 2004). The dependent variable
(RELBANK) is a dummy equal to one if the firm obtains at least one fifth of banking credit from its main bank and has
credit lines with no more than five banks. The variable SIZE is split into four categories, with the reference category being
11–20 employees. All regressions include industry and time dummies and a constant, not reported for reasons of space.
34

Table 7: Alternative market structure variables
Dep. Var.: FINSHARE Fractional Logit Linear Model
1 2 3 4 5 6
Market structure variables
HHI -0.035 -0.109** -0.141** -0.009 -0.027** -0.035**[0.065] [0.052] [0.063] [0.016] [0.013] [0.015]
HHI2 0.018** -0.012 0.002 0.005** -0.003 0.000[0.009] [0.016] [0.015] [0.002] [0.004] [0.004]
MMC -0.087 -0.021[0.155] [0.037]
F −DISTANCE SC -0.240** -0.058**[0.094] [0.022]
HHI × F −DISTANCE SC 0.143** 0.035**[0.056] [0.014]
MEDIUM BANKS -0.002 -0.001[0.002] [0.000]
HHI × MEDIUM BANKS 0.002* 0.001*[0.001] [0.000]
Control variables
SIZE21−50 -0.135*** -0.135*** -0.134*** -0.033*** -0.033*** -0.033***[0.032] [0.032] [0.031] [0.008] [0.008] [0.008]
SIZE51−250 -0.336*** -0.338*** -0.335*** -0.081*** -0.081*** -0.080***[0.032] [0.032] [0.032] [0.008] [0.008] [0.008]
SIZE251−500 -0.476*** -0.474*** -0.475*** -0.112*** -0.111*** -0.111***[0.086] [0.086] [0.087] [0.019] [0.019] [0.019]
AGE -0.130 -0.132 -0.128 -0.031 -0.032 -0.031[0.116] [0.117] [0.116] [0.028] [0.028] [0.028]
AGE2 0.025 0.025 0.024 0.006 0.006 0.006[0.018] [0.018] [0.018] [0.004] [0.004] [0.004]
RISK -1.227** -1.234** -1.212** -0.291** -0.292** -0.287**[0.493] [0.499] [0.495] [0.115] [0.117] [0.116]
R&D (0,1) -0.064** -0.063** -0.064** -0.015** -0.015** -0.015**[0.028] [0.029] [0.029] [0.007] [0.007] [0.007]
ISO9000 (0,1) -0.047* -0.046* -0.046* -0.011* -0.011* -0.011*[0.024] [0.024] [0.024] [0.006] [0.006] [0.006]
OFFSHORE (0,1) -0.110* -0.112* -0.110* -0.025* -0.026* -0.025*[0.058] [0.059] [0.059] [0.013] [0.013] [0.013]
EXPORT (0,1) -0.085** -0.084** -0.086** -0.021** -0.020** -0.021**[0.033] [0.033] [0.033] [0.008] [0.008] [0.008]
V ALUE ADDED -0.254*** -0.372*** -0.236*** -0.061*** -0.089*** -0.056***[0.067] [0.103] [0.064] [0.016] [0.025] [0.016]
Observations 4121 4121 4121 4121 4121 4121R2 . . 0.052 0.055 0.054
Notes to Table 7: The table reports regression coefficients and, in brackets, the associated standard errors, clustered at
provincial level. * significant at 10%; ** significant at 5%; *** significant at 1%. The model is estimated by fractional
logit, using the Stata 10 SE package with GLM command, in columns (1-4) and by OLS, using the Stata 10 SE package
with REG command, in columns (5-8). The dependent variable is the share of bank credit supplied to the firm by its main
bank (FINSHARE). The variable SIZE is split into four categories, with the reference category being 11–20 employees.
All regressions include industry and time dummies and a constant, not reported for reasons of space.
35

Tab
le8:
Pan
zar-
Ros
seH
stat
isti
cas
am
easu
reof
com
pet
itio
n
Dep
.V
ar.
:FINSHARE
Fra
ctio
nal
logit
Lin
ear
mod
el
12
34
56
78
Marketst
ructurevariables
H−
STATM
C0.1
06***
-0.0
79
-0.1
14*
0.0
89
0.0
25***
-0.0
19
-0.0
28*
0.0
21
[0.0
36]
[0.1
08]
[0.0
67]
[0.0
67]
[0.0
09]
[0.0
26]
[0.0
16]
[0.0
16]
H−
STATM
0.1
04***
-0.1
13
-0.0
98*
0.1
28**
0.0
25***
-0.0
27
-0.0
24*
0.0
31**
[0.0
31]
[0.1
02]
[0.0
57]
[0.0
64]
[0.0
07]
[0.0
24]
[0.0
14]
[0.0
15]
F−
DISTANCE
-0.0
44*
-0.0
11
[0.0
27]
[0.0
06]
H−
STATM
C×
F−
DISTANCE
0.0
66*
0.0
16*
[0.0
39]
[0.0
10]
H−
STATM
×F
−DISTANCE
0.0
77**
0.0
19**
[0.0
33]
[0.0
08]
LARGE
BANKS
-0.0
04***
-0.0
01***
[0.0
01]
[0.0
00]
H−
STATM
C×
LARGE
BANKS
0.0
07***
0.0
02***
[0.0
02]
[0.0
00]
H−
STATM
×LARGE
BANKS
0.0
06***
0.0
02***
[0.0
02]
[0.0
00]
MUTUAL
BANKS
0.0
00
0.0
00
[0.0
04]
[0.0
01]
H−
STATM
C×
MUTUAL
BANKS
0.0
02
0.0
00
[0.0
04]
[0.0
01]
H−
STATM
×M
UTUAL
BANKS
-0.0
02
-0.0
01
[0.0
05]
[0.0
01]
Controlvariables
SIZE
21−50
-0.1
37***
-0.1
36***
-0.1
36***
-0.1
36***
-0.0
33***
-0.0
33***
-0.0
33***
-0.0
33***
[0.0
32]
[0.0
32]
[0.0
32]
[0.0
31]
[0.0
08]
[0.0
08]
[0.0
08]
[0.0
08]
SIZE
51−250
-0.3
39***
-0.3
40***
-0.3
36***
-0.3
39***
-0.0
81***
-0.0
81***
-0.0
80***
-0.0
81***
[0.0
32]
[0.0
32]
[0.0
32]
[0.0
31]
[0.0
08]
[0.0
08]
[0.0
08]
[0.0
08]
SIZE
251−500
-0.4
82***
-0.4
81***
-0.4
77***
-0.4
81***
-0.1
13***
-0.1
13***
-0.1
12***
-0.1
13***
[0.0
87]
[0.0
87]
[0.0
87]
[0.0
87]
[0.0
19]
[0.0
19]
[0.0
19]
[0.0
19]
AGE
-0.1
20
-0.1
30
-0.1
25
-0.1
19
-0.0
29
-0.0
31
-0.0
30
-0.0
29
[0.1
16]
[0.1
16]
[0.1
16]
[0.1
18]
[0.0
28]
[0.0
28]
[0.0
28]
[0.0
29]
AGE
20.0
23
0.0
25
0.0
24
0.0
23
0.0
06
0.0
06
0.0
06
0.0
06
[0.0
18]
[0.0
18]
[0.0
18]
[0.0
19]
[0.0
04]
[0.0
04]
[0.0
04]
[0.0
05]
RISK
-1.2
47**
-1.2
64***
-1.2
84***
-1.2
40**
-0.2
96**
-0.2
99***
-0.3
04***
-0.2
94**
[0.4
88]
[0.4
83]
[0.4
77]
[0.4
88]
[0.1
14]
[0.1
13]
[0.1
11]
[0.1
14]
R&D
(0,1
)-0
.066**
-0.0
65**
-0.0
65**
-0.0
66**
-0.0
16**
-0.0
16**
-0.0
16**
-0.0
16**
[0.0
28]
[0.0
29]
[0.0
28]
[0.0
28]
[0.0
07]
[0.0
07]
[0.0
07]
[0.0
07]
ISO
9000
(0,1
)-0
.046*
-0.0
47**
-0.0
51**
-0.0
45*
-0.0
11*
-0.0
11**
-0.0
12**
-0.0
11*
[0.0
24]
[0.0
23]
[0.0
23]
[0.0
24]
[0.0
06]
[0.0
06]
[0.0
06]
[0.0
06]
OFFSHORE
(0,1
)-0
.110*
-0.1
09*
-0.1
08*
-0.1
08*
-0.0
25*
-0.0
25*
-0.0
25*
-0.0
25*
[0.0
59]
[0.0
59]
[0.0
59]
[0.0
59]
[0.0
14]
[0.0
14]
[0.0
14]
[0.0
14]
EXPORT
(0,1
)-0
.082**
-0.0
83**
-0.0
80**
-0.0
82**
-0.0
20**
-0.0
20**
-0.0
19**
-0.0
20**
[0.0
34]
[0.0
34]
[0.0
34]
[0.0
34]
[0.0
08]
[0.0
08]
[0.0
08]
[0.0
08]
VALUE
ADDED
-0.2
57***
-0.2
41***
-0.2
89***
-0.2
63***
-0.0
62***
-0.0
58***
-0.0
70***
-0.0
63***
[0.0
60]
[0.0
82]
[0.0
62]
[0.0
61]
[0.0
15]
[0.0
20]
[0.0
15]
[0.0
15]
Ob
serv
ati
on
s4121
4121
4121
4121
4121
4121
4121
4121
R2
..
..
0.0
55
0.0
56
0.0
57
0.0
55
36

Notes to Table 8: The table reports regression coefficients and, in brackets, the associated standard errors, clustered
at provincial level. * significant at 10%; ** significant at 5%; *** significant at 1%. The model is estimated by fractional
logit, using the Stata 10 SE package with GLM command, in columns (1-4) and by OLS, using the Stata 10 SE package
with REG command, in columns (5-8). The dependent variable is the share of bank credit supplied to the firm by its main
bank (FINSHARE). The variable SIZE is split into four categories, with the reference category being 11–20 employees.
H −STAT is divided into three categories: monopoly (M), monopolistic competition (MC) and perfect competition (PC),
with the latter taken as reference category. All regressions include industry and time dummies and a constant, not reported
for reasons of space.
37
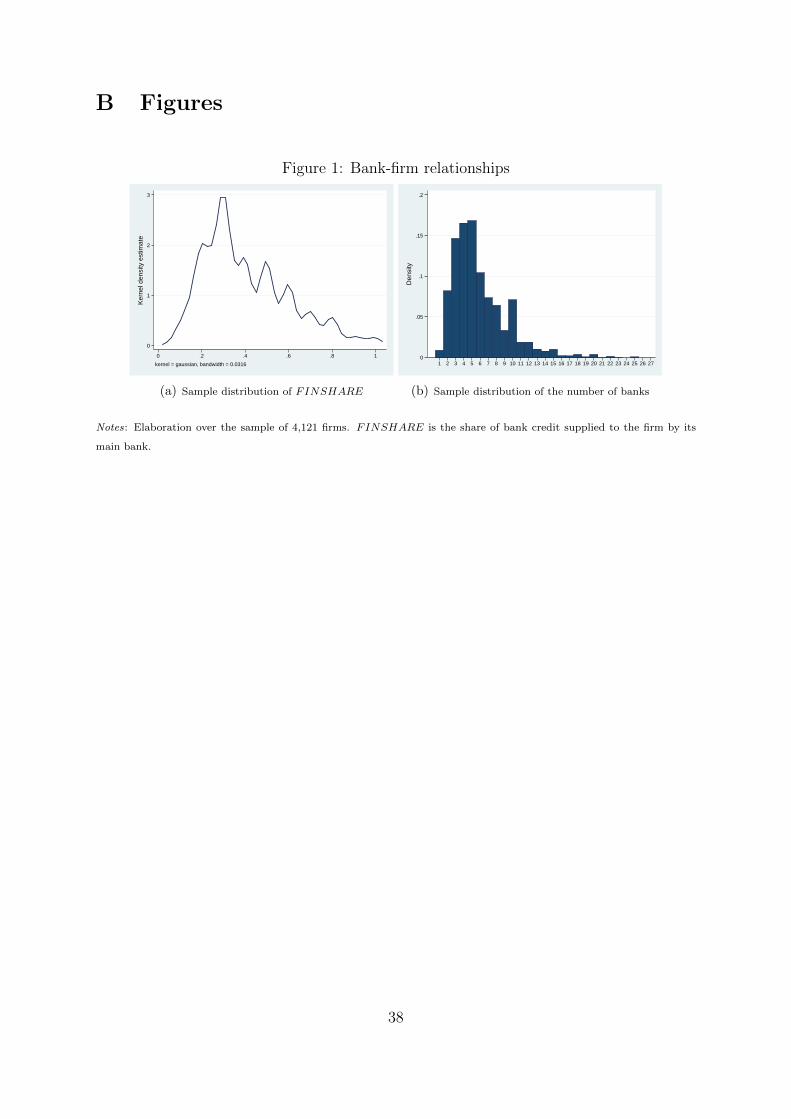
B Figures
Figure 1: Bank-firm relationships
0
1
2
3
Ker
nel d
ensi
ty e
stim
ate
0 .2 .4 .6 .8 1
kernel = gaussian, bandwidth = 0.0316
(a) Sample distribution of FINSHARE
0
.05
.1
.15
.2
Den
sity
1 2 3 4 5 6 7 8 9 10 11 12 13 14 15 16 17 18 19 20 21 22 23 24 25 26 27
(b) Sample distribution of the number of banks
Notes: Elaboration over the sample of 4,121 firms. FINSHARE is the share of bank credit supplied to the firm by its
main bank.
38

Figure 2: Market concentration and relationship lending
.405
.41
.415
.42
FIN
SH
AR
E
.5 1 1.5 2 2.5 3HHI
Calculations based on the estimates of Table 4 (column 1). All the control variables are taken at their sample mean. The
red vertical lines plot the 5◦ percentile, the median and the 95◦ percentile of the provincial distribution of HHI over the
sample period 1998-2003.
39

Figure 3: Market organisational structure, concentration and relationship lending
.39
.395
.4
.405
.41
FIN
SH
AR
E
.5 1 1.5 2 2.5 3HHI
(a) I quartile of F −DISTANCE
.39
.4
.41
.42
.43
.44
FIN
SH
AR
E
.5 1 1.5 2 2.5 3HHI
(b) III quartile of F −DISTANCE
.39
.395
.4
.405
.41
.415
FIN
SH
AR
E
.5 1 1.5 2 2.5 3HHI
(c) I quartile of LARGE BANKS
.405
.41
.415
.42
.425F
INS
HA
RE
.5 1 1.5 2 2.5 3HHI
(d) III quartile of LARGE BANKS
.405
.41
.415
.42
.425
FIN
SH
AR
E
.5 1 1.5 2 2.5 3HHI
(e) I quartile of MUTUAL BANKS
.395
.4
.405
.41
.415
FIN
SH
AR
E
.5 1 1.5 2 2.5 3HHI
(f) III quartile of MUTUAL BANKS
Notes: Calculations based on the estimates in Table 4 (columns 3 to 5). In the left (right) hand-side diagrams the market
structure variables are taken at the first (third) quartile of their provincial distribution over the sample period 1998-2003,
while the other variables are taken at their sample mean. The red vertical lines plot the 5◦ percentile, the median and the
95◦ percentile of the provincial distribution of HHI over the sample period 1998-2003.
40

Figure 4: Fractional polynomial models with two power terms
−1
−.5
0
.5
1
1.5
FIN
SH
AR
E
.3 .8 1.3 1.8 2.3 2.8 3.3 3.8HHI
(a) Fractional logit
0
.2
.4
.6
.8
1
FIN
SH
AR
E
.3 .8 1.3 1.8 2.3 2.8 3.3 3.8HHI
(b) Linear model
Notes: Calculations based on the estimates in Table 5 (columns 2 to 4). Diagrams show the fit and the 95% confidence
interval, adjusted for covariates, resulting from a fractional polynomial model of degree two, estimated by a fractional logit
(panel (a)) and a linear model (panel(b)).
41