Influential factors analysis towards mangrove cover and ... · Influential factors analysis towards...
13
AACL Bioflux, 2018, Volume 11, Issue 3. http://www.bioflux.com.ro/aacl 810 Influential factors analysis towards mangrove cover and production of demersal fish in Maumere Bay, Indonesia 1,3 Angelinus Vincentius, 2 M. Natsir Nessa, 2 Jamaluddin Jompa, 2 Amran Saru, 2 Nurjannah Nurdin, 2 Chair Rani 1 Postgraduate School of Fisheries, Hasanuddin University, Makassar, Indonesia; 2 Marine Science and Fisheries Faculty, Hasanuddin University, Makassar, Indonesia; 3 Marine Science and Fisheries Faculty, Nusa Nipa University, Maumere, Flores 86111, East Nusa Tenggara, Indonesia. Corresponding author: A. Vincentius, [email protected] Abstract. The existence of mangrove ecosystems has been closely associated with the level of fishery production. This is primarily attributed to the role of mangrove as spawning grounds, feeding grounds and nursery grounds for fishery. The changing conditions of mangrove ecosystem in a given area is expected to impact the extent and quantity of fishery production in that area. The objective of this research study is to determine the influential factors towards the change of mangrove cover as well as the production of demersal fish in Maumere Bay of Sikka Regency of East Nusa Tenggara Province, Indonesia, which makes it necessary to undertake the analysis using appropriate methods. Some methods used in this process are spatial analysis, statistical regression and analytical hierarchy process. The results of spatial analysis of the Landsat 5, Landsat ETM 7 and Landsat 8 to the mangrove ecosystems within the Maumere Bay of Sikka Regency, East Nusa Tenggara Province of Indonesia over a 25-year period (year 1991-2016) signify the fluctuating changes, including the area of mangrove cover (hectare) and the classes of density of mangrove cover (low class, middle class, high class). Meanwhile, the analysis of statistical regression conducted on the area of mangrove cover and the classes of density of mangrove cover against the total production of demersal fish found a significant correlation. In addition, the data analyzed using Analytical Hierarchy Process suggests that the factors which have the strongest influence on the decline of mangrove cover and demersal fish production in Maumere Bay are the tsunami and the tectonic earthquake which occurred on December 12 th 1992. On the other hand, there is another key determinant of increasing mangrove cover and demersal fish production in the Maumere Bay: natural environmental factor (without any pressure from human activities). Key Words: changing of mangrove cover, demersal fish production, spatial analysis for mangrove cover, Maumere Bay, Indonesia. Introduction. The mangrove ecosystem is one of the coastal ecosystems beside coral reefs and seagrass. Ecologically, mangrove forest maintains the stability or balance of ecosystems and nutrient sources. Mangrove ecosystems are increasingly recognized as providing many ecosystem services (Lugendo et al 2007; Nagelkerken 2009; Vo et al 2012) in particular with respect to fisheries production (Aburto-Oropeza et al 2008; Carrasquilla-Henao et al 2013; Saenger et al 2013). Mangroves have a function as spawning grounds, feeding grounds and nursery grounds for many species. It also is important for both commercial and subsistence fisheries, including finfish, shellfish and crustacean (Hutchison et al 2014). Mangrove ecosystem area can also be utilized as an area of fish and prawn culture, fishing, and other ecosystem services (Saru 2013). Nowadays, climate change was an environmental issue. Mangrove forest is one of aquatic ecosystem that could contribute to climate change mitigation in particular for a carbon sink (Murray & Vegh 2012; Camp et al 2016; Alongi 2015) and adaptation, e.g. protection from sea level rise and storm damage (Spalding et al 2014). Although there were several studies of fisheries benefits of mangrove forests (Kathiresan 2012; Lebata et al 2012), there were limited studies related to ecosystem
Transcript of Influential factors analysis towards mangrove cover and ... · Influential factors analysis towards...

AACL Bioflux, 2018, Volume 11, Issue 3. http://www.bioflux.com.ro/aacl 810
Influential factors analysis towards mangrove cover and production of demersal fish in Maumere Bay, Indonesia 1,3Angelinus Vincentius, 2M. Natsir Nessa, 2Jamaluddin Jompa, 2Amran Saru, 2Nurjannah Nurdin, 2Chair Rani
1 Postgraduate School of Fisheries, Hasanuddin University, Makassar, Indonesia; 2 Marine Science and Fisheries Faculty, Hasanuddin University, Makassar, Indonesia;
3 Marine Science and Fisheries Faculty, Nusa Nipa University, Maumere, Flores 86111, East Nusa Tenggara, Indonesia. Corresponding author: A. Vincentius,
Abstract. The existence of mangrove ecosystems has been closely associated with the level of fishery production. This is primarily attributed to the role of mangrove as spawning grounds, feeding grounds and nursery grounds for fishery. The changing conditions of mangrove ecosystem in a given area is expected to impact the extent and quantity of fishery production in that area. The objective of this research study is to determine the influential factors towards the change of mangrove cover as well as the production of demersal fish in Maumere Bay of Sikka Regency of East Nusa Tenggara Province, Indonesia, which makes it necessary to undertake the analysis using appropriate methods. Some methods used in this process are spatial analysis, statistical regression and analytical hierarchy process. The results of spatial analysis of the Landsat 5, Landsat ETM 7 and Landsat 8 to the mangrove ecosystems within the Maumere Bay of Sikka Regency, East Nusa Tenggara Province of Indonesia over a 25-year period (year 1991-2016) signify the fluctuating changes, including the area of mangrove cover (hectare) and the classes of density of mangrove cover (low class, middle class, high class). Meanwhile, the analysis of statistical regression conducted on the area of mangrove cover and the classes of density of mangrove cover against the total production of demersal fish found a significant correlation. In addition, the data analyzed using Analytical Hierarchy Process suggests that the factors which have the strongest influence on the decline of mangrove cover and demersal fish production in Maumere Bay are the tsunami and the tectonic earthquake which occurred on December 12th 1992. On the other hand, there is another key determinant of increasing mangrove cover and demersal fish production in the Maumere Bay: natural environmental factor (without any pressure from human activities). Key Words: changing of mangrove cover, demersal fish production, spatial analysis for mangrove cover, Maumere Bay, Indonesia.
Introduction. The mangrove ecosystem is one of the coastal ecosystems beside coral reefs and seagrass. Ecologically, mangrove forest maintains the stability or balance of ecosystems and nutrient sources. Mangrove ecosystems are increasingly recognized as providing many ecosystem services (Lugendo et al 2007; Nagelkerken 2009; Vo et al 2012) in particular with respect to fisheries production (Aburto-Oropeza et al 2008; Carrasquilla-Henao et al 2013; Saenger et al 2013). Mangroves have a function as spawning grounds, feeding grounds and nursery grounds for many species. It also is important for both commercial and subsistence fisheries, including finfish, shellfish and crustacean (Hutchison et al 2014). Mangrove ecosystem area can also be utilized as an area of fish and prawn culture, fishing, and other ecosystem services (Saru 2013).
Nowadays, climate change was an environmental issue. Mangrove forest is one of aquatic ecosystem that could contribute to climate change mitigation in particular for a carbon sink (Murray & Vegh 2012; Camp et al 2016; Alongi 2015) and adaptation, e.g. protection from sea level rise and storm damage (Spalding et al 2014).
Although there were several studies of fisheries benefits of mangrove forests (Kathiresan 2012; Lebata et al 2012), there were limited studies related to ecosystem

AACL Bioflux, 2018, Volume 11, Issue 3. http://www.bioflux.com.ro/aacl 811
services of mangrove contributions to fisheries (Lee et al 2014). There is a lack of information regarding this issue, but on the other hand, Indonesia is the heart of the tropical Indo-Pacific Coral Triangle Biodiversity including the centre of mangrove biodiversity (Fernandes et al 2012; Alongi 2015). In this context, it is important to evaluate and quantify the direct contribution of mangrove forests to fisheries. The changes that occurred in mangrove ecosystems, such as increasing and decreasing mangrove cover, will affect the increasing or decreasing the fisheries production in coastal areas.
The linkage between mangroves existence with fisheries production was previously proven by some researchers. The strong influence of a mangrove ecosystem on fisheries production was demonstrated in North-eastern Australia, especially species associated with mangrove such as banana prawns (Penaeus merguiensis), mud-crab (Scylla serrata), barramundi (Lates calcarifer), as well as some species of estuary (Penaeus esculentus, Penaeus semisulcatus, Portunus pelagicus, Eleutheronema tetradactylum) (Manson et al 2005).
There was also a strong correlation between mangrove forest and artisanal fishery in the southern part of the Gulf of California, Mexico (Carrasquilla-Henao et al 2013). According to the research on the Gulf of California, the migrations of fish have a highly positive correlation with the abundance of local mangroves (Aburto-Oropeza et al 2008). The productivity of fish from mangroves tends to be the highest where mangrove productivity is high (Hutchison et al 2014). Mangroves also became the habitat and the reproduction area of some faunas within Indonesia, such as; Gastropod class, Crustacea, Bivalvia, Hirundine, Polychaeta and Amphibia. In addition, various types of fauna were supporting the life of biodiversity, despite its functions as herbivore that consumed the organic material such as detritus; some of these fauna continue to behave as the first decomposer (Arief 2003).
Based on the aforementioned explanation, it can be concluded that the condition of mangrove ecosystem, such as mangrove cover and mangrove density class, will affect the production of coastal fisheries. In order to ensure a sustainable management of coastal fisheries, the recommended approach is that of sustainable management of mangrove ecosystem. Therefore, the identification and analyzes of the influential factors of the mangrove cover changes as well as the production of demersal fish are expected to provide vital solutions concerning the problems of coastal fisheries management in the Maumere Bay of Sikka Regency, East Nusa Tenggara Province, Indonesia.
The aims of this research are to ascertain the correlation between the spatial data of mangrove cover, and density of mangrove cover, using statistical data of the production of demersal fish, as well as to analyze the influential factors that affect the change of mangrove cover and the production of demersal fish over a period of 25 years from 1991 to 2016 in the Maumere Bay area of Sikka Regency of East Nusa Tenggara Province, Indonesia.
Material and Method Study sites. The research location is in the Maumere Bay of Sikka Regency, East Nusa Tenggara Province of Indonesia. Sikka regency is located in the central part of Flores island in the following positions: at Latitude: 8°44′57″ S and Longitude: 122°11′45″ E. Maumere Town is the capital city of Sikka Regency (Figure 1). Maumere bay has four centre areas of mangrove, i.e. western area of Sikka Regency, Kampung Garam and surrounding areas, eastern area of Sikka Regency, and the small islands of Sikka Regency.
The total area of Sikka Regency is 7,553.24 km²; this consists of mainland covering an area of 1731.91 km2 in additon to a sea area of 5,821.33 km2. Sikka Regency has 17 small islands located on the north coastal area in Maumere Bay and one island on the south coastal area. Additionally, Sikka Regency has a long coastal-line spanning 444.5 kms (Fisheries Agency of Sikka Regency 2017).
Geologically, Sikka Regency is categorized as an unstable area since there are seven active fault lines. Among these fracture lines include two lines that have a direct

AACL Bioflux, 2018, Volume 11, Issue 3. http://www.bioflux.com.ro/aacl 812
connection with the fault lines in East Flores region (Gumilang et al 2013). The movement of soil occurring in Sikka Regency was mainly caused by an earth quake that reached 6.8 on the Richter scale on December 12th 1992 (Wahyono & Purnomo 1994). According to Research and Development Center of Geology in Gumilang et al (2013), Flores island is prone to earth quakes, particularly in areas passed by fractures. The occurrence of earth quake triggered a tsunami tidal wave within the waters. Based on the spread of epicenter and earth quake strength in Sikka Regency, the possible tsunami-affected areas such as the north coast (Maumere Bay) and a small part in the southern coast.
Figure 1. Study sites map.
Data collection procedures Satellite images data. The images for spatial data analysis were obtained using satellite images Landsat 5, Landsat ETM 7 and Landsat 8; these were acquired from the US Geological Survey (USGS) which recorded the condition of the study area. All the images related to 1991, 1996, 2001, 2006, 2011, and 2016 were downloaded in the end of November 2016. Landsat TM data have as many as seven spectral bands, with a spatial resolution of 30 m for bands 1-5 and 7. The Landsat ETM+ data consisted of eight spectral bands with a spatial resolution of 30 m for bands 1-7. Similarly, the Landsat 8 data have nine spectral bands with a spatial resolution of 30 m for bands 1-7 and 9 (Nurdin et al 2015a).
Ground truthing data. Field survey on the mangrove area in Maumere Bay of Sikka Regency was conducted on December 2016, in the four centers of mangrove areas, i.e. western area of Maumere Bay, Kampung Garam and surroundings, eastern area of Maumere Bay, along with the small islands of Sikka Regency.
Fish data collection. Data pertaining to the quantity of fishery production was reported by the Fisheries Agency of Sikka Regency (2017), particularly the production of demersal fish species from 1991 until 2016. The demersal fish species consist of: ponyfish (Leiognathus equulus), goat fish (Upeneus tragula), red snapper (Lutjanus malabaricus),

AACL Bioflux, 2018, Volume 11, Issue 3. http://www.bioflux.com.ro/aacl 813
groupers (Epinephelus sp.), giant seaperch (Lates calcarifer), silver pomfret (Pampus argenteus), grunters (Pomadasys maculatus), streaked spinefoot (Siganus sp.). Data analysis
Spatial analysis. Analysis of spatial data was undertaken using ArcGIS software version 10.3. The parameters that were analyzed included the coverage of mangrove and density of mangrove cover, which provided the information related to the mangrove’s condition for the last 25 years (1991 to 2016).
The density observation of mangrove cover utilized the 2015 Landsat 7 satellite and Landsat 8 OLI/TIRS. The composite channel (band) employed for this purpose was RGB 4-5-3 for Landsat 7 and RGB 5-6-4 for Landsat 8 in false color, interpretation and supervised classification of the vegetation object of mangrove in addition to classifying those mangroves into 3 classes: low, middle, high. The results of this interpretation and classification are mangrove density maps.
Regression statistical analysis. A statistical analysis of normality (using Minitab 14 software) was undertaken to ensure normal distribution of research data. Then, the linear regression analysis (using Excel 11 software) was performed that exploited two variables, x (independent variable) and y (dependent variable), where x denotes the total of mangrove cover (hectare); low class of mangrove cover (hectare); middle class of mangrove cover (hectare); high class of mangrove cover (hectare), and y signifies the production of demersal fish (tons).
Linear regression formula (Weisberg 2005): y = ß0 + ß 1 x (1)
where: ß0 represents intercept, ß1 denotes coefficient of regression, x refers to independent variable, and y denotes dependent variable.
Analysis of influential factors. Analysis of influential factors affecting the mangrove cover changes as well as the production of demersal fish was done using Analytical Hierarchy Process (AHP). In this case, the stages included are (Saaty 2008): i. determining the problem and the desired solution; ii. creating a hierarchical structure that begins with the ultimate goal; iii. creating a pairwise comparison matrix that describes the relative contribution or the
influence of each element on the above objectives or criteria; iv. finding paired comparisons so that then x [(n – 1)/2] is obtained, where n denotes the
number of elements that are compared; v. calculating the Eigen value or λmax and test its consistency; vi. repeating steps iii, iv, and v for the entire hierarchy level; vii. calculating the Eigen vector of each pairwise comparison matrix; viii. ascertaining the consistency of the hierarchy.
The pairwise comparison technique used in AHP is premised on the judgment or opinion of the respondents. These respondents were chosen purposively (purposive sampling) and included experts who had an insightful understanding of the problems concerning the Maumere Bay coastal area. These included six groups of respondents consisting of government elements, NGOs, private entrepreneurs, women, fishermen, and teachers/lecturers. In order to combine individual opinion matrices, a composite opinion matrix is constructed. With a view to obtain a combined weighted value or a combined priority vector, a geometric average was used (Microsoft Excel 2000 software).
Results and Discussion The changing of mangrove cover at Maumere Bay since 1991 to 2016. As mentioned above, mangrove spreading in the Maumere Bay of Sikka Regency consists of four centre areas, i.e. western area of Sikka Regency, Kampung Garam and surrounding areas, eastern area of Sikka Regency, and the small islands of Sikka Regency. The results of spatial analysis conducted on Landsat imagery, in which provided insightful information on mangrove cover in terms of the extent and density in the Sikka Regency of East Nusa Tenggara Province, are illustrated in Tables 1 and 2.

AACL Bioflux, 2018, Volume 11, Issue 3. http://www.bioflux.com.ro/aacl 814
Table 1 Mangrove cover change in Maumere Bay since 1991 until 2016
Year Western of Sikka (hectare)
Kampung Garam
(hectare)
Eastern of Sikka
(hectare)
The small islands of Sikka (hectare)
Total mangrove cover (hectare)
1991 31.10 21.42 213.18 254.24 519.94 1996 20.53 46.42 185.33 208.98 461.26 2001 55.14 57.90 139.84 151.57 404.45 2006 51.06 74.80 107.07 118.24 351.17 2011 70.75 80.92 136.42 178.69 466.78 2016 88.85 95.65 168.70 211.12 564.32
Table 2 Mangrove cover and density of mangrove cover since 1991 until 2016 in Maumere Bay
Year Mangrove cover (hectare) Low class (hectare) Middle class
(hectare) High class (hectare)
1991 519.94 43.83 114.23 361.88 1996 461.26 85.48 174.43 201.35 2001 404.45 78.72 170.61 155.13 2006 351.16 78.75 142.92 129.49 2011 466.78 98.01 165.02 203.76 2016 564.32 134.67 208.65 221.01
Figure 2 illustrates the changes in mangrove cover during a 25-year period depicted using bar graphs. The condition of mangrove cover in the Maumere Bay of Sikka Regency decreased since 1991 until 2006, before increasing again till the year 2016. The maps of spatial analysis results of change in mangrove cover in the Maumere Bay during this 25-year period are illustrated in Figure 3.
Figure 2. The changing of mangrove cover and density during a 25-year period (1991-2016) in Maumere Bay.

AACL Bioflux, 2018, Volume 11, Issue 3. http://www.bioflux.com.ro/aacl 815
Figure 3. The changing of mangrove cover in Maumere Bay: a) 1991, b) 2006, and c) 2016.

AACL Bioflux, 2018, Volume 11, Issue 3. http://www.bioflux.com.ro/aacl 816
The results of spatial analysis using Landsat 5 satellite images, Landsat ETM 7 and Landsat 8 for the purpose of mangrove analysis yielded high level of accuracy. According to Nurdin et al (2015b), who conducted research on the dynamics of change in mangrove cover on the small island of Spermonde Archipelago, the accuracy of spatial analysis for determining mangrove cover was 93%. Total production of demersal fish in correlation with the changing of mangrove cover. The data pertaining to fishery production in Sikka Regency is shown to be varied on a year-by-year basis. The data of fishery production, especially demersal fish, during the last 25 years with an interval of 5 year period, is depicted in Table 3.
Table 3 Fishery production in Maumere Bay with the interval of 5-years period since 1991 until 2016
Production per year (tons) No. Kind of demersal fish
1991 1996 2001 2006 2011 2016 1 Ponyfish, Leiognathus
equulus (Leiognathidae) 82.44 49.46 32.98 18.00 40.50 30.27
2 Goat fish, Upeneus tragula (Mullidae)
39.90 38.95 38.00 12.16 15.20 83.02
3 Red snapper, Lutjanus malabaricus (Lutjanidae)
149.65 89.79 59.86 78.85 54.78 91.29
4 Groupers, Epinephelus sp. (Serranidae)
143.55 86.13 57.42 87.03 78.30 132.11
5 Giant sea perch, Lates calcarifer (Latidae)
125.91 75.55 50.36 42.33 41.50 91.29
6 Silver pomfret, Pampus argenteus (Strometidae)
53.49 53.25 53.01 13.02 24.70 35.21
7 Grunters, sweetlips, Pomadasys maculatus
(Pomadadsyidae)
71.05 55.99 40.92 11.16 41.85 25.66
8 Streaked spinefoot, Siganus sp. (Siganidae)
24.82 23.89 22.95 6.21 9.23 96.33
Total 690.81 473.00 355.50 268.76 306.06 585.17 Source: Fisheries Agency of Sikka Regency (2017). The result of linear regression analysis which is located in the area of mangrove cover as variable x (independent variable) as well as the total production of demersal fish as variable y (dependent variable) is explained as follows. The result of linear regression analysis of the correlation between variable x (total coverage of mangrove or high class of mangrove cover) and variable y (the production of certain demersal fish) are denoted as the below regression equations (2) and (3):
y = 1.786x – 377.4 (2) where: x represents the total coverage of mangrove (hectare), y denotes the production of demersal fish in Maumere Bay (tons). The value of R² was 0.675 and R was 0.8214.
The correlation between x and y variables according to equation (2) was significant (p = 0.04 at the 95 % confidence level or α = 0.05). The strong correlation showed that approximately 82.14% of the variation in demersal fish production volume can be predicted by the total mangrove cover extent. This was a strong empirical evidence that mangrove extent affected demersal fish production.
y = 1.787x + 67.35 (3) where: x denotes the high class of mangrove cover (hectare), y refers to the production of demersal fish in Maumere Bay (tons). The value of R² was signified by 0.752, and R was signified by 0.8673. The correlation between x and y variables according to equation (3) was significant (p = 0.025 at the 95% confidence level or α = 0.05). The strong correlation showed that approximately 86.73% of the variation in demersal fish production volume can be predicted by the extent of high density mangrove cover. This
AACL Bioflux, 2018, Volume 11, Issue 3. http://www.bioflux.com.ro/aacl 817
was a strong empirical evidence that mangrove extent affected demersal fish production. On the other hand, the middle class of mangrove cover and low class of mangrove cover was not found to have a significant correlation with the production of demersal fish.
Based on the above explanation, it can be seen that variable x, i.e. the total of mangrove cover, and high class of mangrove cover, have a significant correlation with variable y, i.e. the production of demersal fish in Maumere Bay. The key factor to be noted in the context of the management of mangrove ecosystems is that the mangrove ecosystem will grow well if there is reduced pressure in terms of human activities on mangrove ecosystems area. If accorded due consideration, it can be inferred that humans can indeed derive great benefits from the mangrove ecosystems.
Fish catching will be the highest close to areas with high human population density that provide the fishers and the markets for the catch. Equally, some of these mangroves that are situated close to human populations are also likely to be under greater threat than those in sparsely populated areas – they may be degraded, the waters may be polluted, or they may be over-fished, thereby rendering them less productive. Areas where mangroves are secured through appropriate management regimes, and fisheries are well managed are likely to yield the greatest value. Consequently, the conservation and restoration efforts within the areas close to human populations are likely to yield the greatest return on investment (Hutchison et al 2014).
Factors affecting mangrove cover and demersal fish production dynamic. The Analytical Hierarchy Process is a decision support model developed by Saaty (2008). This model will describe complex multi-factor or multi-criteria problems in a hierarchy. Hierarchy is defined as a representation of a complex problem within a multi-level structure where the first level is denoted by the goal, followed by the stakeholders level, criteria, sub criteria and finally, alternatives. The benefit of this model is that a complex problem will appear more structured and systematic.
The search for factors that affect changes in mangrove cover and demersal fish production can be grouped into two parts according to the decreasing tendency in 1991-2006 and increasing tendency in 2006-2016.
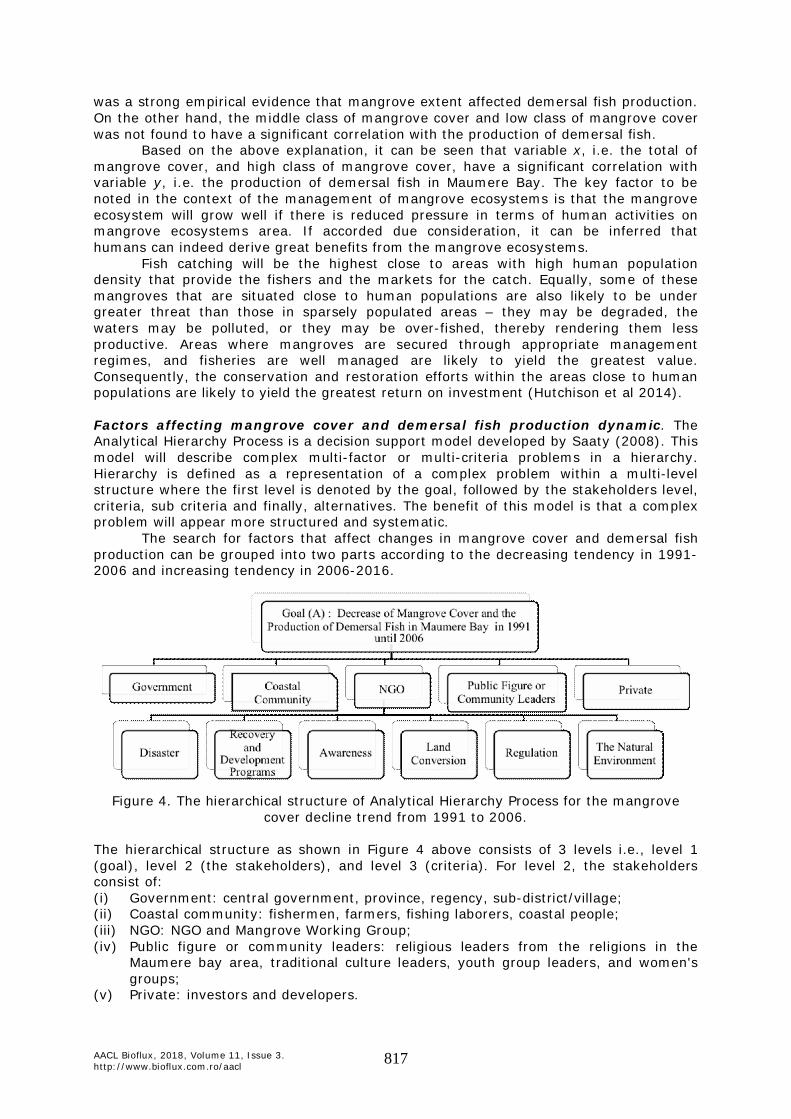
Figure 4. The hierarchical structure of Analytical Hierarchy Process for the mangrove
cover decline trend from 1991 to 2006.
The hierarchical structure as shown in Figure 4 above consists of 3 levels i.e., level 1 (goal), level 2 (the stakeholders), and level 3 (criteria). For level 2, the stakeholders consist of: (i) Government: central government, province, regency, sub-district/village; (ii) Coastal community: fishermen, farmers, fishing laborers, coastal people; (iii) NGO: NGO and Mangrove Working Group; (iv) Public figure or community leaders: religious leaders from the religions in the
Maumere bay area, traditional culture leaders, youth group leaders, and women's groups;
(v) Private: investors and developers.

AACL Bioflux, 2018, Volume 11, Issue 3. http://www.bioflux.com.ro/aacl 818
For level 3, the criteria consist of: (a) Disaster: the tsunami and tectonic earthquake on December 12th 1992, the decrease
of coastal area owing to the shift of the coastal line to the land; (b) Recovery and development programs: environmental recovery programs and capacity
building for fishermen, such as COREMAP I, II and CTI, programs to increase the number of fishing gear and fishing vessels, programs from NGOs and self-empowered programs as well as other communities programs;
(c) Awareness: public awareness, conscious awareness to utilize natural resources in order to meet human needs in the future and for sustainability purposes;
(d) Land conversion: the activity for changing the status of mangrove land into other designations, such as ponds, settlements, and others;
(e) Regulation: all provisions of legislation either from the center or the regency to the villages;
(f) The natural environment: the natural state of the environment with factors that naturally affect the purpose.
Based on the aforementioned analysis, the most influential factors on decreased mangrove cover and in effect, decreased production of demersal fish, are depicted in Table 4.
Table 4
The influential factors which affect the decrease of mangrove cover and the production of demersal fish in Maumere Bay in 1991 until 2006
Group of respondents Factors
1 2 3 4 5 6 Geo
mean P R
Disaster 0.3704 0.4019 0.3687 0.3705 0.3690 0.4082 0.3811 0.381 1 Recovery and development
programs
0.1575 0.2377 0.0962 0.0427 0.2476 0.2359 0.1442 0.144 3
Awareness 0.0637 0.0340 0.1481 0.0643 0.0456 0.0342 0.0564 0.056 6 Land
conversion 0.1057 0.0985 0.0714 0.1496 0.0984 0.0993 0.1014 0.101 4
Regulation 0.0366 0.0625 0.0406 0.1002 0.0656 0.0624 0.0580 0.058 5 The natural environment
0.2661 0.165 0.2749 0.2727 0.1738 0.1602 0.2124 0.212 2
P = priority; R = ranking. Table 4 showed three most affected factors to the decreasing of mangrove cover, namely disaster (priority P = 0.381, ranking R = 1), the natural environment (P = 0.212, R = 2), and recovery and development programs (P = 0.144, R = 3). The tectonic earthquake disasters followed by the tsunami on December 12th 1992 were the most influential factors that caused a declining mangrove cover and the production of demersal fish.
The tectonic earthquake disasters with 6.8 RS magnitude was occurred at Maumere Bay followed by the tsunami on December 12th 1992. This was an undersea earthquake in 36 km depth and the tsunami has swiped the main land with the distance of 300 meter. This disaster was categorized as a national disaster (Rachmat 2016) and caused 2100 death (Sengaji & Nababan 2009). This disaster caused a huge damage of coastal area with mangrove as the main ecosystem (Gumilang et al 2013). Tectonics earthquake disaster and tsunami at 1992 at Maumere Bay caused a coastal area destruction including the destruction of mangrove area and decreasing mangrove cover at Maumere Bay. Gumilang et al (2013) found that the mangrove area at Maumere Bay decreased significantly due to tsunami based on Satellite Images Lansat.
The second ranking of factor affected in decreasing mangrove cover was the natural environment factor (P = 0.212). This finding indicated that mangrove habitat condition at Maumere Bay decreased significantly due to subsidence of earthquake with width area of destruction accounting for 20 m to the mainland (Gumilang et al 2013). The third ranking of factor affected in decreasing mangrove cover was recovery and

AACL Bioflux, 2018, Volume 11, Issue 3. http://www.bioflux.com.ro/aacl 819
development programs (P = 0.144). This finding indicated that there was not a recovery and development program been implemented in the region.
The stakeholder of coastal communities are found to have the greatest influence (P = 0.289), namely the lack of roles of fishermen, farmers, fishermen laborers, and coastal populations towards the maintenance of mangrove cover levels and the production of demersal fish. In addition, the efforts undertaken by the government (P = 0.212), NGOs (P = 0.158), public figures (P = 0.149) and private parties (P = 0.075) have not provided concrete results for the recovery and improvement of mangrove cover and increased demersal fish production. Thus, the decrease of mangrove cover and production of demersal fish in the Maumere Bay continued during 1991 until 2006. This finding inline by Godoy & De Lacerda (2015) who found that the mangrove habitat may suffer heavy impacts from global climate change, maximized by local human activities occurring in a given coastal region.
The hierarchical structure, as shown in Figure 5, consists of 3 levels i.e., level 1 (goal), level 2 (the stakeholders), and level 3 (criteria). For level 2, the stakeholders consist of government, coastal community, NGO, public figure or community leaders, and private entities. For level 3, it consists of recovery and development programs, awareness, land conversion, regulation and the natural environment.
Figure 5. The hierarchical structure of Analytical Hierarchy Process for the mangrove
cover increases trend from year 2006 to 2016.
Table 5 shows that there were three main factors which affected the increase of mangrove cover and demersal fish production at Maumere Bay during 2006 to 2016, namely the natural environment (P = 0.355, R = 1), recovery and development programs (P = 0.234, R = 2), and land conversion (P = 0.157, R = 3). The natural environmental factors are the most dominant factor for increasing mangrove cover, intended as a natural environmental influence in this case, without any pressure from human activities it could allow mangroves to grow naturally.
Table 5 The influential factors towards the increase of mangrove cover and demersal fish
production in Maumere Bay in 2006 until 2016
Group of respondents Factors 1 2 3 4 5 6
Geo mean P R
Recovery and development
programs
0.2476 0.4284 0.1460 0.0605 0.4092 0.4284 0.2340 0.234 2
Awareness 0.0922 0.0481 0.2313 0.0954 0.0616 0.0481 0.0814 0.081 5 Land
conversion 0.1642 0.1542 0.1073 0.2349 0.1498 0.1542 0.1566 0.157 3
Regulation 0.0525 0.0921 0.0570 0.1552 0.0974 0.0921 0.0853 0.085 4 The natural environment
0.4434 0.2772 0.4584 0.4539 0.2819 0.2772 0.3549 0.355 1
P = priority; R = ranking.

AACL Bioflux, 2018, Volume 11, Issue 3. http://www.bioflux.com.ro/aacl 820
The second ranking of factor affected in increasing mangrove cover was the recovery and development programs factor. This finding indicated that the environmental recovery and development programs, such as Coral Reef Rehabilitation and Management Program/COREMAP Phase I funded by AusAID, COREMAP Phase II funded by World Bank, COREMAP-CTI, capacity building programs for the coastal people included the fishermen, and self-empowered programs by NGO, have been able to successfully increase mangrove cover in Maumere Bay. The other factor that affected in increasing mangrove cover was a significance contribution of coastal community in rehabilitating mangrove area, for example one of their community member (Viktor Emmanuel Rayon with the nickename Baba Akong) has done a rehabilitation in mangrove area for 40 Ha. With this effort he won a national award for saving environment from Indonesian President, award which is called Kalpataru award at year 2009.
The third ranking of factor affected in increasing mangrove cover was the process of land conversion. Our record showed that there was not a land conversion of mangrove for 10 years period, consequently there was a significantly increasing in mangrove cover and demersal fish was observed during the last 10 years in Maumere Bay.
This finding is supported by the previous study of Godoy & De Lacerda (2015) who found that in a variety of habitats mangroves are expanding as a response to global climate change and also supported by Alongi (2015) who mentioned that mangrove forests along arid coasts, in subsiding river deltas, and on many islands are predicted to decline in area, structural complexity, and/or in functionality, but mangroves will continue to expand pole wards. It is highly likely that they will survive into the foreseeable future as sea level, global temperatures, and atmospheric CO2 concentrations continue to rise.
The stakeholders of the coastal communities provide the greatest influence (P = 0.289). In this case, the existence of fishermen, farmers, fishing laborers, and coastal population exerted the greatest impact towards the increase of mangrove cover and production of demersal fish. In addition, concerted efforts by the government (P = 0.212), NGOs (P = 0.158), public figures (P = 0.149) and private parties (P = 0.075) have provided tangible results towards the recovery and improvement of mangrove cover, and increased demersal fish production in the Maumere Bay region during 2006 until 2016.
Conclusions. The mangrove ecosystem plays a very crucial role in contributing to the production of demersal fish. Total mangrove cover and high class of mangrove cover make a significant contribution to the total production of demersal fish, while the middle class and the low class of mangrove cover do not seem to affect the production of demersal fish. The change in total mangrove cover and high class of mangrove cover also contribute significantly to the change of production of demersal fish.
During the 15 year period (since 1991 until 2006) the decrease of mangrove cover and the production of demersal fish were influenced by the most dominant factors, namely: tectonic earthquake disaster and tsunami on December 12th 1992, followed by natural environment factors, and the absence or ineffectiveness of recovery programs implemented in the region.
Between 2006 and 2016, the increased of mangrove cover and demeral fish production was influenced by the most dominant factors, namely: natural environmental factors, i.e. natural environmental influences (without any pressure from human activities), and the increased coastal ecosystem recovery programs, especially mangroves and associated ecosystems, in addition to reduced land conversion factors.
Acknowledgements. We would like to express our appreciation and gratitude to the Research and Development Center for Coastal Geospatial Planning, Hasanuddin University for providing the facility of spatial analysis laboratory, Nusa Nipa Foundation of Maumere for funding this research. We also thank to Nita Rukminasari who was helping us with manuscript editing and to technicians and local communities for their wonderful help during the field works.

AACL Bioflux, 2018, Volume 11, Issue 3. http://www.bioflux.com.ro/aacl 821
References Aburto-Oropeza O., Ezcurra E., Danemann G., Valdez V., Murray J., Sala E., 2008
Mangroves in the Gulf of California increase fishery yields. Proceedings of the National Academy of Sciences of the USA 105(30):10456-10459.
Alongi D. M., 2015 The impact of climate change on mangrove forests. Current Climate Change Reports 1:30-39.
Arief A., 2003 [Mangrove forest: functions and benefits]. Kanisius, Yogyakarta, 47 pp. [in Indonesian]
Camp E. F., Suggett D. J., Gendron G., Jompa J., Manfrino C., Smith D. J., 2016 Mangrove and seagrass beds provide different biogeochemical services for coral threatened by climate change. Frontiers in Marine Science 3, article 52, 16 pp.
Carrasquilla-Henao M., Gonzales Ocampo H. A., Gonzales A. L., Quiroz G. R., 2013 Mangrove forest and artisanal fishery in the southern part of the Gulf of California, Mexico. Ocean and Coastal Management 83:75-80.
Fernandes L., Green A., Tanzer J., White A., Alino P. M., Jompa J., Lokani P., Soemodinoto A., Knight M., Pomeroy B., Possingham H., Pressey B., 2012 Biophysical principles for designing resilient networks of marine protected areas to integrate fisheries, biodiversity and climate change objectives in the Coral Triangle. Report prepared by The Nature Conservancy for the Coral Triangle Support Partnership, 152 pp.
Fisheries Agency of Sikka Regency, 2017 [Report on fishery production of Sikka Regency, year 1991 to 2016]. Maumere, 242 pp. [in Indonesian]
Godoy M. D. P., De Lacerda L. D., 2015 Mangroves response to climate change: a review of recent findings on mangrove extension and distribution. Anais da Academia Brasileira de Ciências 87(2):651-667.
Gumilang R. S., Rahadian A., Budi E. P., Kuswantoro, 2013 [The role of mangrove ecosystem as a coastal disaster protector in the coastal area of Maumere Bay of Sikka Regency]. Wetlands International – Indonesia Programme, Bogor, 49 pp. [in Indonesian]
Hutchison J., Spalding M., Ermgassen P., 2014 The role of mangroves in fisheries enhancement. University of Cambridge, The Nature Conservancy, and Wetlands International, 54 pp.
Kathiresan K., 2012 Importance of mangrove ecosystem. International Journal of Marine Science 2(10):70-89.
Lebata M. J. H., Walton M. E., Binas J. B., Primavera J. H., Le Vay L., 2012 Identifying mangrove areas for fisheries enhancement; population assessment in a patchy habitat. Aquatic Conservation: Marine and Freshwater Ecosystems 22(5):652-664.
Lee S. Y., Primavera J. H., Dahdouh-Guebas F., McKee K., Bosire J. O., Cannicci S., Diele K., Fromard F., Koedam N., Marchand C., Mendelssohn I., Mukherjee N., Record S., 2014 Ecological role and services of tropical mangrove ecosystems: a reassessment. Global Ecology and Biogeography 23:726-743.
Lugendo B. R., Nagelkerken I., Kruitwagen G., van der Velde G., Mgaya Y. D., 2007 Relative importance of mangroves as feeding habitats for fishes: a comparison between mangrove habitats with different settings. Bulletin of Marine Science 80:497-512.
Manson F. J., Loneragan N. R., Harch B. D., Skilleter G. A., Williams L., 2005 A broad-scale analysis of links between coastal fisheries production and mangrove extent: a case-study for northeastern Australia. Fisheries Research 74:69-85.
Murray B. C., Vegh T., 2012 Incorporating blue carbon as a mitigation action under the United Nations Framework Convention on climate change: technical issues to address. Report NI R 12-05, Durham, NC: Nicholas Institute for Environmental Policy Solutions, Duke University, 20 pp.
Nagelkerken I., 2009 Evaluation of nursery function of mangrove and seagrass beds for tropical decapods and reef fishes: patterns and underlying mechanisms. In: Ecological connectivity among tropical coastal ecosystems. Nagelkerken I. (ed), Springer Science and Business Media, Dordrecht, pp. 357-399.

AACL Bioflux, 2018, Volume 11, Issue 3. http://www.bioflux.com.ro/aacl 822
Nurdin N., Komatsu T., Agus, Akbar A. S. M., Djalil A. R., Amri K., 2015a Multi sensor and multi temporal data from Landsat images to detect damage to coral reefs, small islands in the Spermonde archipelago, Indonesia. Ocean Science Journal 50(2):317-325.
Nurdin N., Akbar A. S. M., Patittingi F., 2015b Dynamic of mangrove cover change with anthropogenic factors on small island, Spermonde Archipelago. Proceedings of the SPIE, Volume 9638, id. 96380T, 11 pp.
Rachmat H., 2016 [Monitoring Flores Earthquake at 1992]. GEOMAGZ, Popular Geology Magazine 6(3), 1 pp. [in Indonesian]
Saaty T. L., 2008 Decision making with the analytic hierarchy process. International Journal of Services Science 1(1):83-98.
Saenger P., Gartside D., Funge-Smith S., 2013 A review of mangrove and seagrass ecosystems and their linkage to fisheries and fisheries management. Food and Agriculture Organization of the United Nations, Regional Office for Asia and the Pacific, RAP publication 2013/09, 74 pp.
Saru A., 2013 [Revealing the green gold potential in coastal areas]. Masagena Press, Makassar, 76 pp. [in Indonesian]
Sengaji E., Nababan B., 2009 Tsunami risk level mapping in Sikka County, East Nusa Tenggara. E-Jurnal Ilmu dan Teknologi Kelautan Tropis 1(1):46-81. [in Indonesian]
Spalding M., Mclvor A., Tonneijck F., Tol S., van Eijk P., 2014 Mangroves for coastal defence. Guidelines for coastal managers and policy makers. Published by Wetlands International and The Nature Conservancy, 42 pp.
Vo Q. T., Kuenzer C., Vo Q. M., Moder F., Oppelt N., 2012 Review of valuation methods for mangrove ecosystem services. Ecological Indicators 23:431-446.
Wahyono, Purnomo H., 1994 [Investigation of the environmental geology of Sikka Regency and surrounding area, East Nusa Tenggara Province]. Department of Mining and Energy, Bandung, 35 pp. [in Indonesian]
Weisberg S., 2005 Apllied linear regression. Third edition, John Wiley & Sons, Inc., 352 pp.
Received: 01 May 2018. Accepted: 30 May 2018. Published online: 18 June 2018. Authors: Angelinus Vincentius, Marine Science and Fisheries Faculty, Nusa Nipa University, Maumere, Flores 86111, East Nusa Tenggara, Indonesia; Postgraduate School of Fisheries, Hasanuddin University, Makassar, Indonesia, e-mail: [email protected] M. Natsir Nessa, Marine Science and Fisheries Faculty, Hasanuddin University, Jl. Perintis Kemeredekaan KM. 10, Makassar, South Sulawesi – 90245, Indonesiae, e-mail: [email protected] Jamaluddin Jompa, Marine Science and Fisheries Faculty, Hasanuddin University, Jl. Perintis Kemeredekaan KM. 10, Makassar, South Sulawesi – 90245, Indonesiae, e-mail: [email protected] Amran Saru, Marine Science and Fisheries Faculty, Hasanuddin University, Jl. Perintis Kemeredekaan KM. 10, Makassar, South Sulawesi – 90245, Indonesiae, e-mail: [email protected] Nurjannah Nurdin, Marine Science and Fisheries Faculty, Hasanuddin University, Jl. Perintis Kemeredekaan KM. 10, Makassar, South Sulawesi – 90245, Indonesiae, e-mail: [email protected] Chair Rani, Marine Science and Fisheries Faculty, Hasanuddin University, Jl. Perintis Kemeredekaan KM. 10, Makassar, South Sulawesi – 90245, Indonesiae, e-mail: [email protected] This is an open-access article distributed under the terms of the Creative Commons Attribution License, which permits unrestricted use, distribution and reproduction in any medium, provided the original author and source are credited. How to cite this article: Vincentius A., Nessa M. N., Jompa J., Saru A., Nurdin N., Rani C., 2018 Influential factors analysis towards mangrove cover and production of demersal fish in Maumere Bay, Indonesia. AACL Bioflux 11(3):810-822.