Influence of different surfaces on impact, shock - Scriptiebank
38
KU LEUVEN GROEP BIOMEDISCHE WETENSCHAPPEN FACULTEIT BEWEGINGS- EN REVALIDATIEWETENSCHAPPEN Influence of different surfaces on impact, shock absorption and leg stiffness in female elite runners and untrained individuals door Jeroen Aeles masterproef aangeboden tot het behalen van de graad van Master of Science in de lichamelijke opvoeding en de bewegingswetenschappen o.l.v. prof. dr. B. Vanwanseele, promotor m.m.v. m.sc. ir. W. Hoogkamer LEUVEN, 2013
Transcript of Influence of different surfaces on impact, shock - Scriptiebank
KU LEUVEN
GROEP BIOMEDISCHE WETENSCHAPPEN
FACULTEIT BEWEGINGS- EN REVALIDATIEWETENSCHAPPEN
Influence of different surfaces on impact, shock absorption and leg stiffness
in female elite runners and untrained individuals
door Jeroen Aeles
masterproef aangeboden tot het behalen van de graad van Master of Science in de lichamelijke opvoeding en de bewegingswetenschappen
o.l.v. prof. dr. B. Vanwanseele, promotor
m.m.v. m.sc. ir. W. Hoogkamer
LEUVEN, 2013
Opgesteld volgens de richtlijnen van Journal of Biomechanics

iv
Woord vooraf
Allereerst zou ik mijn oprechte dank willen uiten aan mijn promotor, Prof. Benedicte Vanwanseele.
Zonder haar kennis, inzicht en steun zou dit werk niet zijn wat het nu is. Ik dank haar voor het
opbrengen van het vele geduld en voor alle tijd en moeite die zij in mijn begeleiding heeft gestoken.
In dezelfde lijn wens ik Wouter Hoogkamer te bedanken om ook zijn steentje bij te dragen aan dit
onderzoek.
Bij het afnemen van de vele testen had ik assistentie van drie uiterst bedreven collega-studenten. Ik
ben hen meer dan dankbaar voor het werk dat zij verricht hebben. Bedankt Laurens Audoore,
Vincent De Bie en Jonathan Moeyersons.
Voor het nalezen van deze masterproef op grammaticale en spellingfouten kon ik rekenen op de hulp
van mijn zus Ria Aeles. Haar expertise bracht hulp waar mijn kennis van de Engelse taal te kort
schoot. Bedankt hiervoor.
Het hier voorgestelde onderzoek zou niet kunnen doorgegaan zijn zonder de vrijwillige deelname van
alle proefpersonen. Ik wil dan ook alle dames bedanken voor hun bereidwillige medewerking.
Verder kan ik niet anders dan mijn beide ouders, mijn broers en mijn vrienden bedanken voor alle
steun die ik heb ontvangen bij het ontwikkelen en het uitwerken van dit hele project. Het was een
lange en zware opgave en zonder de vele bemoedigingen had ik dit wellicht niet tot een succesvol
einde kunnen brengen. Bedankt aan iedereen die mij heeft gesteund en in mij geloofd heeft.
Ten slotte bedank ik de KU Leuven en de faculteit Bewegings- en Revalidatiewetenschappen voor het
financieel ondersteunen van dit onderzoek en het ter beschikking stellen van de nodige
infrastructuur.
Wezemaal, 20 mei 2013 J.A.

v
Situering Ieder die al eens langs de universitaire sportinfrastructuur te Leuven wandelt, kan niet anders dan
er de vele recreatieve en professionele lopers opmerken. Niet alleen wordt er veelvuldig gebruik
gemaakt van de klassieke atletiekpiste. Ook de recenter aangelegde Finse piste en grasvelden
worden belopen. Ondanks het feit dat lopen altijd populair is geweest, heeft de sport de laatste jaren
een enorme boost gekend. Zij het om de fitheid te verbeteren, gewicht te verliezen of puur als
ontspanning en verlichting van de mentale geest, meer en meer mensen trekken regelmatig de
loopschoenen aan. Niettegenstaande de vele lichamelijke en psychologische voordelen die deze
vorm van beweging kan teweegbrengen, gaat lopen gepaard met vele verschillende vormen van
blessures. Onder deze letsels is het vooral de groep van musculoskeletale aandoeningen die de kroon
spant (Lopes et al., 2012). Door de toenemende prevalentie van aan lopen gerelateerde blessures is
er ook een stijging in het wetenschappelijk onderzoek dat tracht de oorzaken hiervan te achterhalen
en aldus de incidentie te verminderen.
Dit onderzoek werd uitgevoerd in het nieuwe Movement and Posture Analysis Laboratory Leuven
(MALL) binnen de Human Movement Biomechanics Research Group. Het hoofddoel van deze
onderzoeksgroep is gericht op het onderzoeken van de invloed van mechanische factoren op de
aanpassingen van het menselijk lichaam. Deze mechanische factoren kunnen in dit onderzoek
gereduceerd worden tot de krachten waarmee het lichaam te maken krijgt tijdens de veelvuldige
schokken bij het lopen. Bij elke stap die een loper zet, kan er een kracht gelijk aan 2 tot 5 keer het
lichaamsgewicht op de voet inwerken (Neely et al., 1998). Het lichaam kan deze enorme kracht
echter relatief goed verwerken door gebruik te maken van verscheidene mechanismes. Eerder
onderzoek werd al verricht naar het aanpassen van de stijfheid van het been bij het wandelen en
lopen. Hierbij gaat het eerder over kinematische veranderingen waarbij we vooral denken aan het
werk van het knie- en enkelgewricht. Dit is echter al een tweede wapen van het lichaam om de
uitgesproken kracht te minimaliseren. Een eerste verdedigingslinie zit hem eerder in de structuur en
materiaaleigenschappen van de verschillende weefsels, in het lichaam aanwezig. Hierbij denken we
dan vooral aan de botstructuren, spieren en pezen, en materialen die de gewrichten vormen. Bij elke
schok die het lichaam opvangt, gaat er als het ware een golf doorheen het lichaam vertrekkende bij
de plaats van grond contact, hier de voet. Door de eerder besproken biologische structuren kan een
groot percentage van deze schokgolf onderschept worden. Dit hele gebeuren kan men definiëren als
de schok absorptie van het lichaam.

vi
Om meer te weten te komen hoe het lichaam zich wapent tegen deze krachten zijn we een groep van
vrouwelijke elite atletes gaan vergelijken met een groep ongetrainde vrouwelijke individuen. Men
kan verwachten dat door langdurige training het lichaam zich aanpast aan de externe factoren
waarmee het te maken krijgt tijdens deze oplopende belastingen. We nemen aan dat deze
aanpassingen zich niet alleen op het vlak van looptechniek maar ook op lichamelijk niveau zullen
doortrekken. De uiteindelijke relevantie van dit werk bestaat erin om meer inzicht te krijgen in het
opvangen van de impactkrachten door het lichaam op verschillende populaire loopondergronden.
Door deze nieuwe kennis kan er doelgerichter gewerkt worden op gebied van blessurepreventie en –
behandeling. Dit kan gezien worden in een breed kader van enerzijds de productie van schoeisel tot
begeleiding van topatleten anderzijds.
Referenties
Lopes, A. D. Yeung, S. S. Costa, L. O. Junior, L. C., 2012. What are the main running-related
musculoskeletal injuries? Sports Medicine 42, 891 - 905.
Neely, F. G., 1998. Biomechanical risk factors for exercise-related lower limb injuries. Sports
Medicine 26, 395 - 413.

Influence of different surfaces on impact, shock absorption and leg stiffness
in female elite runners and untrained individuals

- 2 -
Abstract
It is presently unclear whether elite athletes use different biomechanical strategies to adept to
differences in surface stiffness than non-trained individuals. Most research about shock absorbing
characteristics has been done in a laboratory but not yet in a more realistic outdoor situation. Our
goal was to investigate if impact forces, leg stiffness and shock absorption were different between
two groups with a different training background. Twelve female elite runners and 11 non-trained
female participants performed a running test on a woodchip track, concrete street, tartan track,
treadmill and an overground running test. Acceleration data was acquired from an accelerometer
placed on the shank and one on the forehead. Ground reaction forces during indoor tests were
measured using force platforms and 3D motion capture analyses were done. Results showed that
vertical and total accelerations of the ankle were higher on all three tracks compared to the
treadmill. These accelerations were higher for the elite group in comparison with the control group
on the tartan track and treadmill. Analysis revealed that elite runners had lower shock absorption on
the treadmill compared to the control group. Leg stiffness was higher for the elite group than for the
control group. These results establish insight in the effect of training on adaptations of the human
body to mechanical factors such as surface stiffness.
Key words
Biomechanics • Running • Elite • Impact • Shock absorption • Leg stiffness
1. Introduction
Running has always been a popular sport worldwide and the many benefits that come with it are
repeatedly demonstrated by researchers: reduction of coronary and metabolic diseases, decreased
risk of anxiety, depression and some forms of cancer and increasing muscular strength and
endurance (Kesaniemi et al., 2001). Unfortunately the repetitive stress on the body during running
also causes lower-extremity and whole-body injuries (Scott et al., 1990; van Gent et al., 2007).
Although these injuries are generally associated with impact force, loading rate and surface stiffness,
little is known about the mechanisms the human body uses to adjust to these factors. Braunstein et
al. (2010) did not find any differences on running mechanics when wearing different footwear but
did conclude that shod running leads to more mechanical stress. Because this is most likely due to

- 3 -
changes in shock absorption, we can expect the same results when it is not the footwear but the
surface that varies in stiffness.
Human runners seem to adjust the stiffness of their stance leg when running on surfaces with
different stiffness. This theory is supported by the findings of Farley et al. (1998) who showed that
leg stiffness was twice as high while running on the most soft surface compared to running on a less
compliant surface. They also found that peak ground reaction force on a less stiff surface decreased
with as much as 17% compared to a stiffer surface. Furthermore they found significant reductions in
muscle activity for surfaces with a lesser stiffness. Dixon et al. (2000) found that some runners
undergo kinematic adjustments to maintain similar peak impact forces while running on different
surfaces. Farley et al. (1998) showed that these kinematic changes primarily occur in the knee, by
changing the magnitude of the knee angle at foot-ground contact. Ferris et al. (1999) used a
computer simulation of a spring-mass model to determine the differences in movement outcome of
the spring-mass on different types of surfaces. This outcome showed that the running pattern would
be disturbed if no action was undertaken against the transitions in surface stiffness. These findings
could not be applied to human runners, since the centre of mass of runners does not change when
they encounter an expected transition in surface stiffness that they have encountered before (Ferris
et al., 1998). Therefore they concluded that the human body is capable of making rapid adjustments
to counter these changes in terrain characteristics. Bobbert et al. (1992), however, suggested that
the changes in net moment about the knee joint are too fast to be controlled by neuromuscular
activities. They concluded that this phenomenon is likely to be induced by a stretch and stretch-
release mechanism of the muscles accountable for the flexion and extension of the knee. Kim et al.
(2010) concluded that not the running mechanics but rather the running environment is directly
related to leg stiffness. Lieberman et al. (2010) did not find a difference in peak impact forces
between barefoot and shod runners with rear-foot landing. Shock absorption significantly increased
on stiff surfaces compared to more compliant surfaces in female runners (Dufek et al., 2009).
Previous studies have always tested indoor on a treadmill where different surfaces were simulated.
In this experiment we tested shock absorption outdoor on different surfaces to have a more reliable
result that can be transferred to realistic situations.
Previous studies mainly focussed on the running mechanics of elite runners (Dixon et al., 2000;
Bobbert et al., 1992) or generally healthy subjects (Farley et al., 1998; Ferris et al., 1998; Ferris et al.,
1999). Little research has investigated the differences between well-trained runners and a control
group in shock absorption adjustments on different surfaces. Rabita et al. (2008) investigated the
influence of training background on plantarflexor and overall stiffness. Their results showed that elite

- 4 -
long and triple jumpers have higher musculotendinous stiffness, higher passive musculoarticular
stiffness and higher overall musculoskeletal stiffness combined with a higher musculoskeletal
compliance. To explain the seemingly contradictory findings of overall musculoskeletal stiffness and
compliance they suggested that neuromuscular strategies must be used by elites to increase
compliance in order to enhance the elastic recoil and increase stiffness for a better transmission of
force to the ground. These strategies might well be used by elites in adjusting their stiffness on
different surfaces.
In this study we investigated if the human body reacts differently on surfaces that had various
stiffness levels. Accordingly our first aim was to check for within-subject differences in impact and
shock absorption on different surfaces. We hypothesized that the body of a person who was well-
trained and used to running on different surfaces would use better strategies to adapt to these
various cushioning characteristics. Therefore the second interest of this research was to see if there
is a difference in impact and shock absorption between well-trained runners and controls and if this
is the same for all surfaces. The third purpose of this paper was to investigate whether leg stiffness is
different between these two groups.
2. Methods & Materials
Participants
Twenty-four female runners were recruited for this study. All participants had to be between 18
and 50 years and injury-free for at least three months. Participants were included based on different
inclusion criteria in order to form two groups. The elite group consisted of female runners who had
been participating in running training for at least 2 years and ran more than 15 km week -1. The
control group consisted of female participants who ran less than 5 km week -1 and were not
practising any other sports for more than 1 hour week -1. Body length and leg length were measured
using a tape measure. For knee and ankle widths a calliper was used. Age, body length, insole use
and km week -1(elite) were self-reported.
This study was approved by the ethics committee of University Hospital of Leuven and all participants
filled in a written informed consent prior to the start of the tests.

- 5 -
Instrumentation Accelerometers
To obtain information about the acceleration patterns during running two 3-dimensional
accelerometers with a range of 16g (X16-2, Gulf Coast Data Concepts, LLC) were used, sampling at
400 Hz. Every time an accelerometer was turned on and off again, a new data file was created on the
memory stick to enable identification of the different tests. One accelerometer was placed on the
left leg approximately 4 cm above the lateral malleolus and in line with the tibia. The second
accelerometer was firmly attached to a headband which was placed on the participant’s forehead,
about 1 cm above the eyebrows.
Laboratory analysis materials
For indoor laboratory measurements a Vicon motion capturing system was used (MX series, Vicon,
Oxford, UK). Ten infrared cameras, operating at 200 Hz, collected 3D data from reflective markers
placed on specific anatomical landmarks. Ground-reaction forces (GRF) were measured using an
AMTI-force plate sampling at 1000 Hz for overground running. A split-belt treadmill (ForceLink) with
built-in force plates (1000 Hz) was used for indoor running.
Procedures
Participants were tested on 2 different days performing running tasks on various surfaces. On the
first day all testing was done outdoors with participants running on 3 different surfaces. Within two
weeks participants returned to the laboratory (Movement & Posture Analysis Laboratory Leuven)
and performed an overground and a treadmill running test.
Outdoor testing
Three different outdoor tracks with different surface compliance were tested. On each track 3 trials
were performed in which participants ran a certain distance at their self-selected natural running
pace. Runners were instructed to run in a relaxed manner as they would normally do and to look
straight ahead during the running trials. This was to minimize the disturbance in head acceleration-
data due to intentional head movement. Accelerometers were attached as described previously prior
to the first test and were removed once all tests were completed. Accelerometers were turned on
when participants were ready and switched off directly after they ran the pre-described distance. An

- 6 -
approximation of the running speed of each participant was made by measuring the time over a 9
meter distance on all tracks. After a 5 minutes warm-up on the running track, participants performed
the 3 running trials on a woodchip track, followed by 3 trials on a concrete street and ended with 3
trials on a tartan running track. During all trials, participants ran over a distance of 70 meters. All
tracks roughly had a 0° incline degree. Since testing took place from November until February and
the properties of the woodchip track are somewhat influenced by the weather, tests were often
delayed due to snow or frost to make sure compliance of the track was not altered due to these
effects.
Indoor testing
On a second test day, two running tests took place, consisting of running on a treadmill and
overground running. Before the start of the tests, anthropometric measurements were taken and 25
markers and 4 clusters (containing 3 markers each) were strapped to the participants for 3D motion
analysis. Accelerometers were attached to the participants as described previously. A static trial was
recorded with participants standing with both feet on a force plate and their arms hanging loosely
next to them while looking straight ahead. After the static trial, medial markers were removed from
the medial side of the knees and ankles so that they would not bother the participants while running.
Marker placement
Markers were placed on both upper and lower body. Nine markers were placed on the trunk and
pelvis: 1 marker on each acromion, 1 on C7, T10, processus xiphoideus, suprasternal notch of the
sternum, sacrum and the left and right ASIS. For lower extremities 16 markers were placed on both
medial and lateral epicondyle of the femur, fibular lateral malleolus, medial malleolus of the tibia,
posterior tuberositas calcanei, medial and lateral processus calcaneus and the distal second
metatarsal. Furthermore 4 cluster markers were placed lateral in the middle of the femur and on the
proximal 1/3th of the tibia.
Treadmill
To warm-up and familiarize with the split-belt treadmill, participants first performed a 5 minute
warm-up. Most participants chose to run on just one of two belts. At the end of the warm-up
treadmill speed was increased to testing speed to make sure participants were comfortable with this.
After the warm-up participants were explained the testing protocol which consisted of a short

- 7 -
running test at approximately the same speed they ran their outdoor tests. For both groups the
speed was slightly lower because nearly all participants were unfamiliar with running on a split-belt
treadmill. Accelerometers were switched on and treadmill-speed was increased to the right amount.
Participants were instructed to run as naturally as possible. Five separate trials of 5 seconds each
were recorded for analysis. The first trial was only taken after participants had been running for 1
minute. After 5 correct trials were taken, the treadmill was stopped and accelerometers were turned
off. Due to technical defects we only have treadmill data of 10 participants from the control group
and 11 from the elite group.
Overground
After the treadmill-test, participants performed five correct overground running trials. Participants
ran over a distance of 10 meters from one side of the room to the other. A built-in force plate was
positioned in the middle of the laboratory. Participants were not aware of the force plate to avoid
targeting. Two investigators adjusted the individual starting location in order to have them land with
the left foot on the force plate. In total 5 good trials were needed. Trials were deleted if the whole
foot was not on the force plate (e.g. if the toe or heel was just off the force plate). Participants would
run in one direction with the accelerometers turned on, stand still while the accelerometers were
turned off and immediately switched on again before running back to the other side. Trial numbers
were written down in order to link 3D motion analysis data with the accelerometer data.
Data Analysis Accelerometer-data
Accelerometer data were processed using Matlab R2011b (The MathWorks, Inc.). Both the vertical
acceleration (in line with the tibia) (aankle,vert and ahead,vert)and the total acceleration (atotal)were used
for the ankle accelerometer. Total acceleration was calculated using the following formula:

- 8 -
Shock absorption was calculated for each trial and again averaged for all trials on the same surface.
The following formula was used:
The first 10 and the last 5 meters of the acceleration data were not used for analyses to avoid
changes in acceleration due to participants accelerating to get to their normal pace or decelerating at
the end of the track. Thus for the outdoor trials the last 5 steps (left leg only) were removed and 10
steps from that point were taken for analysis. Acceleration peaks were not counted if only 1 of 10
was lower than 60% of the average because this was most likely due to technical errors. If 2 or more
peaks were lower they were counted among the total peaks because the chance that it would be due
to technical errors was considerably lower. Afterwards peaks of the vertical and total acceleration of
these 10 steps were calculated for the tibia. For head acceleration the peaks of vertical acceleration
were used. This was done for all 3 trials per surface and these results were again averaged to
calculate the total average acceleration of 30 steps for all three surfaces. Standard deviations
between peaks were analysed separately for each trial and are further addressed as peak variation.
Data from accelerations on the treadmill was analysed in a similar manner, taking the middle 40% of
the data. This was about 30 to 40 steps (again left leg only) for each participant.
3D motion capture data
Movement analysis from our laboratory-data was done using Vicon Nexus 1.7.1 (Vicon, Oxford, UK).
To calculate leg stiffness, 5 overground trials per participant were used. Leg stiffness (kleg) was
calculated by dividing the peak vertical force (Fz) by the change in leg length (∆L).
Two different approaches were used to estimate the change in leg length. For calculating the leg
stiffness, distance between the hip and the centre of pressure (COP) is the most appropriate
estimate for leg length. The hip location was estimated based on the pelvis markers (Bell et al. 1990;
Leardini et al. 1999). Due to technical defects of the force plates we only had COP data for 5
participants from each group. Therefore, we alternatively calculated the leg stiffness based on the
change of the distance between the hip and the ankle marker. Comparison between the stiffness

- 9 -
based on this model and stiffness based on COP for participants from which all data was complete
gave a correlation with R² = 0.45.
In addition we calculated the vertical stiffness (Farley et al. 1996). Here, we determined the
displacement by integrating the force signal during the stance phase twice. Then, vertical stiffness
was calculated by dividing the vertical force by the vertical drop.
- 10 -
3. Results
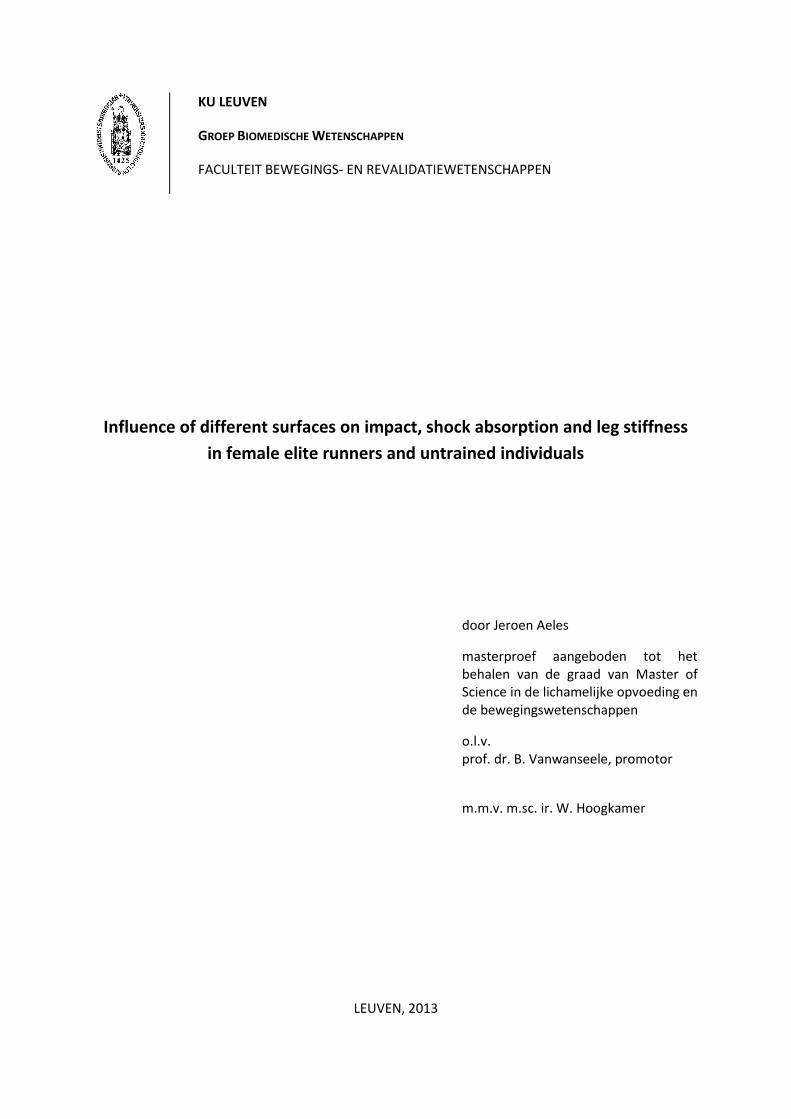
After analysis, 1 subject from the control group was excluded due to incomplete data. Subject
information can be found in table 1.
Parameter Elite Control
N 12 11
Age (y) 24.3 ± 6.3 22.7 ± 4.1
Body length (cm) 170.9 ± 5.3 165.3 ± 7.8
BW (kg) 58.1 ± 5.3 57.3 ± 6.8
Subjects with sole support 5 1
Km week -1 (km) 48.3 ± 30.6 / Table 1: Subject information: Age, body length, body weight and km week
-1 are means + SD.
Peak acceleration
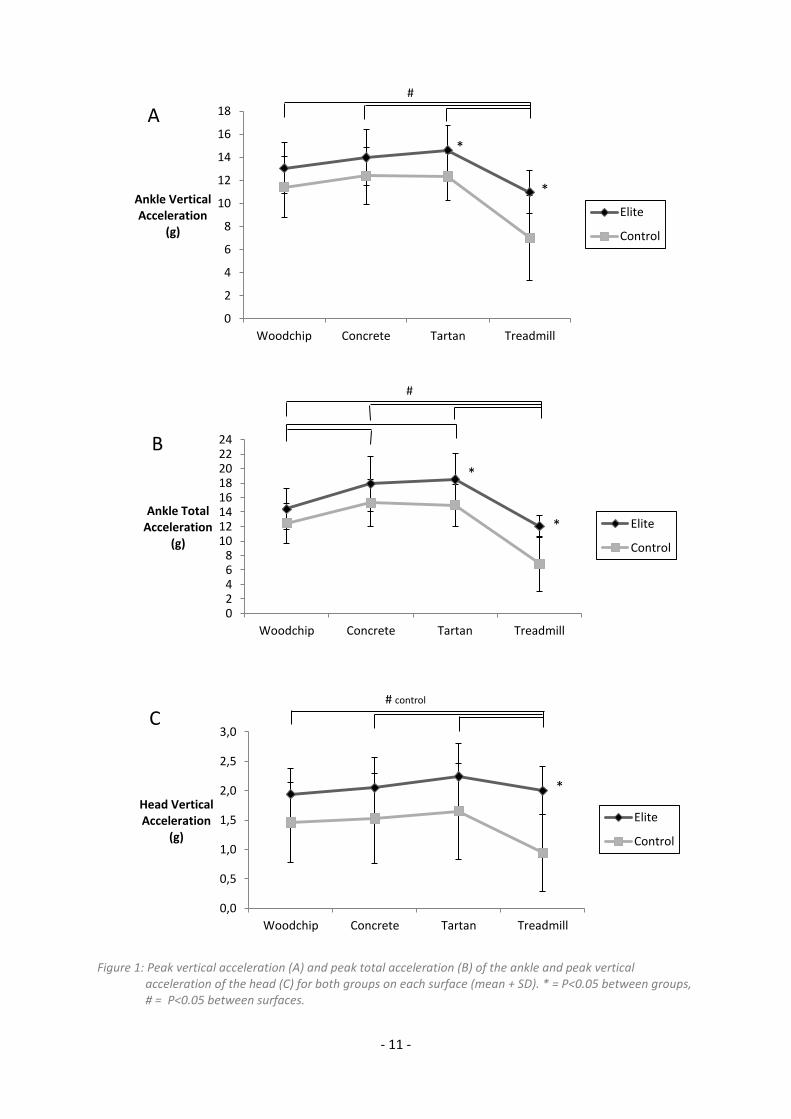
Figure 1 represents the peak accelerations of the ankle and head on each surface for each group.
There was a significant effect of the surface on the vertical and total peak acceleration. Peak vertical
acceleration at the ankle was significantly higher on the woodchip track (12.07g ± 0.55), concrete
street (13.12g ± 0.56) and tartan track (13.43g ± 0.47) compared to the treadmill (9.00g ± 0.64)(p<0.037).
Peak vertical ankle acceleration was also higher on the tartan track compared to the woodchip track
(p = 0.037). Similarly, total ankle acceleration was higher on the woodchip track (13.23g ± 0.61),
concrete street (16.22g ± 0.74) and tartan track (16.37g ± 0.67) compared to the treadmill (9.45g ± 0.65)
and higher on the tartan track and concrete street compared to the woodchip track. Peak vertical
acceleration of the head was higher on the tartan track (1.88g ± 0.16) than on the woodchip track
(1.63g ± 0.12) and concrete street (1.70g ± 0.13). Analysis for both groups separately gave similar
results except for the vertical acceleration of the head in the elite group, which was not different
between surfaces (p=0.316). These results can be found in table 2.
Peak vertical acceleration at the ankle was significantly higher for the elite (14.62g ± 2.04, 10.99g ±
3.65) than for the control group (12.34g ± 2.11, 7.01g ± 1.84) on the tartan track and treadmill
respectively. Similar results were found for peak total acceleration (p=0.015 for tartan track, p=0.001 for
treadmill). Additionally head vertical acceleration was larger in the elite group only for the treadmill
(p<0.001)(fig. 1).
- 11 -
0
2
4
6
8
10
12
14
16
18
Woodchip Concrete Tartan Treadmill
Ankle Vertical Acceleration
(g)
Elite
Control
*
*
0 2 4 6 8
10 12 14 16 18 20 22 24
Woodchip Concrete Tartan Treadmill
Ankle Total Acceleration
(g)
Elite
Control
*
*
0,0
0,5
1,0
1,5
2,0
2,5
3,0
Woodchip Concrete Tartan Treadmill
Head Vertical Acceleration
(g)
Elite
Control
*
Figure 1: Peak vertical acceleration (A) and peak total acceleration (B) of the ankle and peak vertical acceleration of the head (C) for both groups on each surface (mean + SD). * = P<0.05 between groups, # = P<0.05 between surfaces.
#
#
A
B
# control
C

- 12 -
Elite
Woodchip Concrete Tartan Treadmill Sig.
Surface
Ankle
Avert (g) 12.90 ± 0.83
4 13.92 ± 0.77
4 14.56 ± 0.64
4 10.99 ± 1.10
1,2,3 0.000
σ 1.91 ± 0.32 1.35 ± 0.19 1.06 ± 0.17 1.29 ± 0.13 0.008
Atotal (g)
14.26 ± 0.86
2*,3*,4
17.69 ± 1.01
1*,4*
18.42 ± 0.90
1*,4*
12.05 ± 1.16
1,2*,3*
0.000
σ 2.46 ± 0.36 1.93 ± 0.30 1.63 ± 0.20 1.50 ± 0.16 0.009
Head Avert (g) 1.85 ± 0.19 1.94 ± 0.21 2.18 ± 0.25 2.00 ± 0.20 0.316
σ 0.39 ± 0.034 0.35 ± 0.04 0.31 ± 0.03 0.28 ± 0.02
1 0.005
Shock Absorption (%) 85.63 ± 0.93 85.97 ± 1.29 84.80 ± 1.72 81.52 ± 0.93 0.008
Control
Ankle
Avert (g) 11.24 ± 0.71
4 12.31 ± 0.80
4* 12.30 ± 0.70
4*
7.01 ± 0.58
1,2*,3*
0.000
σ 2.52 ± 0.122,3*,4*
1.85 ± 0.171,3
1.42 ± 0.131*,2
1.29 ± 0.131*
0.000
Atotal (g)
12.20 ± 0.87
2,3,4*
14.75 ± 1.10
1,4*
14.31 ± 0.99
1,4*
6.84 ± 0.48
1*,2*,3*
0.000
σ 2.85 ± 0.263,4
2.65 ± 0.333 2.02 ± 0.22
1,2 1.47 ± 0.11
1 0.000
Head Avert (g) 1.42 ± 0.14
4 1.47 ± 0.16
4 1.58 ± 0.18
4 0.94 ± 0.13
1,2,3 0.000
σ 0.40 ±0.05 0.34 ± 0.03 0.29 ± 0.03 0.25 ± 0.02 0.002
Shock Absorption (%) 87.07 ± 1.34 87.76 ± 1.26 86.98 ± 1.35 86.15 ± 1.81 0.340
Table 2: acceleration (expressed as gravitational acceleration) on each surface for the elite group (n = 11) and control group (n = 10) (mean + SD). Pairwise comparisons were done with a bonferroni correction ;
1=
P<0.05 vs. woodchip, 1*
= P<0.01 vs. woodchip, 2= P<0.05 vs. concrete,
2*= P<0.01 vs. concrete,
3 = P<0.05
vs. tartan, 3*
= P<0.01 vs. tartan, 4 = P<0.05 vs. treadmill,
4* = P<0.01 vs. treadmill.
Shock Absorption
Shock absorption is influenced by the stiffness of the running surface (p<0.01). Shock absorption was
significantly higher on the concrete street (86.87% ± 0.91) compared to the treadmill (83.83% ± 0.99).
Surface had no effect on shock absorption in the control group but it had an effect in the elite group
(fig. 2). Shock attenuation was significantly lower in the elite group (81.84% ± 3.09) than in the control
group (86.58% ± 5.72) on the treadmill. For other surfaces no differences were significant.

- 13 -
74
76
78
80
82
84
86
88
90
92
Woodchip Concrete Tartan Treadmill
Shock Absorption
(%)
Elite
Control *
Figure 2: Shock absorption for both groups on each surface (mean + SD). * = P<0.05 between groups, # = P<0.05 between surfaces.
Variation
There was a significant effect of the running surfaces on the peak variation (p<0.001). Moreover, for
the ankle this vertical acceleration variation was larger on the woodchip track (2.21g ± 0.18) compared
to all other tracks (1.60g ± 0.13 (concrete); 1.24g ± 0.11 (tartan); 1.29g ± 0.09 (treadmill)) and on the
concrete track compared to the tartan track (p=0.008) (fig. 3). Total acceleration peak variation of the
ankle was higher on the woodchip track (2.65g ± 0.23) and concrete street (2.29g ± 0.22) compared
with the tartan track (1.82g ± 0.15) and treadmill (1.49g ± 0.10). Head-accelerometer data showed a
larger variation on the woodchip track (0.39g ± 0.03) compared to the tartan track (0.30g ± 0.02) and
treadmill (0.26g ± 0.01) and on the concrete street (0.35g ± 0.03) compared to the treadmill. No
differences in peak variation of the ankle vertical and total acceleration were found for the elite
group when analysing surfaces separately. A larger peak variation for the head-acceleration was
found in the elite group on the woodchip track compared to the treadmill (table 2,A). Ankle vertical
acceleration variation in the control group was larger on the woodchip track compared to all other
tracks and on the concrete street compared to the tartan track. Total ankle acceleration variation
was larger on the woodchip track compared to the tartan track and treadmill and on the concrete
street compared to the tartan track. No significant differences were found for the head acceleration
variation in the control group (table 2,B).
# elite

- 14 -
Between-group comparison showed that variation of vertical ankle acceleration peaks were
significantly larger in the control group (2.54g ± 0.36; 1.89g ± 0.52; 1.47g ± 0.41) than in the elite group
(1.83g ± 1.04; 1.33g ± 0.61; 1.04g ± 0.53) on all surfaces (woodchip, concrete, tartan respectively) except for
the treadmill (1.29g ± 0.42 (control); 1.29g ± 0.42 (elite)). No differences were found between peak
variations of other parameters.

- 15 -
0,0
0,5
1,0
1,5
2,0
2,5
3,0
3,5
4,0
Woodchip Concrete Tartan Treadmill
Ankle Vertical Acceleration
Variation (g)
Elite
Control *
* *
0,0
0,5
1,0
1,5
2,0
2,5
3,0
3,5
4,0
4,5
Woodchip Concrete Tartan Treadmill
Ankle Total Acceleration
Variation (g)
Elite
Control
0,0
0,1
0,2
0,3
0,4
0,5
0,6
Woodchip Concrete Tartan Treadmill
Head Vertical Acceleration
Variation (g)
Elite
Control
Figure 3: Peak vertical acceleration variation (A) and peak total acceleration variation (B) of the ankle and peak vertical acceleration variation of the head (C) for both groups on each surface (mean + SD). * = P<0.05 between groups, # = P<0.05 between surfaces.
# control
# control
# elite
A
B
C
# elite
# elite
# control

- 16 -
0
5000
10000
15000
20000
25000
30000
Kvert Kleg
Stiffness (Nm-1)
Control
Elite
Leg Stiffness
Maximal ground reaction force was 15% greater in the elite group than in the control group. Leg
stiffness showed a significant higher stiffness in the elite group (18755.87Nm-1
± 4409.54) compared to
the control group (14425.93Nm-1
± 2538.81) (fig. 4). This was also the case for vertical stiffness
(24075.15Nm-1
± 3450.95 vs. 20201.23Nm-1
± 4286.32 for elite and control respectively).
Figure 4: Leg stiffness and vertical stiffness for each group (mean + SD). * = P<0.05 between groups.
*
*

- 17 -
4. Discussion
The aim of this study was to investigate if peak vertical acceleration and shock absorption were
related to surface stiffness. Peak vertical acceleration was higher on all tracks compared to the
treadmill and total peak acceleration of the ankle was higher on the concrete street and tartan track
compared to the woodchip track. Shock absorption was significantly different between surfaces for
the elite group.
Treadmill peak accelerations were significantly lower compared to all outdoor tracks but no
difference was found between other surfaces. This is in conflict with the study of McMahon et al.
(1979), which showed that peak vertical acceleration was about 5 times subjects’ body weight on a
stiff surface while it was nearly absent on a more compliant surface. This could be due to differences
in stiffness of the tested surfaces between both studies. The finding in our paper is in conflict with
previous results especially when we compare the treadmill with the woodchip track. A possible
explanation for this is that some runners change their landing pattern on a treadmill. Kluitenberg et
al. (2012) showed that 15.8% of runners who had a heel strike landing on overground testing
changed to non-heel strike landing on the treadmill. This, combined with the finding of Lieberman et
al. (2010) that heal strike runners have higher vertical peak accelerations than mid-foot and toe-
runners, could explain the lower peak vertical accelerations on the treadmill. Due to this finding we
can conclude that treadmill running is more appropriate than running on other surfaces when the
runner is trying to avoid high impact forces. This can be interesting especially for rehabilitation from
stress fractures or other injuries in which high impact forces are harmful.
Our results showed that peak vertical accelerations on the tartan track and treadmill were higher for
the elite group compared with the control group. This however could most likely be explained by the
higher running speed in the elite group (p<0.001 for all surfaces) as previously reported by Keller et
al. (1996). No previous experiments were done comparing two groups with different running
experience.
Another parameter looked at was peak variation. Ankle vertical acceleration variation was largest on
the woodchip track. Analysing both groups separately revealed that this was only the case for the
control group and not for the elite group. Since this parameter tells us about the variation in peak
accelerations between steps, we can conclude that non-trained individuals have more difficulty in
keeping consistency in their running patterns. This can be explained by the unequal surface of the
woodchip track. Most likely the untrained participants had more difficulty in keeping the same
kinematic characteristics on this track and the more experienced elite group had better stabilising

- 18 -
abilities. This is an important matter because the woodchip track is mostly used by inexperienced
runners and people who have just started running training. Because of this inability to keep
consistency in their running patterns, these individuals are at higher risk of sprained ankles, sore
knees and other injuries. Besides, ankle peak vertical acceleration variation was higher on all outdoor
tracks for the control group compared to the elite group.
Although results in this paper found an influence by the running surface on shock absorption and a
higher absorption on the concrete street compared to the treadmill , no significances were found
comparing other tracks separately. This is partly in conflict with results from Dufek et al. (2009) who
found significant higher shock absorption for all surfaces. Our results are in line with Hines et al.
(2004), who showed that shock absorption was lower on a treadmill compared to overground
running. This could be explained, for this study, by the lower peak vertical forces on the treadmill,
which in turn could be clarified by the lower running speed compared with other tracks. Although
shock absorption was calculated as the percentage of the shock being absorbed, it could be that
when vertical accelerations are too low, a lower percentage is absorbed.
Because vertical acceleration peaks were higher (significant for tartan track and treadmill, trend for
woodchip track and concrete street) in elites than in controls but shock absorption was not different
except for this lower absorption on the treadmill, elite runners still have to deal with a greater
absolute shock. This means that running speed is not only linearly related to peak vertical
acceleration forces at the striking foot but also at more proximal parts of the body, resulting in
whole-body injuries.
The second aim of this study was to compare the difference in leg stiffness between elite runners
and non-trained individuals. Leg stiffness as well as vertical stiffness was significantly higher in the
elite group compared to the control group. This is in line with the results from Lloyd et al. (2012).
They found that after 4 weeks of plyometric training 12 and 15 year old boys showed higher leg
stiffness. This finding also supports the results from Ferris et al. (1999). They found that runners kept
the same vertical stiffness by altering their leg stiffness when running on surfaces with different
stiffnesses. They concluded that this was done by runners to keep the trajectory of their centre of
mass as constant as possible. Our results confirm this reasoning because we can state that elite
runners are trained in preventing fluctuations in their running pattern. By increasing the stiffness of
their stance leg, elite runners try to minimise the loss of energy lost in vertical displacement.
However, this could also be explained by the exertion of a lower maximal ground reaction force by
the control group. This larger force could be due to the higher running speed of the elite group.
Although Ferris et al. (1998) showed that leg stiffness was independent of running speed, Kim et al.
- 19 -
(2011) proved that leg stiffness increased with speed for walking. In a similar way vertical stiffness
increases with running speed (Brughelli et al., 2008).
The study was not without limitations. First of all, the elite group used here was not homogeneous
because it consisted of both sprinters and long-distance runners. Secondly, the model used for leg
stiffness is not the best available (Coleman et al., 2012). This however was necessary because of
technical problems and still produced a good correlation. A third limitation is that we have not
measured the stiffness of the tested surfaces and we did not correct the results for running speed.
Future research should focus on studying the relation between shock absorption and leg stiffness. If
a link exists between these two parameters, experiments for leg stiffness could be done using shock
absorption. This has the advantage of experiments not being bound to indoor laboratory testing.
Acknowledgements
The authors would like to thank Wouter Hoogkamer for assistance with data analysis, Laurens
Audoore, Vincent De Bie and Jonathan Moeyersons for their assistance during data collection and all
elite and control subjects for participation.
Conflict of interest statement
None of the authors state to have any financial or personal interest which could inappropriately
influence the results.
References
Bell, A. L. Petersen, D. R. Brand, R. A. 1990. A comparison of the accuracy of several hip center
location prediction methods. Journal of Biomechanics 23, 617-621.
Bobbert, M. F. Yeadon, M. R. Nigg, B. M., 1992. Mechanical analysis of the landing phase in heel-toe
running. Journal of Biomechanics 25, 223-234.
Braunstein, B. Arampatzis, A. Eysel, P. Brüggemann, G. P., 2010. Footwear affects the gearing at the
ankle and knee joints during running. Journal of Biomechanics 43, 2120-2125.

- 20 -
Caspersen, C. J. Powell, K. E. Koplan, J. P. Shirley, R. W. Campbell, C. C. Sikes, R. K., 1984. The
incidence of injuries and hazards in recreational and fitness runners. Medicine and Science in
Sports and Exercise 16, 113-114.
Coleman, D. R. Cannavan, D. Horne, S. Blazevich, A. J., 2012. Leg stiffness in human running:
Comparison of estimates derived from previously published models to direct kinematic–
kinetic measures. Journal of Biomechanics 45, 1987-1991.
Dixon, S. J. Collop, A. C. Batt, M. E., 2000. Surface effects on ground reaction forces and lower
extremity kinematics in running. Medicine and Science in Sports and Exercise 32, 1919-1926.
Dufek, J. S. Mercer, J. A. Griffin, J. R., 2009. The effects of speed and surface compliance on shock
attenuation characteristics for male and female runners. Journal of Applied Biomechanics 25,
219-228.
Farley, C. T. Gonzalez, O., 1996. Leg stiffness and stride frequency in human running. Journal of
Biomechanics 29, 181-186.
Farley, C. T. Houdijk, H. H. Van Strien, C. Louie, M., 1998. Mechanism of leg stiffness adjustment for
hopping on surfaces of different stiffnesses. Journal of Applied Physiology 85, 1044-1055.
Ferris, D. P. Liang, K. Farley, C. T., 1999. Runners adjust leg stiffness for their first step on a new
running surface. Journal of Biomechanics 32, 787-794.
Ferris, D. P. Louie, M. Farley, C. T., 1998. Running in the real world: Adjusting leg stiffness for
different surfaces. Proceedings B of the Royal Society 265, 989-994.
Hines, B. Mercer, J. A., 2004. Comparison of shock attenuation between overground and treadmill
running. The American college of sports medicine 36, S293-S294.
Keller, T. S. Weisberger, A. M. Ray, J. L. Hasan, S. S. Shiavi, R. G. Spengler, D. M., 1996. Relationship
between vertical ground reaction force and speed during walking, slow jogging, and running.
Clinical Biomechanics 11, 253-259.
Kesaniemi, Y. A. Danforth, E. J. Jensen, M. D. Kopelman, P. G. Lefebvre, P. Reeder, B. A., 2001. Dose-
response issues concerning physical activity and health: An evidence-based symposium.
Medicine and Science in Sports and Exercise 33, S531-S538.
Kim, W. Tan, J. Veloso, A. Vleck, V. Voloshin, A. S., 2011. The natural frequency of the foot-surface
cushion during the stance phase of running. Journal of Biomechanics 44, 774-779.
Kluitenberg, B. Bredeweg, S. W. Zijlstra, S. Zijlstra, W. Buist, I., 2012. Comparison of vertical ground
reaction forces during overground and treadmill running. A validation study. BMC
Musculoskeletal Disorders 13, 235.
Leardini, A. Cappozzo, A. Catani, F. Toksvig-Larsen, S. Petitto, A. Sforza, V. Cassanelli, G. Giannini, S.
1999. Validation of a functional method for the estimation of hip joint centre location.
Journal of Biomechanics 32, 99-103.
- 21 -
Lieberman, D. E. Venkadesan, M. Werbel, W. A. Daoud, A. I. D'Andrea, S. Davis, I. S. Mang'Eni, R. O.
Pitsiladis, Y., 2010. Foot strike patterns and collision forces in habitually barefoot versus shod
runners. Nature 463, 531-535.
Macera, C. A. Pate, R. R. Powell, K. E. Jackson, K. L. Kendrick, J. S. Craven, T. E., 1989. Predicting
lower-extremity injuries among habitual runners. Archives of Internal Medicine 149, 2565-
2568.
Marti, B., 1991. Health effects of recreational running in women. Some epidemiological and
preventive aspects. Sports Medicine 11, 20-51.
McMahon, T. A. Greene, P. R., 1979. The influence of track compliance on running. Journal of
Biomechanics 12, 893-904.
Parliamentary Office of Science and Technology, 2001. Health benefits of physical activity. Postnote
162, 4.
Rabita, G. Couturier, A. Lambertz, D., 2008. Influence of training background on the relationships
between plantarflexor intrinsic stiffness and overall musculoskeletal stiffness during hopping.
Journal of Applied Physiology 103, 163-171.
Scott, S. H. Winter, D. A., 1990. Internal forces at chronic running injury sites. Medicine and Science
in Sports and Exercise 22, 357-369.
van Gent, R. N. Siem, D. van Middelkoop, M. van Os, A. G. Bierma-Zeinstra, S. M. Koed, B. W., 2007.
Incidence and determinants of lower extremity running injuries in long distance runners: a
systematic review. British Journal of Sports Medicine 41, 469-480.

- 22 -
Appendix
Woodchip Concrete Tartan Treadmill Sig.
Surface
Ankle
Avert (g)
12.07 ± 0.553,4*
13.12 ± 0.564*
13.43 ± 0.471,4*
9.00 ± 0.641*,2*,3*
0.000
σ 2.21 ±
0.182*,3*,4* 1.60 ±
0.131*,3* 1.24 ±
0.111*,2* 1.29 ± 0.091*
0.000
Atotal (g)
13.23 ± 0.612*,3*,4*
16.22 ± 0.741*,4*
16.37 ± 0.671*,4*
9.45 ± 0.651*,2*,3*
0.000
σ 2.65 ± 0.233*,
4* 2.29 ± 0.223, 4
1.82 ± 0.151*,
2 1.49 ± 0.101*, 2
0.000
Head Avert (g) -1.63 ± 0.123 -1.70 ± 0.133
-1.88 ± 0.161,
2 -1.47 ± 0.12 0.003
σ 0.39 ± 0.033*,
4* 0.35 ± 0.034
0.30 ± 0.021* 0.26 ± 0.011*, 2
0.000
Shock Absorption % -86.35 ± 0.80 -86.87 ±
0.914 -85.89 ± 1.11 -83.83 ±
0.992 0.002
Table 3: acceleration (expressed as gravitational acceleration) – main effect surface (mean + SD); 1 = woodchip, 2 = concrete, 3 = tartan, 4 = treadmill;
1= P<0.05 vs. 1,
1*= P<0.01 vs. 1,
2= P<0.05 vs. 2,
2*= P<0.01 vs. 2,
3 = P<0.05 vs. 3,
3* = P<0.01 vs. 3,
4 = P<0.05 vs. 4,
4* = P<0.01 vs. 4 (n =21).
Elite Control Sig.
Ankle
Avert (g) 13.06 ± 2.66 11.41 ± 2.21 0.122
σ 1.83 ± 1.04 2.54 ± 0.36 0.046
Atotal (g) 14.42 ±2.77 12.48 ± 2.78 0.110
σ 2.38 ± 1.18 2.87 ± 0.77 0.255
Head Avert (g) -1.94 ± 0.68 -1.46 ± 0.44 0.61
σ 0.41 ± 0.16 0.39 ± 0.11 0.745
Shock Absorption % -85.19 ± 3.31 -86.93 ± 4.05 0.269
Table 4: acceleration (expressed as gravitational acceleration) woodchip track – main effect group surface-1
(mean + SD). (n =12/11).
Elite Control Sig.
Ankle
Avert (g) 13.98 ± 2.46 12.40 ± 2.41 0.135
σ 1.33 ± 0.61 1.89 ± 0.52 0.028
Atotal (g) 17.91 ± 3.27 15.30 ± 3.78 0.091
σ 1.92 ± 0.93 2.66 ± 0.99 0.081
Head Avert (g) -2.05 ± 0.77 -1.53 ± 0.51 0.071
σ 0.37 ± 0.15 0.35 ± 0.09 0.638
Shock Absorption % -85.28 ± 4.73 -87.47 ± 3.91 0.242
Table 5: acceleration (expressed as gravitational acceleration) concrete street – main effect group surface-1
(mean + SD). (n =12/11).

- 23 -
Elite Control Sig.
Ankle
Avert (g) 14.62 ± 2.04 12.34 ± 2.11 0.015
σ 1.04 ± 0.53 1.47 ± 0.41 0.045
Atotal (g) 18.53 ± 2.88 14.94 ± 3.61 0.015
σ 1.65 ± 0.62 2.05 ± 0.66 0.143
Head Avert (g) -2.24 ± 0.82 -1.65 ± 0.57 0.060
σ 0.33 ± 0.12 0.31 ± 0.10 0.661
Shock Absorption % -84.51 ± 5.53 -86.50 ± 4.35 0.350
Table 6: acceleration (expressed as gravitational acceleration) tartan track – main effect group surface-1
(mean + SD). (n =12/11).
Elite Control Sig.
Ankle
Avert (g) 10.99 ± 3.65 7.01 ± 1.84 0.006
σ 1.29 ± 0.42 1.29 ± 0.42 0.987
Atotal (g) 12.05 ± 3.86 6.84 ± 1.50 0.001
σ 1.50 ± 0.53 1.47 ± 0.35 0.898
Head Avert (g) -2.00 ± 0.66 -0.94 ± 0.41 0.000
σ 0.28 ± 0.06 0.25 ± 0.07 0.377
Shock Absorption % -81.84 ± 3.09 -86.58 ± 5.72 0.031
Table 7: acceleration (expressed as gravitational acceleration) treadmill – main effect group surface-1
(mean + SD). (n =11/10).
Elite Control Sig.
Woodchip track 3.39 ± 0.33 2.67 ± 0.21 0.000
Concrete street 3.82 ± 0.45 2.85 ± 0.26 0.000
Tartan track 4.42 ± 0.68 3.29 ± 0.25 0.000
Treadmill 3.04 ± 2.04 2.04 ± 0.15 0.000
Overground 3.84 ± 0.42 2.99 ± 0.20 0.000
Table 8: Running speed m s-1
(mean + SD).
Elite Control Sig.
Fmax (N) 1539.77 ± 188.92 1299.16 ± 160.54 0.004
Kvert (Nm-1
) 24075.15 ± 3450.95 20201.23 ± 4286.32 0.030
Kleg (Nm-1
) 18755.87 ± 4409.54 14425.93 ± 2538.81 0.011
Table 9: Maximal vertical force, vertical stiffness and leg stiffness – main effect group (mean + SD)..

- 24 -
Populaire samenvatting
Bij elke stap die een loper zet, komt er een enorme kracht vrij op het standbeen. Een deel van deze
schok kan geabsorbeerd worden door weefsels in het lichaam. Verder kan dit door het veranderen
van verschillende gewrichtshoeken. De grootte van deze kracht en absorptie ervan is afhankelijk van
de stijfheid van de ondergrond. In deze studie werden deze mechanismen vergeleken over
verschillende ondergronden en tussen elite loopsters en niet-sportsters. Uit de resultaten blijkt dat
de impact, gemeten aan de enkel, hoger is zelfs bij lopen op de minst stijve ondergrond vergeleken
met een loopband. Deze krachten zijn ook groter bij eliteatleten in vergelijking met de controle
groep. Overigens werd er vastgesteld dat eliteatleten een lagere schok absorptie hebben op de
loopband en dat zij een hogere stijfheid van het been aanhouden in vergelijking met niet-getrainde
individuen. Deze resultaten geven belangrijke inzichten in de aanpassingen van het lichaam door
training alsook over de verschillende krachten op het lichaam tussen verschillende ondergronden. Zo
komt er bij lopen op een loopband een lagere impact op het been en kan het dus voor mensen die er
baat bij hebben de impactkracht zo laag mogelijk te houden beter zijn dan lopen op andere
ondergronden.

- 25 -
Richtlijnen voor auteurs voor publicaties van de Journal of Biomechanics.
Affiliated with the American Society of Biomechanics, the International Society of Biomechanics, the European Society of Biomechanics, the Japanese Society for Clinical Biomechanics and Related Research and the Australian and New Zealand Society of Biomechanics. Open Access This journal offers authors two choices to publish their research; 1. Open Access • Articles are freely available to both subscribers and the wider public with permitted reuse • An Open Access publication fee is payable by authors or their research funder 2. Subscription • Articles are made available to subscribers as well as developing countries and patient groups through our access programs (http://www.elsevier.com/access) • No Open Access publication fee All articles published Open Access will be immediately and permanently free for everyone to read and download. Permitted reuse is defined by your choice of one of the following Creative Commons user licenses: Creative Commons Attribution-Non Commercial-ShareAlike (CC BY-NC-SA): for non-commercial purposes, lets others distribute and copy the article, to create extracts, abstracts and other revised versions, adaptations or derivative works of or from an article (such as a translation), to include in a collective work (such as an anthology), to text and data mine the article, as long as they credit the author(s), do not represent the author as endorsing their adaptation of the article, do not modify the article in such a way as to damage the author's honor or reputation, and license their new adaptations or creations under identical terms (CC BY NC SA). Creative Commons Attribution-NonCommercial-NoDerivs (CC-BY-NC-ND): for non-commercial purposes, lets others distribute and copy the article, and to include in a collective work (such as an anthology), as long as they credit the author(s) and provided they do not alter or modify the article. Creative Commons Attribution (CC-BY): available only for authors funded by organizations with which Elsevier has established an agreement. For a full list please see http://www.elsevier.com/fundingbodies Elsevier has established agreements with funding bodies. This ensures authors can comply with funding body Open Access requirements, including specific user licenses, such as CC-BY. Some authors may also be reimbursed for associated publication fees. http://www.elsevier.com/fundingbodies To provide Open Access, this journal has a publication fee which needs to be met by the authors or their research funders for each article published Open Access. Your publication choice will have no effect on the peer review process or acceptance of submitted articles. The Open Access publication fee for this journal is $3000 USD, excluding taxes. Learn more about Elsevier's pricing policy http://www.elsevier.com/openaccesspricing The following types of manuscripts can be submitted for publication:

- 26 -
1. Surveys, normally 4000 to 6000 words (by invitation from the Editor only). 2. Original Articles, up to 3500 words (3500 words approximately equals the content of 14 double-spaced manuscript pages with additional space for 8 to 10 figures or tables), although longer articles may occasionally be considered by the editors in special circumstances. Original articles typically explore some explicit biological hypothesis or report original but substantial observations or data of broad utility. Conceptually novel experimental or computational methods may be submitted as Original Articles when their relevance and importance for research of biological questions is demonstrated or otherwise emphasised in the text. 3. Perspective Articles, typically in the range of 500-2000 words. These manuscripts will explore controversial yet important themes, allowing expression of particular views or speculations, yet based on a solid understanding of published scientific information. Currently, such articles are by invitation only. 4. Short Communications, up to 2000 words, reporting preliminary observations, new interpretations of old data, simple new techniques or devices, or points of historical interest. 5. Book Reviews, normally no longer than 1000 words (by invitation from the Book Review Editor only). 6. Letters to the Editor normally no longer than 1000 words. Other material that can be published 1. Announcements of relevant scientific meetings on biomechanics. 2. Announcements of employment opportunities. Publication condition A manuscript submitted to this journal can only be published if it (or a similar version) has not been published and will not be simultaneously submitted or published elsewhere. A violation of this condition is considered fraud, and will be addressed by appropriate sanctions. Two manuscripts are considered similar if they concern the same hypothesis, question or goal, using the same methods and/or essentially similar data. Submissions Authors are requested to submit their original manuscript and figures online via http://ees.elsevier.com/bm/. This is the Elsevier web-based submission and review system. You will find full instructions located on this site - a Guide for Authors and a Guide for Online Submission. Please follow these guide lines to prepare and upload your article. Once the uploading is done, our system automatically generates an electronic pdf proof, which is then used for reviewing. All correspondence, including notification of the Editor's decision and requests for revisions, will be managed via this system. Paper submissions are not normally accepted. If you cannot submit electronically, please email the editorial office for assistance on [email protected] Authors or publishers wishing to have a book reviewed should send a copy to the Book Review Editor; the decision to review the book and choice of reviewers is that of the editor, although reviewers may be suggested. What information to include with the manuscript

- 27 -
1. Having read the criteria for submissions, authors should specify in their letter of transmittal, and on the title page, whether they are submitting their work as an Original Article, Perspective Article, Short Communication, or a Letter to the Editor. 2. All authors should have made substantial contributions to all of the following: (1) the conception and design of the study, or acquisition of data, or analysis and interpretation of data, (2) drafting the article or revising it critically for important intellectual content, (3) final approval of the version to be submitted. A letter of transmittal should be included stating this and that each of the authors has read and concurs with the content in the manuscript. 3. All contributors who do not meet the criteria for authorship as defined above should be listed in an acknowledgements section. Examples of those who might be acknowledged include a person who provided purely technical help, writing assistance, or a department chair who provided only general support. Authors should disclose whether they had any writing assistance and identify the entity that paid for this assistance. 4. At the end of the text, under a subheading "Conflict of interest statement" all authors must disclose any financial and personal relationships with other people or organisations that could inappropriately influence (bias) their work. Examples of potential conflicts of interest include employment, consultancies, stock ownership, honoraria, paid expert testimony, patent applications/registrations, and grants or other funding. 5. All sources of funding should be declared as an acknowledgement at the end of the text. Authors should declare the role of study sponsors, if any, in the study design, in the collection, analysis and interpretation of data; in the writing of the manuscript; and in the decision to submit the manuscript for publication. If the study sponsors had no such involvement, the authors should so state. 6. Only papers not previously published will be accepted; each manuscript must be accompanied by a statement signed by all co-authors that the material within has not been and will not be submitted for publication elsewhere except as an abstract. Emphasis will be placed upon originality of concept and execution. 7. Authors are encouraged to suggest referees although the choice is left to the editors. If you do, please supply the address and the email address, if known to you. Please do not include those with whom you have had active collaboration within the past 3 years. 8. Authors now have the option of submitting additional images with their papers. The Editor-in-Chief will choose at least one image per issue to publish as a highlighted image online on the Journal's website, alongside his choice of highlighted articles from that issue. Images should be clearly labeled as "Additional image for online publication". Randomised controlled trials All randomised controlled trials submitted for publication in the Journal should include a completed Consolidated Standards of Reporting Trials (CONSORT) flow chart. Please refer to the CONSORT statement website at http://www.consort-statement.org for more information. The Journal of Biomechanics has adopted the proposal from the International Committee of Medical Journal Editors (ICMJE) which require, as a condition of consideration for publication of clinical trials, registration in a public trials registry. Trials must register at or before the onset of patient enrolment. The clinical trial registration number should be included at the end of the abstract of the article. For this purpose, a clinical trial is defined as any research project that prospectively assigns human subjects to intervention or comparison groups to study the cause-and-effect relationship between a medical

- 28 -
intervention and a health outcome. Studies designed for other purposes, such as to study pharmacokinetics or major toxicity (e.g. phase I trials) would be exempt. Further information can be found at www.icmje.org. Ethics Work on human beings that is submitted to the Journal of Biomechanics should comply with the principles laid down in the Declaration of Helsinki; Recommendations guiding physicians in biomedical research involving human subjects. Adopted by the 18th World Medical Assembly, Helsinki, Finland, June 1964, amended by the 29th World Medical Assembly, Tokyo, Japan, October 1975, the 35th World Medical Assembly, Venice, Italy, October 1983, and the 41st World Medical Assembly, Hong Kong, September 1989. The manuscript should contain a statement that the work has been approved by the appropriate ethical committees related to the institution(s) in which it was performed and that subjects gave informed consent to the work. Studies involving experiments with animals must state that their care was in accordance with institution guidelines. Patients' and volunteers' names, initials, and hospital numbers should not be used. Changes to Authorship This policy concerns the addition, deletion, or rearrangement of author names in the authorship of accepted manuscripts: Before the accepted manuscript is published in an online issue: Requests to add or remove an author, or to rearrange the author names, must be sent to the Journal Manager from the corresponding author of the accepted manuscript and must include: (a) the reason the name should be added or removed, or the author names rearranged and (b) written confirmation (e-mail, fax, letter) from all authors that they agree with the addition, removal or rearrangement. In the case of addition or removal of authors, this includes confirmation from the author being added or removed. Requests that are not sent by the corresponding author will be forwarded by the Journal Manager to the corresponding author, who must follow the procedure as described above. Note that: (1) Journal Managers will inform the Journal Editors of any such requests and (2) publication of the accepted manuscript in an online issue is suspended until authorship has been agreed. After the accepted manuscript is published in an online issue: Any requests to add, delete, or rearrange author names in an article published in an online issue will follow the same policies as noted above and result in a corrigendum. Review and publication process 1. You will receive an acknowledgement of receipt of the manuscript. 2. Submitted manuscripts will be reviewed by selected referees and subsequently, the author will be informed of editorial decisions based on the referee comments, as soon as possible. As a rule, manuscripts and photographs, or other material you have submitted will not be returned to you with the decision letter, only the referee comments will be included. 3. If your manuscript was conditionally accepted, you must return your revision with a separate sheet, addressing all the referee comments, and explaining how you dealt with them. 4. When returning the revised manuscript to the Editorial Office, make sure that the manuscript number, the revision number (Rev. 1,2,3. . ) and the designation Original/Copy are clearly typed on the top of the title pages of the original manuscript and all copies.
- 29 -
5. When the final version of the manuscript is accepted, the corresponding author will be notified of acceptance and the manuscript will be forwarded to production. 6. Upon acceptance of an article, authors will be asked to sign a "Journal Publishing Agreement" (for more information on this and copyright see http://ees.elsevier.com/bm/). Acceptance of the agreement will ensure the widest possible dissemination of information. An e-mail (or letter) will be sent to the corresponding author confirming receipt of the manuscript together with a 'Journal Publishing Agreement' form.If excerpts from other copyrighted works are included, the author(s) must obtain written permission from the copyright owners and credit the source(s) in the article. Elsevier has preprinted forms for use by authors in these cases: contact Elsevier's Rights Department, Philadelphia, PA, USA: Tel. (+1) 215 238 7869; Fax (+1) 215 238 2239; e-mail [email protected] . Requests may also be completed online via the Elsevier homepage (http://www.elsevier.com/locate/permissions). 7. One set of page proofs in PDF format will be sent by e-mail to the corresponding author (if we do not have an e-mail address then paper proofs will be sent by post). Elsevier now sends PDF proofs which can be annotated; for this you will need to download Adobe Reader version 7 available free from http://www.adobe.com/products/acrobat/readstep2.html. Instructions on how to annotate PDF files will accompany the proofs. The exact system requirements are given at the Adobe site: http://www.adobe.com/products/acrobat/acrrsystemreqs.html#70win.If you do not wish to use the PDF annotations function, you may list the corrections (including replies to the Query Form) and return to Elsevier in an e-mail. Please list your corrections quoting line number. If, for any reason, this is not possible, then mark the corrections and any other comments (including replies to the Query Form) on a printout of your proof and return by fax, or scan the pages and e-mail, or by post.Please use this proof only for checking the typesetting, editing, completeness and correctness of the text, tables and figures. Significant changes to the article as accepted for publication will only be considered at this stage with permission from the Editor. We will do everything possible to get your article published quickly and accurately. Therefore, it is important to ensure that all of your corrections are sent back to us in one communication: please check carefully before replying, as inclusion of any subsequent corrections cannot be guaranteed. Proofreading is solely your responsibility. Note that Elsevier may proceed with the publication of your article if no response is received. 8. After publication, the corresponding author, at no cost, will be provided with a PDF file of the article via e-mail. The PDF file is a watermarked version of the published article and includes a cover sheet with the journal cover image and a disclaimer outlining the terms and conditions of use. Supplementary Website material Elsevier now accepts electronic supplementary material to support and enhance your scientific research. Supplementary files offer the author additional possibilities to publish supporting applications, movies, animation sequences, high-resolution images, background datasets, sound clips and more. Supplementary files supplied will be published online alongside the electronic version of your article in Elsevier web products, including ScienceDirect http://www.sciencedirect.com. In order to ensure that your submitted material is directly usable, please ensure that data is provided in one of our recommended file formats. Authors should submit the material in electronic format together with the article and supply a concise and descriptive caption for each file. For more detailed instructions please visit: http://ees.elsevier.com/bm/. This journal offers electronic submission services and supplementary data files can be uploaded with your manuscript via the web-based submission system, http://ees.elsevier.com/bm.

- 30 -
Preparation of the manuscript 1. All publications will be in English. Authors whose 'first' language is not English should arrange for their manuscripts to be written in idiomatic English before submission. 2. Authors should bear in mind that readers potentially include scientists from various disciplines. Abstracts, introductions and discussions should be in relatively non-specialised language so that a broad biomechanics audience may understand them. Discussions should include an appropriate synthesis of relevant literature for those not intimately familiar with the specific field. Implications for other fields should be noted. 3. A separate title page should include the title, authors' names and affiliations, and a complete address for the corresponding author including telephone and fax numbers as well as an E-mail address. Authors should supply up to five keywords. Keywords may be modified or added by the Editors. Please provide a word count (Introduction through Discussion) on the title page. All pages, starting with the title page, should be numbered. 4. An abstract not exceeding one paragraph of 250 words should appear at the beginning of each Survey, Original Article, Perspective Article or Short Communication; the abstract will serve instead of a concluding summary and should be substantive, factual and intelligible without reference to the rest of the paper. 5. Papers involving human experiments should contain a statement in the Methods section that proper informed consent was obtained. Papers involving animal experiments should contain a statement in the Methods section that the experiments conducted were within the animal welfare regulations and guidelines for the country in which the experiments were performed. 6. Acknowledgements should be included after the end of the Discussion and just prior to the References. Include external sources of support. 7. The text should be ready for setting in type and should be carefully checked for errors prior to submission. Scripts should be typed double-spaced. 8. All illustrations should accompany the typescript, but not be inserted in the text. Refer to photographs, charts, and diagrams as 'figures' and number consecutively in order of appearance in the text. Substantive captions for each figure explaining the major point or points should be typed on a separate sheet. Please make sure that artwork files are in an acceptable format (TIFF, EPS or MS Office files) and are of the correct resolution. Information relating to the preferred formats for artwork may be found at http://www.ees.elsevier.com/bm/. If, together with your accepted article, you submit usable colour figures then Elsevier will ensure, at no additional charge, that these figures will appear in colour on the web (e.g., ScienceDirect and other sites) regardless of whether or not these illustrations are reproduced in colour in the printed version. For colour reproduction in print, authors will be charged at current printing prices unless colour printing has been requested free of charge, at the discretion of the editors. 9. All key references related to methods must be from published materials; submitted manuscripts, research reports, or theses which would be unavailable to readers should be avoided. References are indicated in the text alphabetically by names of the authors and the year of publication, e.g. Ralston

- 31 -
(1957) or (Brown and Shaw, 1984; Lai et al., 1978). The full references should be collected in a separate section at the end of the paper in the following forms: A. Journals: The reference should include the title of the paper, the title of the journal in full and the first and last page number. Belardinelli, E. Cavalcanti, S., 1991. A new non-linear two-dimensional model of blood motion in tapered and elastic vessels. Computers in Biology and Medicine 21, 1-3. B. Books: If the work referred to is a book, or part of a book, the reference should be in the following form: Weiner, S., Traub, W., 1991. Organization of crystals in bone. In: Suga, S., Nakahara, H. (Eds.), Mechanisms and Phylogeny of Mineralisations in Biological Systems. Springer, Tokyo, pp. 247-253. C. Theses van Werff, K., 1977. Kinematic and dynamic analysis of mechanisms. A finite element approach. PhD. thesis, Delft University Press, Delft. D. Proceedings van Soest, A. J., van den Bogert, A. J., 1991. Criteria for the comparison of direct dynamics software systems to be used in the field of biomechanics. In Proceedings of the 3rd International Symposium on Computer Simulation in Biomechanics. University of Western Australia, Perth. E. Footnotes As distinct from literature references, should be avoided. Where they are essential, superscript Arabic numbers should be employed. 10. SI (Metric) Units must be used for all quantities in text, figures and tables. It is suggested that a complete list of symbols used and their explanation be included, in a notation section at the beginning of the manuscript. 11. Authors submitting manuscripts reporting data on cell responses to mechanical loads should report their study according to the standards suggested in the Editorial accompanying our special Issue on cell mechanics (Volume 33, Issue 1).

- 32 -
Marker en accelerometer plaatsing