Infant and Child Injuries in Georgia: A Study Comparing Injuries...
11
3/26/2014 1 Bright from the Start: Georgia Department of Early Care and Learning www.decal.ga.gov Infant and Child Injuries in Georgia: A Study Comparing Injuries in Child Care Facilities with Infant and Child Injuries in the General Population Study by Dr. John Carter, Rollins School of Public Health, Emory University Bright from the Start: Georgia Department of Early Care and Learning www.decal.ga.gov 2 Background Conducted by Dr. John Carter from the Rollins School of Public Health at Emory University Purpose was to determine if the risk of injury to children from birth to age five in child care settings is greater than the risk of injury to the same age children in the general population. Overall, goal is to identify ways to reduce injuries and fatalities in child care.
Transcript of Infant and Child Injuries in Georgia: A Study Comparing Injuries...

3/26/2014
1
Bright from the Start: Georgia Department of Early Care and Learningwww.decal.ga.gov
Infant and Child Injuries in Georgia:A Study Comparing Injuries in Child Care
Facilities with Infant and Child Injuries in the General Population
Study by Dr. John Carter,Rollins School of Public Health,
Emory University
Bright from the Start: Georgia Department of Early Care and Learningwww.decal.ga.gov 2
Background
Conducted by Dr. John Carter from the Rollins School of Public Health at Emory UniversityPurpose was to determine if the risk of injury to children from birth to age five in child care settings is greater than the risk of injury to the same age children in the general population.Overall, goal is to identify ways to reduce injuries and fatalities in child care.

3/26/2014
2
Bright from the Start: Georgia Department of Early Care and Learningwww.decal.ga.gov 3
Data Sources
Georgia Hospital Discharge (HD) DataDECAL Incident Reports on injuries requiring medical attentionIncluded only ER visits and hospital discharges
Injuries treated in physicians’ offices or clinics are not captured in the HD data, so the true incidence of injury is higher than the estimate.
Bright from the Start: Georgia Department of Early Care and Learningwww.decal.ga.gov 4
Methods Procedures
Compiled incidences of injuries requiring emergency room care or hospitalization in the general population for infants and children through age five. Compiled incidences of injury in child care settings that required medical attention. This included recoding child care data to compare to the general population. Estimated the incidences of injuries in child care settings and compared them to the general population. Reviewed investigative reports to determine if injury occurred and if licensing rule violation resulting in injury was substantiated.

3/26/2014
3
Bright from the Start: Georgia Department of Early Care and Learningwww.decal.ga.gov 5
Utilized Georgia Hospital Discharge Data.Injuries treated in physicians offices or clinics are not captured. True incidence will be higher than estimate.
For counts of injuries, a child is counted only once in a given year even if the child had multiple injuries and/or multiple visits.
Events associated with injuries are identified through two ranges of ICD9 codes.
External cause (fall from ladder) is identified by an E-Code.
Injury Code-type of injury (burn, fracture of skull).
Bright from the Start: Georgia Department of Early Care and Learningwww.decal.ga.gov 6
Number of Injuries by Year (General Population)
0
2
4
6
8
10
12
14
0 1 2 3 4 5
Per
cen
t In
jure
d
Age in Years
Figure 1: Annual Injury Risk by Age in Years, GA, 2008-2010,
(ER Visits and Hospital Discharges)
2008
2009
2010

3/26/2014
4
Bright from the Start: Georgia Department of Early Care and Learningwww.decal.ga.gov 7
E-Codes (Number of Events; General Population)
0.0 5.0 10.0 15.0 20.0 25.0 30.0 35.0
Fall
Struck
Insect Bite
Cut/Pierce
Poison
MV Event
Hot Substance
Crush
Dog Bite
Figure 2: Number of Events (1000s) by Cause, 2010, Ages < 6
Bright from the Start: Georgia Department of Early Care and Learningwww.decal.ga.gov 8
Types of Injuries (General Population)Table 3: 2010 Injury Records, by Type of Injury, Ages < 6
Type of Injury Number % of Total Rate (per 1,000)
Open Wound Of Head, Neck, And Trunk 18,770 23.0 22.7
Open Wound Of Upper Limb 2,767 3.4 3.3
Open Wound Of Lower Limb 2,067 2.5 2.5
Certain Traumatic Complications And Unspecified Injuries 10,667 13.0 12.9
Contusion With Intact Skin Surface 10,446 12.8 12.6
Superficial Injury 7,833 9.6 9.5
Effects Of Foreign Body Entering Through Orifice 5,453 6.7 6.6
Fracture Of Upper Limb 4,406 5.4 5.3
Fracture Of Lower Limb 1,347 1.6 1.6
Fracture Of Skull 534 0.7 0.6
Burns 2,618 3.2 3.2
Dislocation 2,566 3.1 3.1
Sprains And Strains Of Joints And Adjacent Muscles 2,432 3.0 2.9
Poisoning By Drugs, Medicinal And Biological Substances 2,207 2.7 2.7
Intracranial Injury, Excluding Those With Skull Fracture 1,100 1.3 1.3
Crushing Injury 319 0.4 0.4
Other And Unspecified Effects Of External Causes 2,995 3.7 3.6
Toxic Effects Of Substances Chiefly Non-medicinal As To Source 1,953 2.4 2.4
Complications Of Surgical And Medical Care 1,167 1.4 1.4
All Other 117
Total 81,764
3/26/2014
5
Bright from the Start: Georgia Department of Early Care and Learningwww.decal.ga.gov 9
Estimating Injury in Child Care Settings
Compiled injuries reported in DECAL Incident Reports
from June 2007 to May 2012. A total of 805 incidents
were identified.
Reviewed narrative of the incident and recoded
external cause of injury to match hospital discharge
data to allow comparison.
If enough information was available, type of injury,
(i.e., fracture) was added to the database. From a prevention perspective, the cause of injury is better factor. However, in many reports this was not included or was unknown.
Bright from the Start: Georgia Department of Early Care and Learningwww.decal.ga.gov 10
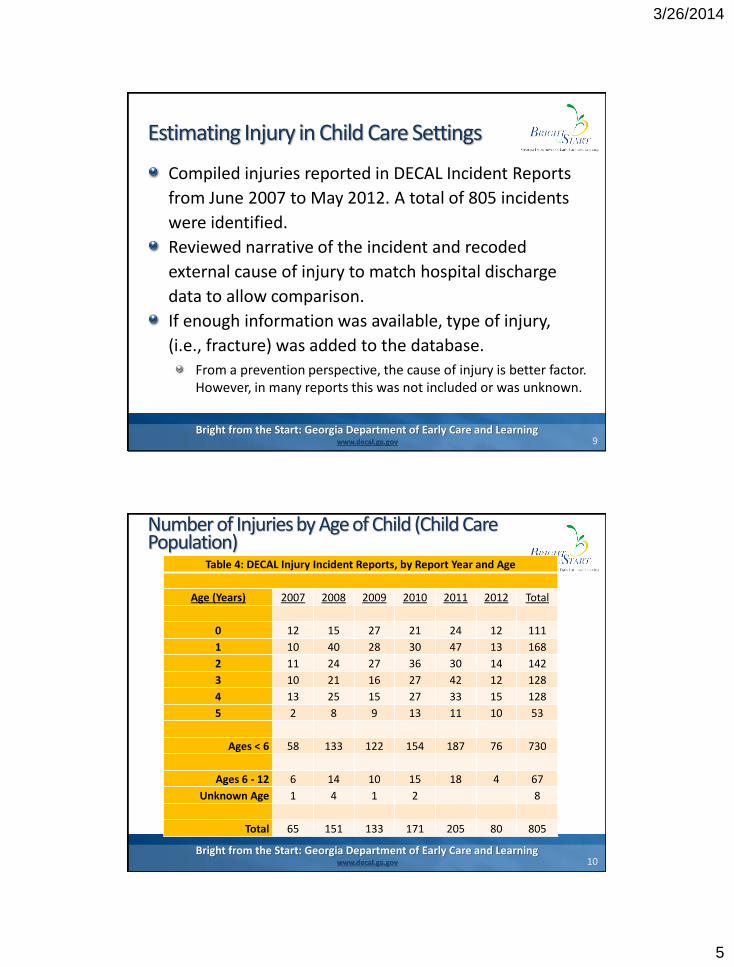
Number of Injuries by Age of Child (Child Care Population)
Table 4: DECAL Injury Incident Reports, by Report Year and Age
Age (Years) 2007 2008 2009 2010 2011 2012 Total
0 12 15 27 21 24 12 111
1 10 40 28 30 47 13 168
2 11 24 27 36 30 14 142
3 10 21 16 27 42 12 128
4 13 25 15 27 33 15 128
5 2 8 9 13 11 10 53
Ages < 6 58 133 122 154 187 76 730
Ages 6 - 12 6 14 10 15 18 4 67
Unknown Age 1 4 1 2 8
Total 65 151 133 171 205 80 805
3/26/2014
6
Bright from the Start: Georgia Department of Early Care and Learningwww.decal.ga.gov 11
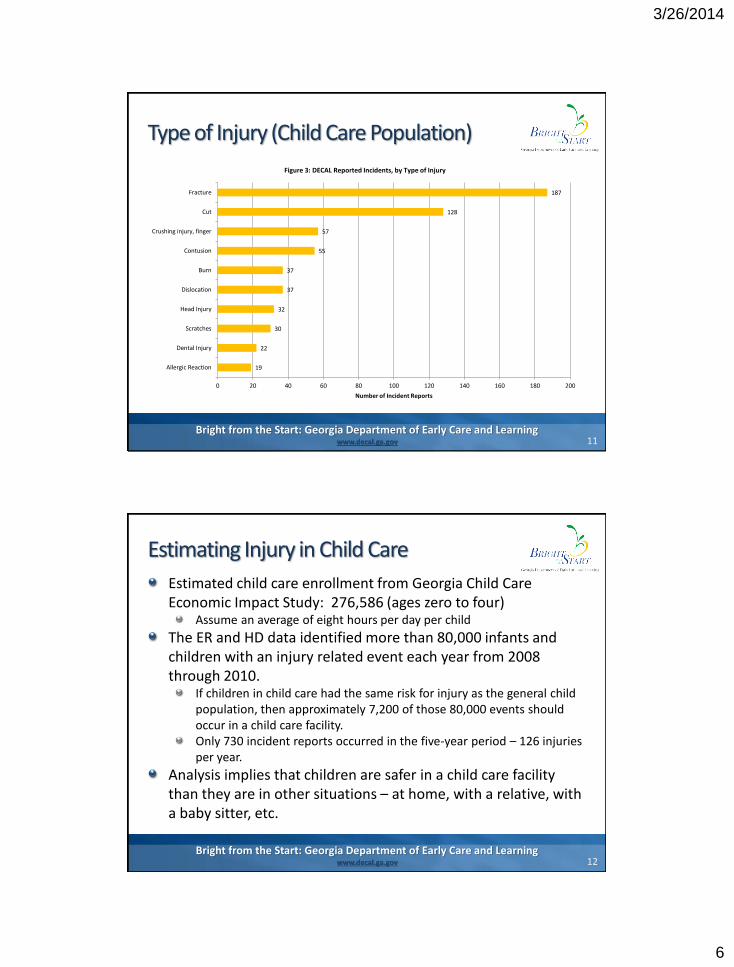
Type of Injury (Child Care Population)
19
22
30
32
37
37
55
57
128
187
0 20 40 60 80 100 120 140 160 180 200
Allergic Reaction
Dental Injury
Scratches
Head Injury
Dislocation
Burn
Contusion
Crushing injury, finger
Cut
Fracture
Number of Incident Reports
Figure 3: DECAL Reported Incidents, by Type of Injury
Bright from the Start: Georgia Department of Early Care and Learningwww.decal.ga.gov 12
Estimating Injury in Child Care
Estimated child care enrollment from Georgia Child Care Economic Impact Study: 276,586 (ages zero to four)
Assume an average of eight hours per day per child
The ER and HD data identified more than 80,000 infants and children with an injury related event each year from 2008 through 2010.
If children in child care had the same risk for injury as the general child population, then approximately 7,200 of those 80,000 events should occur in a child care facility. Only 730 incident reports occurred in the five-year period – 126 injuries per year.
Analysis implies that children are safer in a child care facility than they are in other situations – at home, with a relative, with a baby sitter, etc.
3/26/2014
7
Bright from the Start: Georgia Department of Early Care and Learningwww.decal.ga.gov 13
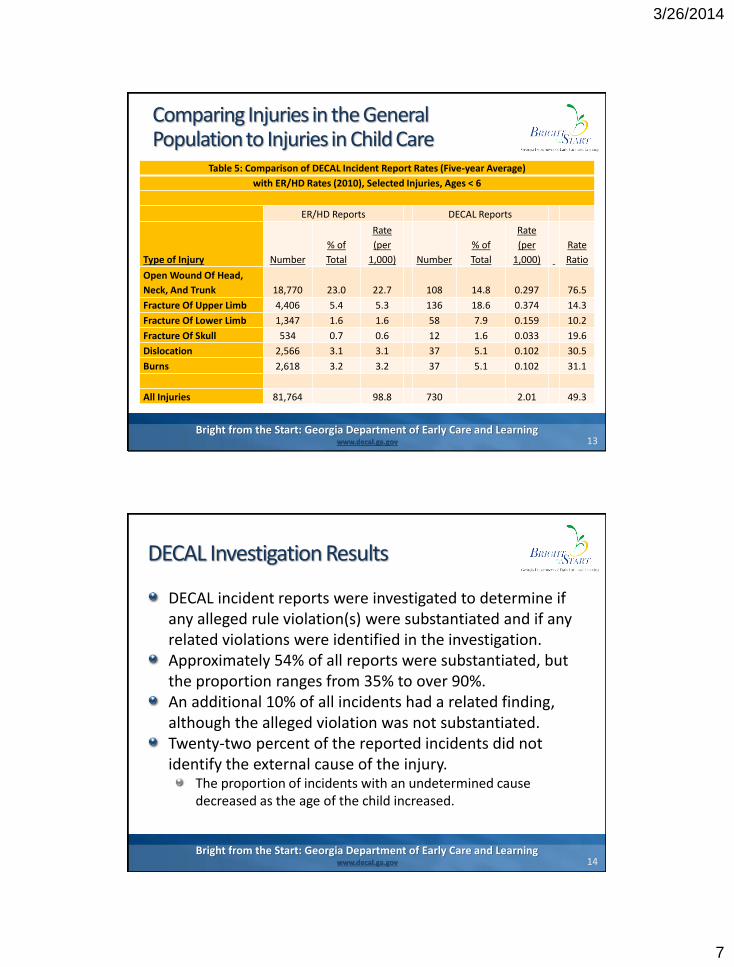
Table 5: Comparison of DECAL Incident Report Rates (Five-year Average)
with ER/HD Rates (2010), Selected Injuries, Ages < 6
ER/HD Reports DECAL Reports
Type of Injury Number
% of
Total
Rate
(per
1,000) Number
% of
Total
Rate
(per
1,000)
Rate
Ratio
Open Wound Of Head,
Neck, And Trunk 18,770 23.0 22.7 108 14.8 0.297 76.5
Fracture Of Upper Limb 4,406 5.4 5.3 136 18.6 0.374 14.3
Fracture Of Lower Limb 1,347 1.6 1.6 58 7.9 0.159 10.2
Fracture Of Skull 534 0.7 0.6 12 1.6 0.033 19.6
Dislocation 2,566 3.1 3.1 37 5.1 0.102 30.5
Burns 2,618 3.2 3.2 37 5.1 0.102 31.1
All Injuries 81,764 98.8 730 2.01 49.3
Comparing Injuries in the General Population to Injuries in Child Care
Bright from the Start: Georgia Department of Early Care and Learningwww.decal.ga.gov 14
DECAL Investigation Results
DECAL incident reports were investigated to determine if any alleged rule violation(s) were substantiated and if any related violations were identified in the investigation. Approximately 54% of all reports were substantiated, but the proportion ranges from 35% to over 90%. An additional 10% of all incidents had a related finding, although the alleged violation was not substantiated. Twenty-two percent of the reported incidents did not identify the external cause of the injury.
The proportion of incidents with an undetermined cause decreased as the age of the child increased.

3/26/2014
8
Bright from the Start: Georgia Department of Early Care and Learningwww.decal.ga.gov 15
Substantiated Findings by Type of Injury
93.3
75.7
68.4
66.7
65.6
63.3
59.5
58.8
57.1
56.3
55.1
54.1
43.3
36.4
36.4
34.5
0.0 10.0 20.0 30.0 40.0 50.0 60.0 70.0 80.0 90.0 100.0
Facial injury (15)
Burn (37)
Allergic Reaction (19)
Crushing injury, finger (57)
Head Injury (32)
Scratches (30)
Dislocation (37)
Abrasion (17)
Concussion (14)
Cut (128)
All Other (69)
All Injuries (730)
Fracture (187)
Dental Injury (22)
Object in orifice (11)
Contusion (55)
Percent Substantiated
Figure 4: Substantiated Findings, by Type of Injury
Bright from the Start: Georgia Department of Early Care and Learningwww.decal.ga.gov 16
Substantiated Findings by External Cause of Injury
95.080.0
71.4
71.0
68.6
62.0
61.9
55.2
54.1
53.6
32.9
0.0 10.0 20.0 30.0 40.0 50.0 60.0 70.0 80.0 90.0 100.0
Hot liquid (20)
Sharp Object (15)
Food (14)
Rough Handling (31)
Crushed by Door (51)
All Other (71)
Bite (21)
Striking or Struck By (96)
All Causes (730)
Fall (250)
Unknown (161)
Percent Substantiated
Figure 5: Substantiated Findings,by External Cause of Injury

3/26/2014
9
Bright from the Start: Georgia Department of Early Care and Learningwww.decal.ga.gov 17
“Undetermined” Causes by Age
38.7
28.6
21.1
18.8
9.4
7.5
0.0
5.0
10.0
15.0
20.0
25.0
30.0
35.0
40.0
45.0
0 1 2 3 4 5
Per
cen
t
Figure 6: Percent of DECAL Incident Reports with Undetermined Cause of Injury, FY2008 - 2012
Age in Years
Bright from the Start: Georgia Department of Early Care and Learningwww.decal.ga.gov 18
Findings
In Georgia in 2010 approximately one out of every 10 children under the age of six had an emergency room visit or hospital stay (ER/HD) related to an injury. A child under age six in the general population is about 50 times more likely to sustain an injury requiring medical services than a child in a child care facility.The injury risks vary by type of injury, but any specific injury is at least 10 times more likely in the general child population than in the child care population.

3/26/2014
10
Bright from the Start: Georgia Department of Early Care and Learningwww.decal.ga.gov 19
Recommendations
Expand DECAL database to include type and cause of injury. Use the same hospital discharge codes. Provide additional training and public awareness about the highest number of causes of injuries, e.g.,
Finger CrushingBurnsAllergic Reactions
Focus training on fractures, the largest injury category.
Bright from the Start: Georgia Department of Early Care and Learningwww.decal.ga.gov 20
Data Limitations
The estimated child population injury rate is an underestimate of the true rate. Injuries treated in a clinic or physician’s office are not included, since no statewide data system captures outpatient services. The injury estimates for infants/children in child care facilities are developed from a DECAL-prepared database of injury incident reports. Assume that facilities underreport injuries. The general “exposure” time in child care is an estimate based on assumptions. This estimate factors into the expected risk of injury used to determine a comparison ratio.

3/26/2014
11
Bright from the Start: Georgia Department of Early Care and Learningwww.decal.ga.gov 21
John T. Carter. (2014). An Assessment of the Risk of Preventable Deaths Among Children in Child Care in Georgia (2007-2009). Atlanta, GA: Rollins School of Public Health, Emory University.