2016 Injury Report - tcfp.texas.gov · Table 29: Comparison of Texas 2016 and NFPA 2015 ..... 23...
30
TCFP 2016 Injury Report Texas Commission on Fire Protection Injury Report January 1, 2016 to December 31, 2016
Transcript of 2016 Injury Report - tcfp.texas.gov · Table 29: Comparison of Texas 2016 and NFPA 2015 ..... 23...
TCFP 2016 Injury Report
Texas Commission on Fire Protection
Injury Report January 1, 2016 to December 31, 2016

TCFP 2016 Injury Report

i
Table of Contents Table of Contents ......................................................................................................................................................................................... i
Executive Summary ................................................................................................................................................................................... 1
Abstract ........................................................................................................................................................................................................... 2
Mission ............................................................................................................................................................................................................ 3
Why we are collecting injury data .................................................................................................................................................. 3
Information the commission collects ............................................................................................................................................ 3
How this will help the fire service .................................................................................................................................................. 3
Reports, Information and Data Collection ....................................................................................................................................... 4
Fire Protection Personnel Injuries ...................................................................................................................................................... 5
Table 1: Injuries by Activity and Severity, 2016 ...................................................................................................................... 5
Figure 1: Total Injuries by Activity, 2016 .................................................................................................................................... 5
Minor and Serious Injuries by Activity .............................................................................................................................................. 6
Table 2: Minor Injury Activities, 2012 - 2016 ........................................................................................................................... 6
Table 3: Serious Injury Activities, 2012 - 2016 ........................................................................................................................ 6
Emergency vs. Non-Emergency Injuries .......................................................................................................................................... 7
Table 4: Injuries by Emergency Activity and Severity, 2016 .............................................................................................. 7
Table 5: Injuries by Non-Emergency Activity and Severity, 2016 ................................................................................... 7
Figure 2: Percent of Injuries in Emergency and Non-Emergency Activities, 2016 ................................................... 7
Injuries by Type ........................................................................................................................................................................................... 8
Table 6: Types of Injury, 2012-2016 (Note: ordered by 2016, descending) ............................................................... 8
Figure 3: Types of Injury, 2016........................................................................................................................................................ 8
Task at Time of Injury ............................................................................................................................................................................... 9
Table 7: Top 15 Tasks at Time of Injury, 2013-2016 (ordered by 2016, descending) ........................................... 9
Figure 4: Top 15 Tasks at Time of Injury, 2013-2016 ........................................................................................................... 9
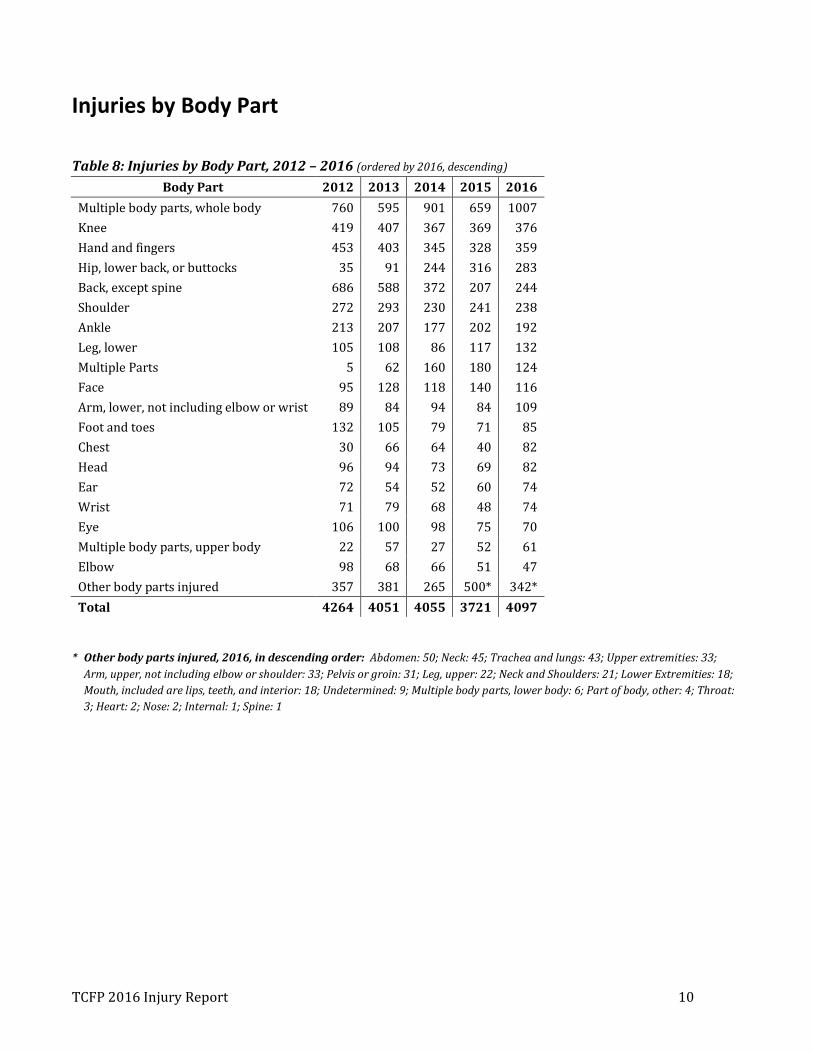
Injuries by Body Part ............................................................................................................................................................................. 10
Table 8: Injuries by Body Part, 2012 – 2016 (ordered by 2016, descending) ......................................................... 10
Injuries by Age Group ............................................................................................................................................................................ 11
Table 9: Injuries by Age Group, 2012 - 2016 .......................................................................................................................... 11
Figure 5: Injury Percentages by Age Group, 2012 - 2016 ................................................................................................. 11
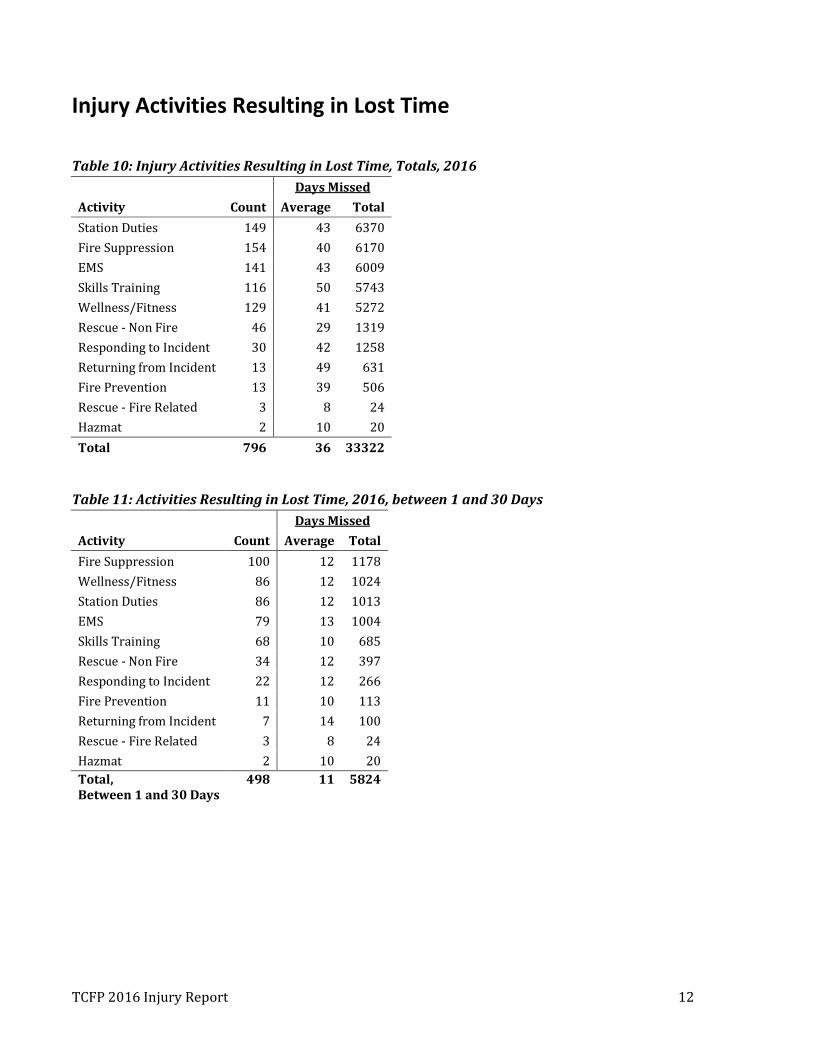
Injury Activities Resulting in Lost Time ........................................................................................................................................ 12
Table 10: Injury Activities Resulting in Lost Time, Totals, 2016 ................................................................................... 12
Table 11: Activities Resulting in Lost Time, 2016, between 1 and 30 Days ............................................................. 12

ii
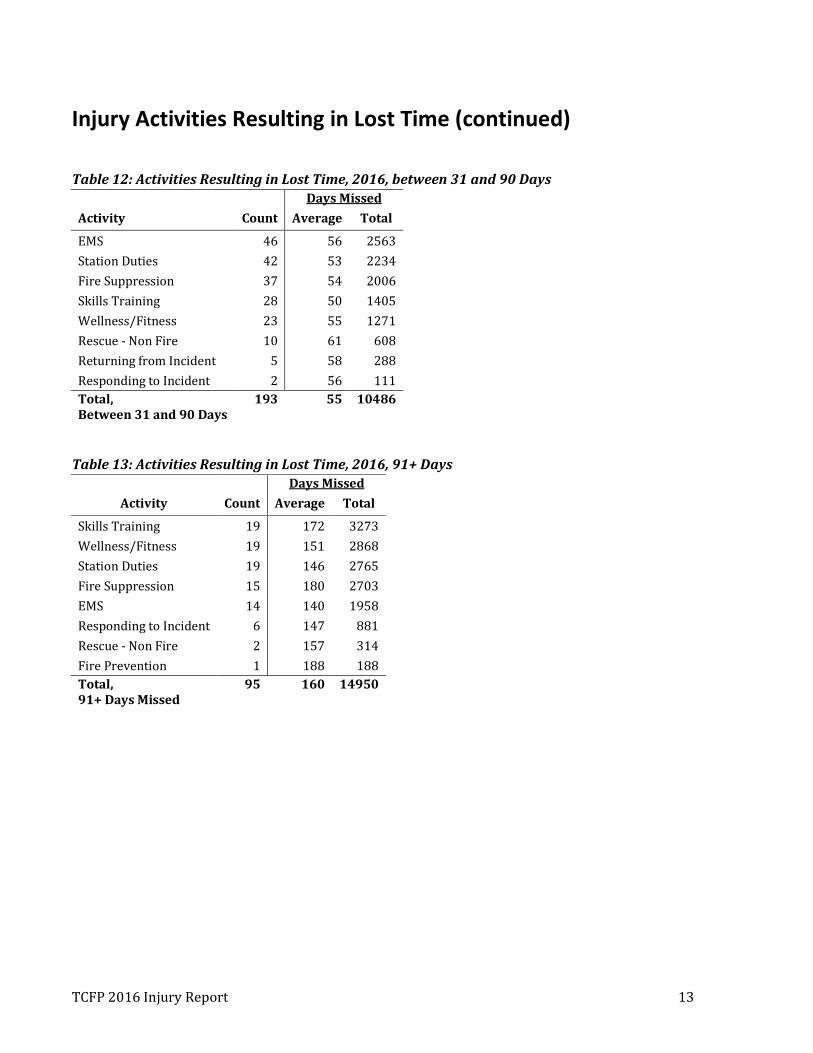
Injury Activities Resulting in Lost Time (continued)............................................................................................................... 13
Table 12: Activities Resulting in Lost Time, 2016, between 31 and 90 Days ........................................................... 13
Table 13: Activities Resulting in Lost Time, 2016, 91+ Days .......................................................................................... 13
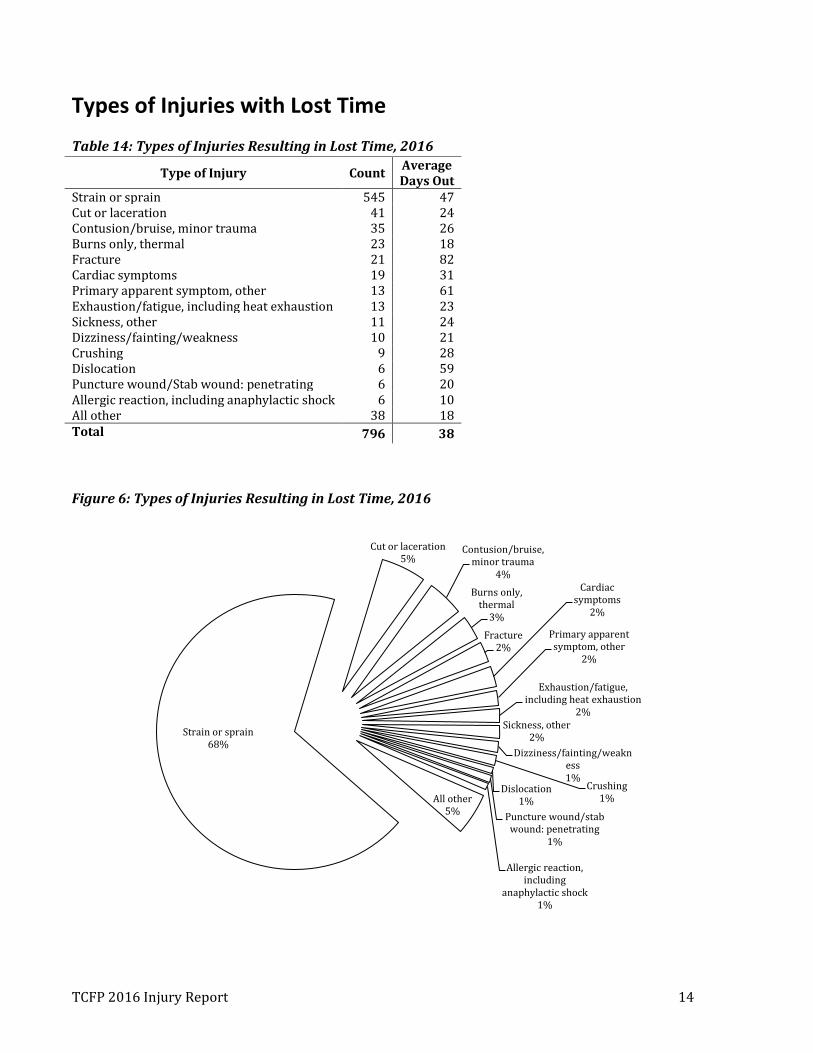
Types of Injuries with Lost Time ...................................................................................................................................................... 14
Table 14: Types of Injuries Resulting in Lost Time, 2016 ................................................................................................ 14
Figure 6: Types of Injuries Resulting in Lost Time, 2016 ................................................................................................. 14
Burn Injuries .............................................................................................................................................................................................. 15
Table 15: All Burns, 2013 - 2016 ................................................................................................................................................. 15
Table 16: Burns with Lost Time by Burn Type, 2016 ......................................................................................................... 15
Table 17: Burns by Body Part, 2013 – 2016 (ordered by 2016, descending) .......................................................... 15
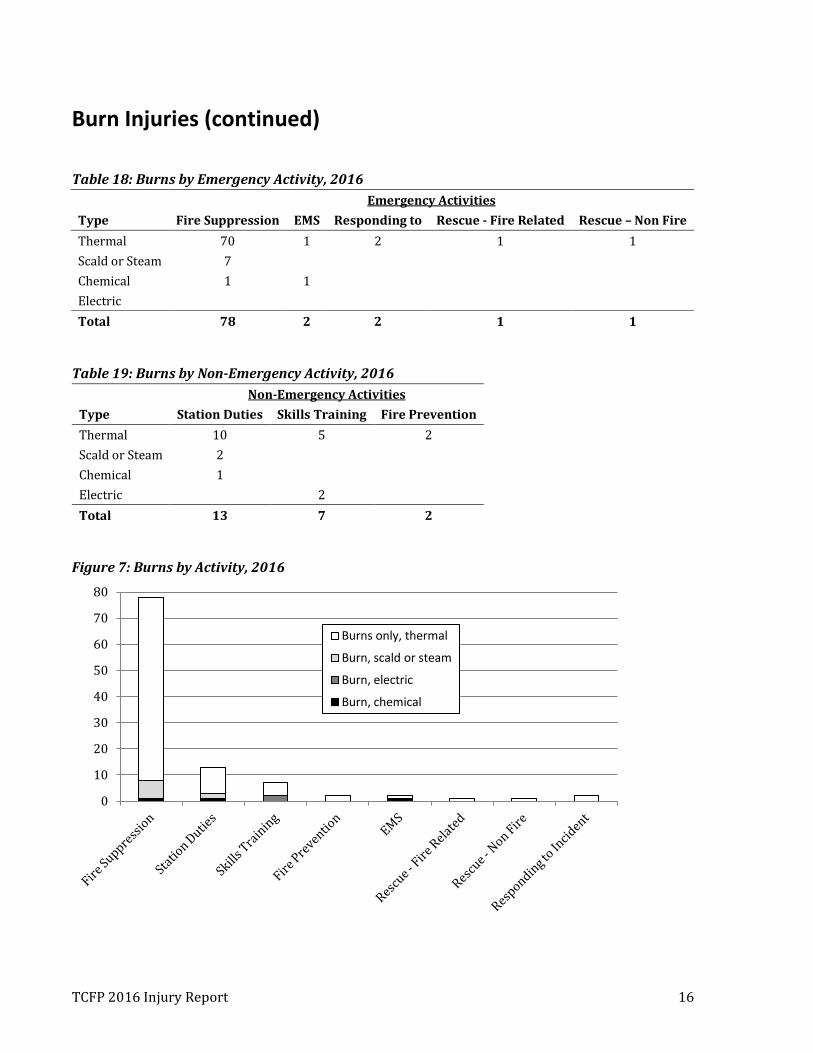
Burn Injuries (continued) .................................................................................................................................................................... 16
Table 18: Burns by Emergency Activity, 2016 ....................................................................................................................... 16
Table 19: Burns by Non-Emergency Activity, 2016 ............................................................................................................ 16
Figure 7: Burns by Activity, 2016 ................................................................................................................................................ 16
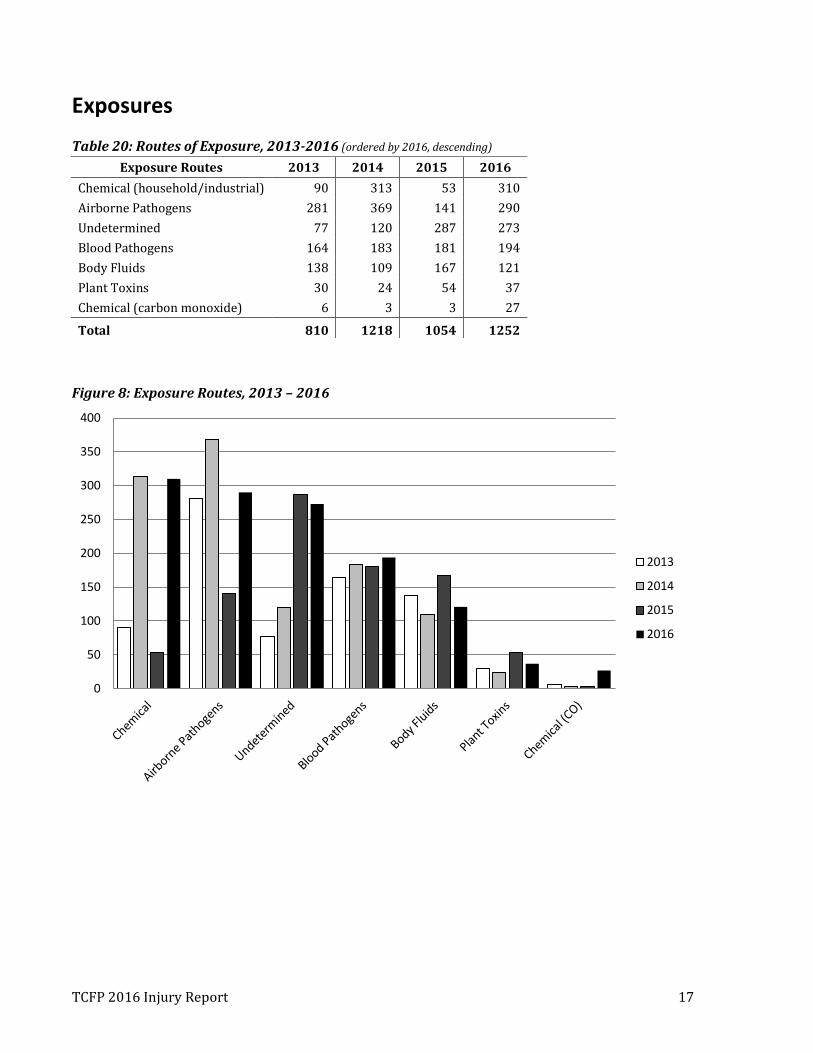
Exposures .................................................................................................................................................................................................... 17
Table 20: Routes of Exposure, 2013-2016 (ordered by 2016, descending) ............................................................. 17
Figure 8: Exposure Routes, 2013 – 2016 ................................................................................................................................. 17
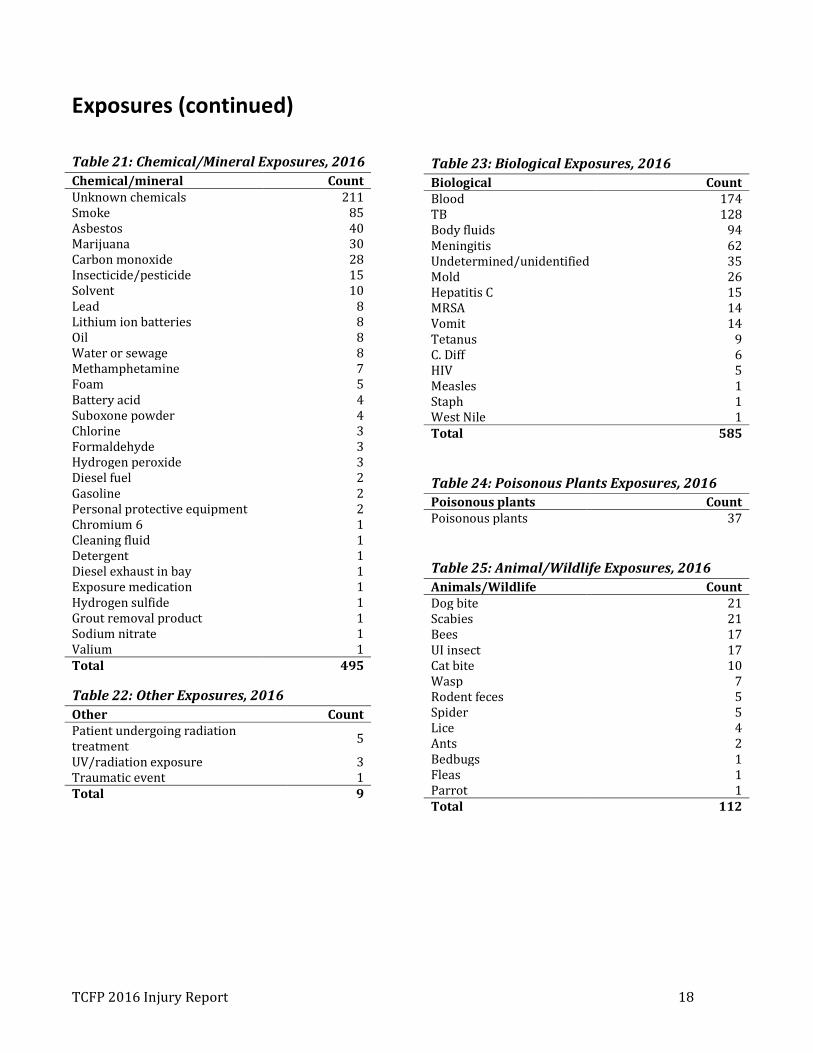
Exposures (continued) .......................................................................................................................................................................... 18
Table 21: Chemical/Mineral Exposures, 2016 ....................................................................................................................... 18
Table 22: Other Exposures, 2016 ................................................................................................................................................ 18
Table 23: Biological Exposures, 2016 ........................................................................................................................................ 18
Table 24: Poisonous Plants Exposures, 2016 ......................................................................................................................... 18
Table 25: Animal/Wildlife Exposures, 2016 ........................................................................................................................... 18
Cancer reports........................................................................................................................................................................................... 19
SOP Issues ................................................................................................................................................................................................... 20
Table 26: Injuries Attributed to SOP Issues, 2016 ............................................................................................................... 20
Fatalities ...................................................................................................................................................................................................... 20
Close-up: wellness/fitness injuries .................................................................................................................................................. 21
Table 27: Identified fitness activities resulting in injury, 2016 ..................................................................................... 21
Figure 9: Identified fitness/wellness activities resulting in injuries, 2016 .............................................................. 21
Close-up: skills training injuries ....................................................................................................................................................... 22
Table 28: Identified skills training activities resulting in injury, 2016 ....................................................................... 22
Figure 10: Identified skills training activities resulting in injuries, 2016.................................................................. 22
Comparison between the State of Texas (2016) and National Fire Protection Association (NFPA), U.S. Firefighter Injuries – 2015 .................................................................................................................................................................. 23

iii
Table 29: Comparison of Texas 2016 and NFPA 2015 ....................................................................................................... 23
Figure 11: Injuries by Activity Percentages – Comparing Texas 2016 and NFPA 2015 ...................................... 23
2016 Findings/Recommendations .................................................................................................................................................. 24
Commission-adopted standards .................................................................................................................................................. 24
TCFP 2016 Injury Report 1
Executive Summary This report includes the abstract, mission, reports, information and data collected by the Texas Commission on Fire Protection’s injury reporting program. The report includes fire fighter injuries reported to the Texas Commission on Fire Protection in 2016, with charts and graphs depicting the collected information. The report also compares Texas fire fighter injury statistics with statistics gathered by the National Fire Protection Association (NFPA) in 2015.
Under Texas Government Code §419.048, the Texas Commission on Fire Protection is charged with developing and establishing criteria to receive and analyze injury information pertaining to Texas fire fighters. The commission reviews this information to develop recommendations to help reduce fire protection personnel injuries. The commission provides this information to the State Fire Marshal’s Office (SFMO) by September 1 of each year for inclusion in the SFMO’s annual Firefighter Fatality Investigations Report. The commission has enacted rules about reporting injuries in the Texas Administrative Code (TAC) Title 37, Chapter 435, and has established the criteria and policies for reporting and analyzing the information.
The commission built the data systems necessary to gather this information in 2010. Development is ongoing as we receive feedback from stakeholders on the efficiency of the system. The reporting process is accomplished online. Fire departments regulated by the commission have been notified of the requirement to report. Several volunteer departments, which are not regulated by the commission, are also participating voluntarily.
This report concludes with recommendations from the commission to help reduce the number of fire fighter injuries in Texas and to improve the injury reporting program.
TCFP 2016 Injury Report 2
Abstract Texas fire departments reported 4,097 injuries to the Texas Commission on Fire Protection in calendar year 2016. Of these, 1,051 occurred during fire suppression activities, representing 26 percent of the total reported injuries. This represents a five percent increase in the ratio of fire suppression injuries to the total, which in 2015 accounted for 21 percent of injuries. Of the 1,051 fire suppression injuries, 179, or 17 percent, were serious injuries that resulted in lost time. (Note: The commission defines a serious injury as one which results in the employee missing one or more full duty shifts)
The second-largest number of reported injuries occurred during the performance of emergency medical services (EMS) activities: 1,041 of the 4,097 total reported injuries, or 25 percent of the total injuries. This represents nearly the same ratio of EMS injuries to total injuries in 2015, in which 979 of 3,721 total injuries, or 26.2 percent, occurred during EMS activities. Of the 1,041 EMS injuries, 158, or 15 percent, were serious.
After EMS and fire suppression, the next highest number of injuries reported in 2016 occurred in the performance of station duties, with 610, or 15 percent, of the total injuries. This is nearly the same result as in 2015, when 573, or 15.4 percent, of the total reported injuries occurred in the station.
Skills training and wellness/fitness again rounded out the top five activities resulting in injuries, with 454 skills training injuries (11 percent of the total) and 401 fitness/wellness injuries (10 percent).
The total number of injuries reported in station duties, skills training, and wellness/fitness activities (which are all non-emergency activities) represented just over a third (37 percent) of the total injuries. This represents a slight decrease in the ratio of non-emergency to emergency activities; in 2015, 39 percent of injuries occurred during non-emergency activities.

TCFP 2016 Injury Report 3
Mission The commission shall gather and evaluate data on fire protection personnel injuries and develop recommendations for reducing injuries.
Why we are collecting injury data Under Texas Government Code §419.048, the Texas Legislature charged the commission with gathering and evaluating data on injuries. The rules requiring regulated entities to report injuries to the commission are in Texas Administrative Code §435.23. The commission encourages volunteer entities to report injuries so that it can gain as accurate a picture as possible concerning injury trends in the Texas fire service. The injury reporting program began in March 2010.
Information the commission collects • Minor, serious, critical and fatal injuries • Activities where fire personnel are injured • Types of injuries (burns, strain-sprains, wounds, etc.) • Body parts being injured • Tasks performed at the time of injury • Missed time • Work assignment after injury • Malfunctions/failures of personal protective equipment (PPE), self-contained breathing apparatus
(SCBA), personal alert safety systems (PASS devices) and standard operating procedures (SOPs)
How this will help the fire service • Identify common injuries • Identify trends in injuries • Identify needed training • Evaluate and find improvements in procedures • Track lost time injuries (requested by user community)

TCFP 2016 Injury Report 4
Reports, Information and Data Collection This report contains data submitted by regulated and non-regulated entities. The data collected in 2016 was the sixth full year of reporting.
Of the approximately 575 commission-regulated fire departments included in this report, 553, or 96 percent, either submitted an injury report or a “no injury” report for months in which their personnel did not have any injuries. The commission stresses the need for participation and provides reminders to regulated entities of the statutory requirement to report.
TCFP 2016 Injury Report 5
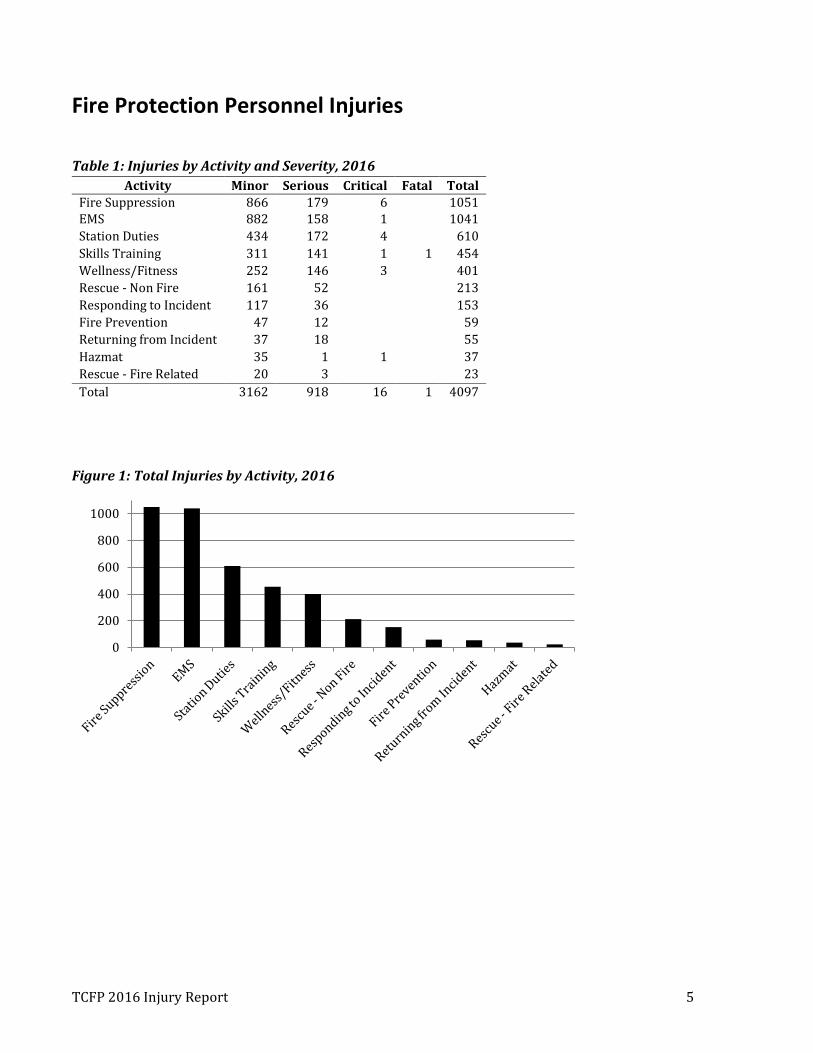
Fire Protection Personnel Injuries
Table 1: Injuries by Activity and Severity, 2016 Activity Minor Serious Critical Fatal Total
Fire Suppression 866 179 6
1051 EMS 882 158 1
1041
Station Duties 434 172 4
610 Skills Training 311 141 1 1 454 Wellness/Fitness 252 146 3
401
Rescue - Non Fire 161 52
213 Responding to Incident 117 36
153
Fire Prevention 47 12
59 Returning from Incident 37 18
55
Hazmat 35 1 1
37 Rescue - Fire Related 20 3
23
Total 3162 918 16 1 4097
Figure 1: Total Injuries by Activity, 2016
0
200
400
600
800
1000

TCFP 2016 Injury Report 6
Minor and Serious Injuries by Activity EMS activities resulted in the highest number of minor injuries. There has been a slight decline in serious fire suppression injuries over the past five years. (See Table 3. The commission defines a serious injury as one which results in the employee missing one or more full duty shifts.)
Table 2: Minor Injury Activities, 2012 - 2016
2012 2013 2014 2015 2016 Activity Count Percent Count Percent Count Percent Count Percent Count Percent
EMS 1042 32.41% 934 30.28% 900 28.03% 792 28.25% 882 28.63% Fire Suppression 654 20.43% 619 20.06% 808 25.16% 618 22.04% 866 28.11% Station Duties 508 15.80% 452 14.65% 465 14.48% 396 14.12% 434 14.09% Skills Training 367 11.42% 317 10.28% 365 11.37% 288 10.27% 311 10.09% Wellness/Fitness 294 9.14% 285 9.24% 254 7.91% 278 9.88% 252 8.18% Rescue - Non Fire 147 4.57% 243 7.88% 206 6.42% 204 7.28% 161 5.23% Responding to Incident 90 2.80% 70 2.27% 105 3.27% 122 4.35% 117 3.80%
Fire Prevention 45 1.40% 66 2.14% 43 1.34% 41 1.46% 47 1.53% Returning from Incident 30 0.93% 37 1.20% 42 1.31% 33 1.18% 37 1.20%
Hazmat 24 0.75% 44 1.43% 12 0.37% 11 0.39% 35 1.14% Rescue - Fire Related 14 0.44% 18 0.58% 11 0.34% 22 0.78% 20 0.65%
Total 3215 100% 3085 100% 3211 100% 2805 100% 3162 100%
Table 3: Serious Injury Activities, 2012 - 2016
2012 2013 2014 2015 2016 Activity Count Percent Count Percent Count Percent Count Percent Count Percent
Fire Suppression 231 22.36% 206 21.89% 177 21.48% 160 17.82% 179 19.50% Station Duties 233 22.56% 201 21.36% 160 19.42% 174 19.27% 172 17.21% EMS 196 18.97% 179 19.02% 164 19.90% 185 20.60% 158 18.74% Wellness/Fitness 134 12.97% 122 12.96% 127 15.41% 125 14.03% 146 15.36% Skills Training 113 10.94% 99 10.52% 104 12.62% 126 13.92% 141 15.90% Rescue - Non Fire 34 3.29% 46 4.89% 38 4.61% 46 5.01% 52 5.66% Responding to Incident 43 4.16% 42 4.46% 16 1.94% 44 4.90% 36 3.92%
Returning from Incident 24 2.32% 18 1.91% 19 2.31% 13 1.34% 18 1.31%
Fire Prevention 18 1.74% 17 1.81% 11 1.33% 12 1.34% 11 1.96% Rescue - Fire Related 7 0.68% 11 1.17% 3 0.36% 12 1.34% 3 0.33% Hazmat 0 0 0 0 5 0.61% 4 0.45% 1 0.11%
Total 1033 100.00% 941 100.00% 824 100.00% 901 100.00% 918 100%

TCFP 2016 Injury Report 7
Emergency vs. Non-Emergency Injuries
Table 4: Injuries by Emergency Activity and Severity, 2016 Activity Minor Serious Critical Fatal Total
Fire Suppression 866 179 6
1051 EMS 882 158 1
1041
Rescue - Non Fire 161 52
213 Responding to Incident 117 36
153
Returning from Incident 37 18
55 Hazmat 35 1 1 37 Rescue – Fire Related 20 3 23 Total 2118 447 8 0 2573
Table 5: Injuries by Non-Emergency Activity and Severity, 2016 Activity Minor Serious Critical Fatal Total
Station Duties 434 172 4
610 Skills Training 311 141 1 1 454 Wellness/Fitness 252 146 3
401
Fire Prevention 47 12
59 Total 1044 471 8 1 1524
Figure 2: Percent of Injuries in Emergency and Non-Emergency Activities, 2016
Fire Suppression, 25.72%
EMS, 25.47%
Rescue - Non Fire, 5.00%
Responding to Incident, 3.80%
Returning from Incident.1%
Hazmat, 0.92%
Rescue - Fire Related, 0.57%
Station Duties, 14.62%
Skills Training,
12% Wellness/Fitness, 9.85%
Fire Prevention, 1.45%
Emergency Activities (white) - 63% Non-Emergency Activities (gray) - 37%

TCFP 2016 Injury Report 8
Injuries by Type
Table 6: Types of Injury, 2012-2016 (Note: ordered by 2016, descending)
2012 2013 2014 2015 2016 Type of Injury Count Percent Count Percent Count Percent Count Percent Count Percent
Strain-Sprain 2140 50.19% 2118 52.28% 1917 47.27% 1839 49.42% 1842 44.96% Exposures 862 20.22% 786 19.40% 1117 27.55% 868 23.33% 1092 26.65% Wound 631 14.80% 548 13.53% 483 11.91% 491 13.20% 492 12.01% Environmental 133 3.12% 106 2.62% 101 2.49% 142 3.82% 191 4.66% Burns 176 4.13% 166 4.10% 113 2.79% 95 2.55% 113 2.76% Pain Medical Unspecified 49 1.15% 62 1.53% 79 1.95% 66 1.77% 94 2.29% Bites-Stings 93 2.18% 87 2.15% 79 1.95% 69 1.85% 83 2.03% Chest Pains-Cardiac 40 0.94% 50 1.23% 46 1.13% 37 0.99% 49 1.20% Fractures 46 1.08% 59 1.46% 39 0.96% 40 1.07% 41 1.00% Hearing Loss - Chronic 7 0.16% 2 0.05% 4 0.10% 7 0.19% 35 0.85% Debris/Penetrating 51 1.20% 38 0.94% 38 0.94% 34 0.91% 35 0.85% Hearing Loss - Acute 18 0.42% 14 0.35% 21 0.52% 19 0.51% 17 0.41% Electrocution 11 0.26% 12 0.30% 12 0.30% 9 0.24% 9 0.22% Stroke 1 0.02% 0 0.00% 1 0.02% 0 0.00% 2 0.05% Broken Spine-Neck 4 0.09% 1 0.02% 4 0.10% 2 0.05% 1 0.02% Heart Attack 2 0.05% 2 0.05% 1 0.02% 3 0.08% 1 0.02%
Total 4264 100% 4051 100% 4055 100% 3721 100% 4097 100.00%
Figure 3: Types of Injury, 2016
Strain-Sprain 45%
Exposures 27%
Wound 12%
Environmental 5%
Burns 3% Pain Medical
Unspecified 2% Bites-Stings
2% All other 4%

TCFP 2016 Injury Report 9
Task at Time of Injury (The commission began gathering task information in mid-2012.)
Table 7: Top 15 Tasks at Time of Injury, 2013-2016 (ordered by 2016, descending) Task 2013 2014 2015 2016
Extinguishing fire 609 669 513 837 Providing EMS care 708 686 649 661 Physical fitness activity 413 376 442 420 Training activity 344 317 193 331 Lifting/moving patient (EMS) 357 171 275 306 Moving about station, normal activity 278 335 206 252 Mounting/dismounting apparatus 206 367 180 193 Moving/picking up tools or equipment 92 173 128 142 Rescue, other 193 110 155 118 Deploying and extending hoseline 74 82 108 111 Slips/trips/falls 131 171 215 105 Driving/riding in a vehicle 72 94 82 70 Equipment Maintenance 59 43 29 57 Station Maintenance 37 26 81 59 Responding to/returning from incident 62 56 59 55 All other* 416 379 406 380* Total 4051 4055 3721 4097
*All other, 2016: Other: Description: 54; Vehicle Maintenance: 51; Overhaul: 35; Extrication: 30; Operating manual tool: 29; Ascending/descending stairs: 28; Forcible Entry: 19; Ascending/descending ladder: 18; Moving about station, alarm sounding: 17; Inspection Activity: 15; Operating power tool: 14; Non-Fire Incidents: 12; Manually moving item to gain access: 11; Incident Investigation: 9; Operating in low/no visibility: 8; Unidentified: 6; Crawling in a confined or otherwise hazardous area: 6; Raising/lowering ladder: 6; Operating Fire Department Apparatus: 5; Operating nozzle: 4; Salvage: 2; Removing equipment from/returning equipment to apparatus: 1
Figure 4: Top 15 Tasks at Time of Injury, 2013-2016
0 100 200 300 400 500 600 700 800 900
2013
2014
2015
2016
TCFP 2016 Injury Report 10
Injuries by Body Part
Table 8: Injuries by Body Part, 2012 – 2016 (ordered by 2016, descending) Body Part 2012 2013 2014 2015 2016
Multiple body parts, whole body 760 595 901 659 1007 Knee 419 407 367 369 376 Hand and fingers 453 403 345 328 359 Hip, lower back, or buttocks 35 91 244 316 283 Back, except spine 686 588 372 207 244 Shoulder 272 293 230 241 238 Ankle 213 207 177 202 192 Leg, lower 105 108 86 117 132 Multiple Parts 5 62 160 180 124 Face 95 128 118 140 116 Arm, lower, not including elbow or wrist 89 84 94 84 109 Foot and toes 132 105 79 71 85 Chest 30 66 64 40 82 Head 96 94 73 69 82 Ear 72 54 52 60 74 Wrist 71 79 68 48 74 Eye 106 100 98 75 70 Multiple body parts, upper body 22 57 27 52 61 Elbow 98 68 66 51 47 Other body parts injured 357 381 265 500* 342* Total 4264 4051 4055 3721 4097
* Other body parts injured, 2016, in descending order: Abdomen: 50; Neck: 45; Trachea and lungs: 43; Upper extremities: 33; Arm, upper, not including elbow or shoulder: 33; Pelvis or groin: 31; Leg, upper: 22; Neck and Shoulders: 21; Lower Extremities: 18; Mouth, included are lips, teeth, and interior: 18; Undetermined: 9; Multiple body parts, lower body: 6; Part of body, other: 4; Throat: 3; Heart: 2; Nose: 2; Internal: 1; Spine: 1

TCFP 2016 Injury Report 11
Injuries by Age Group
Table 9: Injuries by Age Group, 2012 - 2016
2012 2013 2014 2015 2016 Age group Count Percent Count Percent Count Percent Count Percent Count Percent
< 18 0 0.00% 0 0.00% 1 0.02% 0 0.00% 0 0.00% 18-24 254 5.96% 219 5.41% 178 4.39% 187 5.03% 213 5.20% 25-29 594 13.93% 584 14.42% 573 14.13% 543 14.59% 570 13.91% 30-34 925 21.69% 799 19.73% 749 18.47% 791 21.26% 812 19.82% 35-39 821 19.25% 729 18.00% 833 20.54% 682 18.33% 792 19.33% 40-44 621 14.56% 620 15.31% 674 16.62% 582 15.64% 634 15.47% 45-49 435 10.20% 443 10.94% 438 10.80% 405 10.88% 513 12.52% 50-54 373 8.75% 402 9.90% 380 9.37% 323 8.68% 313 7.64% 55-59 193 4.53% 198 4.89% 173 4.27% 181 4.86% 196 4.78% 60-64 41 0.96% 51 1.26% 49 1.21% 20 0.54% 50 1.22% 65-70 7 0.16% 6 0.15% 6 0.15% 5 0.13% 4 0.10% > 70 0 0.00% 0 0.00% 1 0.02% 2 0.05% 0 0.00%
Totals 4264 100.00% 4051 100.00% 4055 100.00% 3721 100.00% 4097 100.00%
Figure 5: Injury Percentages by Age Group, 2012 - 2016
0%
5%
10%
15%
20%
< 18 18-24 25-29 30-34 35-39 40-44 45-49 50-54 55-59 60-64 65-70 > 70
TCFP 2016 Injury Report 12
Injury Activities Resulting in Lost Time
Table 10: Injury Activities Resulting in Lost Time, Totals, 2016
Days Missed Activity Count Average Total Station Duties 149 43 6370 Fire Suppression 154 40 6170 EMS 141 43 6009 Skills Training 116 50 5743 Wellness/Fitness 129 41 5272 Rescue - Non Fire 46 29 1319 Responding to Incident 30 42 1258 Returning from Incident 13 49 631 Fire Prevention 13 39 506 Rescue - Fire Related 3 8 24 Hazmat 2 10 20 Total 796 36 33322
Table 11: Activities Resulting in Lost Time, 2016, between 1 and 30 Days
Days Missed Activity Count Average Total Fire Suppression 100 12 1178 Wellness/Fitness 86 12 1024 Station Duties 86 12 1013 EMS 79 13 1004 Skills Training 68 10 685 Rescue - Non Fire 34 12 397 Responding to Incident 22 12 266 Fire Prevention 11 10 113 Returning from Incident 7 14 100 Rescue - Fire Related 3 8 24 Hazmat 2 10 20 Total, Between 1 and 30 Days
498 11 5824
TCFP 2016 Injury Report 13
Injury Activities Resulting in Lost Time (continued)
Table 12: Activities Resulting in Lost Time, 2016, between 31 and 90 Days Days Missed
Activity Count Average Total
EMS 46 56 2563 Station Duties 42 53 2234 Fire Suppression 37 54 2006 Skills Training 28 50 1405 Wellness/Fitness 23 55 1271 Rescue - Non Fire 10 61 608 Returning from Incident 5 58 288 Responding to Incident 2 56 111 Total, Between 31 and 90 Days
193 55 10486
Table 13: Activities Resulting in Lost Time, 2016, 91+ Days Days Missed
Activity Count Average Total
Skills Training 19 172 3273 Wellness/Fitness 19 151 2868 Station Duties 19 146 2765 Fire Suppression 15 180 2703 EMS 14 140 1958 Responding to Incident 6 147 881 Rescue - Non Fire 2 157 314 Fire Prevention 1 188 188 Total, 91+ Days Missed
95 160 14950
TCFP 2016 Injury Report 14
Types of Injuries with Lost Time
Table 14: Types of Injuries Resulting in Lost Time, 2016
Type of Injury Count Average Days Out
Strain or sprain 545 47 Cut or laceration 41 24 Contusion/bruise, minor trauma 35 26 Burns only, thermal 23 18 Fracture 21 82 Cardiac symptoms 19 31 Primary apparent symptom, other 13 61 Exhaustion/fatigue, including heat exhaustion 13 23 Sickness, other 11 24 Dizziness/fainting/weakness 10 21 Crushing 9 28 Dislocation 6 59 Puncture wound/Stab wound: penetrating 6 20 Allergic reaction, including anaphylactic shock 6 10 All other 38 18 Total 796 38
Figure 6: Types of Injuries Resulting in Lost Time, 2016
Strain or sprain 68%
Cut or laceration 5%
Contusion/bruise, minor trauma
4%
Burns only, thermal
3%
Fracture 2%
Cardiac symptoms
2%
Primary apparent symptom, other
2%
Exhaustion/fatigue, including heat exhaustion
2% Sickness, other
2% Dizziness/fainting/weakn
ess 1%
Crushing 1%
Dislocation 1%
Puncture wound/stab wound: penetrating
1%
Allergic reaction, including
anaphylactic shock 1%
All other 5%

TCFP 2016 Injury Report 15
Burn Injuries
Table 15: All Burns, 2013 - 2016 All Burns - Types 2013 2014 2015 2016 Thermal 92 76 85 92 Scald or steam 71 33 10 9 Electric 2 2 0 2 Chemical 0 2 0 3 Total 165 113 95 106
Table 16: Burns with Lost Time by Burn Type, 2016
Burns with Lost Time Count Average Days Missed
Total Days Missed
Thermal 23 18 404
Table 17: Burns by Body Part, 2013 – 2016 (ordered by 2016, descending) Body Part 2013 2014 2015 2016
Hand and fingers 35 18 14 27 Face 14 13 12 16 Ear 29 13 22 14 Wrist 10 5 4 9 Multiple body parts, upper body 3 4 5 8 Multiple parts 16 16 8 4 Neck 9 9 6 4 Foot and toes 5 2 1 3 Leg, lower 4 1 6 3 Shoulder 13 5 5 3 Unidentified 0 0 0 3 Arm, lower, not including elbow or wrist 12 9 3 2 Head 5 3 4 2 Lower extremities 5 2 1 2 Upper extremities 0 6 2 2 Arm, upper, not including elbow or shoulder 1 2 2 1 Chest 1 0 0 1 Hip, lower back or buttocks 0 1 0 1 Knee 1 0 0 1 Back, except spine 0 2 0 0 Elbow 1 0 0 0 Eye 0 1 0 0 Neck and shoulders 1 1 0 0 Throat 1 0 0 0 Total 166 113 95 106
TCFP 2016 Injury Report 16
Burn Injuries (continued)
Table 18: Burns by Emergency Activity, 2016
Emergency Activities Type Fire Suppression EMS Responding to Rescue - Fire Related Rescue – Non Fire Thermal 70 1 2 1 1 Scald or Steam 7 Chemical 1 1 Electric Total 78 2 2 1 1
Table 19: Burns by Non-Emergency Activity, 2016
Non-Emergency Activities Type Station Duties Skills Training Fire Prevention Thermal 10 5 2 Scald or Steam 2 Chemical 1 Electric 2 Total 13 7 2
Figure 7: Burns by Activity, 2016
0
10
20
30
40
50
60
70
80
Burns only, thermal
Burn, scald or steam
Burn, electric
Burn, chemical
TCFP 2016 Injury Report 17
Exposures
Table 20: Routes of Exposure, 2013-2016 (ordered by 2016, descending) Exposure Routes 2013 2014 2015 2016
Chemical (household/industrial) 90 313 53 310 Airborne Pathogens 281 369 141 290 Undetermined 77 120 287 273 Blood Pathogens 164 183 181 194 Body Fluids 138 109 167 121 Plant Toxins 30 24 54 37 Chemical (carbon monoxide) 6 3 3 27
Total 810 1218 1054 1252
Figure 8: Exposure Routes, 2013 – 2016
0
50
100
150
200
250
300
350
400
2013
2014
2015
2016
TCFP 2016 Injury Report 18
Exposures (continued)
Table 21: Chemical/Mineral Exposures, 2016 Chemical/mineral Count Unknown chemicals 211 Smoke 85 Asbestos 40 Marijuana 30 Carbon monoxide 28 Insecticide/pesticide 15 Solvent 10 Lead 8 Lithium ion batteries 8 Oil 8 Water or sewage 8 Methamphetamine 7 Foam 5 Battery acid 4 Suboxone powder 4 Chlorine 3 Formaldehyde 3 Hydrogen peroxide 3 Diesel fuel 2 Gasoline 2 Personal protective equipment 2 Chromium 6 1 Cleaning fluid 1 Detergent 1 Diesel exhaust in bay 1 Exposure medication 1 Hydrogen sulfide 1 Grout removal product 1 Sodium nitrate 1 Valium 1 Total 495
Table 22: Other Exposures, 2016 Other Count Patient undergoing radiation treatment 5
UV/radiation exposure 3 Traumatic event 1 Total 9
Table 23: Biological Exposures, 2016 Biological Count Blood 174 TB 128 Body fluids 94 Meningitis 62 Undetermined/unidentified 35 Mold 26 Hepatitis C 15 MRSA 14 Vomit 14 Tetanus 9 C. Diff 6 HIV 5 Measles 1 Staph 1 West Nile 1 Total 585
Table 24: Poisonous Plants Exposures, 2016 Poisonous plants Count Poisonous plants 37
Table 25: Animal/Wildlife Exposures, 2016 Animals/Wildlife Count Dog bite 21 Scabies 21 Bees 17 UI insect 17 Cat bite 10 Wasp 7 Rodent feces 5 Spider 5 Lice 4 Ants 2 Bedbugs 1 Fleas 1 Parrot 1 Total 112

TCFP 2016 Injury Report 19
Cancer reports The commission received 14 reports of cancer diagnoses from fire departments in 2016. The commission encourages departments to report these illnesses to help the Texas fire service gain a better understanding of long-term illnesses from which fire protection personnel are suffering:
Male, 54 Five pre-cancerous sites on scalp.
Male, 48
Multiple myeloma. Male, 41
Cancer diagnosis. Male, 57
Prostate cancer. Male, 46
Cancer diagnosis. Male, 59
Squamous cell carcinoma. Male, 51
Thyroid cancer. Male, 31
Cancer diagnosis. Male, 33
Thyroid cancer, papillary carcinoma. Male, 39
Skin cancer, upper body. Male, 43
Basal cell skin cancer. Male, 33
Testicular cancer. Male, 44
Cancer, internal organs. Male, 52
Skin cancer, upper body.

TCFP 2016 Injury Report 20
SOP Issues In 2016 there were 24 injuries attributed to failures of fire protection personnel to follow their departments’ standard operating procedures (SOPs). All but a few were instances where the individuals were not wearing their provided PPE/SCBA gear in an environment or situation in which they should have been.
In its compliance inspections, the Texas Commission on Fire Protection verifies that fire departments have written SOPs that cover the appropriate subject matter.
Table 26: Injuries Attributed to SOP Issues, 2016 Activity Minor Serious Total
Fire Suppression 8 4 12 Wellness/Fitness 2 2 4 EMS 3 3 Skills Training 1 2 3 Rescue - Non Fire 1 1 Station Duties 1 1
Total 14 10 24
Fatalities The commission’s 2016 injury report includes one fatality. Fatalities listed in this report include only those reported to the Texas Commission on Fire Protection (TCFP) by the entities it regulates. (The commission has no statutory authority to require reporting by departments it does not regulate.)
The State Fire Marshal’s Office investigated four Texas fire fighter LODDs in 2016. (Comprehensive information regarding Texas fire service deaths is included in the State Fire Marshal’s Annual Report and on its website at http://www.tdi.texas.gov/fire/fmloddindividuals.html.
TCFP 2016 Injury Report 21
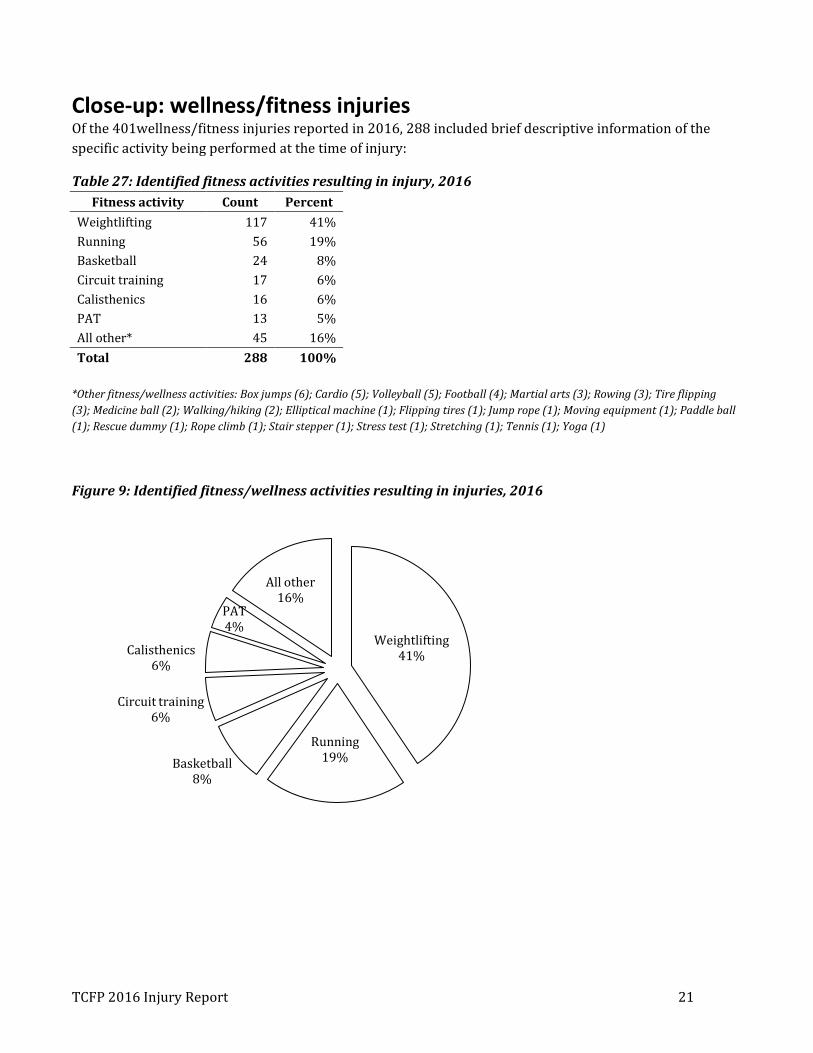
Close-up: wellness/fitness injuries Of the 401wellness/fitness injuries reported in 2016, 288 included brief descriptive information of the specific activity being performed at the time of injury:
Table 27: Identified fitness activities resulting in injury, 2016 Fitness activity Count Percent
Weightlifting 117 41% Running 56 19% Basketball 24 8% Circuit training 17 6% Calisthenics 16 6% PAT 13 5% All other* 45 16% Total 288 100%
*Other fitness/wellness activities: Box jumps (6); Cardio (5); Volleyball (5); Football (4); Martial arts (3); Rowing (3); Tire flipping (3); Medicine ball (2); Walking/hiking (2); Elliptical machine (1); Flipping tires (1); Jump rope (1); Moving equipment (1); Paddle ball (1); Rescue dummy (1); Rope climb (1); Stair stepper (1); Stress test (1); Stretching (1); Tennis (1); Yoga (1)
Figure 9: Identified fitness/wellness activities resulting in injuries, 2016
Weightlifting 41%
Running 19% Basketball
8%
Circuit training 6%
Calisthenics 6%
PAT 4%
All other 16%

TCFP 2016 Injury Report 22
Close-up: skills training injuries Of the 454 skills training injuries reported in 2016, 374 included brief descriptive information of the specific activity being performed at the time of injury:
Table 28: Identified skills training activities resulting in injury, 2016 Skills training activity Count Percent Hose 72 19% Water rescue 37 10% SCBA training 26 7% Ladder 22 6% Extrication 20 5% Bailout 19 5% Live fire 18 5% Rapid intervention training 12 3% Survival 12 3% Stairs 11 3% Mount/dismount 10 3% Drag and carry 8 2% Forcible entry 8 2% Job tasks 8 2% All other* 91 24% Total 374 100%
*Other skills training activities: Rope training (7); Search and rescue (7); EMT training (6); Moving equipment (6); Obstacle course (6); Running/walking/fitness (8); Martial arts (4); Power tool (4); Technical rescue (4); PAT (3); Active shooter (2); Blackout maze (2);Confidence course (2); Drill tower (2); High angle rescue (2); Rappelling (2); Ventilation (2); Wildland (2); Airbag (1); Apparatus (1);Car fire (1); Classroom (1); Confined space (1); Cycling (1); Denver drill (1); High rise (1); Hiking (1); Mayday training (1); Pittsburg drill (1); Salvage and overhaul (1); Search drill (1); Self evacuation (1); Sled (1); Slips, trips and falls (1); Structural collapse (1); UTV (1); Weapons (1); Weighted dummy (1)
Figure 10: Identified skills training activities resulting in injuries, 2016
All other 24%
Hose 19%
Water rescue 10%
SCBA training 7%
Ladder 6%
Extrication 6% Bailout
5% Live fire 5%
Rapid intervention
training 3%
Survival 3%
Stairs 3%
Mount/dismount
3%
Drag and carry 2%
Forcible entry 2%
Job tasks 2%

TCFP 2016 Injury Report 23
Comparison between the State of Texas (2016) and National Fire Protection Association (NFPA), U.S. Firefighter Injuries – 2015 For the purposes of comparison, the commission has mapped its categories to the NFPA categories as follows:
• “Fireground” includes the commission’s Fire Suppression and Rescue – Fire Related. • “Non-Fire” includes Rescue Non-Fire, EMS and Hazmat. • “Other On-Duty” includes Fire Prevention, Station Duties and Wellness/Fitness.
The NFPA’s “Responding and Returning” and “Training” categories appear to correspond closely to the commission’s categories. (The NFPA numbers include Texas statistics, although the reporting populations may not be the same.)
Table 29: Comparison of Texas 2016 and NFPA 2015
Texas 2016 NFPA 2015* Category Count Percent Count Percent
Fireground 1074 26% 29130 43% Non-Fire 1291 32% 14320 21% Other On-Duty 1070 26% 13275 19% Training 454 11% 7560 11% Responding and Returning 208 5% 3800 6%
Total 4097 100% 68085 100% * NFPA data is from U.S. Firefighter Injuries – 2015, copyright© 2016 National Fire Protection Association, Quincy, MA.
Figure 11: Injuries by Activity Percentages – Comparing Texas 2016 and NFPA 2015
0%
5%
10%
15%
20%
25%
30%
35%
40%
45%
Fireground Non-Fire Other On-Duty Training Responding and Returning
Texas 2016
NFPA 2015
TCFP 2016 Injury Report 24
2016 Findings/Recommendations
The commission would like to thank Texas fire departments for their ongoing participation in reporting fire protection personnel injuries. This report would not be possible without their efforts.
The commission strongly encourages fire departments to continue reporting exposures and further encourages departments to report cancer diagnoses; the commission recognizes that the number of job-related cancers reported during this time period represents only a small fraction of the cases that Texas fire departments are currently managing. There is a growing awareness of the impact that cancer is having on fire protection personnel nationwide, and the commission urges departments to use this reporting tool to help contribute to the education and awareness of the issue in Texas.
Commission-adopted standards The commission has adopted several NFPA and other nationally recognized standards to help keep Texas fire protection personnel safe. This list summarizes the relationships between some of the Texas laws and national standards and is not intended to be all-inclusive:
Texas Government Code
§419.040, Protective Clothing
§419.041, Self-Contained Breathing Apparatus
§419.042, Personal Alert Safety Systems
§419.043, Applicable National Fire Protection Association Standard
§419.044, Incident Management System
§419.045, Personnel Accountability System
§419.046, Fire Protection Personnel Operating at Emergency Incidents
§419.047, Commission Enforcement
Texas Administrative Code
CHAPTER 425 FIRE SERVICE INSTRUCTORS
§443.9 National Fire Protection Association Standard
CHAPTER 435 FIRE FIGHTER SAFETY
§435.21 Fire Service Joint Labor Management Wellness-Fitness Initiative
§435.23 Fire Fighter Injuries

TCFP 2016 Injury Report 25
§435.25 Courage to be Safe So Everyone Goes Home Program
§435.27 Live Fire Training Structure Evolutions
CHAPTER 451 FIRE OFFICER
CHAPTER 457 INCIDENT SAFETY OFFICER CERTIFICATION
See also the commission’s web page: NFPA Standards adopted by the commission.