Infant and Child Injuries in Georgia: A Study Comparing Injuries...
24
1 Infant and Child Injuries in Georgia: A Study Comparing Injuries in Child Care Facilities with Infant and Child Injuries in the General Population (Using Emergency Room and Hospital Data) by Dr. John Carter Introduction When families entrust their children to a child care provider, the parents expect that the children will be safe while in the provider’s care. In general, this is the case; but occasionally a child will suffer an injury while in a child care setting. The Georgia State Advisory Council on Early Childhood Education and Care commissioned this study to determine if the risk of injury to children from birth to age five in child care settings is greater than the risk of injury to the same age children in the general population. The first section of this report describes the incidence of injuries requiring emergency room care or hospitalization in Georgia for infants and children through the age of five. The second section describes a database of injury incidents in child care facilities requiring medical attention reported to the Georgia Department of Early Care and Learning (DECAL). The database is used to estimate the incidence of injuries in child care settings. The child care population is assumed to be a subset of the general population, and if the child care injury is treated in an emergency room (ER) or hospital, the injury will be captured in the ER/hospital discharge (HD) database and the DECAL incident reports. Section 1: A Description of Injury-Related Medical Services (Emergency Room Visits/Hospital Discharges), Ages 0-5, Georgia Residents, 2008-2010 The purpose of this section is to describe the incidence of child (less than six years of age) injuries that require medical services. The database for the analysis is drawn from the Georgia Hospital Discharge Data (HDDS) collected by the Georgia Hospital Association (GHA) and maintained by the Office of Health Indicators for Planning (OHIP) of the Georgia Department of Public Health. The database includes only ER visits and hospital discharges (HD). Injuries treated in physicians’ offices or clinics are not captured in the HDDS, so the true incidence of injury is higher than the estimate. Database Creation: The HDDS records include a set (up to 10 per record) of ICD9 (International Classification of Diseases, 9 th Revision) diagnostic codes. Events (ER visits or HDs) associated with injuries are identified through two ranges of ICD9 codes. The “external cause” of the injury is identified by an “e-code” that includes values from “E800” through “E999” and may include an additional decimal place in the numeric range. An example of an e- code is E881.0, “Fall from ladder.” Procedures published by the State and Territorial Injury Prevention Directors Association (STIPDA) define the process for identifying the “Underlying Cause” from a set of e-codes in a list of ICD9 codes. OHIP applies the STIPDA rules to define
Transcript of Infant and Child Injuries in Georgia: A Study Comparing Injuries...

1
Infant and Child Injuries in Georgia:
A Study Comparing Injuries in Child Care Facilities with Infant
and Child Injuries in the General Population
(Using Emergency Room and Hospital Data) by
Dr. John Carter
Introduction
When families entrust their children to a child care provider, the parents expect that the children
will be safe while in the provider’s care. In general, this is the case; but occasionally a child will
suffer an injury while in a child care setting. The Georgia State Advisory Council on Early
Childhood Education and Care commissioned this study to determine if the risk of injury to
children from birth to age five in child care settings is greater than the risk of injury to the same
age children in the general population.
The first section of this report describes the incidence of injuries requiring emergency room care
or hospitalization in Georgia for infants and children through the age of five. The second section
describes a database of injury incidents in child care facilities requiring medical attention
reported to the Georgia Department of Early Care and Learning (DECAL). The database is used
to estimate the incidence of injuries in child care settings. The child care population is assumed
to be a subset of the general population, and if the child care injury is treated in an emergency
room (ER) or hospital, the injury will be captured in the ER/hospital discharge (HD) database
and the DECAL incident reports.
Section 1: A Description of Injury-Related Medical Services (Emergency Room
Visits/Hospital Discharges), Ages 0-5, Georgia Residents, 2008-2010
The purpose of this section is to describe the incidence of child (less than six years of age)
injuries that require medical services. The database for the analysis is drawn from the Georgia
Hospital Discharge Data (HDDS) collected by the Georgia Hospital Association (GHA) and
maintained by the Office of Health Indicators for Planning (OHIP) of the Georgia Department of
Public Health. The database includes only ER visits and hospital discharges (HD). Injuries
treated in physicians’ offices or clinics are not captured in the HDDS, so the true incidence of
injury is higher than the estimate.
Database Creation: The HDDS records include a set (up to 10 per record) of ICD9
(International Classification of Diseases, 9th Revision) diagnostic codes. Events (ER visits or
HDs) associated with injuries are identified through two ranges of ICD9 codes. The “external
cause” of the injury is identified by an “e-code” that includes values from “E800” through
“E999” and may include an additional decimal place in the numeric range. An example of an e-
code is E881.0, “Fall from ladder.” Procedures published by the State and Territorial Injury
Prevention Directors Association (STIPDA) define the process for identifying the “Underlying
Cause” from a set of e-codes in a list of ICD9 codes. OHIP applies the STIPDA rules to define

2
the variable “UNDERLY” in the HDDS database. Any record with an identified e-code for
UNDERLY was included in the analysis data set.
The ICD9 codes 800 through 999 (with up to two additional decimal places) identify injury or
poisoning events. In general, records with codes in this range should also have an e-code. Some
records with an injury code do not have a reported e-code – either because the cause is not
known or because the hospital emergency room did not capture the data. So, records with an
injury code – but no e-code – are also included in the analysis data set. A variable for the
principal diagnosis (DXPRINC) is defined as the first listed diagnosis in the set of provided
diagnostic codes.
The intent of the analysis is to assess the injury rate for children in child care settings, so
individuals were included if their age was less than six years. The age in years was calculated
from the date of birth and HD data, and a selection criterion of less than six was applied. The
resulting data set includes 279,089 records with a distribution by age and year of event shown in
Table 1.
Table 1
All Visits/Discharges by Year and Age
Age (yrs) 2008 2009 2010
0 9,670 9,681 9,162
1 20,932 21,751 20,208
2 19,382 20,561 19,943
3 15,618 16,287 16,456
4 13,801 13,934 13,960
5 12,375 12,773 12,595
Totals 91,778 94,987 92,324
Three-Year Total 279,089
The total number of visits/discharges does not vary significantly over the three-year period, and
the age distribution also appears consistent over the period.
Identification and Management of Multiple Visits/Admissions: The defined list of ER
visits/HDs can be used to estimate the rates of injury-related events in the child population
(number of ER visits per 100 children per year). However, the data set includes multiple events
for a subset of children. A child may have more than one injury requiring medical attention
during a time period, and the time period can be the entire three years or any one calendar year.
One injury may also result in multiple ER visits or hospitalizations for a single child. The data
set must be “de-duplicated” if one wants to estimate the risk to a given child for an injury
requiring medical attention.
A personal identifier (LONGID) is defined (by GHA) for each record and included in the data set
provided to OHIP. LONGID includes letters from the first and last names, date of birth, and sex
of the individual. If the data used to generate LONGID is collected consistently and accurately,

3
then an individual should get the same assigned LONGID for each encounter with an ER or
hospital. LONGID was used to identify children with multiple ER visits/HDs in any year (2008,
2009, and 2010) and over the three-year period. One child may have multiple visits in multiple
years or may have multiple visits over the three-year period without having two visits in any one
year. A data set restricted to individuals with multiple visits was created and is used to identify a
de-duplicated set of individuals for the three-year period or for any calendar year. Table 2a
provides the unduplicated counts for individuals with at least one ER visit/hospital discharge in a
given year between 2008 and 2010.
Table 2a
Annual Unduplicated Individuals
Age (yrs) 2008 2009 2010
0 8,817 8,898 8,397
1 18,344 19,118 17,695
2 16,902 17,904 17,420
3 13,904 14,401 14,542
4 12,363 12,409 12,422
5 11,170 11,427 11,288
Age < 6 81,500 84,157 81,764
The same individual may appear in two (or three) years, but an individual is counted only once in
any given year. For example, Child A has ER visits in 2009 and 2010 and is counted in both
years. Child A also has a second visit in 2010 but is only counted once in 2010. These counts can
be used with the corresponding population estimates (Table 2b) to estimate the proportion of
children with at least one accident-related event requiring medical attention in a hospital or ER
(Table 2c).
Table 2b Table 2c
Population Estimates (OASIS,1/28/2013) Percent of Population Requiring
Medical Attention for an Injury in a Year
Age (yrs) 2008 2009 2010 Age (yrs) 2008 2009 2010
0 142,686 134,125 133,587 0 6.2 6.6 6.3
1 143,634 143,906 135,186 1 12.8 13.3 13.1
2 139,578 139,847 140,514 2 12.1 12.8 12.4
3 137,690 137,916 141,168 3 10.1 10.4 10.3
4 136,743 136,958 137,419 4 9.0 9.1 9.0
5 132,714 134,984 139,336 5 8.4 8.5 8.1
Age < 6 833,045 827,736 827,210 Age < 6 9.8 10.2 9.9
This calculated proportion is an underestimate of the true rate of accidents requiring medical
attention since it does not include treatment at physicians’ offices, clinics, or other ambulatory
care facilities. The graph indicates a peak in injury risk for one-year-old toddlers and a decline
through age five. This age trend in utilization of services may not reflect the true injury rate.

4
Parents may be more likely to seek ER services for a younger child. With experience, parents
become more tolerant of minor cuts, scrapes, bumps, and bruises.
Injury Events by External Cause and Type of Injury: The ICD9 coding in the ER and
hospital discharge records provides information on the external cause of the injury (e-code) and
type of injury. The e-code is more useful for prevention-related analysis, but it is not always
captured in the record. The identified e-codes were recoded into a set of external cause
categories. Figure 2 presents the leading external causes (> 1,000 events) for calendar year 2010
for the child population < age six years. This graph is based on an unduplicated set of children
and does not include multiple injury events for a given child. Thus, it represents an undercount of
injury events. Only the first record for a given child in the year is included in the analysis. Nine
percent of the 81,764 events in 2010 did not have an assigned e-code.
0
2
4
6
8
10
12
14
0 1 2 3 4 5
Pe
rce
nt
Inju
red
Age in Years
Figure 1: Annual Injury Risk by Age in Years, GA, 2008-2010,
(ER Visits and Hospital Discharges)
2008
2009
2010
0.0 5.0 10.0 15.0 20.0 25.0 30.0 35.0
Fall
Struck
Insect Bite
Cut/Pierce
Poison
MV Event
Hot Substance
Crush
Dog Bite
Figure 2: Number of Events (1000s) by Cause, 2010, Ages < 6

5
Over 35% of the reported injuries were attributed to falls. The second category – and the only
other category with over 5% – was injury due to striking or being struck by an object (15%). The
nine causes listed in Figure 2 accounted for 73% of all injuries.
The ICD9 injury codes (800 through 999) are separated into 25 general categories. The following
table provides the 2010 distribution of type of injury (first injury for individuals with multiple
records). Open wounds of head, neck, and trunk are the most frequent injury, accounting for 23%
of all injuries.
Table 3: 2010 Injury Records, by Type of Injury, Ages < 6
Type of Injury Number % of Total
Rate (per 1,000)
Open Wound Of Head, Neck, And Trunk 18,770 23.0 22.7
Open Wound Of Upper Limb 2,767 3.4 3.3
Open Wound Of Lower Limb 2,067 2.5 2.5
Certain Traumatic Complications And Unspecified Injuries 10,667 13.0 12.9
Contusion With Intact Skin Surface 10,446 12.8 12.6
Superficial Injury 7,833 9.6 9.5
Effects Of Foreign Body Entering Through Orifice 5,453 6.7 6.6
Fracture Of Upper Limb 4,406 5.4 5.3
Fracture Of Lower Limb 1,347 1.6 1.6
Fracture Of Skull 534 0.7 0.6
Burns 2,618 3.2 3.2
Dislocation 2,566 3.1 3.1
Sprains And Strains Of Joints And Adjacent Muscles 2,432 3.0 2.9
Poisoning By Drugs, Medicinal And Biological Substances 2,207 2.7 2.7
Intracranial Injury, Excluding Those With Skull Fracture 1,100 1.3 1.3
Crushing Injury 319 0.4 0.4
Other And Unspecified Effects Of External Causes 2,995 3.7 3.6
Toxic Effects Of Substances Chiefly Non-medicinal As To Source 1,953 2.4 2.4
Complications Of Surgical And Medical Care 1,167 1.4 1.4
All Other 117 Total 81,764
Section 2: A Description of Reported Child (Ages 0-5 years) Injuries Occurring in Child
Care Facilities, DECAL Incident Reporting, FY2008-2012
DECAL requires that deaths and injuries requiring medical care that occur in licensed or
registered child care facilities are reported to the department. Data on these deaths and injuries
are captured in a DECAL Incident Report. The contractor serving as the principal investigator on
this current study issued a previous report that addressed deaths associated with child care
facilities. (An Assessment of the Risk of Preventable Deaths Among children in Child Care in
Georgia [2007-2009]). For this report on non-fatal injuries, DECAL staff identified and
abstracted reports on injuries requiring medical attention that occurred between June 2007 and

6
May 2012. DECAL provided the contractor, the Rollins School of Public Health at Emory
University, with an Excel file that included data for 805 incidents of injury requiring medical
attention (Table 4). The contractor, along with DECAL staff, reviewed the DECAL abstracted
narrative of the event; the classification of the external cause of injury; and the type of injury.
The contractor recoded the external cause and type of injury variables to allow comparison with
the previously described emergency room visit/hospital discharge data. A variable for site of
injury (head, arm, leg, etc.) was added to the database and coded, if appropriate.
Table 4: DECAL Injury Incident Reports, by Report Year and Age
Age (Years) 2007 2008 2009 2010 2011 2012 Total
0 12 15 27 21 24 12 111
1 10 40 28 30 47 13 168
2 11 24 27 36 30 14 142
3 10 21 16 27 42 12 128
4 13 25 15 27 33 15 128
5 2 8 9 13 11 10 53
Ages < 6 58 133 122 154 187 76 730
Ages 6 - 12 6 14 10 15 18 4 67
Unknown Age 1 4 1 2
8
Total 65 151 133 171 205 80 805
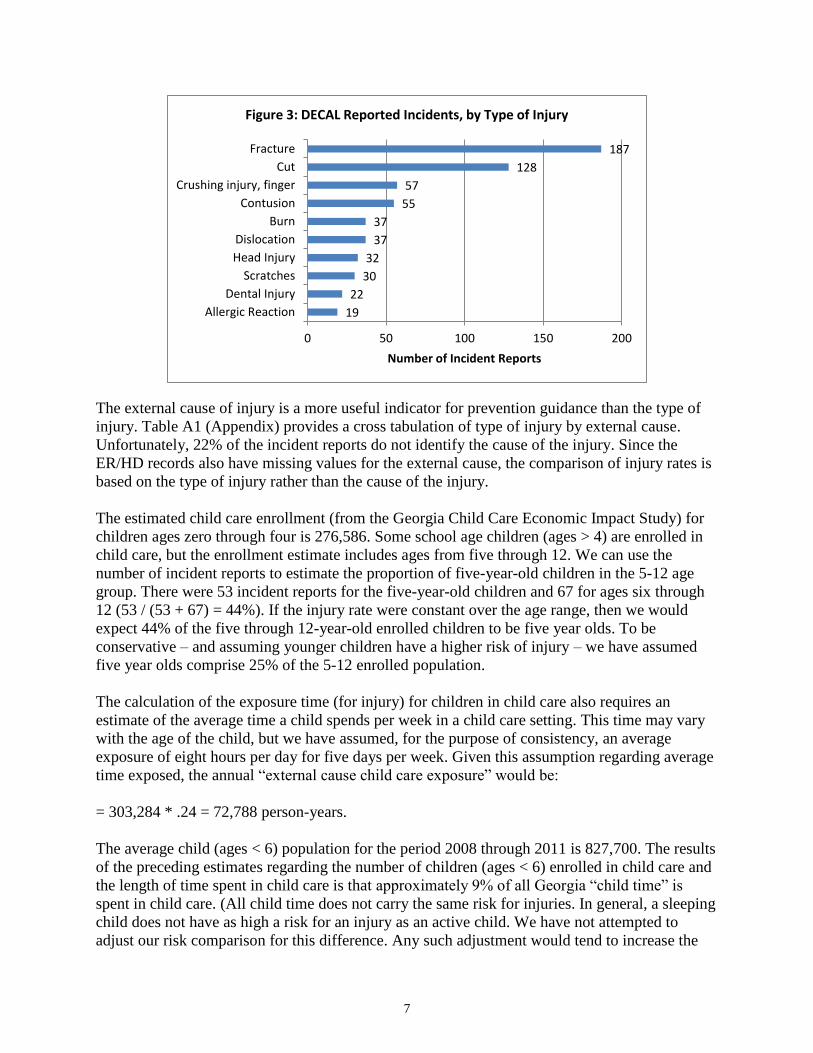
The major categories of reported incidents are presented in Figure 3. The 10 types of injury
categories include 83% of all reported incidents. Fractures are the most common injury,
comprising over 25% of all injuries. (Fractures only accounted for approximately 7% of the
ER/HD events.) Cuts were the second most common injury, accounting for 17% of all injuries.
(The categories including “open wounds” made up more than 28% of ER/HD events.)
7
The external cause of injury is a more useful indicator for prevention guidance than the type of
injury. Table A1 (Appendix) provides a cross tabulation of type of injury by external cause.
Unfortunately, 22% of the incident reports do not identify the cause of the injury. Since the
ER/HD records also have missing values for the external cause, the comparison of injury rates is
based on the type of injury rather than the cause of the injury.
The estimated child care enrollment (from the Georgia Child Care Economic Impact Study) for
children ages zero through four is 276,586. Some school age children (ages > 4) are enrolled in
child care, but the enrollment estimate includes ages from five through 12. We can use the
number of incident reports to estimate the proportion of five-year-old children in the 5-12 age
group. There were 53 incident reports for the five-year-old children and 67 for ages six through
12 (53 / (53 + 67) = 44%). If the injury rate were constant over the age range, then we would
expect 44% of the five through 12-year-old enrolled children to be five year olds. To be
conservative – and assuming younger children have a higher risk of injury – we have assumed
five year olds comprise 25% of the 5-12 enrolled population.
The calculation of the exposure time (for injury) for children in child care also requires an
estimate of the average time a child spends per week in a child care setting. This time may vary
with the age of the child, but we have assumed, for the purpose of consistency, an average
exposure of eight hours per day for five days per week. Given this assumption regarding average
time exposed, the annual “external cause child care exposure” would be:
= 303,284 * .24 = 72,788 person-years.
The average child (ages < 6) population for the period 2008 through 2011 is 827,700. The results
of the preceding estimates regarding the number of children (ages < 6) enrolled in child care and
the length of time spent in child care is that approximately 9% of all Georgia “child time” is
spent in child care. (All child time does not carry the same risk for injuries. In general, a sleeping
child does not have as high a risk for an injury as an active child. We have not attempted to
adjust our risk comparison for this difference. Any such adjustment would tend to increase the
19
22
30
32
37
37
55
57
128
187
0 50 100 150 200
Allergic Reaction
Dental Injury
Scratches
Head Injury
Dislocation
Burn
Contusion
Crushing injury, finger
Cut
Fracture
Number of Incident Reports
Figure 3: DECAL Reported Incidents, by Type of Injury

8
risk for the non-child care population since child care time is less likely to include sleeping
time.)
The ER and HD data identify more than 80,000 infants and children with an injury related event
each year from 2008 through 2010. If children in child care had the same risk for injury as the
general child population, then approximately 7,200 of those 80,000 events should occur in a
child care facility. However, only 730 incident reports occurred in the five-year period – 126
injuries per year. All injuries are not the same – in either severity or cause, and Table 5 provides
risk estimates for specific injuries occurring in child care facilities. The classification of injuries
in the DECAL data is based on interpretation of the narrative provided in the incident report and
is not as accurate or consistent as the ER/HD data. For example, “cuts,” other than arm or leg,
are included as the comparison for “Open Wound of Head, Neck, and Trunk.” The Rate Ratio is
the ER/HD rate divided by the DECAL rate and indicates that children in the general population
are at least 10 times more likely to seek medical attention for an injury than children in child care
facilities. This analysis implies that children are safer in a child care facility than they are in
other situations – at home, with a relative, with a baby sitter, etc.**
Table 5: Comparison of DECAL Incident Report Rates (Five-year Average)
with ER/HD Rates (2010), Selected Injuries, Ages < 6
ER/HD Reports DECAL Reports
Type of Injury Number % of Total
Rate (per
1,000)
Number % of Total
Rate (per
1,000) Rate Ratio
Open Wound Of Head, Neck, And Trunk 18,770 23.0 22.7 108 14.8 0.297 76.5
Fracture Of Upper Limb 4,406 5.4 5.3 136 18.6 0.374 14.3
Fracture Of Lower Limb 1,347 1.6 1.6 58 7.9 0.159 10.2
Fracture Of Skull 534 0.7 0.6 12 1.6 0.033 19.6
Dislocation 2,566 3.1 3.1 37 5.1 0.102 30.5
Burns 2,618 3.2 3.2 37 5.1 0.102 31.1
All Injuries 81,764
98.8 730
2.01 49.3
** We assume that injuries in child care facilities are underreported. The reporting system includes only
licensed or registered programs (no unlicensed facilities or individuals caring for fewer than three
children). Facilities may also choose not to submit a report due to concern over possible repercussions or
aversion to paperwork.

9
DECAL Investigation Results: The DECAL incident reports are investigated to determine if
any alleged rule violation(s) is substantiated and if any related violations are identified in the
investigation. The nature of the rule violation(s) is not captured in the abstracted data, but the
data does include Yes/No variables for “Substantiated” (referring to initial allegations) and
“Related Findings.” Figure 4 shows the percent of incidents by injury type that have a
substantiated rule violation. Approximately 54% of all reports are substantiated, but the
proportion ranges from 35% to over 90%. An additional 10% of all incidents have a related
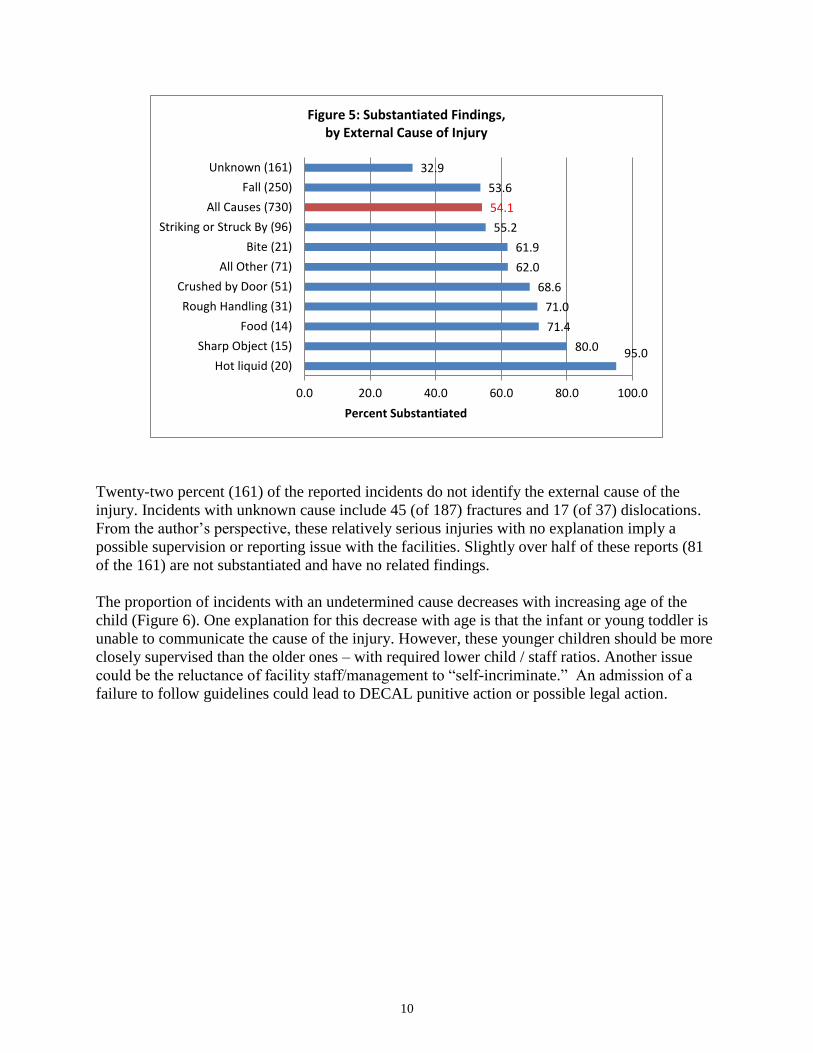
finding, although the alleged violation was not substantiated. Figure 5 provides the substantiated
findings for identified external causes.
Nineteen of the 20 burn incidents associated with hot liquids were substantiated (the 20th incident
had a related finding). Food-related incidents (allergic reactions) and rough handling had >70%
substantiated findings. Sixteen of the rough handling incidents were dislocations – usually
associated with a staff person pulling the child by the arm.
93.3
75.7
68.4
66.7
65.6
63.3
59.5
58.8
57.1
56.3
55.1
54.1
43.3
36.4
36.4
34.5
0.0 20.0 40.0 60.0 80.0 100.0
Facial injury (15)
Burn (37)
Allergic Reaction (19)
Crushing injury, finger (57)
Head Injury (32)
Scratches (30)
Dislocation (37)
Abrasion (17)
Concussion (14)
Cut (128)
All Other (69)
All Injuries (730)
Fracture (187)
Dental Injury (22)
Object in orifice (11)
Contusion (55)
Percent Substantiated
Figure 4: Substantiated Findings, by Type of Injury
10
Twenty-two percent (161) of the reported incidents do not identify the external cause of the
injury. Incidents with unknown cause include 45 (of 187) fractures and 17 (of 37) dislocations.
From the author’s perspective, these relatively serious injuries with no explanation imply a
possible supervision or reporting issue with the facilities. Slightly over half of these reports (81
of the 161) are not substantiated and have no related findings.
The proportion of incidents with an undetermined cause decreases with increasing age of the
child (Figure 6). One explanation for this decrease with age is that the infant or young toddler is
unable to communicate the cause of the injury. However, these younger children should be more
closely supervised than the older ones – with required lower child / staff ratios. Another issue
could be the reluctance of facility staff/management to “self-incriminate.” An admission of a
failure to follow guidelines could lead to DECAL punitive action or possible legal action.
95.080.0
71.4
71.0
68.6
62.0
61.9
55.2
54.1
53.6
32.9
0.0 20.0 40.0 60.0 80.0 100.0
Hot liquid (20)
Sharp Object (15)
Food (14)
Rough Handling (31)
Crushed by Door (51)
All Other (71)
Bite (21)
Striking or Struck By (96)
All Causes (730)
Fall (250)
Unknown (161)
Percent Substantiated
Figure 5: Substantiated Findings,by External Cause of Injury

11
Comments/Observations/Ongoing Analysis: The DECAL incident report data provides a
valuable resource for injury prevention planning. The surveillance capabilities of the incident
reporting process could be strengthened with improved reporting forms and integration with the
investigation system. As discussed, the system needs to collect information on the type of injury
and the cause of the injury. A set of categories (drop-down lists on an electronic form) for both –
with an “Other” category – would yield a more consistent and useable database. The type of rule
violation(s) associated with the injury would also be useful for cause-specific prevention.
The descriptive analysis highlights several areas that offer prevention opportunities. In general,
to explore a type of injury/cause of injury requires a review of the narrative for the set of
identified cases. For example, 28 of 70 fractures reported to have occurred on playground
equipment were associated with slides. Twenty of the 37 burn injuries were caused by hot
liquids. And 50 of 57 crushing injuries of fingers were caused by doors. All three of these
injury/cause combinations offer prevention opportunities, but the specifics will require “case
analysis” and would benefit from information on any rule violations.
Findings
In Georgia in 2010 approximately one out of every 10 children under the age of six had an
emergency room visit or hospital stay (ER/HD) related to an injury. Injuries may also have been
treated in a clinic or physician's office, but no data system existed to capture these visits. Thus
the ER/HD data underestimated the number of children injured.
DECAL incident reports capture information on injuries in child care facilities that require
medical attention. We assume some underreporting of injuries in child care facilities, but there is
no way to estimate the extent of that underreporting.
38.7
28.6
21.1
18.8
9.4
7.5
0.0
5.0
10.0
15.0
20.0
25.0
30.0
35.0
40.0
45.0
0 1 2 3 4 5
Pe
rce
nt
Figure 6: Percent of DECAL Incident Reports with Undetermined Cause of Injury, FY2008 - 2012
Age in Years

12
Ignoring the underreporting in both data systems, the comparison of injury rates for the general
child population with rates for the child care facility population yields the following
observations:
1. A child (age < 6) in the general population is about 50 times more likely to sustain an
injury requiring medical services than a child in a child care facility.
2. The injury risks vary by type of injury, but any specific injury is at least 10 times more
likely in the general child population than in the child care population.
3. The age distributions for fractures are similar in the two populations. This suggests that
the child care population could be representative of the general population.
Data Sources and Associated Limitations: The population-based analysis uses the Georgia
ER/HD data to identify injuries to infants and children from birth through five years of age.
Injuries treated in a clinic or physician’s office are not included, since no statewide data system
captures outpatient services. Thus the estimated child population injury rate is an underestimate
of the true rate. The records are unduplicated (using a unique identifier created by the database
contractor) to provide a count of individual infants/children with at least one injury-related ER
visit or hospital discharge during a calendar year. The population estimates for the target age
group are used to calculate rate estimates for the total target population.
The injury estimates for infants/children in child care facilities are developed from a DECAL-
prepared database of injury incident reports. There is no independent assessment of injuries
occurring in child care facilities, and we assume that there is underreporting of injuries by the
facilities. This would yield an underestimate of the true rate of injuries in child care facilities.
The type of injury and the external cause of the injury are manually coded using the narrative
description of the incident. The denominator for calculation of child care injury rates is obtained
from child care capacity and enrollment estimates. Children are assumed to be in child care (and
thus exposed to “child care-related injury”) for eight hours per day, five days per week. Thus
they are exposed for 40 hours of the 168 (7*24) hours in a week. A child who is awake and
active is more likely to be injured than one sleeping, and the child is more likely to be active
during child care than at night. However, we have not tried to adjust for this exposure difference
and assume that an adjustment would lower the apparent risk in child care.
Risk Comparison: Approximately one out of every 10 children will have an ER visit or hospital
stay related to an injury each year. Adjusting for the time estimated spent in child care, only one
out of 500 children in child care will require medical attention for an injury (occurring in or
recognized while in child care). The ratio of risk varies with the type of injury and cause of
injury, but time in child care appears at least 10 times safer than non-child care time.
Comparison of Child Care and General Population Injury Rates
Population Injuries** Rate (per 100)
Total Child Population, Ages < 6 (2010) 827,210 Exposure* 827,210 81,764 9.9
Estimated Child Care Enrollment, Ages < 6 303,284 Estimated Exposure* 72,788 146 0.20
13
Exposure* Measured in child-years per year
Injuries** Unduplicated count of children with at least one injury per year
Database recommendations: The cause of injury is a critical variable for any prevention
planning. The available information in the provided incident narrative was not sufficient to
identify an external cause for 22% of the incidents. (Note that “e-coding” is also a problem for
ER/HD data, but e-codes are missing for less than 10% of those records – except for 2009.) The
proportion of incidents with missing cause information is highest for infants and younger
children (pre-verbal) suggesting that a portion of the cause information comes from the injured
child. The incident investigation could improve the documentation of cause-related information,
perhaps identifying the source of the cause data and providing an explanation for the lack of
cause data.
The inclusion in the database of information on any alleged and/or substantiated rule violation(s)
would increase the usefulness of the data for prevention activities. The injury incident “data
hierarchy” starts with the type of injury (fracture), which is a result of an external cause (fall
from a slide). A rule violation (inadequate supervision) is one component of the circumstances
which led to the fall. The better the description of those circumstances, the better the potential for
prevention planning and action.
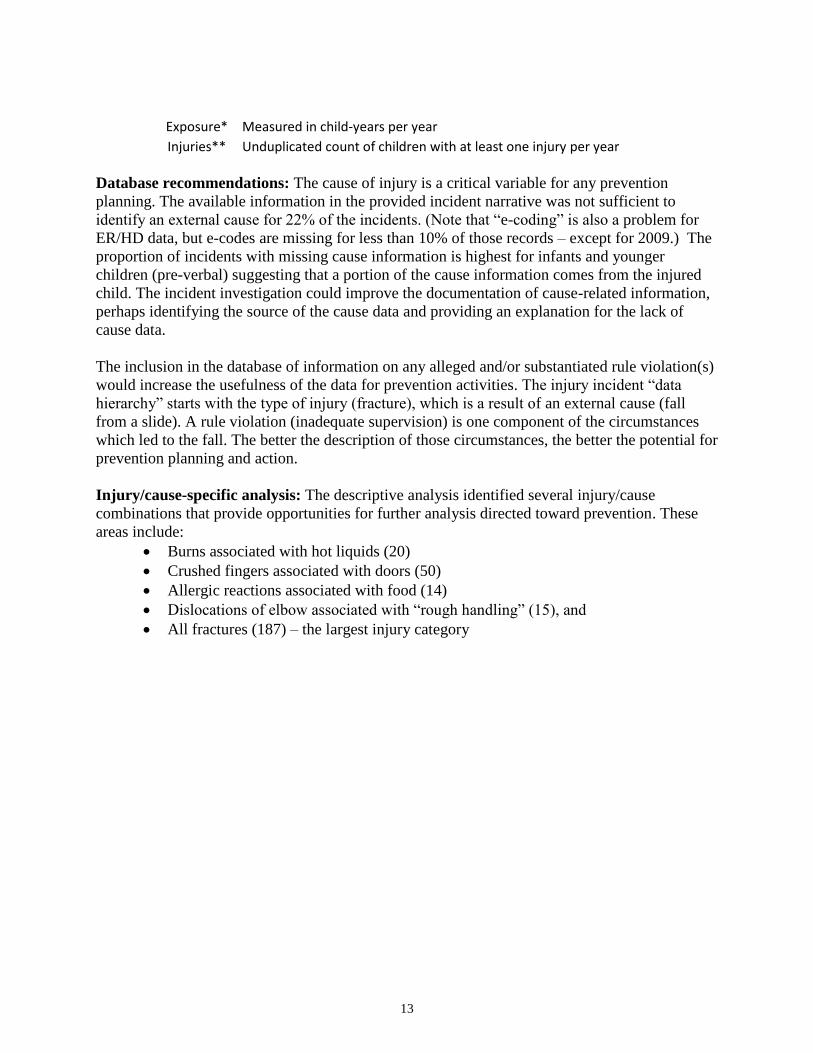
Injury/cause-specific analysis: The descriptive analysis identified several injury/cause
combinations that provide opportunities for further analysis directed toward prevention. These
areas include:
Burns associated with hot liquids (20)
Crushed fingers associated with doors (50)
Allergic reactions associated with food (14)
Dislocations of elbow associated with “rough handling” (15), and
All fractures (187) – the largest injury category

14
Type of Injury Fall
Striking or
Struck By
Crushed by
Door
Rough
Handling Bite
Hot
liquid
Sharp
Object Food
All
Other Unknown Total
Fracture 111 17 4 10 45 187
Cut 65 36 15 3 9 128
Crushing injury, finger 5 50 1 1 57
Contusion 7 10 7 2 2 27 55
Burn 20 8 9 37
Dislocation 4 16 0 17 37
Head Injury 20 4 8 32
Scratches 1 5 1 17 2 4 30
Dental Injury 9 10 3 22
Allergic Reaction 14 3 2 19
Abrasion 6 1 2 2 3 3 17
Facial injury 8 3 4 15
Concussion 11 3 14
Object in orifice 11 11
Not Specified 5 4 9
All Other 8 2 1 1 23 25 60
Total 250 96 51 31 21 20 15 14 71 161 730
Table A1. Type of Injury by External Cause, Ages < 6
(DECAL Incident Reports, FY2008 - 2012)

15
Attachment 1: Crushing Injuries of the Fingers (including thumbs)
The DECAL incident reports identified 60 injuries to fingers of children under age six during the
five-year period. Fifty-one of those injuries were associated with doors – fingers pinched in
hinges, caught between the door and the door jamb, or caught under the door. The resulting
injuries ranged from bruising to amputation. (Figure A1) (Note: Amputations include loss of
fingertip, severing nail, or partial amputation.) The remaining nine injuries included three
severed nails and four fractures, and five of the injuries were caused when the child’s hand was
struck by some object.
The ER/HD data identifies crushing injuries with the E918 ICD9 code (caught accidentally in or
between objects). The injury codes include fractures, open wounds, traumatic amputation and
crushing injuries. Figure A2 presents the injuries reported in 2010 in the ER/HD reports.
Soft Tissue (9)18%
Open Wound (8)
16%
Fracture (19)37%
Amputation (15)29%
Figure A1: Door-Associated Finger Injuries, Ages 0 - 5,in GA Child care Facilities, FY 2008 - 2012
Soft Tissue (152)20%
Open Wound (361)49%
Fracture (167)23%
Amputation (62)8%
Figure A2: Crushing Injuries of the Fingers,ER/HD Data, Ages 0 - 5, GA, CY 2010

16
The ER/HD data does not provide for identifying door-associated injuries, and the distribution of
type of injury is different in the two (DECAL and ER/HD) reporting systems. The distribution
difference may be associated with classification of type of injury or medical care seeking
behavior of child care staff versus parents/other caregivers. Child care staff may be better trained
and accustomed to handling minor cuts or other injuries for which an untrained or inexperienced
parent may seek medical care. An amputation is traumatic to all involved, but the issue of case
definition makes a comparison between the two data systems challenging. However, a fracture is
less ambiguous and yet severe enough to likely lead to medical attention.
The DECAL incident reports identified 19 finger fractures due to being crushed in doors and
four additional fractures. These 23 fractures occurred over a five-year period, for an average
annual number of less than five. The ER/HD records included 381 reported finger fractures (in
CY2010), with 167 attributed to crushing.
ER/HD Reports DECAL Reports
Finger Fractures Number
Rate (per 10,000) Number
Rate (per 10,000)
Rate Ratio
Crushing Injury 167
2.0 19
0.5 3.9
Other Injury 214
4
All Injury Causes 381
4.6 23
0.6 7.3
Any finger fracture is approximately seven times more likely to occur in a non-child care setting
than in a licensed or registered facility. (The risk ratio is approximately four for an identified
crushing injury.)
Attachment 2: Fractures
Fractures comprise the largest category of reported injuries in child care facilities. One hundred
and eighty-seven incidents of fractures requiring medical attention were reported over the five-
year period from June 2007 through May 2012. (An additional 23 fractures associated with
finger crushing incidents were addressed in Attachment 1.) The available enrollment data does
not include single age data, so age-specific rates cannot be calculated.
However, there are some apparent age/site trends:
Eleven of the 12 reported skull fractures occurred in infants. No cause was reported for
seven of the 11 infant skull fractures; one fracture resulted from a fall from a changing
table; one infant was dropped; and two (seven and nine months of age) were reported as
falling. The dropped infant and the fall from the changing table resulted in substantiated
findings.

17
Forty-four of the 57 reported leg fractures (77%) occurred in infants/toddlers less than
three years of age. Sixteen of the 23 broken legs for infants and one-year-old toddlers had
unknown cause, but only three of the remaining 34 reports had unknown cause. Twenty-
nine of the 38 incidents with known cause were reported as resulting from a fall.
In contrast to leg fractures, arm fractures are more common in three- and four-year-old
children. Only one-third (36 out of 107) of reported arm fractures were for
infants/toddlers less than three years of age. No cause was reported for 13 of the 36, and
falls involving playground equipment were cited for nine of the breaks. Playground
equipment is a major factor for injuries resulting in broken arms for three- and four-year-
old children. It was identified in 30 of the 58 incidents, and slides were cited in 18 of the
30.
Reported Fractures in Child care Facilities,
Ages < 5 Years, by Age and Injury Site
Age (Years)
Injury Site 0 1 2 3 4 5 Total
Arm 8 13 15 29 28 14 107
Leg 10 14 21 9 2 2 58
Skull 11
1
12
Finger 2 8 6 4 4 0 24
"Finger" includes 23 Crushing injuries (19 by door)
Substantiation findings appear associated with injury site and age of child. Incidents involving
arm fractures and younger children are more likely (than leg fractures and older children) to have
substantiated rule violations.
% with Substantiated Findings
Fracture Site
Age (yrs) Arm Leg
0 - 2 65.2 41.4
3 - 5 44.1 27.3
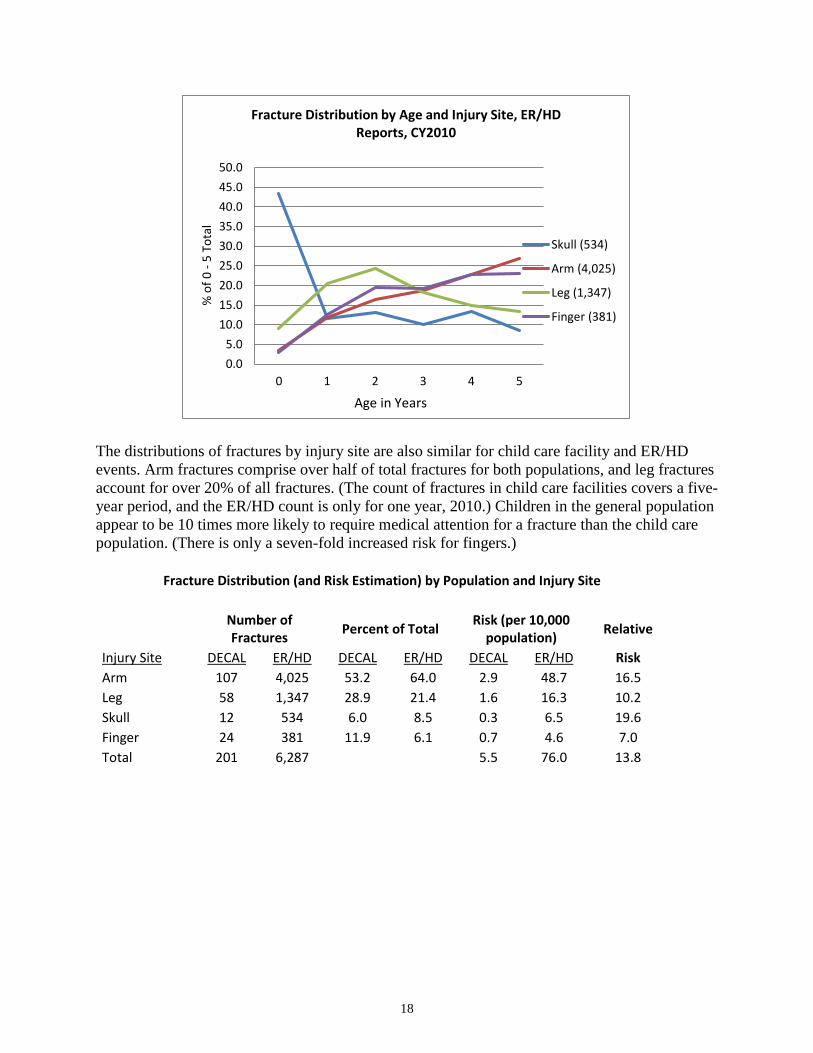
The ER/HD data show similar age patterns (see Figure). Forty-three percent of the skull fractures
for ages less than age six occur in infants. The broken legs increase to a peak at two years of age
and then steadily decline, and broken arms continuously increase from infants through five years
of age.
18
The distributions of fractures by injury site are also similar for child care facility and ER/HD
events. Arm fractures comprise over half of total fractures for both populations, and leg fractures
account for over 20% of all fractures. (The count of fractures in child care facilities covers a five-
year period, and the ER/HD count is only for one year, 2010.) Children in the general population
appear to be 10 times more likely to require medical attention for a fracture than the child care
population. (There is only a seven-fold increased risk for fingers.)
Fracture Distribution (and Risk Estimation) by Population and Injury Site
Number of Fractures
Percent of Total Risk (per 10,000
population) Relative
Injury Site DECAL ER/HD DECAL ER/HD DECAL ER/HD Risk
Arm 107 4,025 53.2 64.0 2.9 48.7 16.5
Leg 58 1,347 28.9 21.4 1.6 16.3 10.2
Skull 12 534 6.0 8.5 0.3 6.5 19.6
Finger 24 381 11.9 6.1 0.7 4.6 7.0
Total 201 6,287
5.5 76.0 13.8
0.0
5.0
10.0
15.0
20.0
25.0
30.0
35.0
40.0
45.0
50.0
0 1 2 3 4 5
% o
f 0
-5
To
tal
Fracture Distribution by Age and Injury Site, ER/HD Reports, CY2010
Skull (534)
Arm (4,025)
Leg (1,347)
Finger (381)
Age in Years

19
Attachment 3: Cuts
The most frequently reported injury category in the ER/HD data is “Open Wound of Head, Neck,
and Trunk” (HNT). This category includes ICD9 codes 870.0 through 879.9. There were 18,770
children in 2010 who received services in Georgia ERs or hospitals for such injuries. Over 90%
of all HNT wounds for the 0-5 age group involved the head, and 62% were reported as open
wounds of the face. Approximately 50% of were attributed to falls, and an additional 30% were
reported as caused by striking or being struck by an object.
Facial Wounds (Cuts) by Cause of Injury, Children Less Than Age Six in GA, 2010
Cause of Injury
Fall Struck Unknown/
Unspecified All
Other Total
Open wound of head, neck, trunk (HNT) 9,373 5,586 1,447 2,364 18,770
Other open wound of the head (ICD9, 873**) 8,765 5,174 1,247 1,985 17,171
Open wound of the face (ICD9, 873.4*) 5,989 3,592 815 1,323 11,719
Distribution by Cause All head, neck, trunk 49.9 29.8 7.7 12.6
Head only 51.0 30.1 7.3 11.6 Face only 51.1 30.7 7.0 11.3
Facial wounds as % of all HNT 31.9 19.1 4.3 7.0 Facial wounds as % of cause-specific HNT 63.9 64.3 56.3 56.0 62.4
Wounds of the upper (arms, hands) and lower (legs, feet) limbs contribute 2,767 and 2,067
injuries, respectively.
One hundred twenty-eight incidents resulting in cuts were reported in child care facilities during
the five-year period. Cuts of the head (57) were slightly more common than facial cuts (45), and
together they account for 80% of all cuts. (Open wounds of the face and head account for 73% of
the ER/HD reported open wounds.) The distribution of head and facial cuts (in child care
facilities) by cause is similar to the distribution reported for ER/HD visits. Fifty-eight of the 102
head/face cuts (57%) were attributed to falls, and 32 (31%) were caused by striking or being
struck by an object. These proportions are similar to the fall and struck proportions for the
ER/HD data. The investigations of the head/face cuts resulted in substantiated rule violations for
half of both fall and struck-caused incidents.
20
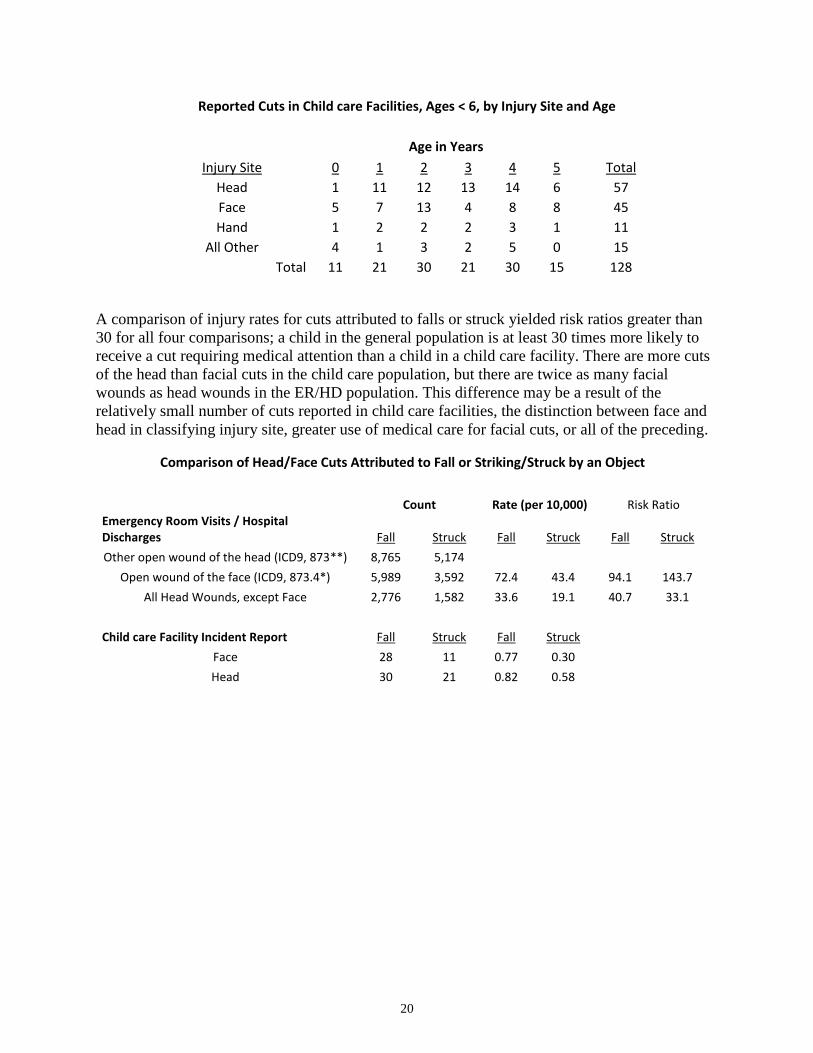
Reported Cuts in Child care Facilities, Ages < 6, by Injury Site and Age
Age in Years
Injury Site 0 1 2 3 4 5 Total
Head 1 11 12 13 14 6 57
Face 5 7 13 4 8 8 45
Hand 1 2 2 2 3 1 11
All Other 4 1 3 2 5 0 15
Total 11 21 30 21 30 15 128
A comparison of injury rates for cuts attributed to falls or struck yielded risk ratios greater than
30 for all four comparisons; a child in the general population is at least 30 times more likely to
receive a cut requiring medical attention than a child in a child care facility. There are more cuts
of the head than facial cuts in the child care population, but there are twice as many facial
wounds as head wounds in the ER/HD population. This difference may be a result of the
relatively small number of cuts reported in child care facilities, the distinction between face and
head in classifying injury site, greater use of medical care for facial cuts, or all of the preceding.
Comparison of Head/Face Cuts Attributed to Fall or Striking/Struck by an Object
Count Rate (per 10,000) Risk Ratio
Emergency Room Visits / Hospital Discharges Fall Struck Fall Struck Fall Struck
Other open wound of the head (ICD9, 873**) 8,765 5,174 Open wound of the face (ICD9, 873.4*) 5,989 3,592 72.4 43.4 94.1 143.7
All Head Wounds, except Face 2,776 1,582 33.6 19.1 40.7 33.1
Child care Facility Incident Report Fall Struck Fall Struck Face 28 11 0.77 0.30 Head 30 21 0.82 0.58

21
Attachment 4: Dislocations
On average, there are about seven DECAL incident reports each year for a dislocation. Thirty-
one of the 37 reports over the five-year period are for an elbow dislocation – commonly referred
to as nursemaid elbow.
“Nursemaid elbow is a common injury among preschool-aged children. In fact, review articles
cite it as the most common orthopedic injury in children under 2 years of age. Nursemaid elbow
refers to a condition (medically called radial head subluxation) in which the normal anatomical
alignment of two of the three bones which form the elbow joint is disrupted. Girls are more
commonly affected than boys; the left arm is more often injured than the right. This is thought to
be secondary to the likelihood of the parent being right-handed (and thus most frequently pulling
their child's left hand). The injury can occur innocently from swinging a young child by the arms
or pulling a child's arm while in a hurry.” (emedicinehealth.com)
Over 2,500 elbow dislocations were treated in a Georgia ER or hospital in 2010, and other
dislocations added only 45 records (< 2%). Elbow dislocations are not as dominant a site for the
child care facility data, but they account for 84% of all reported dislocations. The age
distributions in the two populations are also similar: 71% of the ER/HD dislocations are for one-
and two-year-old toddlers as opposed to 68% for those occurring in child care settings.
ER/HD Dislocation Principal Diagnosis, 2010, Age < 6
Age in Years
0 1 2 3 4 5 Total
Shoulder 1 4 2 1
1 9
Elbow 181 925 872 367 120 56 2,521
All Other 2 6 7 9 5 7 36
DECAL Incident Reports, Dislocations, Age < 6, FY08-12
Age in Years
0 1 2 3 4 5 Total
Elbow 2 9 12 4 4 0 31
Shoulder 1 1 2 1 0 0 5
Thumb 0 0 1 0 0 0 1
Twenty of the 37 dislocations in child care settings had a reported cause of the injury. Sixteen
were attributed to careless or rough handling, and 11 of those 16 had a substantiated rule
violation. An additional four were fall-related, and three of those were substantiated. Eight of the
17 incidents with undetermined cause had a substantiated rule violation. The estimated elbow
dislocation rate in the general population was approximately 35 times higher than the child care
facility rate.

22
Attachment 5: Burns
Although most injuries to young children are – at least theoretically – preventable, burns usually
involve modifiable factors in the child’s environment. Twenty of the 37 burn incidents reported
in child care facilities were associated with hot liquids (and 19 of the 20 had a substantiated rule
violation). Several of these incidents involved infants pulling on electrical cords attached to
containers with hot liquids. These incidents offer two prevention opportunities: keep containers
with hot liquids out of an infant’s space, and block access to electrical cords.
The distribution of reported incidents in a child care setting by cause of the burn does not match
the distribution of ER/HD visits. The ICD9 E924.8 code is an “Other” category and includes hot
objects, but it appears that burns attributed to contact with hot surfaces are much less frequent in
child care facilities than burns caused by hot liquids. A young child in the total population is 13
times more likely than a child in child care to suffer a burn due to hot liquids.
Number and Rate Comparison for Burn Incidents, DECAL and ER/HD Data, Children Ages 0 - 5
Cause of Burn DECAL ER/HD ICD9 Code (for ER/HD)
Hot Liquids 20 621 E924.0
Hot Surfaces 6 1,191 E924.8
Other 2 715 Various
Unknown 9 91 Missing
Total 37 2,618
Rate (per 10,000), Hot Liquids 0.55 7.51 Risk Ratio
13.7
The age distributions for burns associated with hot liquids are similar in the two populations.
Nine out of 20 (45%) of the hot liquid burns in child care were toddlers one year of age, and 236
of 621 (38%) of the corresponding ER/HD burns were one year olds.
Other Activities: The de-duplication of records within the three-year ER/HD database was a
necessary project-related activity for the injury analysis. The resulting database was used to
prepare an analysis data set for the thesis research described in the following abstract. The
DECAL support was cited.

23
Attachment 6
INJURY IDENTIFICATION FOR A GEORGIA BIRTH COHORT:
RETROSPECTIVE ANALYSIS OF EMERGENCY ROOM VISITS AND HOSPITAL
DISCHARGES FOR CHILDREN AGE 0-3
By Kathryn Distelhorst
Injury is one of the most under-recognized public health problems facing the Unites States health
system. The prevention of child injuries deserves increased attention given the vulnerability and
dependency of this age group. This study presents a retrospective cohort analysis of early
childhood unintentional injury presenting to an emergency room setting for treatment. The
dataset is constructed from deterministic record linkage of emergency room and hospital
discharge records for a three-year period (2008-2010) to the 2007 Georgia birth cohort
(n=154,025). Records were de-duplicated and linked using a unique identifier, which included
sex, date of birth, and portions of first and last names. The analysis dataset included injury
records for the first emergency room encounter per child over the three-year period. The data
was restricted to children age 0-3. Of 42,539 records for children age 0-3 presenting with an
injury diagnosis from 2008-2010, 32,927 (77%) linked to a Georgia Birth Record in 2007. A
total of 8,451 children had multiple emergency room discharge records. The risk of unintentional
injury requiring emergency room or hospital care was 21.4%. Males had 19% higher risk of
injury than did females of the same age (95%CI: 1.17, 1.21, p<0.0001). Open wound of head,
neck, and trunk was most common injury category (n=7,122, 21.6%) for this age group.
Maternal age at birth was the strongest independent risk factor for childhood unintentional injury
before the age of four. Risk of childhood injury decreased with increasing maternal age
(CMH=198.6, p<0.0001). After adjusting for offspring sex, maternal educational level, and
maternal first birth event, children born to mothers age 15 to 19 were 1.59 times more likely to
present with an injury at an emergency room or hospital than children born to mothers age 25 to
29 (95%CI: 1.54, 1.64). This study adds to the growing body of literature employing childhood
record linkage and argues for more focused research of childhood injury.

24
Resources
Websites with relevant data:
http://meps.ahrq.gov/mepsweb/data_files/publications/st93/stat93.shtml
Injury-related conditions total = $73.4 billion
Other conditions total = $654.9 billion
Ambulatory
Emergency
Department
Hospital
Inpatient
Home
Health
Prescribed
Medicines
Injury-related
conditions 36.9% 10.8% 36.4% 9.5% 6.4%
Other conditions 35.4% 3.0% 35.0% 4.3% 22.3%
Note: Dental care and other miscellaneous expenses are not included.
Source: Center for Financing, Access, and Cost Trends, AHRQ, Household Component of the Medical
Expenditure Panel Survey, 2002
http://www.cdc.gov/nchs/fastats/ervisits.htm
Look at all the information under “More Data.”
http://www.cdc.gov/nchs/data/ahcd/namcs_summary/2009_namcs_web_tables.pdf
Table 14 (but total does not match Table 12)
http://www.cdc.gov/nchs/ahcd/web_tables.htm#2009